Article

Characterization of Key Odorants in Lushan Yunwu Tea in Response to Intercropping with Flowering Cherry

1
Institute of Jiangxi Oil-Tea Camellia, Jiujiang University, Jiujiang 332005, China
2
Jiujiang Agricultural Technology Extension Center, Jiujiang 332000, China
3
Jiangxi Institute of Red Soil and Germplasm Resources, Nanchang 330046, China
*
Authors to whom correspondence should be addressed.
These authors contributed equally to this work.
Foods 2024, 13(8), 1252; https://doi.org/10.3390/foods13081252
Submission received: 26 March 2024 / Revised: 13 April 2024 / Accepted: 17 April 2024 / Published: 19 April 2024
(This article belongs to the Topic Advances in Analysis of Food and Beverages)

Abstract

:
Lushan Yunwu tea (LSYWT) is a famous green tea in China. However, the effects of intercropping tea with flowering cherry on the overall aroma of tea have not been well understood. In this study, headspace solid-phase microextraction (HS-SPME) coupled with gas chromatography–mass spectrometry (GC–MS) was used for analysis. A total of 54 volatile compounds from eight chemical classes were identified in tea samples from both the intercropping and pure-tea-plantation groups. Principal component analysis (PCA), orthogonal partial least-squares discriminant analysis (OPLS-DA), and odor activity value (OAV) methods combined with sensory evaluation identified cis-jasmone, nonanal, and linalool as the key aroma compounds in the intercropping group. Benzaldehyde, α-farnesene, and methyl benzene were identified as the main volatile compounds in the flowering cherry using headspace solid-phase microextraction/gas chromatography–mass spectrometry (HS-SPME/GC–MS). These findings will enrich the research on tea aroma chemistry and offer new insights into the product development and quality improvement of LSYWT.

1. Introduction

The tea plant (Camellia sinensis) is a shrub or tree distributed in tropical and subtropical regions that belongs to the genus Camellia in the Camellia family. The forests of Southwest China are the center of origin of tea plants [1]. Tea leaves are a popular source of tea. The growth and quality of tea leaves are affected by soil nutrition, environmental factors, cultivation methods, and other factors [2,3]. Traditional tea plantations have gradually encountered problems such as soil acidification, increased pest and disease pressure, and decreased yields [4,5,6]. The intercropping model of growing tea trees and other species can maximize land resource benefits, enhance the resistance of tea trees to adversity, and improve the biodiversity of tea gardens, thereby enhancing their comprehensive benefits for ecology, landscapes, and economies [7,8,9,10].
Intercropping models have been widely used in tea cultivation to improve the quality of tea. Recent studies found that many intercropping plants, including herbaceous plants, shrubs, and woody plants, can promote the growth of tea plants and improve their quality [1,11,12]. Chestnut–tea intercropping can reduce the environment and soil temperatures and increase the air and soil moisture in tea plantations [1]. Intercropping tea with soybean, corn, and rubber can also retain soil moisture and reduce surface erosion [13,14]. Soybean–tea intercropping can affect the content of available nitrogen in the soil and significantly increase the content of ammonium nitrogen [15]. Zhang et al. [16] found that volatile compounds released by interplanting Cassia tora and Leonurus artemisia in tea plantations can repel green tea leafhoppers. Chinese chestnut–tea intercropping was found to decrease the content of tea polyphenols and the bitter taste of tea and increase the content of amino acids and the freshness of green tea [1]. Soybean–tea intercropping was found to increase the content of non-ester-type catechins, total catechins, and theanine; decrease the content of ester-type catechins; and improve tea quality [17]. Recent studies showed that pea–tea intercropping can improve tea quality by regulating amino acid metabolism and flavonoid biosynthesis [12].
Studies showed that interplanting tea with other plants can promote the biosynthesis of aroma compounds, thereby improving the aroma of tea. Intercropping chestnut trees with tea increases the aroma of green tea by increasing phenylalanine-related metabolites and jasmine lactones [1]. Yang et al. [18] found that the intercropping of Prunus salicina lindl. in tea gardens improved the chestnut and floral aroma of green tea. The planting patterns of tea trees intercropped with other plants can be traced back to the Eastern Jin Dynasty in ancient China [11]. During the Song Dynasty, “Tea Garden” recorded a tea plant company with plums belonging to the Rosaceae family. In a study on companion plants in ancient, forest, and terraced tea gardens, Rosaceae was found to be one of the dominant families [11]. Flowering cherry (Cerasus sp.) belongs to the genus Prunus of the Rosaceae family. It is a famous ornamental woody plant that generally flowers in April and is cultivated worldwide [19].
Lushan Yunwu tea (LSYWT) is one of the top ten famous green teas in China, originating from Lushan Mountain, Jiangxi Province, China [20]. LSYWT has a history of more than 1800 years. As a new cultivation model, intercropping tea with flowering cherry has received little attention regarding its influence on tea aroma. In this study, 54 volatile compounds were identified using HS-SPME/GC–MS from the tea samples of the intercropping group (EG) and the pure tea tree group (CG). Through principal component analysis (PCA), orthogonal partial least-squares discriminant analysis (OPLS-DA), and odor activity value (OAV) methods, combined with sensory evaluation, we found that the EG green tea exhibited a floral aroma, while the CG did not possess a floral aroma. We also identified volatile compounds in flowering cherry using HS-SPME/GC–MS analysis and investigated the potential factors contributing to the production of key fragrance compounds, such as EG. The results of this study provided information on the aroma-active compounds in Lushan Yunwu green tea intercropped with flowering cherry. The findings of our study provide meaningful guidance for aroma quality control in Lushan Yunwu green tea.

2. Materials and Methods

2.1. Plant Materials and Growth Conditions

Fresh tea leaves from the cultivar “Population” with one leaf and one bud were collected from the Hailu Tea Expo Garden (116°3′38″ E, 29°34′114″ N) in Jiujiang, Jiangxi on 2 April 2023. The line spacing of the tea trees was 1.5 m, crowns were 70–90 cm, and plant height was 1–1.2 m. The spacing between the flowering cherry trees was 4 m, row spacing was 6 m, the crown breadth was 4–5 m, and the tree height was 4.5–5.5 m. Two sample plots were set up, one of which involved interplanting flowering cherry trees with tea trees. Tea trees within a 3 m radius of a well-growing cherry blossom tree were selected, and one bud and one leaf were randomly collected from each tea tree. The second sample comprised pure tea trees. Tea trees with good growth were selected, and one bud and leaf were randomly collected from each tea tree. LSYWT was produced using traditional processing methods, including fixing, rolling, and roasting, by an inheritor of the intangible cultural heritage of a tea master. The tea samples were stored at −40 °C until further analysis was performed.

2.2. Sensory Assessment

The tea sensory evaluation adopted a quantitative descriptive analysis (QDA) method [21]. The team members systematically evaluated the typical aroma types and descriptive vocabulary of green tea before performing a quantitative descriptive analysis. The evaluation panel consisted of four males and five females, aged 20–44 years. During the preparatory phase, the aroma attributes of the samples were discussed until all members agreed on their properties. Flowery, chestnut, tender, fresh, clear, and grass were selected as indicators for the quantitative description. The reference system was established and training was conducted according to the method of Wang et al. [22] until the members were familiar with the odor characteristics and intensity of these five aroma attributes [23].
Quantitative descriptive analysis was used to evaluate the intensity of various aroma characteristics with an intensity scale ranging from 1 to 9, where 1 represents the weakest aroma and 9 represents the strongest aroma. Tea samples (3 g) were added to 150 mL of boiling water and the tea infusion was obtained after 4 min. Subsequently, the tea soup was poured into a matching bowl and the cylindrical cup and matched bowl were randomly numbered for blind review. The evaluation panel repeated the process for each sample thrice, and the results were averaged. Sensory evaluation data collection and use were in accordance with a Jiujiang University Human Ethics application, ID Number: JJUM20240090.

2.3. Chemicals

β-Myrcene (≥90.0%) and cis-3-Hexenyl hexanoate (98%) were purchased from Macklin Biochemical Co. Ltd. (Shanghai, China). Benzylalcohol (≥99.5%), Linalool (98%), Nonanal (96%), α-Terpineol (>95.0%), Geraniol (≥99.0%), cis-Jasmone (98%), α-Farnesene (98%), and methyl palmitate (99%) were obtained from Aladdin Biochemical Co. Ltd. (Shanghai, China). Linalool oxide (pyranoid) and trans-Nerolidol were purchased from Yuanye Bio-Technology Co. Ltd. (Shanghai, China). n-Alkane mixtures of C7–C40 were supplied by Sigma-Aldrich Trading Co. Ltd. (Shanghai, China) and used to determine retention indices (RI). Ethyl decanoate was used as the internal standard and purchased from Aladdin Biochemical Co. Ltd. (Shanghai, China). Ultra-pure water was obtained using a Milli-Q purification system (Millipore, Bedford, MA, USA). Distilled water was purchased from the Hangzhou Wahaha Group Co. Ltd. (Hangzhou, China).

2.4. Extraction of Volatile Compounds from Tea Using HS-SPME

Volatile compounds were extracted using HS-SPME with a divinylbenzene/carboxen/polydimethylsiloxane coating fiber (50/30 μm; 1 cm) purchased from Supelco (Bellefonte, PA, USA) [24]. All tea samples were ground, passed through 40 mesh, and sealed for future use. Briefly, ground tea powder (1.5 g) was accurately weighed into a 20 mL headspace flask. Then, NaCl (0.5 g) was added, followed by 20 μL of ethyl decanoate (20 μg/mL) as an internal standard, and 5.25 mL of distilled water. Subsequently, the autosampler was stabilized to ensure injection stability. The flask was incubated at 70 °C for 30 min with shaking (5 s on and 2 s off). The coating fiber was then inserted into the headspace of the flask for extraction at 70 °C for 30 min. Finally, the fiber was inserted into the injector port of the gas chromatography–mass spectrometer (GC–MS) for desorption at 250 °C for 5 min, after which GC–MS separation and identification were performed [24].

2.5. Gas Chromatography–Mass Spectrometry Analysis

GC–MS was performed using a Thermo TSQ 8000 spectrometer equipped with a TriPlus RSH three-in-one automatic sampler TPR (Thermo Fisher Scientific, Waltham, MA, USA). A TG-5MS gas chromatography column with 30 m × 0.25 mm × 0.25 μm film thickness (Thermo Fisher, USA) was used for separation and high-purity helium (≥99.999%) was used as carrier gas. The constant flow rate was 1.0 mL/min, and the injector temperature was 280 °C. The mass spectrometry conditions were as follows: electron bombardment ion source (EI) temperature of 300 °C, mass interface temperature of 280 °C, and ionization voltage of 70 eV. The mass-scanning range was 33 to 550 m/z. The initial oven temperature was maintained at 40 °C for 2 min and then increased at 5 °C/min to 85 °C, where it was held for 2 min. Subsequently, the temperature was increased at a rate of 2 °C/min to 110 °C and held for 2 min, then increased at a rate of 4 °C/min to 220 °C, where it was held for 2 min, and finally increased at 5 °C/min to 250 °C and held for 10 min.

2.6. Identification and Quantitation of Volatiles

Peak identification was performed by searching the mass spectra in the National Institutes of Standards and Technology Mass Spectrometry (NIST MS) library and comparing their retention indices (RIs) with published data using the same capillary column [25]. An n-alkane standard (10 µg/mL) was injected under the same GC conditions as the external standard. The volatile compounds were preliminarily identified using the similarities between the RI results, mass spectra, and published data. The relative concentrations of the released volatiles were calculated using the following formula:
W i = A i × W s A s
Wi is the content of the target volatile concentration to be measured (μg/L), Ai is the peak area of the target volatile concentration to be measured, Ws is the concentration of the internal standard (μg/L), and As is the peak area of the internal standard in the sample.

2.7. OAV Calculation

OAVs were used to assess the contributions of volatile compounds to the aroma of tea samples [26]. OAVs were calculated using the following equation:
O A V i = C i O T i
Ci is the absolute content of volatile compounds and OTi is the odor threshold of volatile compounds in water.

2.8. Statistical Analysis

PCA and OPLS-DA were performed using SIMCA14.1 (Umetrics, Umea, Sweden). Significant differences between samples were assessed using one-way analysis of variance (ANOVA) with SPSS (version 20.0; SPSS Inc., Chicago, IL, USA). TBtools (version 2.056, accessed on 20 January 2024, https://github.com/CJ-Chen/TBtools) was used for heat mapping and hierarchical analysis. Data significance analysis was performed using the Student’s t-test and significant differences (p < 0.05) are denoted by *.

3. Results and Discussion

3.1. Aroma Characteristics of Teas in the Intercropping Group (EG) and Pure Tea Tree Group (CG)

Aroma is an important indicator for evaluating tea quality [27]. In this study, we found differences between the aroma profiles of EG and CG green tea using sensory descriptive analysis. As shown in the radar plot in Figure 1, the “flowery” aroma of EG green tea was significantly enhanced (p < 0.01), whereas the “fresh and clear” aroma was significantly weakened (p < 0.01); the “grass”, “chestnut”, and “tender” aromas were not significantly different (p > 0.05).

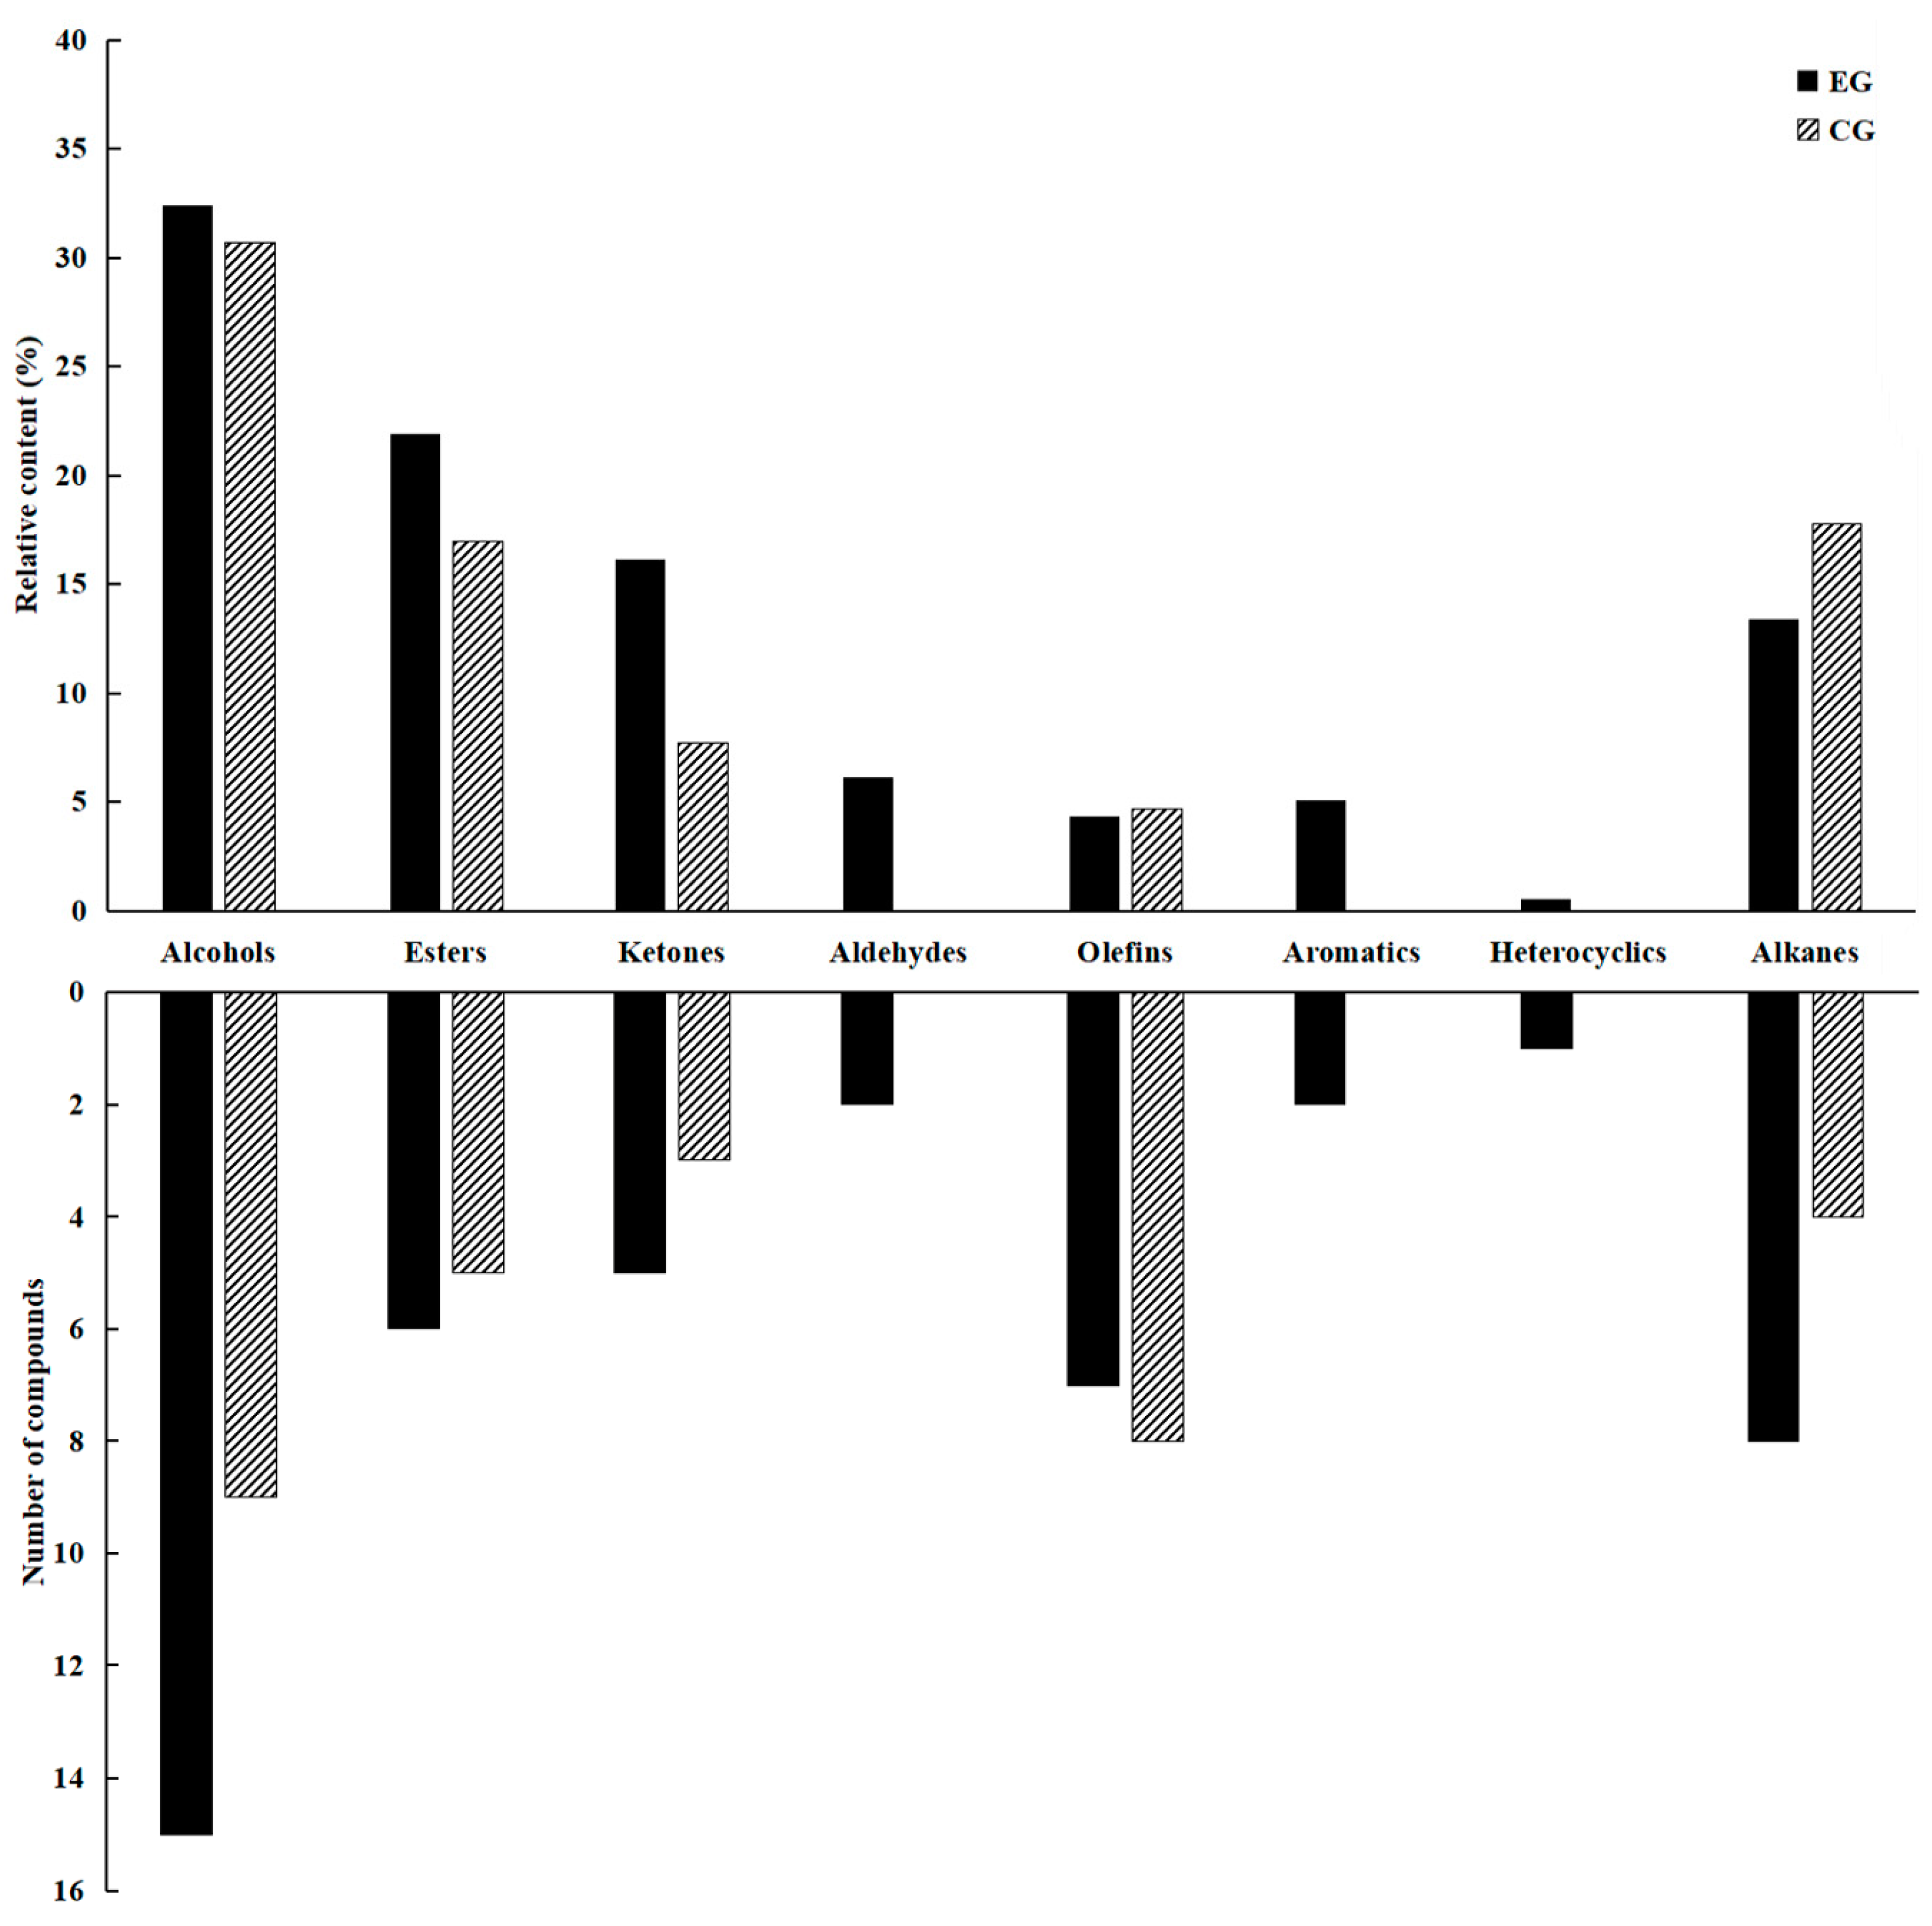
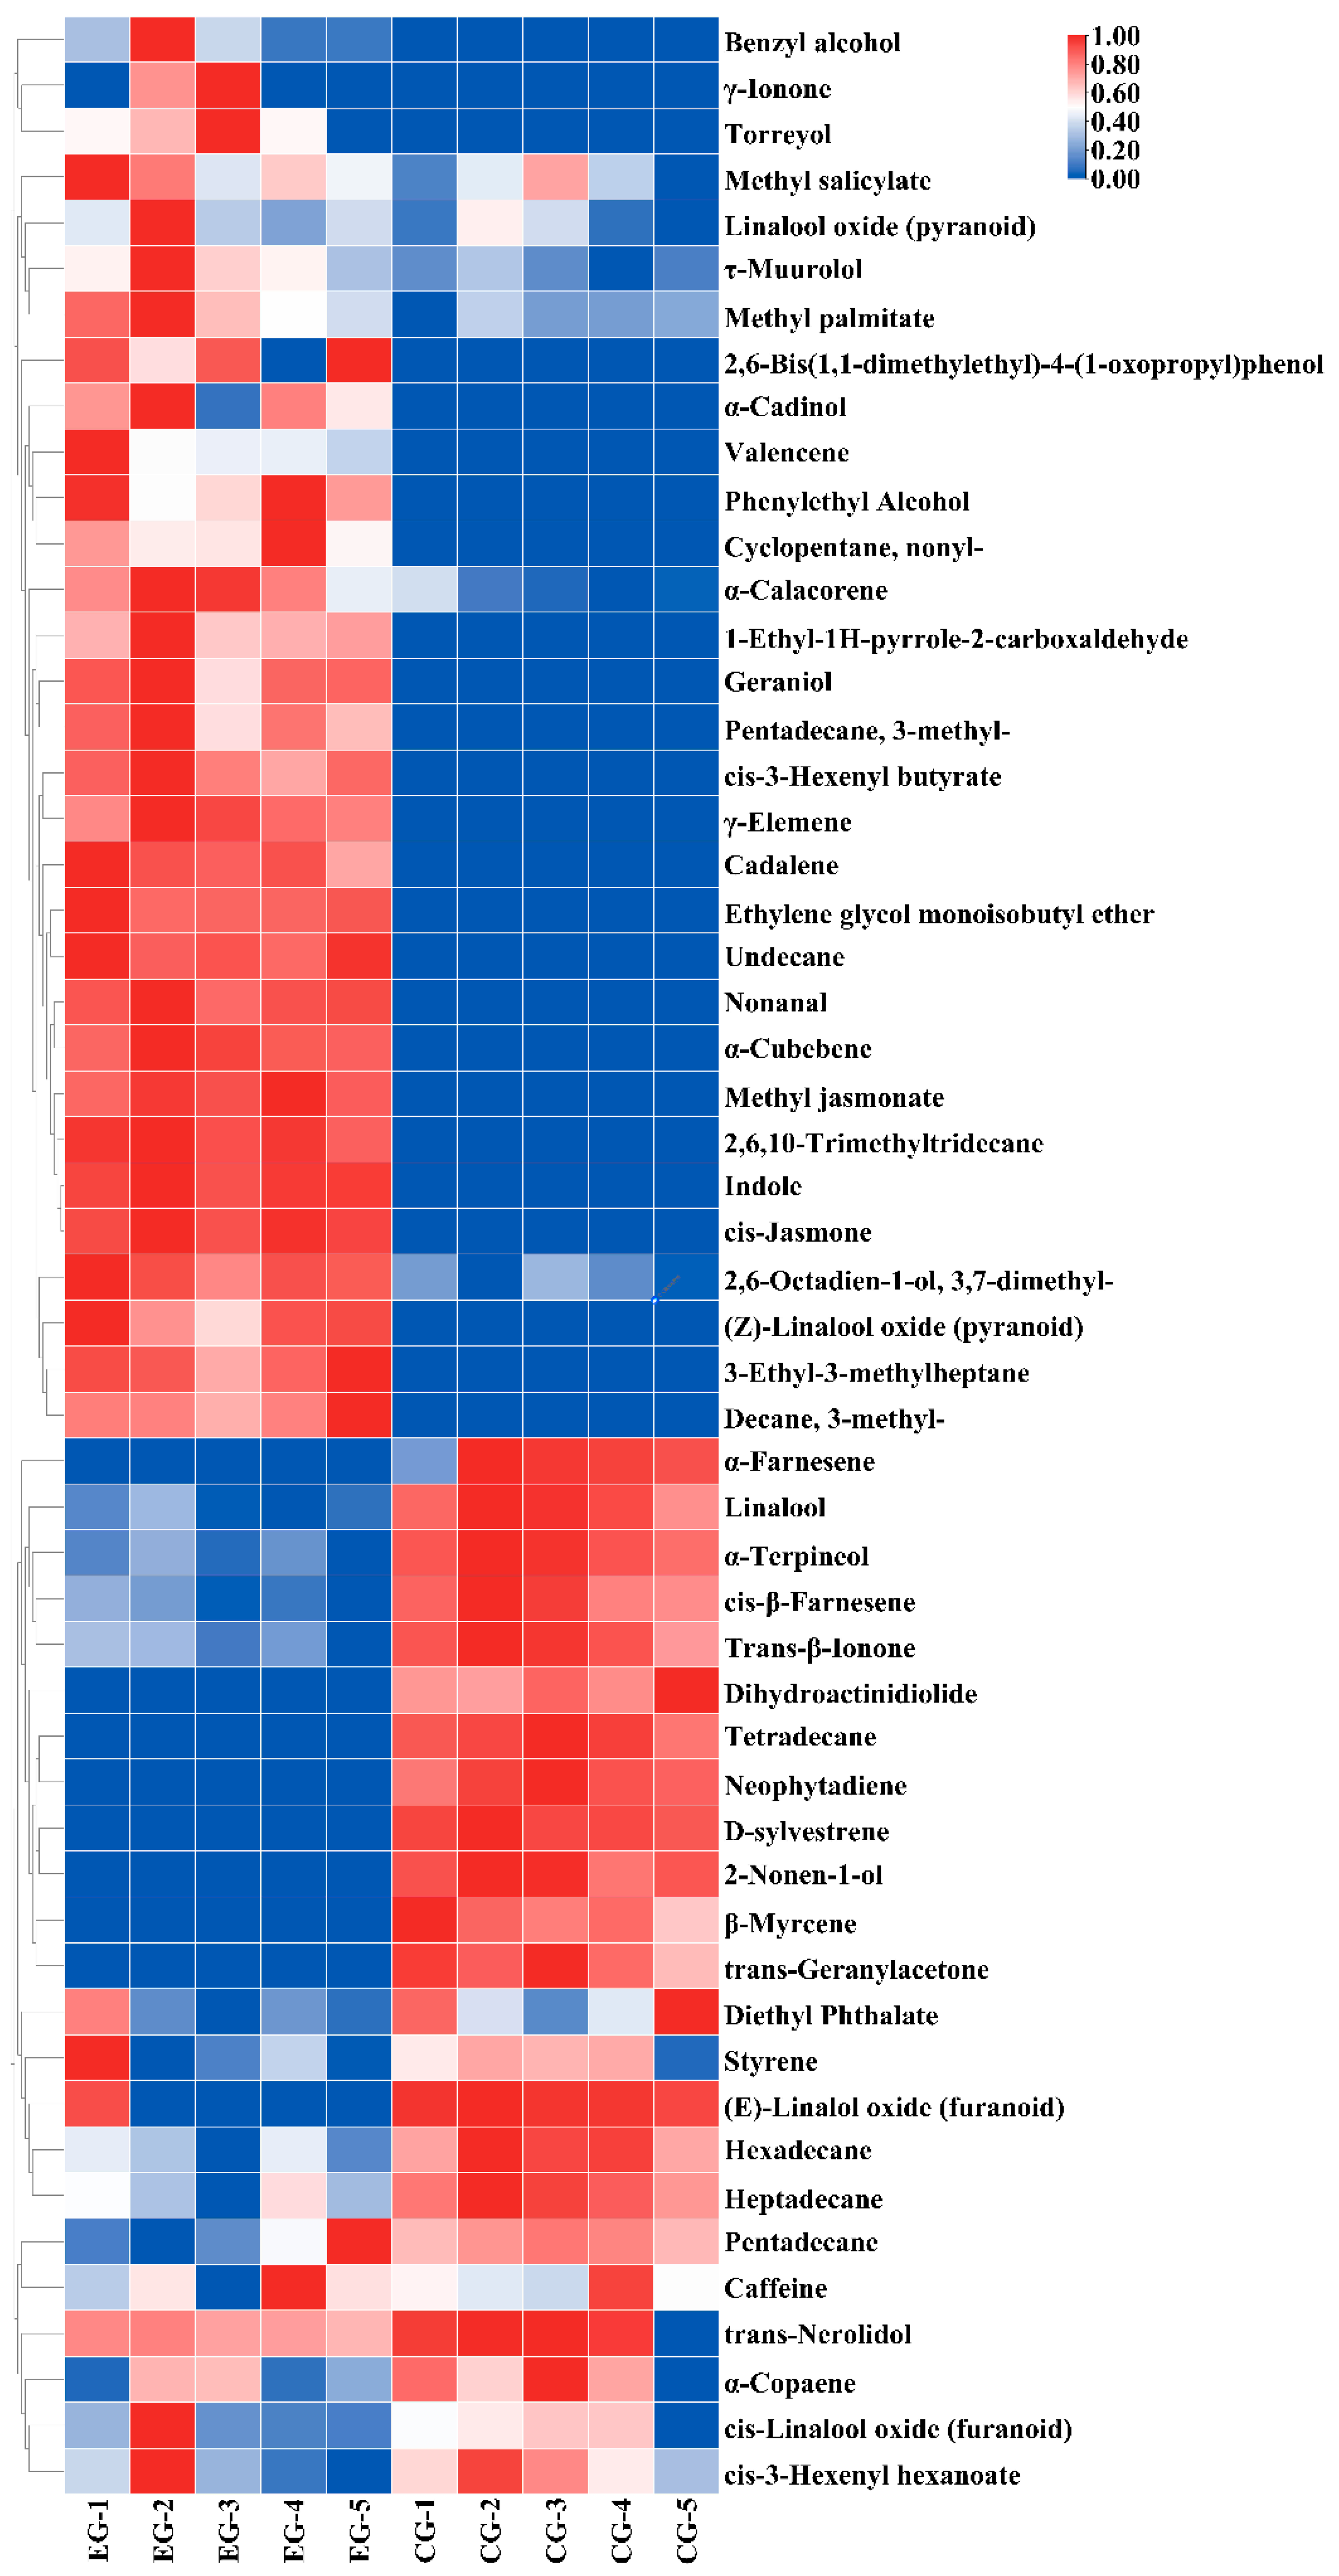
3.2. Identification and Quantification of Volatile Compounds in EG and CG Green Tea

To further explore why the floral aromas of the EG tea samples were more prominent than those of the CG samples, HS-SPME and GC–MS were used to analyze the volatile compounds in the EG and CG green teas grown under the two different cultivation modes, and 54 volatile compounds were identified (Table 1). Among them, 46 and 29 volatiles were identified in EG and CG green tea, respectively. Based on their chemical structures, these volatile compounds were divided into eight different chemical classes: 16 alcohols, 7 esters, 6 ketones, 2 aldehydes, 11 olefins, 2 aromatics, 1 heterocycle, and 9 hydrocarbons. To further analyze the volatile components of EG and CG green tea, we analyzed the percentage contents of 54 volatile components in EG and CG green tea (Figure 2). VIP values of the 54 volatile components are shown in Figure S1. The primary volatile components in EG and CG green tea were alcohols and esters, which accounted for 32.41% and 21.90% of the total volatile content in EG green tea, and 30.70% and 16.97% in CG green tea, respectively. Additionally, the hydrocarbon content in EG green tea (13.42%) was lower than that in CG green tea (17.77%). The ketone, aldehyde, and aromatic contents in EG green tea (16.14%, 6.15%, 5.08%) were higher than those in CG green tea (7.69%, 0.00%, and 0.00%, respectively). The main volatile compounds in EG green tea were cis-3-hexenylhexanoate (60.12 μg/L), cis-jasmone (46.04 μg/L), methyl salicylate (39.71 μg/L), linalool oxide (pyranoid) (36.42 μg/L), linalool (34.58 μg/L), and nonanal (30.45 μg/L). The main volatile compounds in CG green tea were linalool (76.47 μg/L), cis-3-hexenylhexanoate (67.93 μg/L), trans-nerolidol (48.91 μg/L), pentadecane (41.71 μg/L), hexadecane (34.84 μg/L), and tetradecane (32.81 μg/L).
The aroma is an important factor in evaluating the quality of tea, and the formation of the overall aroma of tea is crucial to the type and content level of volatile compounds. In this study, there were 46 types of volatile compounds in EG green tea and 29 types in CG green tea. The difference in volatile components between the EG and CG green teas may be one of the reasons why EG green tea presents a floral scent, whereas CG green tea does not. Among these volatile compounds, cis-jasmone, methyl salicylate, and nonanal had the highest content levels in EG green tea. As reported in the existing literature, these compounds are components of floral and fruit odors. The differences in the proportions and content levels of volatile compounds may be one of the reasons why the experimental group’s tea was floral in odor, whereas the control group was not. Xu et al. [28] found significant differences in the varieties and proportions of volatile compounds (alcohols, aldehydes, esters, terpenes, alkenes, and ketones) in different cultivation environments, which is consistent with the results of this experiment.

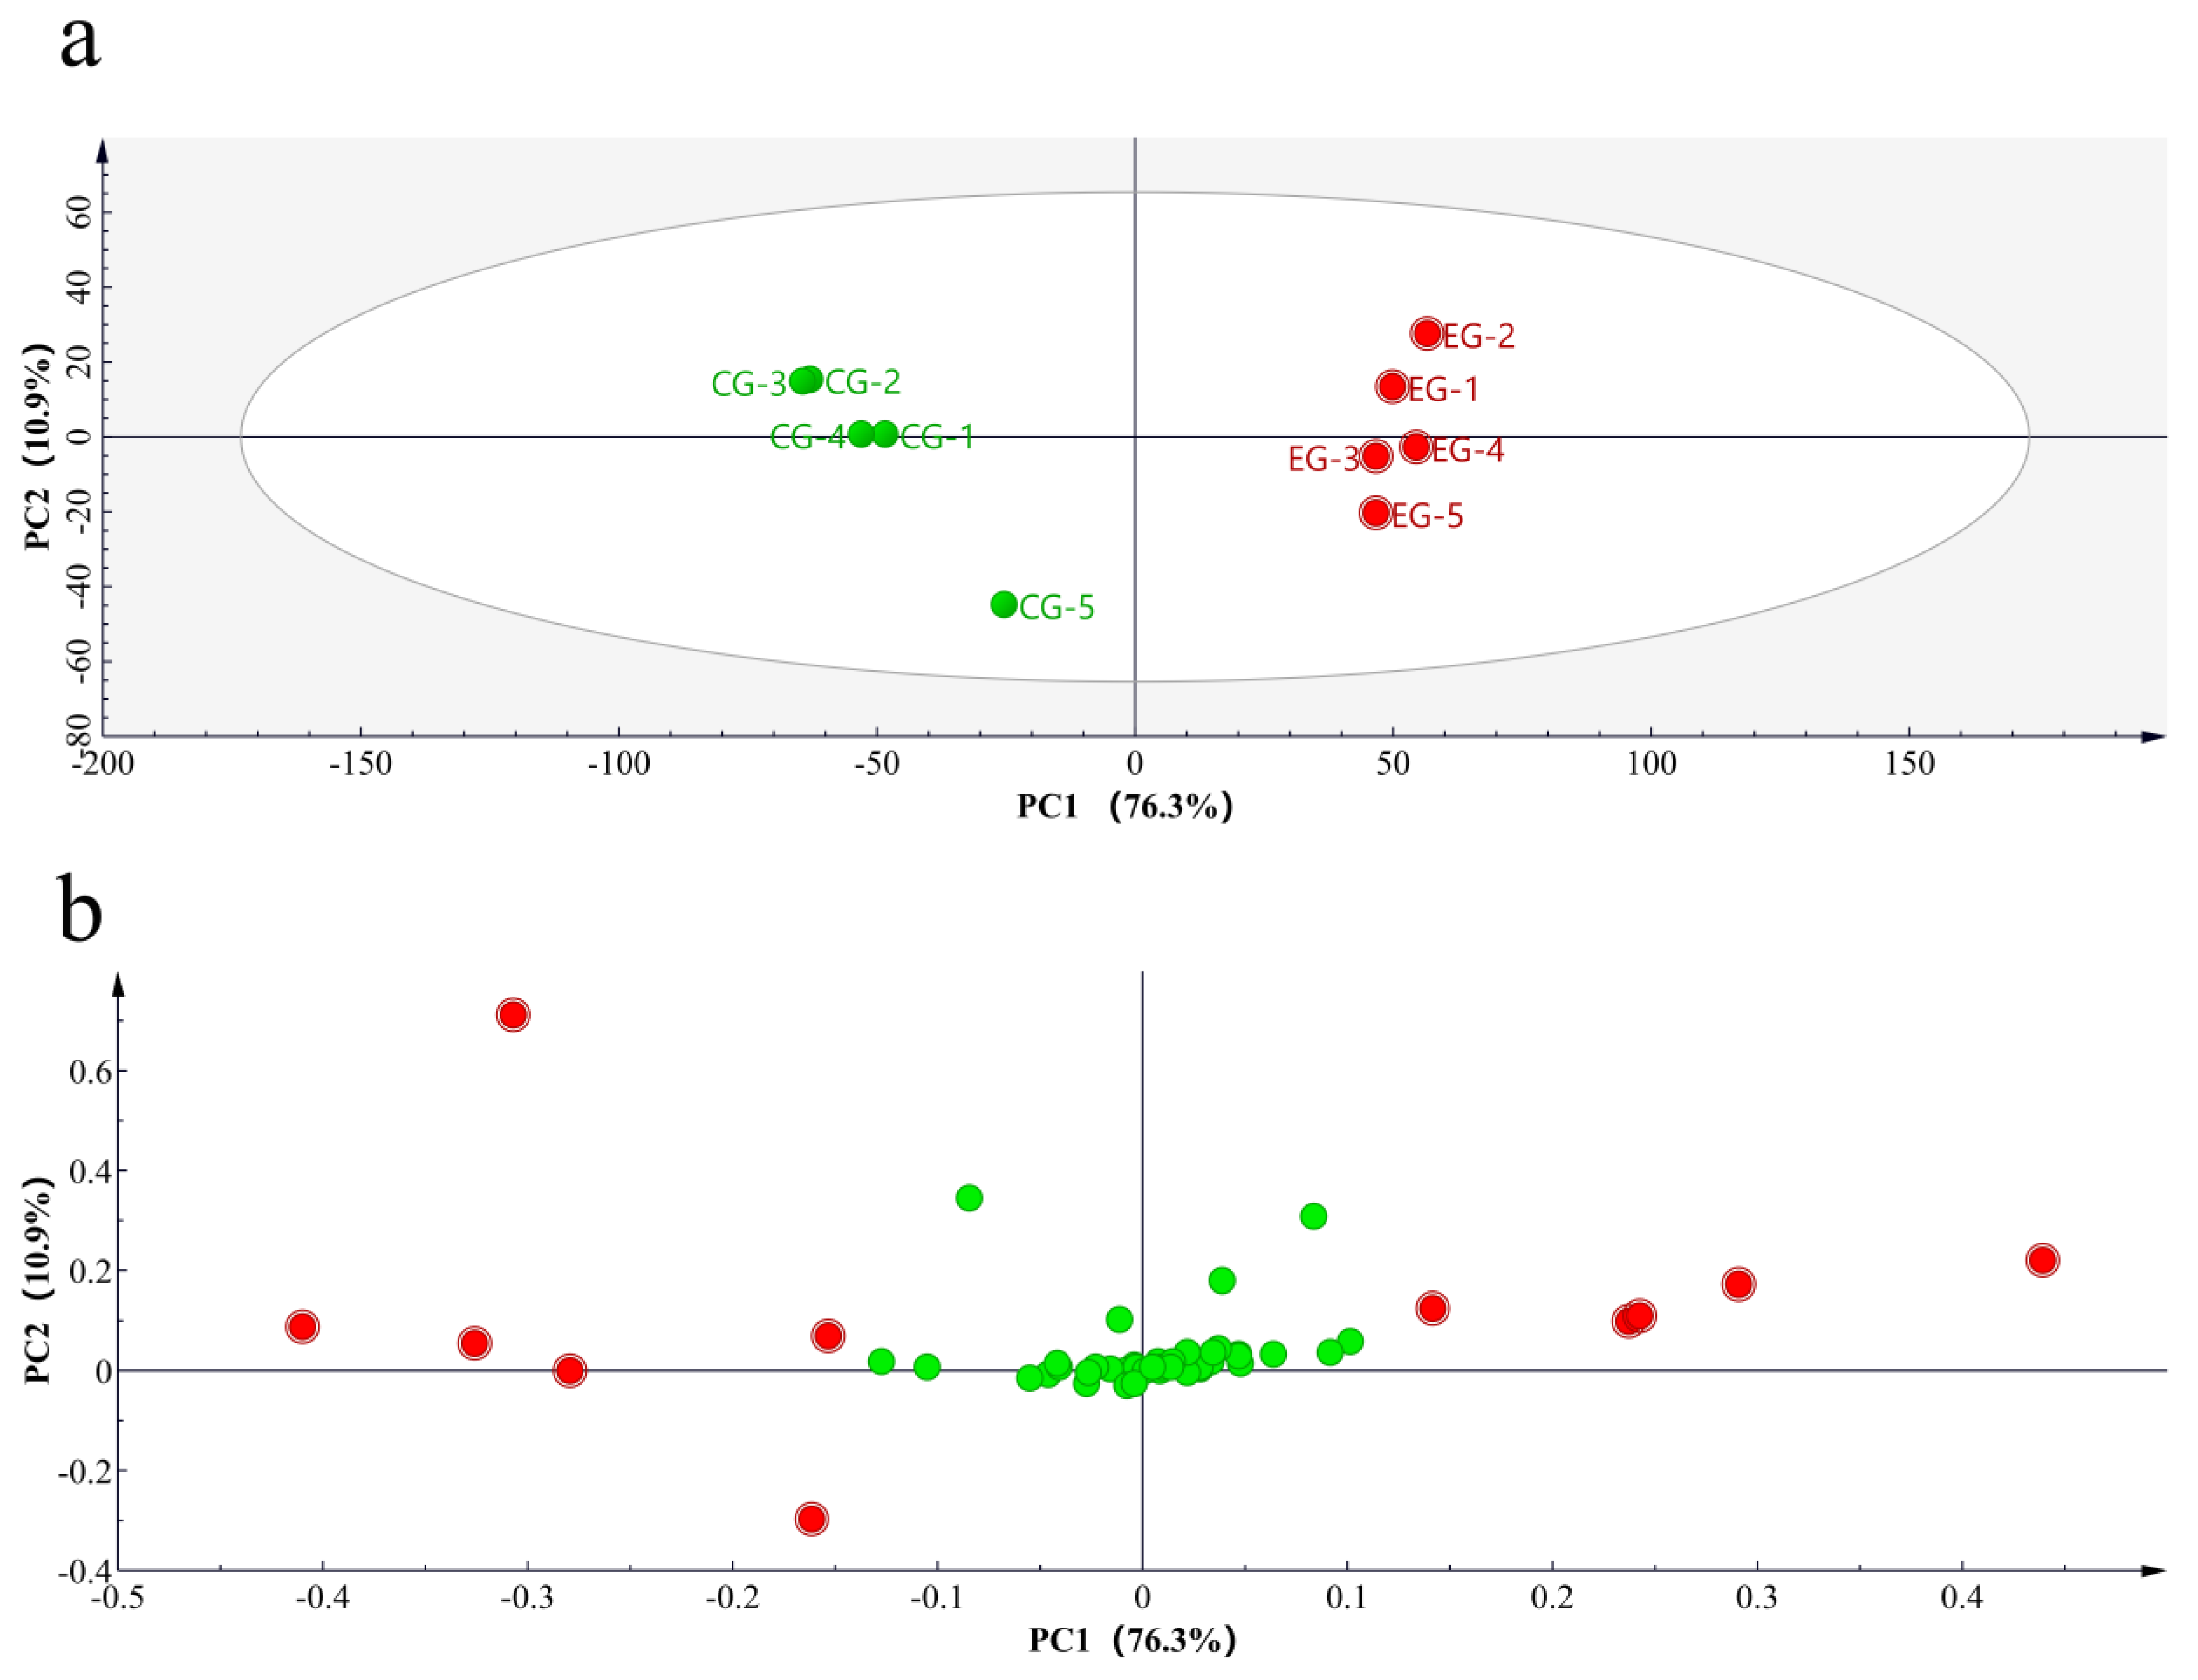
3.3. Key Volatile Component Analysis in EG

Figure 3 shows a heat map of the 54 volatile compounds, and PCA was performed based on the quantitative results of the aroma components. Principal components PC1 and PC2 individually accounted for 76.3% and 10.9% of the total variance (Figure 4). PCA showed a clear separation between the different groups, and the results were consistent with those of heat map cluster analysis. To further reveal the influences of cherry blossoms on key aroma compounds in tea, OPLS-DA was performed on EG and CG green tea in this study (Figure 5). The fitting index of the independent variable was R2X = 0.862, that of the dependent variable was R2Y = 0.99, and that of the prediction was Q2 = 0.969, indicating that the model had a good cumulative explanatory degree, predictive ability, and stability. Nine key volatile compounds were screened using the OPLS-DA model (VIP > 1, p < 0.05): cis-jasmone, linalool, indole, geraniol, ethylene glycol monoisobutyl ether, tetradecane, nonanal, 2-nonen-1-ol, and hexadecane.
Cis-jasmone is one of the characteristic aromas of green tea [29] and one of the main components of the plant’s direct and indirect stress-resistance mechanisms [30]. Indole in tea is produced from tryptophan, which presents a floral aroma at low concentrations and enhances the overall aroma of green tea within a certain concentration range, thus contributing to the chestnut aroma of green tea [31,32]. Geraniol and linalool are released from geranyl pyrophosphate precursors by geraniol synthase and linalool synthase, respectively, and linalool is further oxidized to form dehydrolinalool and various other linalool oxides [33]. Linalool has floral and citrus fruit aromas, whereas geraniol has a rose aroma [33]. Liu et al. [31] showed that geraniol is an important source of floral aroma. Han et al. [34] found that geraniol, linalool, cis-jasmone, and indol are the key aroma compounds in green tea, which is in agreement with the findings of this study. Nonanal is the key aroma compound in green tea and it is positively correlated with the floral aroma intensity of tea [35,36].

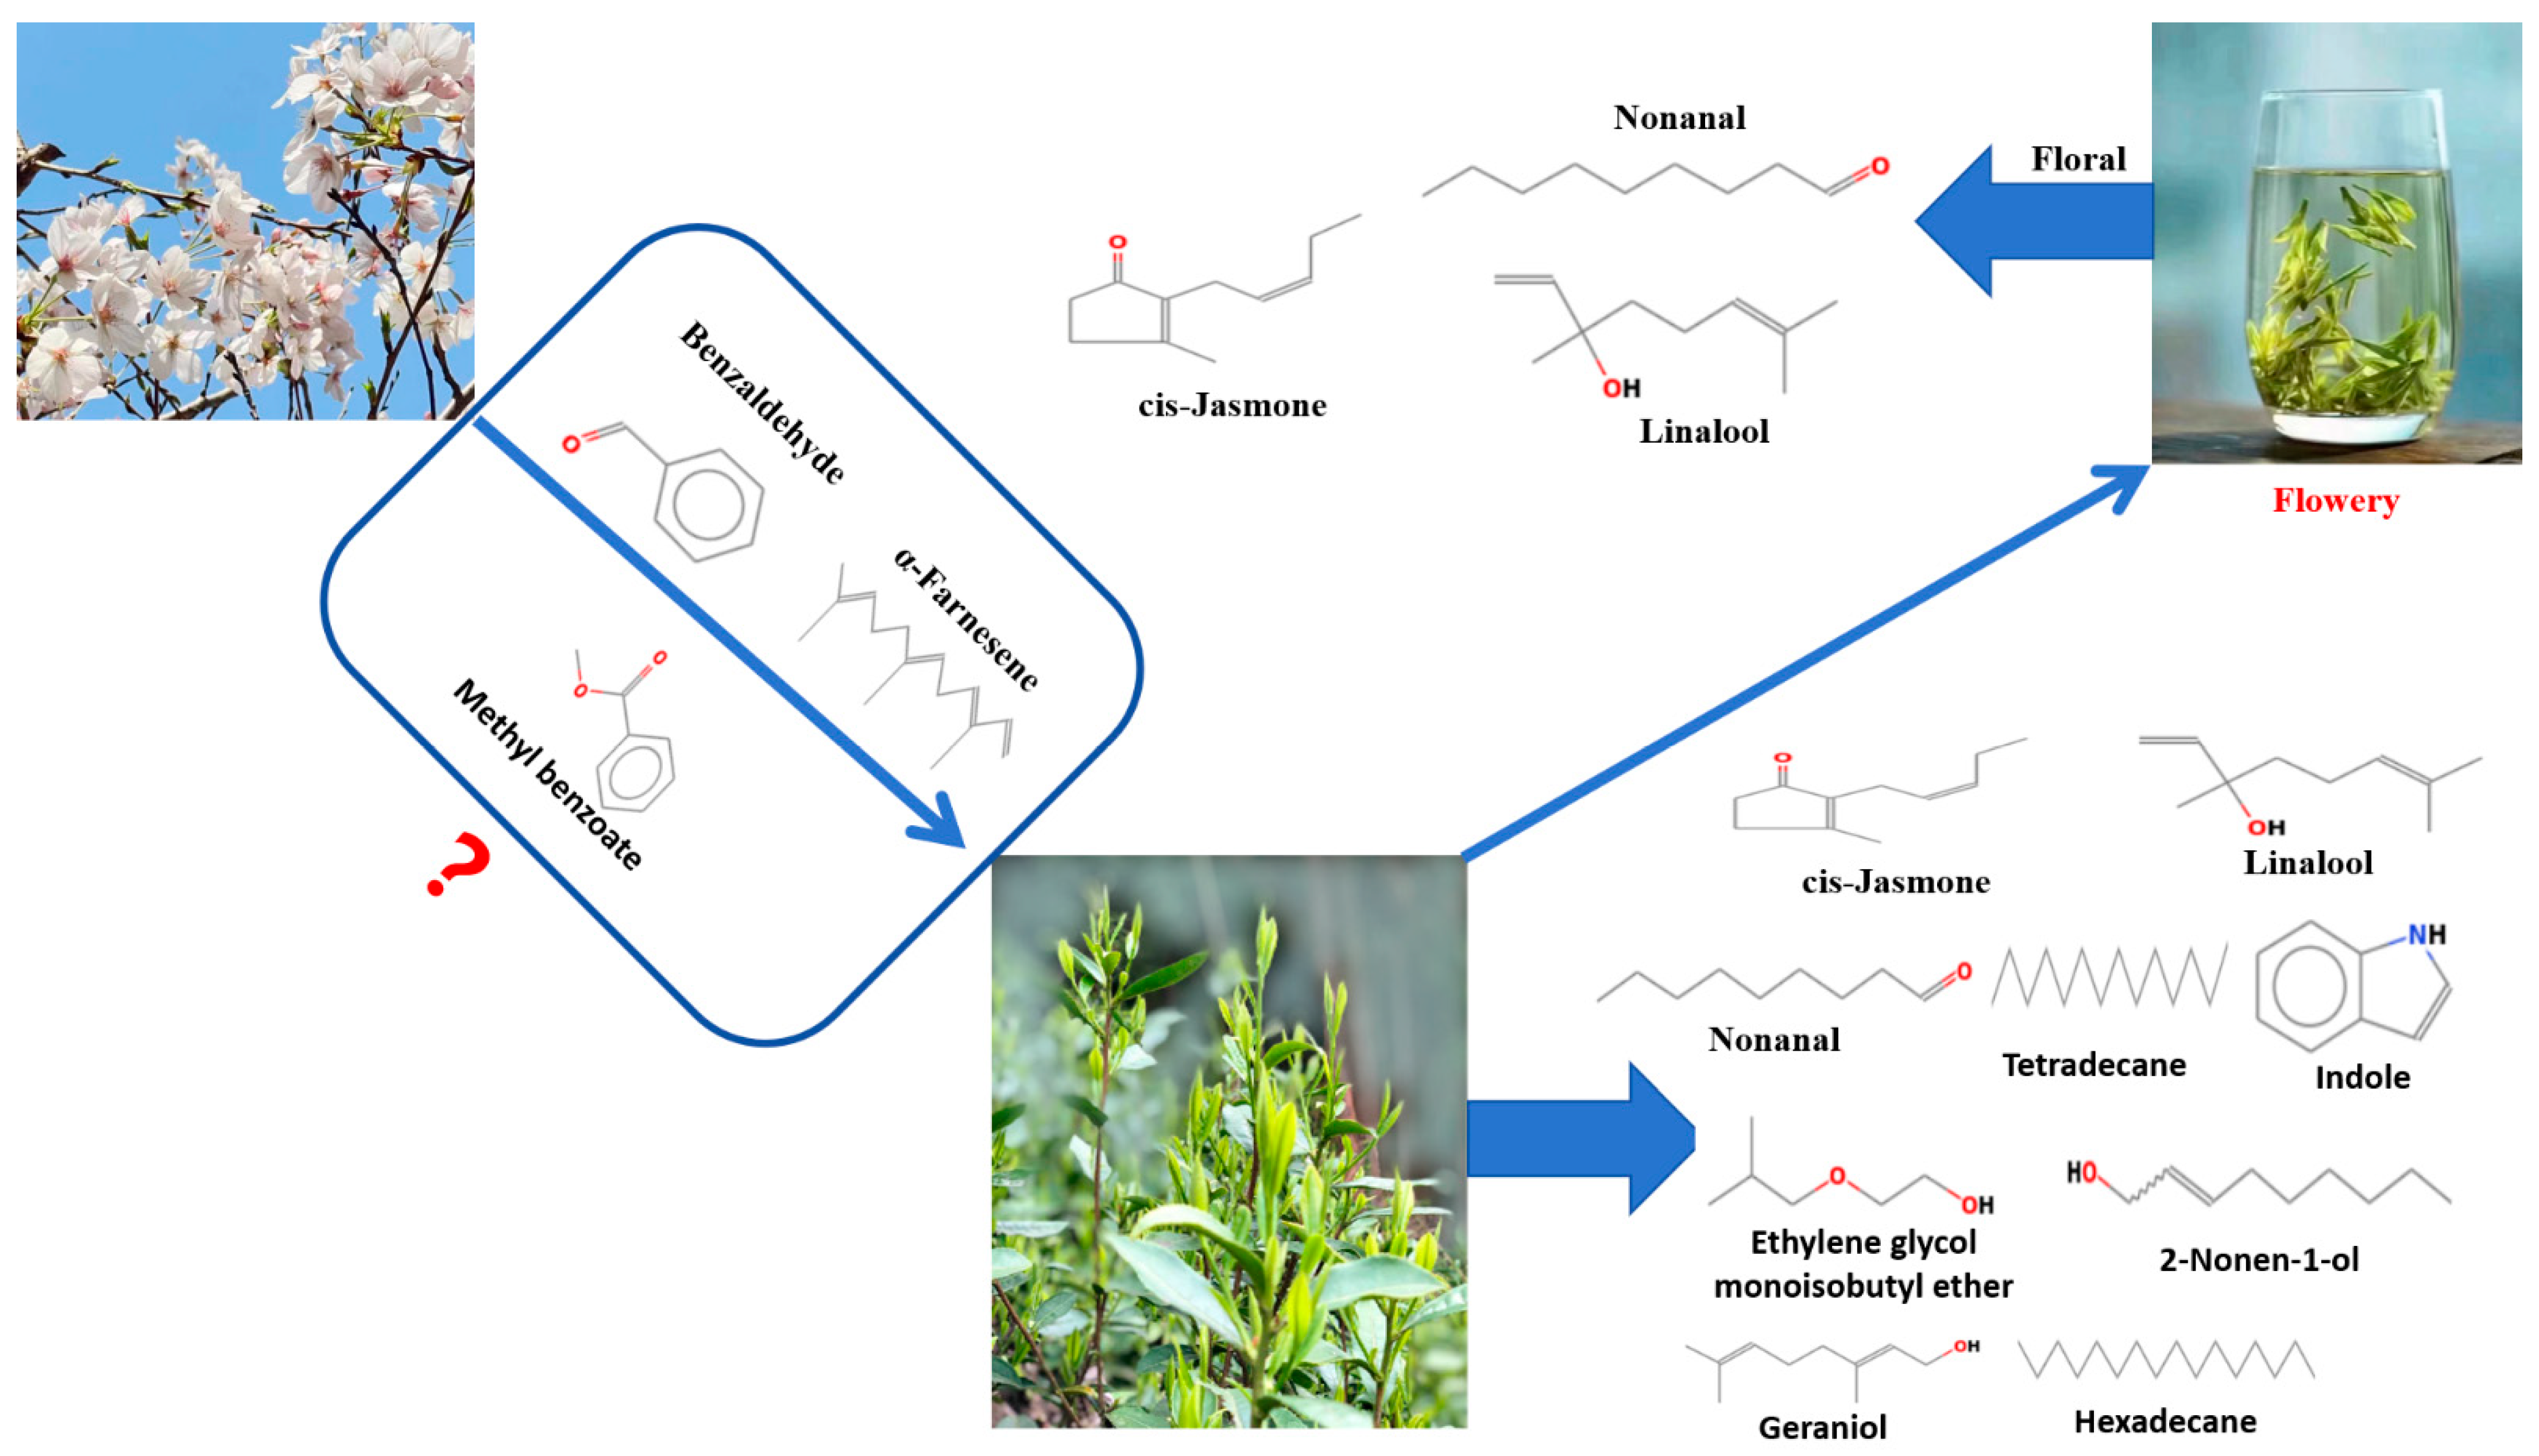
3.4. Key Aroma Compounds Identified by OAV in the EG Group

The OAV for each compound was calculated in order to assess the contribution of the volatiles to the overall aroma. Based on these nine key volatile compounds, three key aroma compounds, cis-jasmone, nonanal, and linalool, were identified (OVA > 1) (Table 2). Among these compounds, two showed OAVs > 10, indicating their substantial contributions to the overall aroma profile of EG green tea. Cis-jasmone had the highest OAV (177.07), followed by nonanal (OAV = 30.45). Cis-jasmone and nonanal were aroma compounds unique to EG. Cis-jasmone and nonanal may have contributed to the floral appearance of the EG.
Table 2. Aroma compounds with OAVs identified in EG and CG green tea samples.
OdorantsOdor DescriptionVIPOT (μg/L)OAV
cis-Jasmone *Flowery3.190.26177.07
Linalool *Floral, lavender2.8862.17
Tetradecane *Alkane2.2910,0000.0032
Nonanal *Sweet Orange aroma2.12130.45
2-Nonen-1-ol *-1.98--
Indole *Floral, animal-like1.76400.63
Ethylene glycol monoisobutyl ether *-1.72--
Hexadecane *Alkane1.0813,000,0000
Geraniol *Rose1.05400.37
OT—odor threshold in water based on the literature [37,38]; OAV—odor activity value; VIP—variable importance in projection. Data significance analysis was performed using Student’s t-test, and a significant difference (p < 0.05) is denoted by *.
Nine key aromatic compounds were identified using the OPLS-DA model (VIP > 1, p < 0.05), and the contents of these nine compounds were significantly different between the EG and CG teas. Recent studies showed that high concentrations of compounds do not necessarily produce a strong aroma. Tea typically contains hundreds of volatile compounds; however, not all volatile components play a significant role in its aroma quality [26,30,39,40]. Wang et al. [26] showed that only a few compounds determined the overall aroma quality of tea, and when some key compounds were missing, the overall aroma quality of tea would be significantly affected. The aroma of tea depends not only on the type and content of volatile compounds but also on their OAVs [41]. We used OAVs to evaluate the contribution of volatile compounds to the EG green tea and selected three key aromatic compounds (VIP > 1, p < 0.05, OAV > 1): cis-jasmone, linalool, and nonanal. Linalool has a citrus-like and flowery aroma [27,41]. Su et al. [42] showed that linalool is the key volatile compound of green tea and that it plays an important role in the aroma of green tea. Nonanal is widely found in green tea and has a sweet, fruity flavor [37]. Notably, cis-jasmone and nonanal were the key volatile compounds responsible for the unique floral flavor of EG green tea.
Cis-jasmone and nonanal were the main components of EG green tea. The aroma quality of tea is determined not only by its content of compounds but also by the activity value of its aroma. The unique floral-aroma compound cis-jasmone in EG green tea had not only a high content but also a high OAV of 177.07. This indicates that cis-jasmone is a characteristic aroma compound of EG green tea and contributes significantly to its overall aroma. cis-jasmone is a compound with a jasmine scent that is commonly found in green tea and produces a pleasant floral jasmine scent at lower concentrations. Zhu et al. [43] found that cis-jasmone is a characteristic aroma compound of Xihu Longjing green tea, which is consistent with the findings of this study. Katsuno et al. [32] demonstrated that cis-jasmone contributes to the formation of floral fragrances. Cis-jasmone, linalool, and nonanal, the three key aromatic compounds in EG, promote the formation of floral fragrances [44].
Cis-jasmone and nonanal are the unique aroma-characteristic compounds of EG green tea. To explain this phenomenon, we studied the growth environment of the EG. Tea plants are exposed to various natural stresses, such as light, temperature, and pests. When facing stress, tea plants release volatile organic compounds to reduce the adverse effects of the stress [45]. The EG tea trees were intercropped with flowering cherry trees. When cherry trees bloom, flowers compete for scarce resources by continuously releasing volatile compounds. During resource competition, tea trees secrete large amounts of volatile compounds to defend against stress.

3.5. Analysis of Volatile Compounds in Flowering Cherry Trees

The results showed that EG green tea produced floral volatile compounds, such as cis-jasmone and nonanal, and that the content of other key floral volatile compounds changed. To explain these phenomena, HS-SPME/GC–MS was used to analyze the volatile compounds present in flowering cherry flowers. The detailed results are presented in Table 3. The results showed that benzaldehyde, α-farnesene, methyl benzoate, 3, 5-dimethoxytoluene had high relative contents, and that benzaldehyde accounted for 86.12% of all aroma components.
Allelopathy was first proposed by Molisch in 1937. During growth and development, plants change their surrounding microecological environment by releasing specific metabolites that affect the growth and development of other plants [46]. Allelopathy includes promotion and inhibition [47]. Allelopathic compounds can inhibit seed germination and slow or destroy normal plant growth. Therefore, the use of allelopathy to remove weeds is an effective method [48]. Studies showed that many allelopathic compounds can stimulate plant growth. The leaf extracts of Pinus sylvestris and Broussonetia papyrifera have been shown to promote the growth of Amygdalus pedunculata seedlings [49]. Research has shown that leaf extracts from Hippophae rhamnoides, Hedysarum mongolicum, and Sabina vulgaris significantly promote the seed germination and seedling growth of Amygdalus pedunculata Pall [50]. Plant allelochemicals are mainly secondary metabolites distributed in the roots, stems, leaves, flowers, fruits, and seeds of plants. Plant secondary metabolites include phenols, alkaloids, organic acids, terpenoids, and glycosides.
We analyzed the volatile compounds present in the flowers of the flowering cherry. Benzaldehyde had the highest concentration, followed by α-farnesene. Benzaldehyde is the simplest aromatic aldehyde found in nature, and it is present not only in >50% of plant families but also in insects and non-insect arthropods [51]. Benzaldehyde acts as a pollinator attractant, fragrance volatiler, and an antifungal compound in plants [52]. Benzaldehyde was found to be one of the main volatiles in sweet cherry flowers, which is consistent with the results of Zhang et al. [53]. Recent studies found that in the interplanting system between oil tea and peanuts, oil tea releases benzaldehyde as an allelopathic compound that inhibits the germination of peanut seeds [54]. α-farnesene has a citrusy odor and is involved in signal transduction between tea plants; it promotes metabolite synthesis in adjacent undamaged tea leaves [55]. Studies showed that α-farnesene acts as a signal to activate the expression of β-1, 3-glucanase (CsBGL) gene in adjacent undamaged tea leaves [56]. Methyl benzoate has a fruity odor and is a common floral volatile component found in more than 80 plants [57,58]. We speculated that benzaldehyde, α-farnesene, and methyl benzoate in flowering cherry may have allelopathic interactions with tea trees as major allelopathic compounds, which affect the metabolism of tea trees and prompt EG green tea trees to produce key volatile compounds with unique flower flavors (Figure 6). The results showed that a system of tea tree intercropping with flowering cherry has the potential to improve the tea quality.
There were significant differences between the volatile compounds of tea under the two cultivation models, indicating that the intercropping model had a significant influence on the secondary metabolism of tea. These results enhance our understanding of the improvement in tea quality created by the model with tea intercropping with the flowering cherry, and they provide a reference for the future popularization and application of tea intercropping in the flowering cherry model.

4. Conclusions

In this study, HS-SPME/GC–MS was used to identify volatile compounds of EG and CG green tea, and 54 volatile compounds were identified. The 54 volatile compounds were identified using PCA, OPLS-DA, and OAV. Among these compounds, cis-jasmone, linalool, and nonanal were found to be the key aromatic compounds responsible for EG green tea’s floral scent production. It was speculated that benzaldehyde, α-farnesene, and methyl benzene in flowering cherry trees acted as major allelopathic compounds, affecting the metabolism of tea trees through allelopathy. Cis-jasmone, linalool, and nonanal promoted the formation of a floral aroma and improved the overall aroma quality of tea. Further exploration is needed to determine whether other flowering plants affect the aroma quality of tea.

Supplementary Materials

The following supporting information can be downloaded through the link https://www.mdpi.com/article/10.3390/foods13081252/s1: Figure S1, VIP values of the 54 volatile compounds of EG and CG green tea samples.

Author Contributions

Conceptualization, Y.G. and Z.L.; investigation, Z.L.; methodology, Z.L., J.H., S.L. and J.L.; writing—original draft preparation, Y.G., Y.L. and Z.L.; writing—review and editing, Y.L., Y.G., Y.S. and Y.C.; data curation, W.L. and L.Y. All authors have read and agreed to the published version of the manuscript.

Funding

This research was funded by the Key Projects of Science and Technology Cooperation in Jiangxi Province (20212BDH80011), the Modern Agricultural Industrial Technology System of Jiangxi Province (JXARS-02), the National Modern Industrial Technology System (CARS-19), and the Natural Science Basic Research Program of Jiujiang (S2022KXJJ001).

Institutional Review Board Statement

Sensory evaluation data collection and use were in accordance with Jiujiang University Human Ethics application ID Number: JJUM20240090. (Approval Date: 7 April 2024).

Informed Consent Statement

All sensory evaluators agreed to participate and signed the in-formed consent form.

Data Availability Statement

The original contributions presented in the study are included in the article/supplementary material, further inquiries can be directed to the corresponding authors.

Acknowledgments

Thanks to Li Jie of Tea College of Jiujiang Vocational University for her guidance and help in tea sensory evaluation.

Conflicts of Interest

The authors declare no conflicts of interest.

References

  1. Wu, T.; Zou, R.; Pu, D.; Lan, Z.Q.; Zhao, B.Y. Non-targeted and targeted metabolomics profiling of tea plants (Camellia sinensis) in response to its intercropping with Chinese chestnut. BMC Plant Biol. 2021, 21, 55. [Google Scholar] [CrossRef] [PubMed]
  2. Huang, Z.; Cui, C.H.; Cao, Y.J.; Dai, J.H.; Cheng, X.Y.; Hua, S.W.; Wang, W.T.; Duan, Y.; Petropoulos, E.; Wang, H.; et al. Tea plant-legume intercropping simultaneously improves soil fertility and tea quality by changing Bacillus species composition. Hortic. Res. 2022, 9, uhac046. [Google Scholar] [CrossRef] [PubMed]
  3. Wang, T.; Duan, Y.; Liu, G.D.; Shang, X.W.; Liu, L.F.; Zhang, K.X.; Li, J.Q.; Zou, Z.W.; Zhu, X.J.; Fang, W.P. Tea plantation intercropping green manure enhances soil functional microbial abundance and multifunctionality resistance to drying-rewetting cycles. Sci. Total Environ. 2022, 810, 151282. [Google Scholar] [CrossRef] [PubMed]
  4. Sun, Y.M.; Li, X.F.; Yu, S.Q.; Zhang, K.; Zhang, J.; Yu, P.L.; Wang, Y.G.; Ye, C. Comparison on effects of different weed control measures in tea garden. J. South. Agric. 2017, 48, 1832–1837. [Google Scholar]
  5. Ye, J.H.; Wang, Y.H.; Wang, Y.C.; Hong, L.; Jia, X.L.; Kang, J.Q.; Lin, S.X.; Wu, Z.Y.; Wang, H.B. Improvement of soil acidification in tea plantations by long-term use of organic fertilizers and its effect on tea yield and quality. Front. Plant Sci. 2022, 13, 1055900. [Google Scholar] [CrossRef] [PubMed]
  6. Pokharel, S.S.; Yu, H.; Fang, W.P.; Parajulee, M.N.; Chen, F.J. Intercropping cover crops for a vital ecosystem service: A review of the biocontrol of insect pests in tea agroecosystems. Plants 2023, 12, 2361. [Google Scholar] [CrossRef] [PubMed]
  7. Yang, H.B.; Sheng, Z.L.; Xie, K.; Wu, X.H.; Deng, M. Seasonal regulation of different cultivation mode on ecological environment and tea quality in hilly tea plantation. Southwest China J. Agric. Sci. 2015, 28, 1559–1563. [Google Scholar]
  8. Liu, Y.; Sun, L.L.; Liao, H. Effects of nutrient management on soil fertility and tea quality in Anxi tea plantation. Acta Pedol. Sin. 2020, 57, 917–927. [Google Scholar]
  9. Cao, Q.M.; Wang, Y.P.; Qin, J.W.; Yi, W.P.; Zhang, J.H.; Xiao, T.B. Effects of compound planting on soil properties and tea quality in tea garden of Hainan island. Southwest China J. Agric. Sci. 2020, 33, 1504–1509. [Google Scholar]
  10. Shi, F.; Huang, H.J.; Chen, Y.T.; Chen, L.L. Effects of intercropping functional plants on the ecosystem functions and services in tea garden. J. Tea Sci. 2022, 42, 151–168. [Google Scholar]
  11. Wu, H.; Long, X.F.; Geng, Y.F. Companion plants of tea: From ancient to terrace to forest. Plants 2023, 12, 3061. [Google Scholar] [CrossRef] [PubMed]
  12. Ma, Q.P.; Song, L.C.; Niu, Z.H.; Qiu, Z.Y.; Sun, H.W.; Ren, Z.H.; Wu, H.H.; Wang, Y.; Mei, H.L.; Li, X.H.; et al. Pea-tea intercropping improves tea quality through regulating amino acid metabolism and flavonoid biosynthesis. Foods 2022, 11, 3746. [Google Scholar] [CrossRef]
  13. Kateb, H.E.; Zhang, H.F.; Zhang, P.C.; Mosandl, R. Soil erosion and surface runoff on different vegetation covers and slope gradients: A field experiment in Southern Shanxi Province, China. Catena 2013, 105, 1–10. [Google Scholar] [CrossRef]
  14. Liu, W.J.; Luo, Q.P.; Lu, H.J.; Wu, J.E.; Duan, W.P. The effect of litter layer on controlling surface runoff and erosion in rubber plantations on tropical mountain slopes, SW China. Catena 2017, 149, 167–175. [Google Scholar] [CrossRef]
  15. Duan, Y.; Shen, J.Z.; Zhang, X.L.; Wen, B.; Ma, Y.C.; Wang, Y.H.; Fang, W.P.; Zhu, X.J. Effects of soybean-tea intercropping on soil-available nutrients and tea quality. Acta Physiol. Plant. 2019, 41, 140. [Google Scholar] [CrossRef]
  16. Zhang, Z.Q.; Zhou, C.; Xu, Y.Y.; Huang, X.Q.; Zhang, L.X.; Mu, W. Effects of intercropping tea with aromatic plants on population dynamics of arthropods in Chinese tea plantations. J. Pest Sci. 2017, 90, 227–237. [Google Scholar] [CrossRef]
  17. Sun, L.; Dong, X.; Wang, Y.; Maker, G.; Agarwal, M.; Ding, Z.T. Tea-Soybean intercropping improves tea quality and nutrition uptake by inducing changes of rhizosphere bacterial communities. Microorganisms 2022, 10, 2149. [Google Scholar] [CrossRef] [PubMed]
  18. Yang, L.R.; Jiang, B.; Jiao, W.W.; Zhong, X.X.; Liu, K.Y.; Liu, L.; Li, L.X.; Peng, K.L.; Luo, X.P. Influence of tea-Prunus salicina lindl. intercropping on growth of tea trees and the quality of autumn green tea. J. South. Agric. 2023, 10, 1–15. [Google Scholar]
  19. Nie, C.; Zhang, Y.; Zhang, X.; Xia, W.; Sun, H.; Zhang, S.; Li, N.; Ding, Z.; Lv, Y.; Wang, N. Genome assembly, resequencing and genome-wide association analyses provide novel insights into the origin, evolution and flower colour variations of flowering cherry. Plant J. 2023, 114, 519–533. [Google Scholar] [CrossRef] [PubMed]
  20. Yan, X.; Xie, Y.; Chen, J.; Yuan, T.; Leng, T.; Chen, Y.; Xie, J.; Yu, Q. NIR spectrometric approach for geographical origin identification and taste related compounds content prediction of Lushan Yunwu tea. Foods 2022, 11, 2976. [Google Scholar] [CrossRef] [PubMed]
  21. Wu, H.T.; Chen, Y.Y.; Feng, W.Z.; Shen, S.S.; Wei, Y.M.; Jia, H.Y.; Wang, Y.J.; Deng, W.W.; Ning, J.M. Effects of three different withering treatments on the aroma of white tea. Foods 2022, 11, 2502. [Google Scholar] [CrossRef] [PubMed]
  22. Wang, B.; Shu, N.; Lu, A.X.; Liao, X.L.; Yan, J.N.; Xie, G.H.; Tong, H.R. Aroma formation of green tea effected by different pan-fire temperature. Food Ferment. Ind. 2020, 46, 197–203. [Google Scholar]
  23. Wei, Y.M.; Yin, X.C.; Wu, H.T.; Zhao, M.J.; Huang, J.L.; Zhang, J.X.; Li, T.H.; Ning, J.M. Improving the flavor of summer green tea (Camellia sinensis L.) using the yellowing process. Food Chem. 2022, 388, 132982. [Google Scholar] [CrossRef] [PubMed]
  24. Su, D.; He, J.J.; Zhou, Y.Z.; Li, Y.L.; Zhou, H.J. Aroma effects of key volatile compounds in Keemun black tea at different grades: HS-SPME-GC-MS, sensory evaluation, and chemometrics. Food Chem. 2022, 373, 131587. [Google Scholar] [CrossRef] [PubMed]
  25. Sun, L.T.; Dong, X.; Ren, Y.L.; Agarwal, M.; Ren, A.; Ding, Z.T. Profiling real-time aroma from green tea infusion during brewing. Foods 2022, 11, 684. [Google Scholar] [CrossRef] [PubMed]
  26. Wang, M.Q.; Ma, W.J.; Shi, J.; Zhu, Y.; Lin, Z.; Lv, H.P. Characterization of the key aroma compounds in Longjing tea using stir bar sorptive extraction (SBSE) combined with gas chromatography-mass spectrometry (GC-MS), gas chromatography-olfactometry (GC-O), odor activity value (OAV), and aroma recombination. Food Res. Int. 2020, 130, 108908. [Google Scholar] [CrossRef] [PubMed]
  27. Zhai, X.T.; Zhang, L.; Granvogl, M.; Ho, C.T.; Wan, X.C. Flavor of tea (Camellia sinensis): A review on odorants and analytical techniques. Compr. Rev. Food Sci. Food Saf. 2022, 21, 3867–3909. [Google Scholar] [CrossRef] [PubMed]
  28. Xu, K.; Tian, C.Y.; Zhou, C.Z.; Zhu, C.; Weng, J.J.; Sun, Y.; Lin, Y.L.; Lai, Z.X.; Guo, Y.Q. Non-targeted metabolomics analysis revealed the characteristic non-volatile and volatile metabolites in the Rougui Wuyi rock tea (Camellia sinensis) from different culturing regions. Foods 2022, 11, 1694. [Google Scholar] [CrossRef] [PubMed]
  29. Wang, J.; Li, X.H.; Wu, Y.; Qu, F.F.; Liu, L.; Wang, B.Y.; Wang, P.Q.; Zhang, X.F. HS-SPME/GC-MS reveals the season effects on volatile compounds of green tea in high-latitude region. Foods 2022, 11, 3016. [Google Scholar] [CrossRef] [PubMed]
  30. Zhu, J.C.; Niu, Y.W.; Xiao, Z.B. Characterization of the key aroma compounds in Laoshan green teas by application of odour activity value (OAV), gas chromatography-mass spectrometry-olfactometry (GC-MS-O) and comprehensive two-dimensional gas chromatography mass spectrometry (GC × GC-qMS). Food Chem. 2021, 339, 128136. [Google Scholar] [CrossRef] [PubMed]
  31. Liu, N.F.; Shen, S.S.; Huang, L.F.; Deng, G.J.; Wei, Y.M.; Ning, J.M.; Wang, Y.J. Revelation of volatile contributions in green teas with different aroma types by GC-MS and GC-IMS. Food Res. Int. 2023, 169, 112845. [Google Scholar] [CrossRef] [PubMed]
  32. Katsuno, T.; Kasuga, H.; Kusano, Y.; Yaguchi, Y.; Tomomura, M.; Cui, J.L.; Yang, Z.Y.; Baldermann, S.; Nakamura, Y.; Ohnishi, T.; et al. Characterisation of odorant compounds and their biochemical formation in green tea with a low temperature storage process. Food Chem. 2014, 148, 388–395. [Google Scholar] [CrossRef] [PubMed]
  33. Ho, C.T.; Zheng, X.; Li, S.M. Tea aroma formation. Food Sci. Hum. Well. 2015, 4, 9–27. [Google Scholar] [CrossRef]
  34. Han, Z.X.; Rana, M.M.; Liu, G.F.; Gao, M.J.; Li, D.X.; Wu, F.G.; Li, X.B.; Wan, X.C.; Wei, S. Green tea flavour determinants and their changes over manufacturing processes. Food Chem. 2016, 212, 739–748. [Google Scholar] [CrossRef] [PubMed]
  35. Liu, P.P.; Zheng, P.C.; Gong, Z.M.; Feng, L.; Gao, S.W.; Wang, X.P.; Teng, J.; Zheng, L.; Liu, Z.H. Comparing characteristic aroma components of bead-shaped green teas from different regions using headspace solid-phase microextraction and gas chromatography–mass spectrometry/olfactometry combined with chemometrics. Eur. Food Res. Technol. 2020, 246, 1703–1714. [Google Scholar] [CrossRef]
  36. Yin, X.; Huang, J.A.; Huang, J.; Wu, W.L.; Tong, T.; Liu, S.J.; Zhou, L.Y.; Liu, Z.H.; Zhang, S.G. Identification of volatile and odor-active compounds in Hunan black tea by SPME/GC-MS and multivariate analysis. LWT-Food Sci. Technol. 2022, 164, 113656. [Google Scholar] [CrossRef]
  37. Wang, H.J.; Ouyang, W.; Yu, Y.Y.; Wang, J.J.; Yuan, H.B.; Hua, J.J.; Jiang, Y.W. Analysis of non-volatile and volatile metabolites reveals the influence of second-drying heat transfer methods on green tea quality. Food Chem. X 2022, 14, 100354. [Google Scholar] [CrossRef]
  38. Guo, X.Y.; Ho, C.T.; Schwab, W.; Wan, X.C. Effect of the roasting degree on flavor quality of large-leaf yellow tea. Food Chem. 2021, 347, 129016. [Google Scholar] [CrossRef] [PubMed]
  39. Hu, W.W.; Wang, G.G.; Lin, S.X.; Liu, Z.J.; Wang, P.; Li, J.Y.; Zhang, Q.; He, H.B. Digital evaluation of aroma intensity and odor characteristics of tea with different types-based on OAV-splitting method. Foods 2022, 11, 2204. [Google Scholar] [CrossRef] [PubMed]
  40. Ma, L.J.; Gao, M.M.; Zhang, L.Q.; Qiao, Y.; Li, J.X.; Du, L.P.; Zhang, H.L.; Wang, H. Characterization of the key aroma-active compounds in high-grade Dianhong tea using GC-MS and GC-O combined with sensory-directed flavor analysis. Food Chem. 2022, 378, 132058. [Google Scholar] [CrossRef]
  41. Zeng, L.; Watanabe, N.; Yang, Z. Understanding the biosyntheses and stress response mechanisms of aroma compounds in tea (Camellia sinensis) to safely and effectively improve tea aroma. Crit. Rev. Food Sci. Nutr. 2019, 59, 2321–2334. [Google Scholar] [CrossRef] [PubMed]
  42. Su, W.Y.; Gao, S.Y.; Zhan, S.J.; Wu, Q.; Chen, G.M.; Han, J.Z.; Lv, X.C.; Rao, P.F.; Ni, L. Evaluation of volatile profile and in vitro antioxidant activity of fermented green tea infusion with Pleurotus sajor-caju (Oyster Mushroom). Front. Nutr. 2022, 9, 865991. [Google Scholar] [CrossRef] [PubMed]
  43. Zhu, Y.; Lv, H.P.; Dai, W.D.; Guo, L.; Tan, J.F.; Zhang, Y.; Yu, F.L.; Shao, C.Y.; Peng, Q.H.; Lin, Z. Separation of aroma components in Xihu Longjing tea using simultaneous distillation extraction with comprehensive two-dimensional gas chromatography-time-of-flight mass spectrometry. Sep. Purif. Technol. 2016, 164, 146–154. [Google Scholar] [CrossRef]
  44. Wang, Q.S.; Qin, D.D.; Jiang, X.H.; Fang, K.X.; Li, B.; Wang, Q.; Pan, C.D.; Ni, E.D.; Li, H.J.; Chen, D.; et al. Characterization of the aroma profiles of Guangdong black teas using non-targeted metabolomics. Foods 2023, 12, 1560. [Google Scholar] [CrossRef] [PubMed]
  45. Zeng, L.; Jin, S.; Xu, Y.Q.; Granato, D.; Fu, Y.Q.; Sun, W.J.; Yin, J.F.; Xu, Y.Q. Exogenous stimulation-induced biosynthesis of volatile compounds: Aroma formation of oolong tea at postharvest stage. Crit. Rev. Food Sci. Nutr. 2022, 28, 1–11. [Google Scholar] [CrossRef] [PubMed]
  46. Schandry, N.; Becker, C. Allelopathic plants: Models for studying plant-interkingdom interactions. Trends Plant Sci. 2020, 25, 176–185. [Google Scholar] [CrossRef] [PubMed]
  47. Han, M.; Yang, H.; Huang, H.; Du, J.; Zhang, S.; Fu, Y. Allelopathy and allelobiosis: Efficient and economical alternatives in agroecosystems. Plant Biol. 2024, 26, 11–27. [Google Scholar] [CrossRef] [PubMed]
  48. Khamare, Y.; Chen, J.; Marble, S.C. Allelopathy and its application as a weed management tool: A review. Front. Plant Sci. 2022, 13, 1034649. [Google Scholar] [CrossRef] [PubMed]
  49. Wang, X.Q.; Zhang, R.Q.; Wang, J.X.; Di, L.; Wang, H.B.; Sikdar, A. The effects of leaf extracts of four tree species on amygdalus pedunculata seedlings growth. Front. Plant Sci. 2021, 11, 587579. [Google Scholar] [CrossRef] [PubMed]
  50. Wang, X.Q.; Wang, J.X.; Zhang, R.Q.; Huang, Y.; Feng, S.L.; Ma, X.; Zhang, Y.Y.; Sikdar, A.; Roy, R. Allelopathic effects of aqueous leaf extracts from four shrub species on Seed germination and initial growth of Amygdalus pedunculata Pall. Forests 2018, 9, 711. [Google Scholar] [CrossRef]
  51. Schiestl, F.P. The evolution of floral scent and insect chemical communication. Ecol. Lett. 2010, 13, 643–656. [Google Scholar] [CrossRef] [PubMed]
  52. Huang, X.Q.; Li, R.Q.G.; Fu, J.X.; Dudareva, N. A peroxisomal heterodimeric enzyme is involved in benzaldehyde synthesis in plants. Nat. Commun. 2022, 13, 1352. [Google Scholar] [CrossRef] [PubMed]
  53. Zhang, H.M.; Yan, H.G.; Li, Q.; Lin, H.; Wen, X.P. Identification of VOCs in essential oils extracted using ultrasound- and microwave-assisted methods from sweet cherry flower. Sci. Rep. 2021, 11, 1167. [Google Scholar] [CrossRef] [PubMed]
  54. Wen, H.; Dan, P.P.; Liu, T.; Li, Z.Q.; Chen, X.Y.; Cao, Y.N.; Li, Y.; Yan, W.D. Allelopathic mechanisms in Camellia oleifera-Arachis hypogaea L. intercropping. J. Agric. Food Chem. 2023, 71, 19434–19444. [Google Scholar] [CrossRef] [PubMed]
  55. Zeng, L.; Liao, Y.; Li, J.; Zhou, Y.; Tang, J.; Dong, F.; Yang, Z.Y. α-Farnesene and ocimene induce metabolite changes by volatile signaling in neighboring tea (Camellia sinensis) plants. Plant Sci. 2017, 264, 29–36. [Google Scholar] [CrossRef] [PubMed]
  56. Wang, X.W.; Zeng, L.T.; Liao, Y.Y.; Li, J.L.; Tang, J.C.; Yang, Z.Y. Formation of α-farnesene in tea (Camellia sinensis) leaves induced by herbivore-derived wounding and its effect on neighboring tea plants. Int. J. Mol. Sci. 2019, 20, 4151. [Google Scholar] [CrossRef] [PubMed]
  57. Dudareva, N.; Murfitt, L.M.; Mann, C.J.; Gorenstein, N.; Kolosova, N.; Kish, C.M.; Bonham, C.; Wood, K. Developmental regulation of methyl benzoate biosynthesis and emission in snapdragon flowers. Plant Cell. 2000, 12, 949–961. [Google Scholar] [CrossRef] [PubMed]
  58. Yue, Y.C.; Wang, L.; Li, M.Y.; Liu, F.; Yin, J.L.; Huang, L.J.; Zhou, B.; Li, X.Y.; Yu, Y.Y.; Chen, F.; et al. A BAHD acyltransferase contributes to the biosynthesis of both ethyl benzoate and methyl benzoate in the flowers of Lilium oriental hybrid ‘Siberia’. Front. Plant Sci. 2023, 14, 1275960. [Google Scholar] [CrossRef] [PubMed]
Figure 1. Radar plot for comparative descriptive aroma profiles of the EG and CG green teas. (EG—teas from the intercropping group; CG—teas from the pure tea tree group. ** indicates p < 0.01).
Foods 13 01252 g001
Figure 2. Volatile profiles of EG and CG green tea determined by SPME-GC–MS. The upper part of the figure shows the relative content of each chemical category, and the lower part shows the number of different compounds in each category.
Foods 13 01252 g002
Figure 3. Heat map analysis of the concentrations of the main volatile compounds in tea samples.
Foods 13 01252 g003
Figure 4. Multivariate analysis of volatile compound contents between the EG and CG green tea samples. (a) PCA score plot and (b) loading plots of volatile compounds (red and green dots represent different compounds; red dot represent the most differential compounds, VIP > 1).
Foods 13 01252 g004
Figure 5. The OPLS-DA model in the EG and CG green tea samples (R2X = 0.862, R2Y = 0.99, and Q2 = 0.969).
Foods 13 01252 g005
Figure 6. Model of Lushan Yunwu tea intercropping with flowering cherry leading to floral tea. We speculated that benzaldehyde, α-farnesene, and methyl benzoate in flowering cherry may have allelopathic interactions with tea trees as major allelopathic compounds, which affect the metabolism of tea trees and prompt leaves to produce key volatile compounds with unique flower flavors.
Foods 13 01252 g006
Table 1. Volatile compounds identified in EG and CG green tea (µg/L).
RTNameCASRI aRI bIDEGCG
17.57Styrene100-42-5897893MS, RI2.52 ± 0.62.87 ± 0.38
28.8Ethylene glycol monoisobutyl ether4439-24-1940947MS, RI25.22 ± 5.49-
39.033-Ethyl-3-methylheptane17302-01-1959953MS, RI3.09 ± 0.59-
410.34β-Myrcene123-35-3992991MS, RI, STD-0.85 ± 0.16
511.67D-sylvestrene1461-27-410301027MS, RI-4.85 ± 0.37
612.14Benzyl alcohol100-51-610401036MS, RI, STD0.77 ± 0.89-
712.491-Ethyl-1H-pyrrole-2-carboxaldehyde2167-14-810481046MS, RI2.27 ± 0.74-
812.85Decane, 3-methyl-13151-34-310611071MS, RI2.98 ± 0.69-
913.3cis-Linalool oxide (furanoid)5989-33-310731074MS, RI12.99 ± 3.1413.9 ± 1.89
1013.95(E)-Linalol oxide (furanoid)34995-77-210901886MS, RI2.72 ± 5.4415.91 ± 0.96
1114.16Undecane1120-21-410951100MS, RI2.83 ± 0.31-
1214.38Linalool78-70-611011098MS, RI, STD34.58 ± 3.7376.47 ± 6.14
1314.58Nonanal124-19-611051102MS, RI, STD30.45 ± 5.61-
1414.612-Nonen-1-ol22104-79-611051105MS, RI-28.57 ± 6.49
1515.36Phenylethyl Alcohol60-12-811221116MS, RI0.88 ± 0.31-
1617.69(Z)-Linalool oxide (pyranoid)14009-71-311701174MS, RI5.04 ± 1.64-
1717.85Linalool oxide (pyranoid)14049-11-711751178MS, RI, STD36.42 ± 5.5331.75 ± 3.51
1818.43cis-3-Hexenyl butyrate16491-36-411871187MS, RI4.94 ± 1.15-
1918.72α-Terpineol98-55-511931190MS, RI, STD3.29 ± 0.614.12 ± 1.32
2019.05Methyl salicylate119-36-812001192MS, RI39.71 ± 7.8229.55 ± 6.78
2122.03Geraniol106-24-112551255MS, RI, STD14.64 ± 5.51-
2222.242,6-Octadien-1-ol, 3,7-dimethyl-624-15-712591260MS, RI5.68 ± 0.80.66 ± 0.32
2324.45Indole120-72-913001295MS, RI25.52 ± 2.54-
2426.67γ-Ionone79-76-513381340MS, RI0.09 ± 0.12-
2527.36α-Cubebene17699-14-813501352MS, RI6.77 ± 0.89-
2628.87α-Copaene3856-25-513761376MS, RI1.89 ± 0.252.17 ± 0.33
2729.17cis-3-Hexenyl hexanoate31501-11-813821380MS, RI, STD60.12 ± 10.3867.93 ± 6.69
2830.21Tetradecane629-59-414001400MS, RI-32.81 ± 6.97
2930.24cis-Jasmone488-10-814001394MS, RI, STD46.04 ± 6.37-
3032.18γ-Elemene29873-99-214341434MS, RI3.5 ± 0.64-
3132.93Cyclopentane, nonyl-2882-98-614471451MS, RI2.89 ± 1.53-
3233.32trans-Geranylacetone3796-70-114541453MS, RI-1.63 ± 0.32
3333.54cis-β-Farnesene28973-97-914581457MS, RI3.13 ± 0.387.29 ± 0.66
3433.772,6,10-Trimethyltridecane3891-99-414621461MS, RI10.61 ± 1.26-
3534.87Valencene4630-07-314811476MS, RI3.92 ± 3.74-
3635.24Trans-β-Ionone79-77-614871486MS, RI4.18 ± 0.488.41 ± 0.66
3735.97Pentadecane629-62-915001500MS, RI26.28 ± 19.4641.71 ± 4.58
3836.52α-Farnesene502-61-415101508MS, RI, STD-5.65 ± 2.59
3937.67Dihydroactinidiolide17092-92-115301532MS, RI-3.02 ± 0.7
4038.47α-Calacorene21391-99-115441542MS, RI1.42 ± 0.340.43 ± 0.17
4139.63trans-Nerolidol40716-66-315651564MS, RI, STD22.81 ± 4.3348.91 ± 24.79
4239.97Pentadecane, 3-methyl-2882-96-415701570MS, RI3.59 ± 1.27-
4341.48Diethyl Phthalate84-66-215981603MS, RI0.89 ± 0.972.02 ± 1.35
4441.63Hexadecane544-76-316001600MS, RI19.33 ± 3.334.84 ± 4.15
4543.752,6-Bis(1,1-dimethylethyl)-4-(1-oxopropyl)phenol14035-34-816391640MS, RI2.41 ± 1.45-
4643.99τ-Muurolol19912-62-016431642MS, RI5.63 ± 1.423.39 ± 0.42
4744.24Torreyol19435-97-316481645MS, RI0.16 ± 0.1-
4844.39Methyl jasmonate1211-29-616501652MS, RI9.58 ± 1.34-
4944.68α-Cadinol481-34-516561653MS, RI1.49 ± 0.87-
5045.79Cadalene483-78-316761674MS, RI1.48 ± 0.23-
5147.11Heptadecane629-78-717001700MS, RI2.63 ± 0.654.96 ± 0.49
5254.33Neophytadiene504-96-118381837MS, RI-2.76 ± 0.32
5354.67Caffeine50-8-218471840MS, RI33.13 ± 9.422.76 ± 0.34
5458.75Methyl palmitate112-39-019281926MS, RI, STD1.21 ± 0.280.68 ± 0.11
MS—identification based on the NIST 2017 mass spectral database; a RI—retention index of each volatile on the TG-5MS column (30 m × 0.25 mm × 0.25 μm); b RI—retention index based on the NIST database. STD—means the compound was identified by standards. All data are expressed as mean ± S.D. (n = 5).
Table 3. The volatile compounds present in flowering cherry flowers.
NameCASRelative Content (%)
Benzaldehyde100-52-786.12
α-Farnesene502-61-44.49
Methyl benzoate93-58-33.15
Orcinol dimethyl ether4179-19-52.01
Anisic aldehyde123-11-50.81
Phenylethyl Alcohol60-12-80.75
3,5-Dimethoxybenzaldehyde7311-34-40.53
Benzene, 1-methoxy-2-(methoxymethyl)-21998-86-70.1
Benzoic acid, ethyl ester93-89-00.07
Methyl salicylate119-36-80.07
Disclaimer/Publisher’s Note: The statements, opinions and data contained in all publications are solely those of the individual author(s) and contributor(s) and not of MDPI and/or the editor(s). MDPI and/or the editor(s) disclaim responsibility for any injury to people or property resulting from any ideas, methods, instructions or products referred to in the content.

