
Novel Injectable Hydrogel Formulations and Gas Chromatography Analysis of the Residual Crosslinker in Formulations Intended for Pharmaceutical and Cosmetic Applications

Abstract
:
1. Introduction
2. Results and Discussion
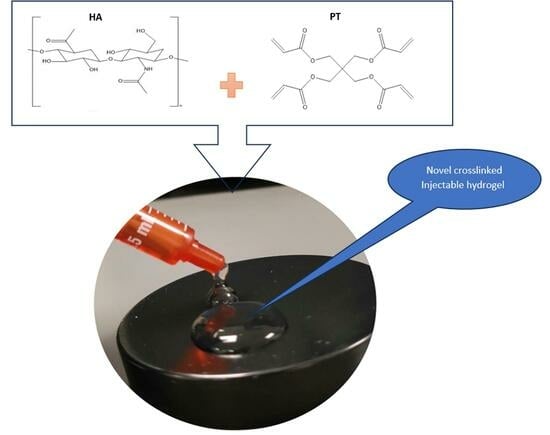
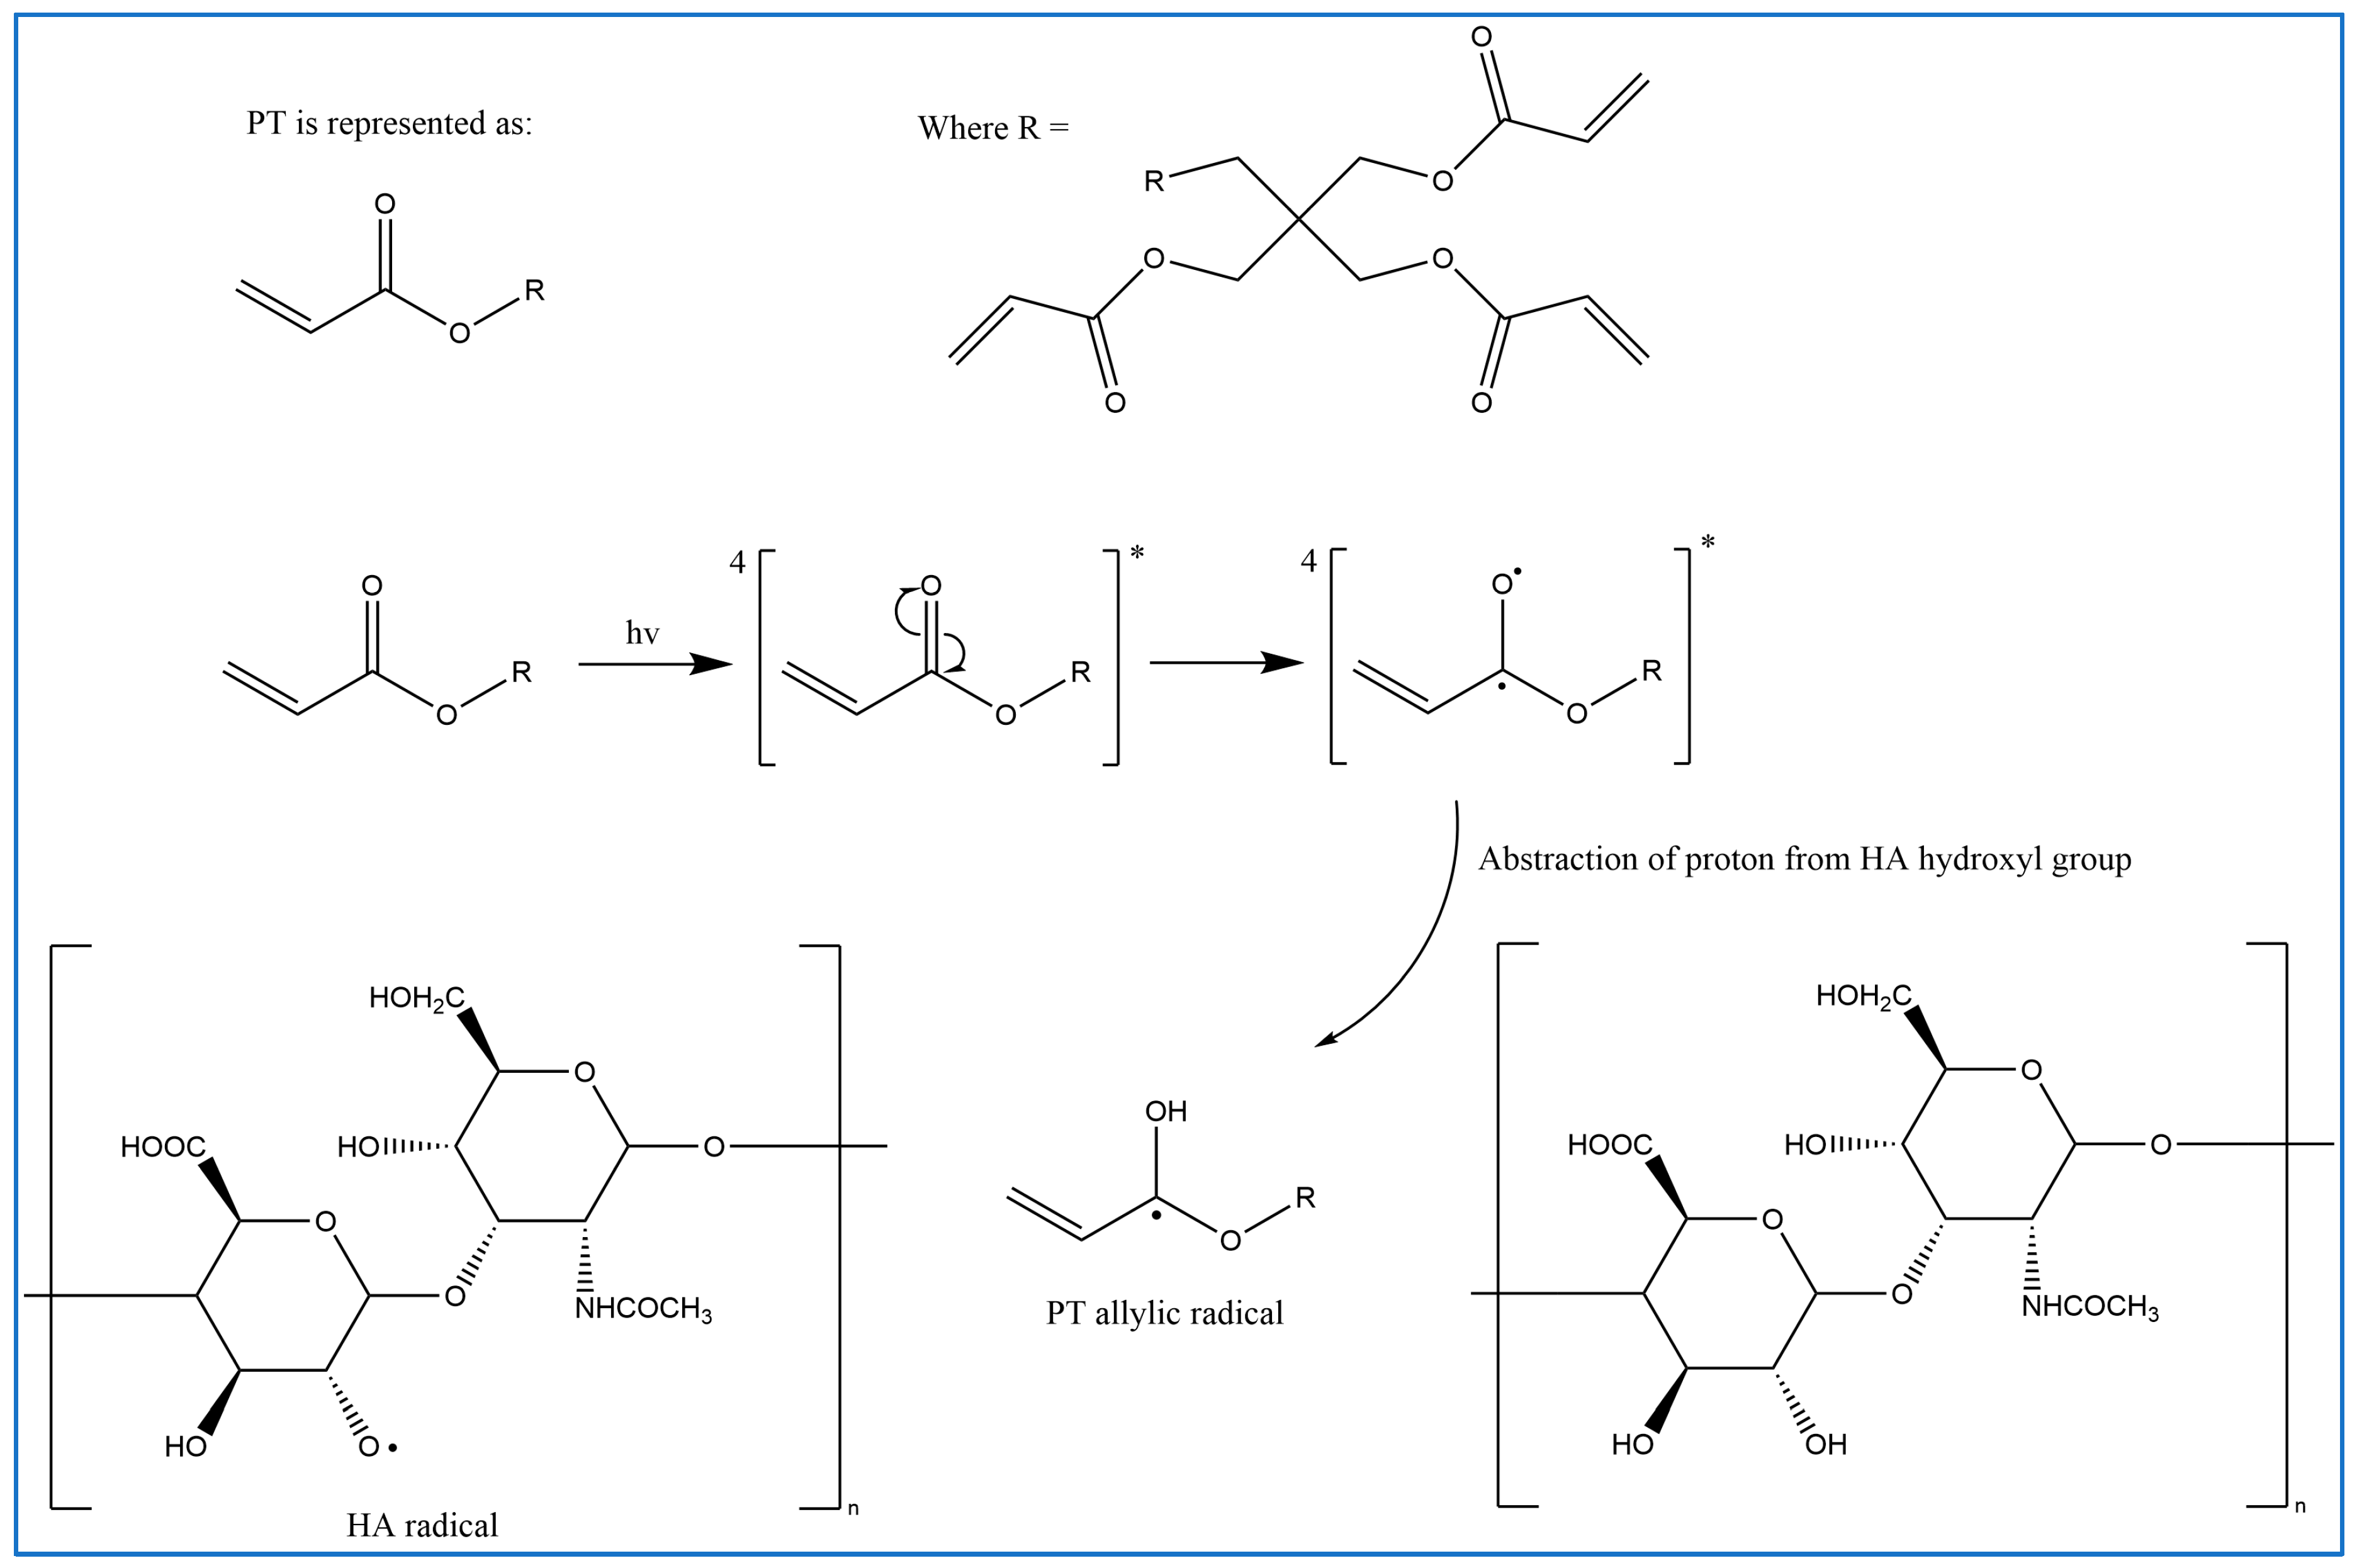
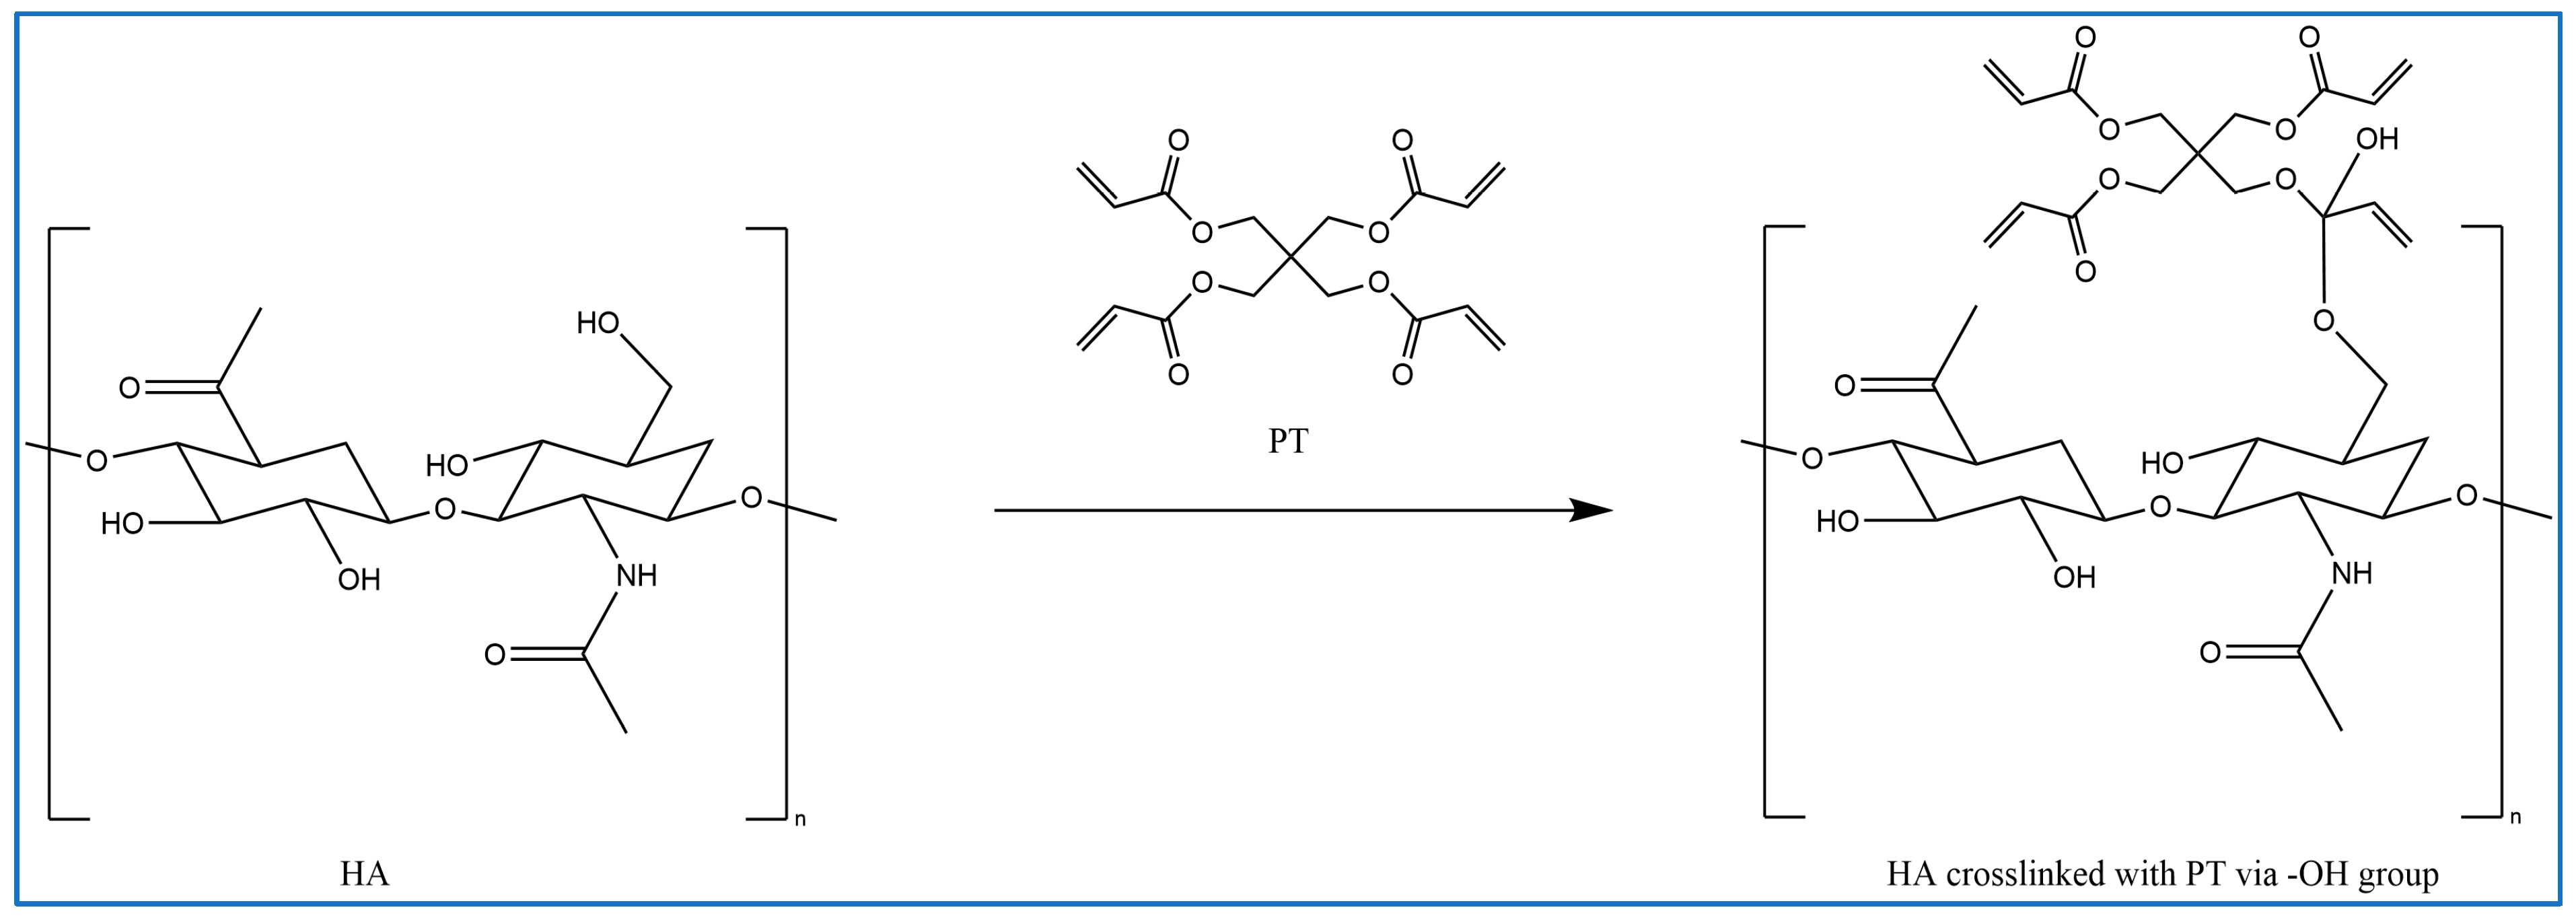
2.1. Crosslinking Mechanism
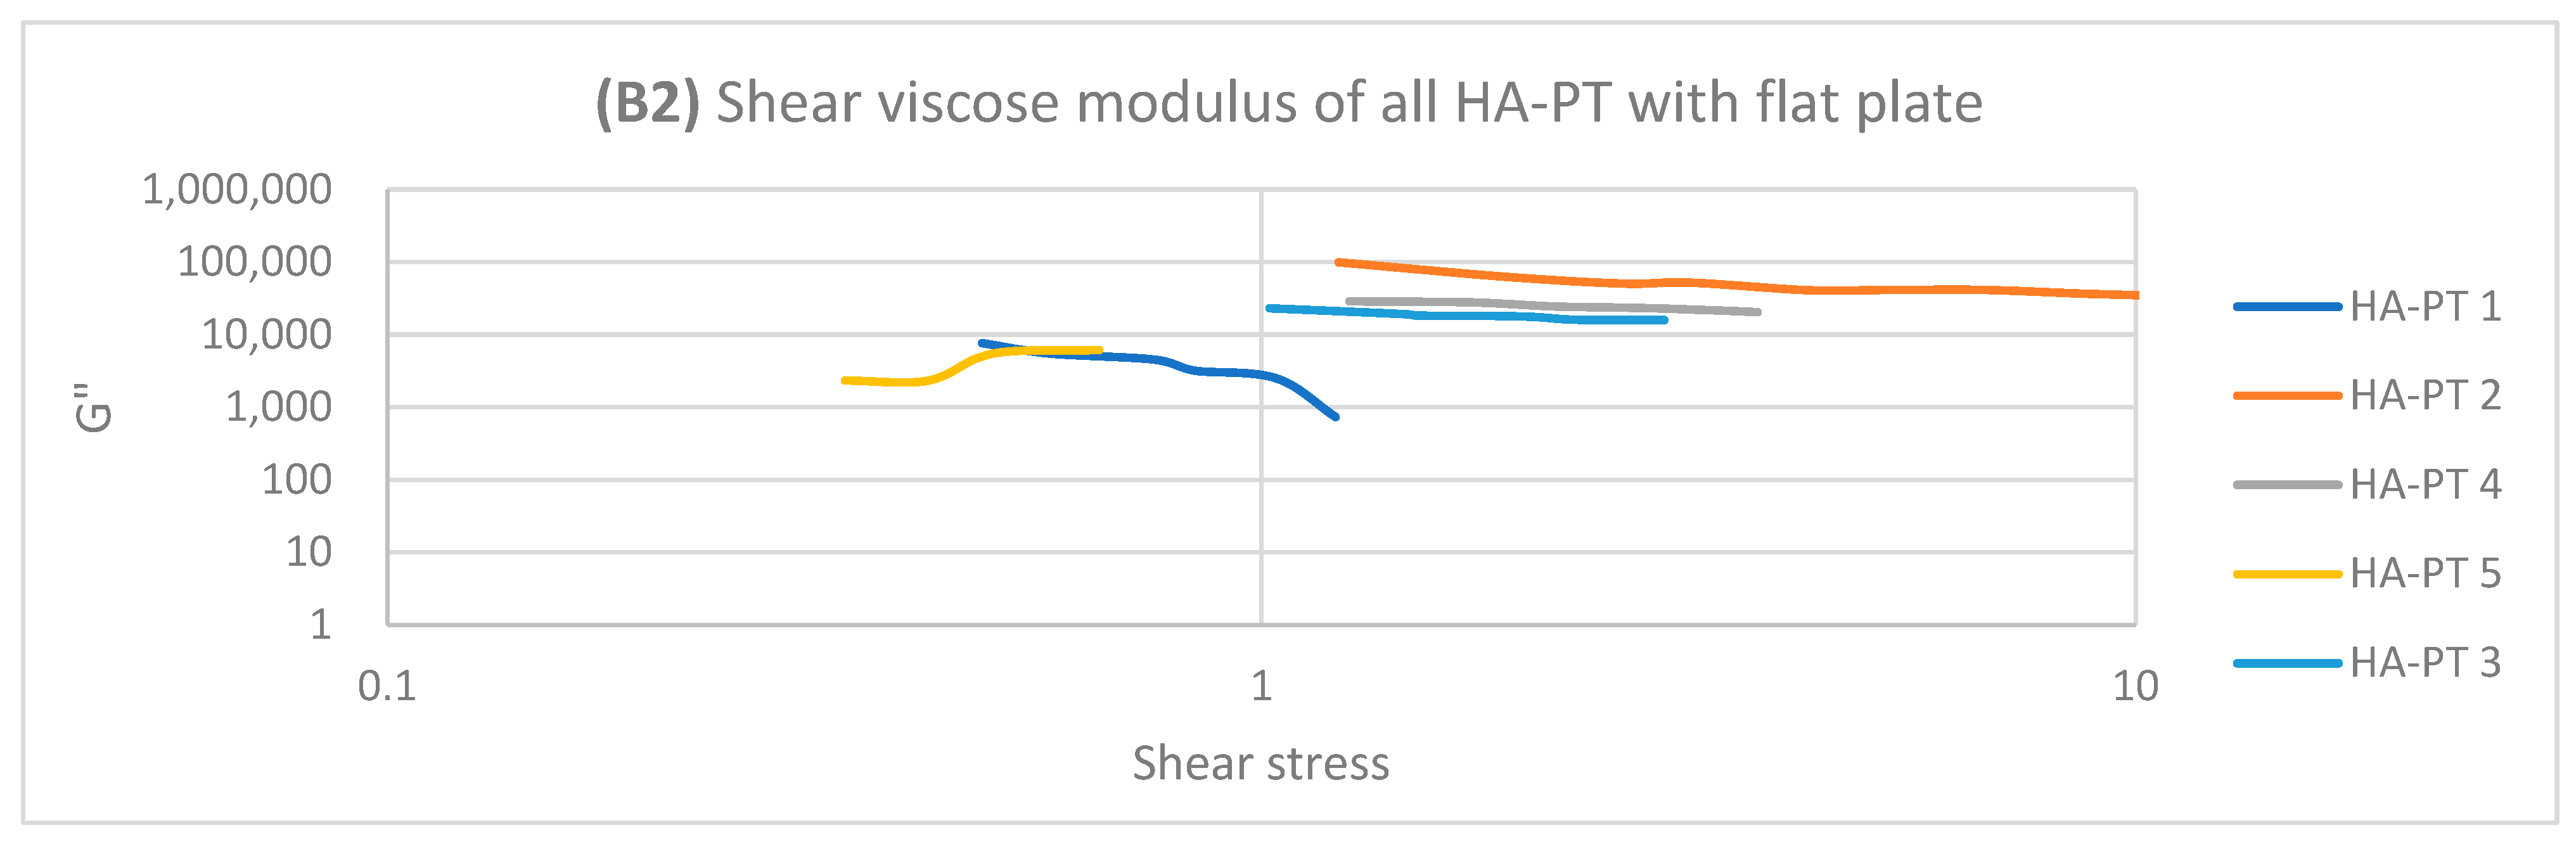
2.2. Rheology Study of the Injectable Hydrogel/Filler Formulations
2.3. Injectable Hydrogel/Filler Formulation Characterisation
2.4. Formulations and Swelling Behaviour of the Injectable Hydrogel/Filler Formulations
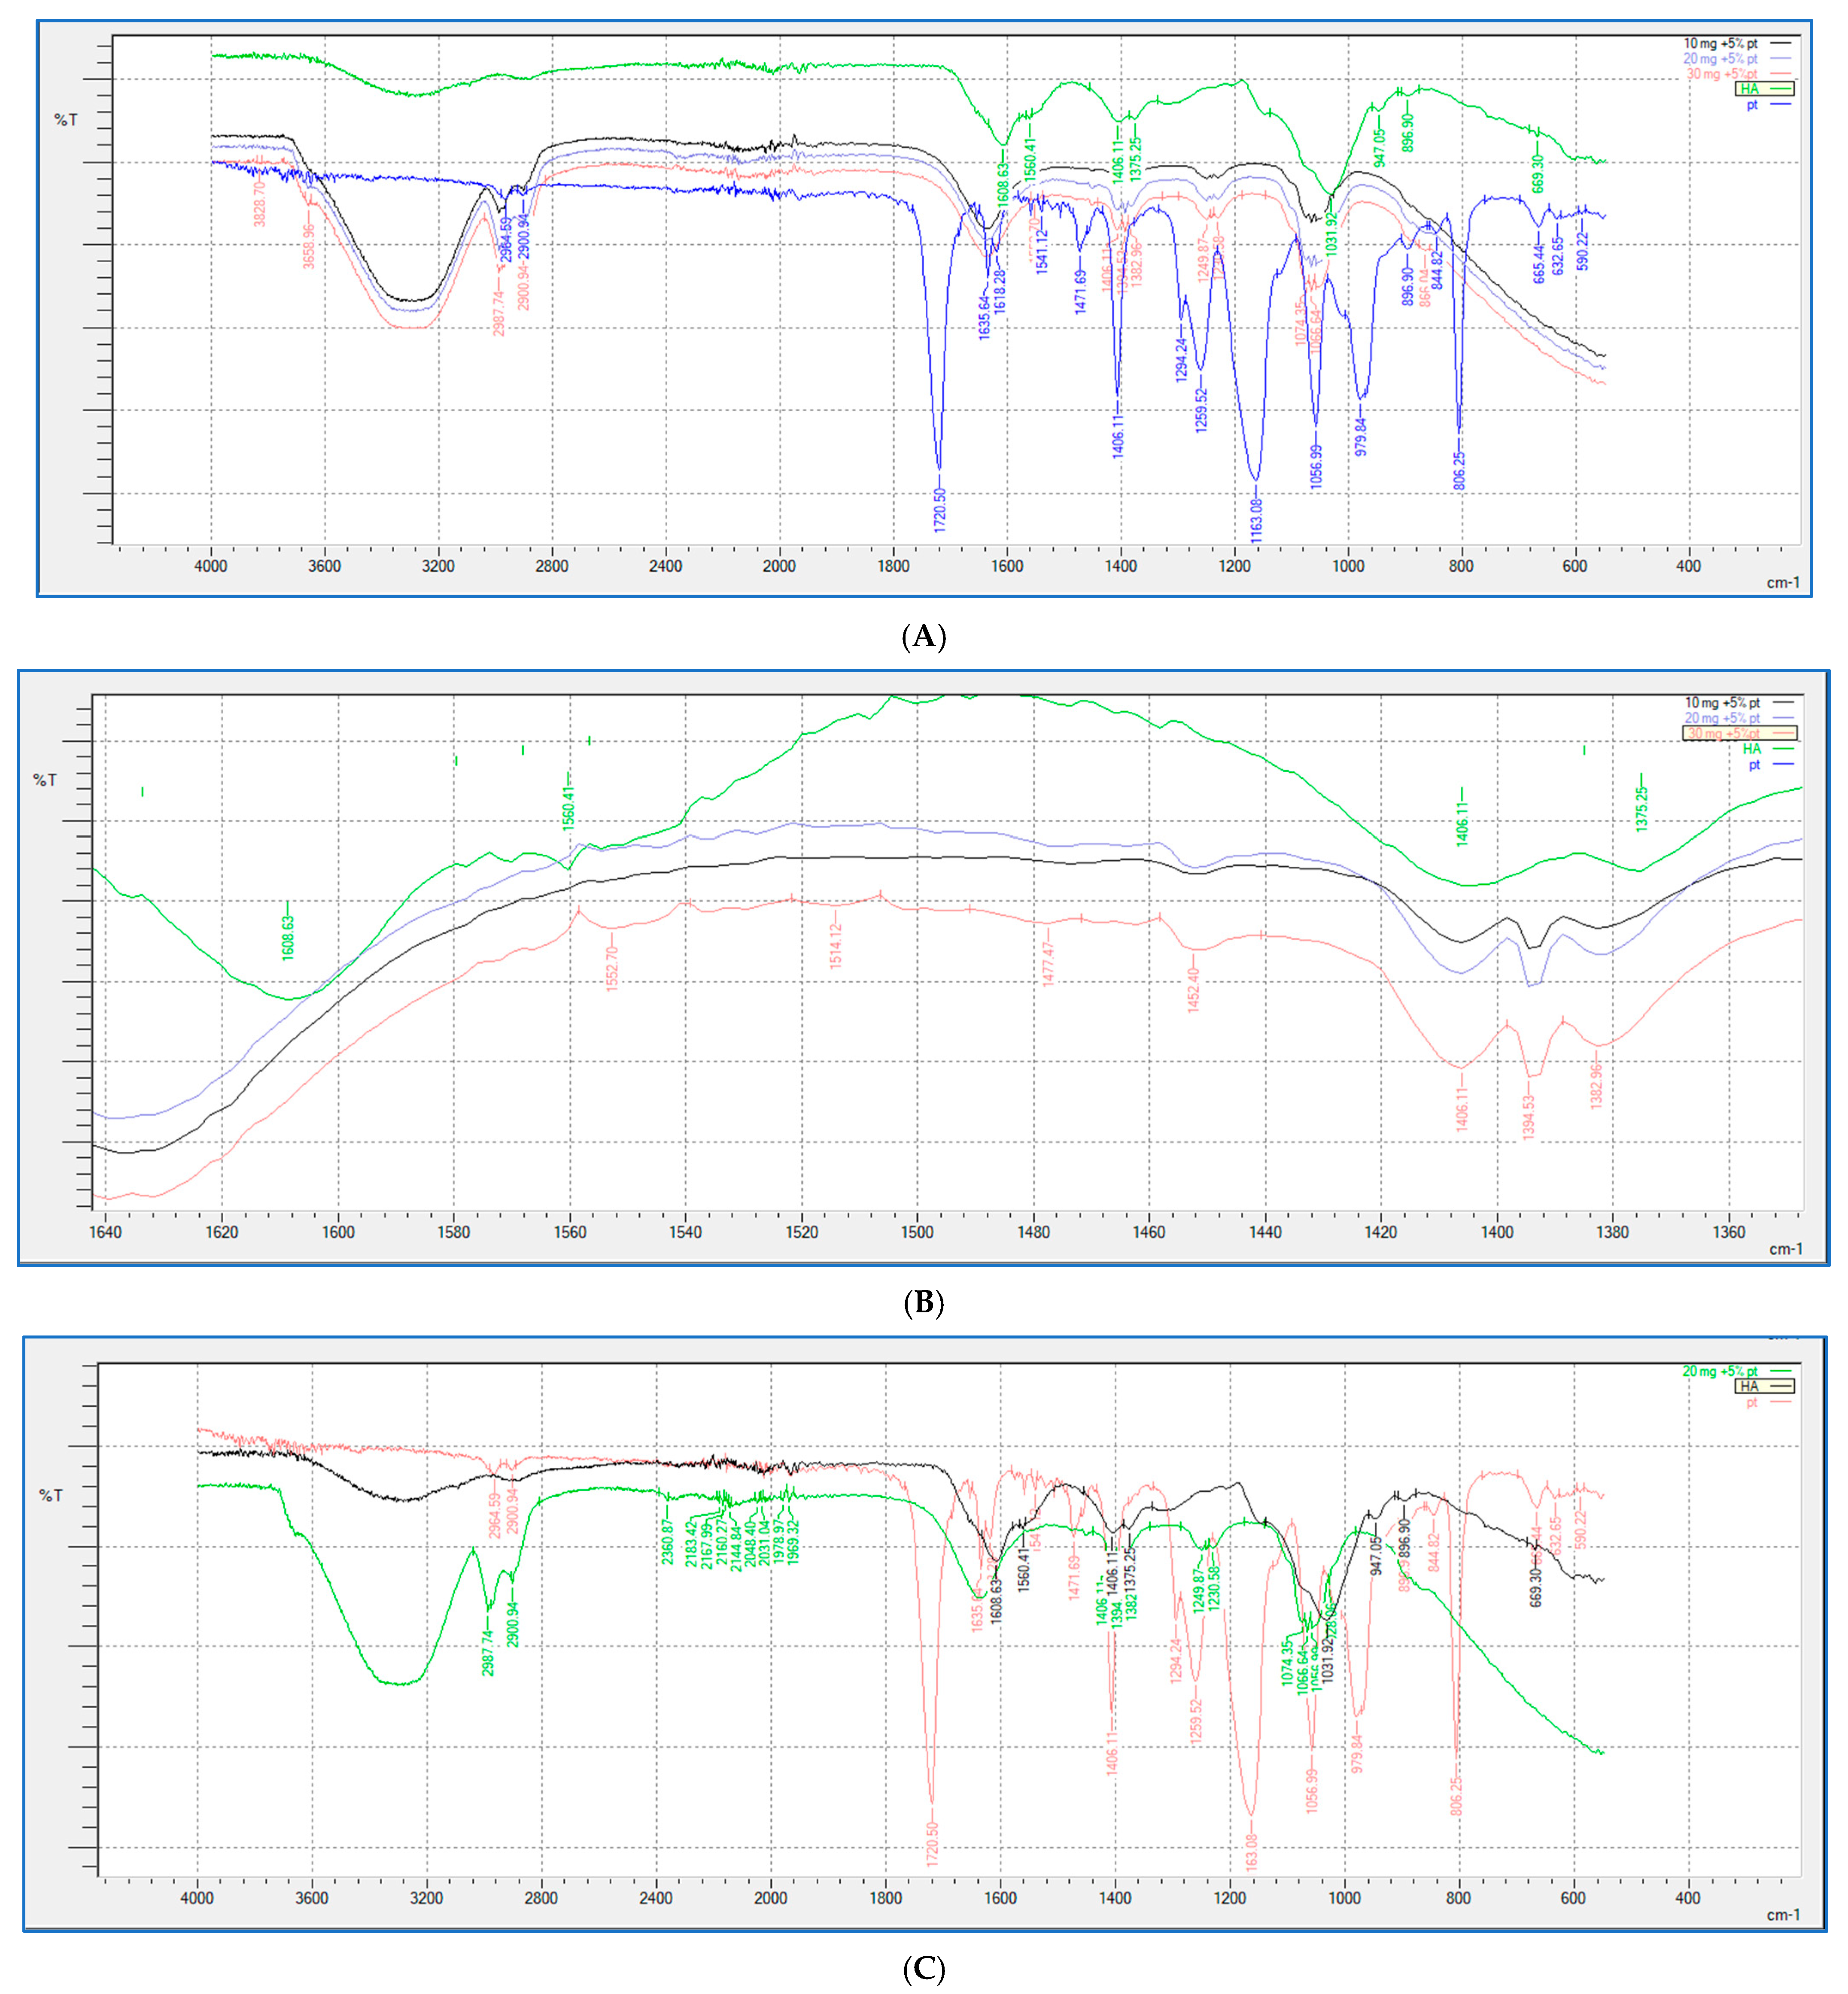
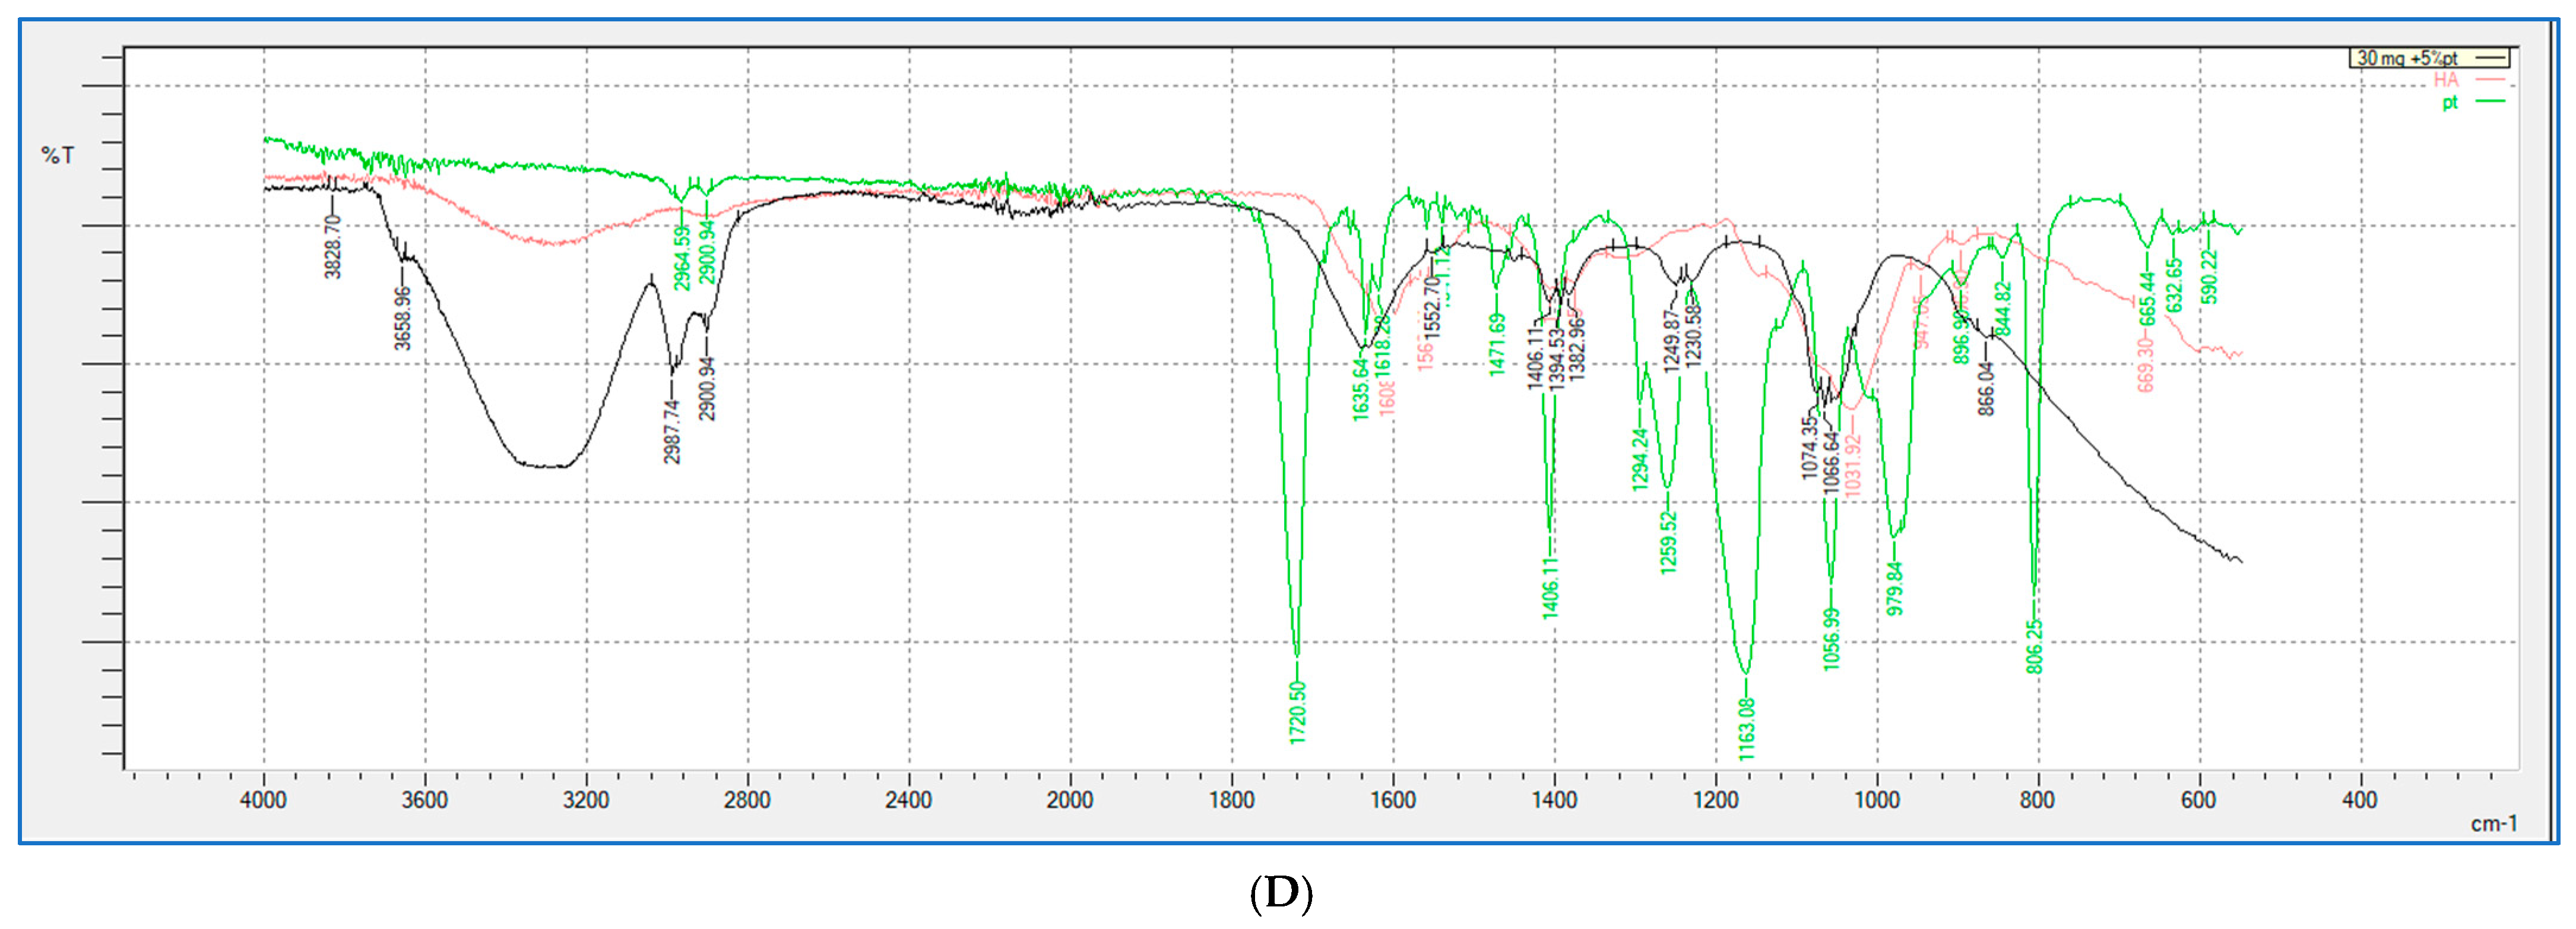
2.5. FTIR Study
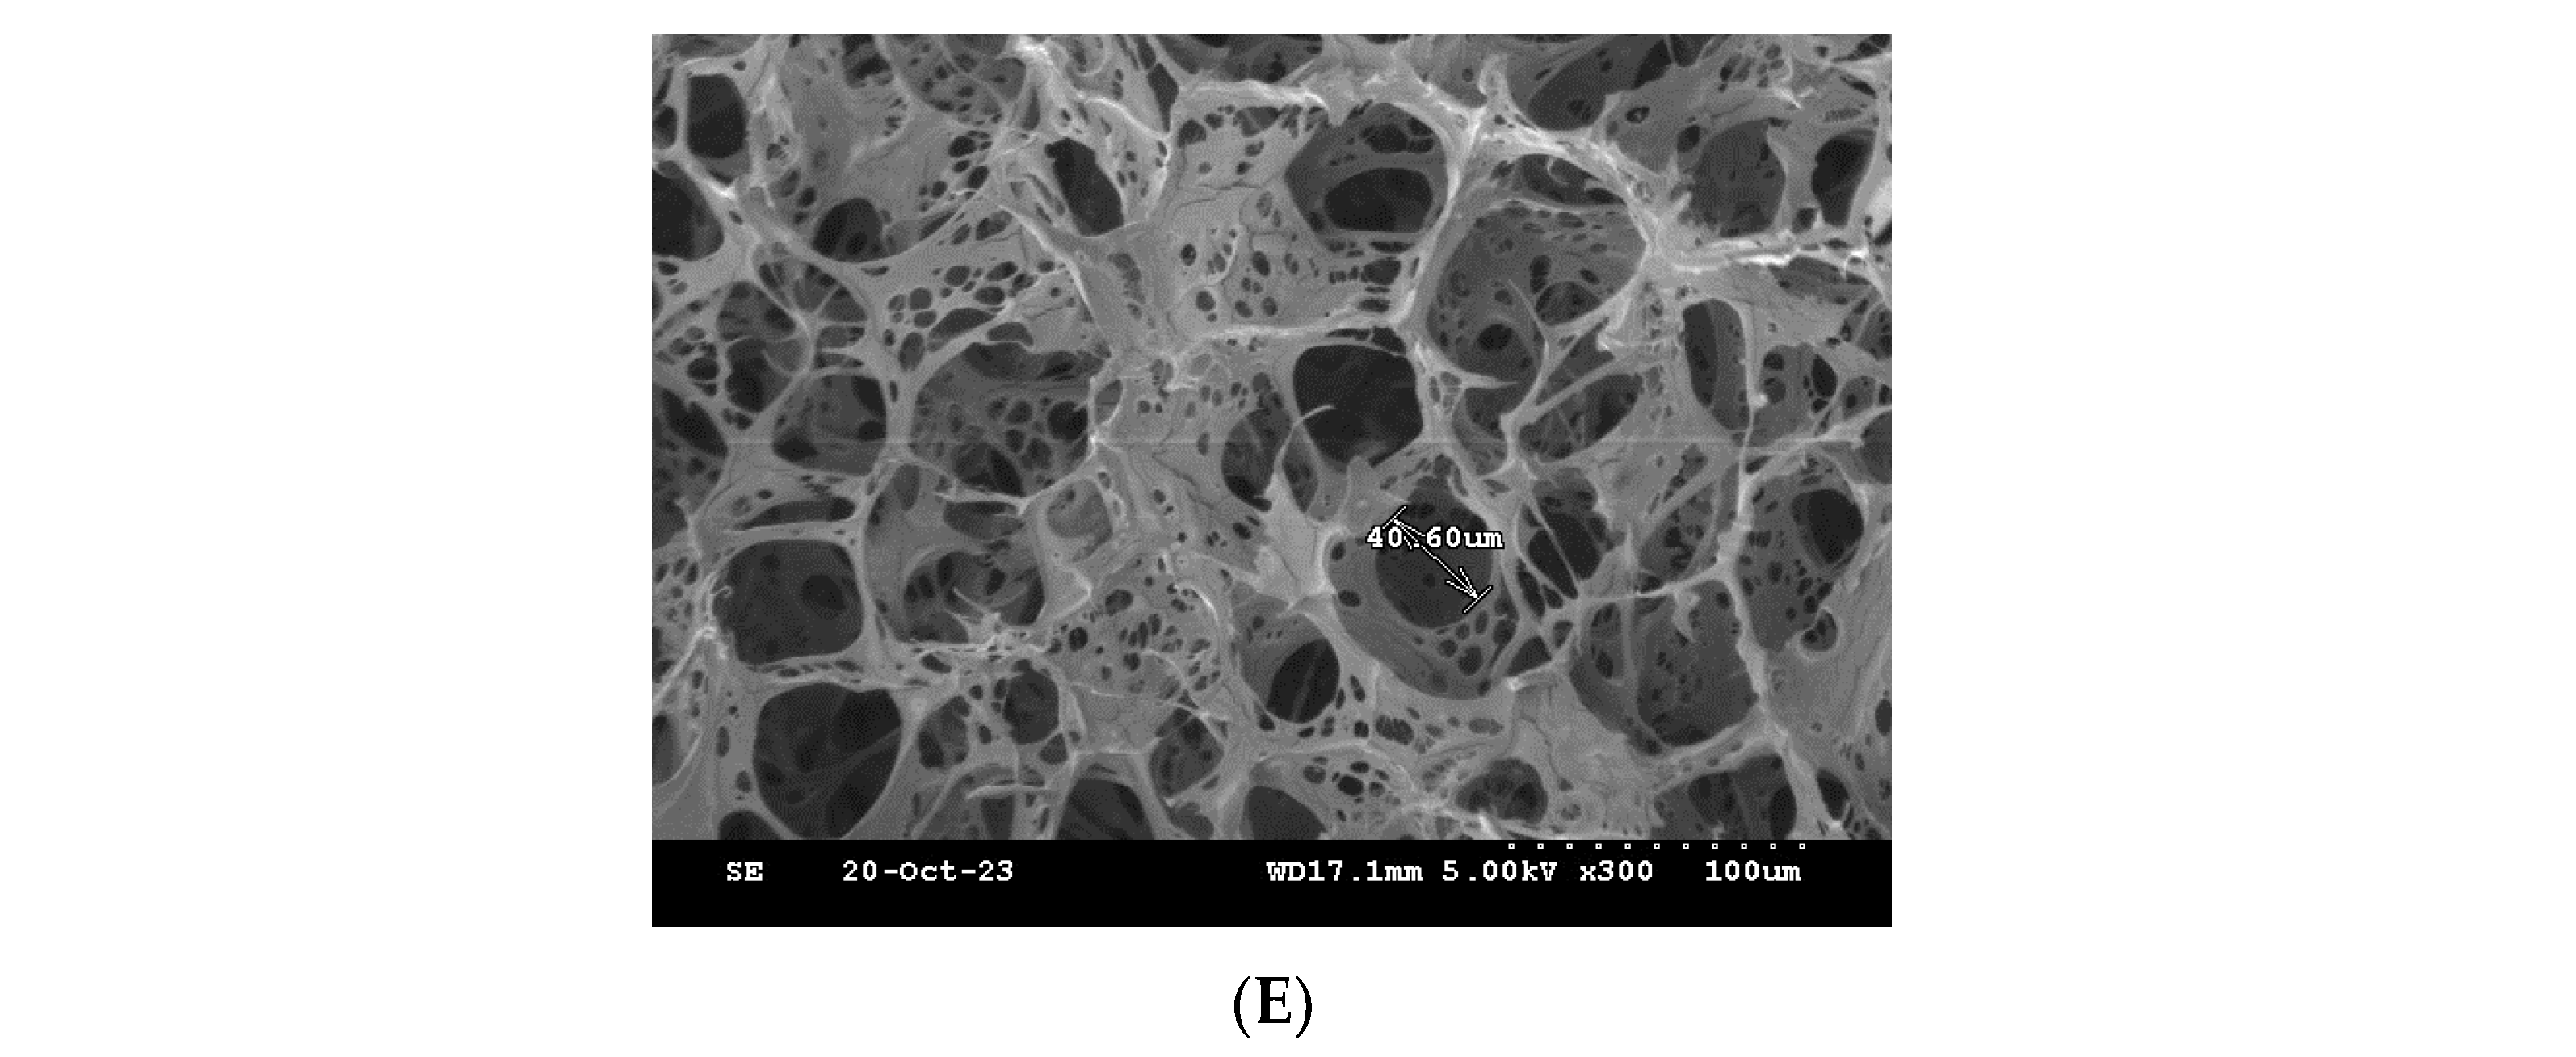
2.6. SEM
2.7. GC Analysis of the Residual Crosslinker on the Novel Injectable Hydrogel/Filler Formulations
2.7.1. Overview of the Crosslinker
2.7.2. Gas Chromatography Method
Response Linearity
Precision
Accuracy
Sensitivity
Robustness
3. Conclusions
4. Materials and Methods
4.1. Materials and Chemicals
4.2. Synthesis of the HA-PT Injectable Hydrogel/Filler Formulations
4.3. Crosslinking Experiment
4.4. Rheological Properties Study of the Injectable Hydrogel/Filler Formulations
4.5. Freeze Drying
4.6. Swelling Study
4.6.1. Centrifuging of the Swelled Gel Samples
4.6.2. Swelling Study to Freeze-Dried Samples
4.7. Fourier-Transform Infrared Spectroscopy (FT-IR)
4.8. SEM
4.9. Residual Crosslinker (PT) Analysis in the Injectable Hydrogel/Filler Formulations
4.9.1. Gas Chromatography Analysis
4.9.2. Internal Standard Solution
4.9.3. Standard Solutions and the Calibration Curve
4.9.4. Sample Preparation for Extraction
- Directly using the jelly injectable hydrogel/filler formulations.
- Using freeze-dried samples for PT extraction.
4.10. Statistical Analysis
Author Contributions
Funding
Institutional Review Board Statement
Informed Consent Statement
Data Availability Statement
Acknowledgments
Conflicts of Interest
References
- Faivre, J.; Pigweh, A.I.; Iehl, J.; Maffert, P.; Goekjian, P.; Bourdon, F. Crosslinking hyaluronic acid soft-tissue fillers: Current status and perspectives from an industrial point of view. Expert. Rev. Med. Devices 2021, 18, 1175–1187. [Google Scholar] [CrossRef] [PubMed]
- Wongprasert, P.; Dreiss, C.A.; Murray, G. Evaluating hyaluronic acid dermal fillers: A critique of current characterization methods. Dermatol. Ther. 2022, 35, e15453. [Google Scholar] [CrossRef] [PubMed]
- Holland, E. Marquardt’s Phi mask: Pitfalls of relying on fashion models and the golden ratio to describe a beautiful face. Aesthetic Plast. Surg. 2008, 32, 200–208. [Google Scholar] [CrossRef] [PubMed]
- Guinot, C.; Malvy, D.J.M.; Ambroisine, L.; Latreille, J.; Mauger, E.; Tenenhaus, M.; Morizot, F.; Lopez, S.; Le Fur, I.; Tschachler, E. Relative contribution of intrinsic vs extrinsic factors to skin aging as determined by a validated skin age score. Arch. Dermatol. 2002, 138, 1454–1460. [Google Scholar] [CrossRef] [PubMed]
- Bukhari, S.N.A.; Roswandi, N.L.; Waqas, M.; Habib, H.; Hussain, F.; Khan, S.; Sohail, M.; Ramli, N.A.; Thu, H.E.; Hussain, Z. Hyaluronic acid, a promising skin rejuvenating biomedicine: A review of recent updates and pre-clinical and clinical investigations on cosmetic and nutricosmetic effects. Int. J. Biol. Macromol. 2018, 120 Pt B, 1682–1695. [Google Scholar] [CrossRef]
- Rana, D.; Desai, N.; Salave, S.; Karunakaran, B.; Giri, J.; Benival, D.; Gorantla, S.; Kommineni, N. Collagen-Based Hydrogels for the Eye: A Comprehensive Review. Gels 2023, 9, 643. [Google Scholar] [CrossRef] [PubMed]
- Omidian, H.; Chowdhury, S.D. Advancements and Applications of Injectable Hydrogel Composites in Biomedical Research and Therapy. Gels 2023, 9, 533. [Google Scholar] [CrossRef] [PubMed]
- Li, A.; Ma, B.; Hua, S.; Ping, R.; Ding, L.; Tian, B.; Zhang, X. Chitosan-based injectable hydrogel with multifunction for wound healing: A critical review. Carbohydr. Polym. 2024, 333, 121952. [Google Scholar] [CrossRef] [PubMed]
- Andrade del Olmo, J.; Pérez-Álvarez, L.; Sáez Martínez, V.; Benito Cid, S.; Pérez González, R.; Vilas-Vilela, J.L.; Alonso, J.M. Drug Delivery from Hyaluronic Acid-BDDE Injectable Hydrogels for Antibacterial and Anti-Inflammatory Applications. Gels 2022, 8, 223. [Google Scholar] [CrossRef]
- Lee, J.H. Injectable hydrogels delivering therapeutic agents for disease treatment and tissue engineering. Biomater. Res. 2018, 22, 27. [Google Scholar] [CrossRef]
- Pérez, L.A.; Hernández, R.; Alonso, J.M.; Pérez-González, R.; Sáez-Martínez, V. Hyaluronic Acid Hydrogels Crosslinked in Physiological Conditions: Synthesis and Biomedical Applications. Biomedicines 2021, 9, 1113. [Google Scholar] [CrossRef]
- Lee, Y.; Chung, H.J.; Yeo, S.; Ahn, C.H.; Lee, H.; Messersmith, P.B.; Park, T.G. Thermo-sensitive, injectable, and tissue adhesive sol–gel transition hyaluronic acid/pluronic composite hydrogels prepared from bio-inspired catechol-thiol reaction. Soft Matter 2010, 6, 977–983. [Google Scholar] [CrossRef]
- Di Mola, A.; Landi, M.R.; Massa, A.; D’Amora, U.; Guarino, V. Hyaluronic Acid in Biomedical Fields: New Trends from Chemistry to Biomaterial Applications. Int. J. Mol. Sci. 2022, 23, 14372. [Google Scholar] [CrossRef]
- Necas, J.B.L.B.P.; Bartosikova, L.; Brauner, P.; Kolar, J.J.V.M. Hyaluronic acid (hyaluronan): A review. Vet. Med. 2018, 53, 397–411. [Google Scholar] [CrossRef]
- Ferguson, E.L.; Roberts, J.L.; Moseley, R.; Griffiths, P.C.; Thomas, D.W. Evaluation of the physical and biological properties of hyaluronan and hyaluronan fragments. Int. J. Pharm. 2011, 420, 84–92. [Google Scholar] [CrossRef] [PubMed]
- Rashid, F.; Albayati, M.; Dodou, K. Studies on Novel Methods for Formulating Novel Cross-Linked Hydrogel Films of Hyaluronic Acid. Cosmetics 2019, 6, 59. [Google Scholar] [CrossRef]
- Papakonstantinou, E.; Roth, M.; Karakiulakis, G. Hyaluronic acid: A key molecule in skin aging. Dermatoendocrinol 2012, 4, 253–258. [Google Scholar] [CrossRef]
- Bravo, B.; Correia, P.; Gonçalves Junior, J.E.; Sant’Anna, B.; Kerob, D. Benefits of topical hyaluronic acid for skin quality and signs of skin aging: From literature review to clinical evidence. Dermatol. Ther. 2022, 35, e15903. [Google Scholar] [CrossRef]
- Ström, A.; Larsson, A.; Okay, O. Preparation and physical properties of hyaluronic acid-based cryogels. J. Appl. Polym. Sci. 2015, 132, e15903. [Google Scholar] [CrossRef]
- Al-Sibani, M.; Al-Harrasi, A.; Rhh, N. Characterization of Linear and Chemically Cross-linked Hyaluronic acid using Various Analytical Techniques Including FTIR, ESI-MS, H1 NMR, and SEM. J. Biochem. Anal. Stud. 2018, 3, 1–8. [Google Scholar]
- Snetkov, P.; Zakharova, K.; Morozkina, S.; Olekhnovich, R.; Uspenskaya, M. Hyaluronic Acid: The Influence of Molecular Weight on Structural, Physical, Physico-Chemical, and Degradable Properties of Biopolymer. Polymers 2020, 12, 1800. [Google Scholar] [CrossRef] [PubMed]
- Rashid, F.; Childs, S.; Dodou, K. Comparison of Analytical Methods for the Detection of Residual Crosslinker in Hyaluronic Acid Hydrogel Films. Cosmetics 2023, 10, 70. [Google Scholar] [CrossRef]
- Rashid, F.; Albayati, M.; Dodou, K. Novel Crosslinked HA Hydrogel Films for the Immediate Release of Active Ingredients. Cosmetics 2023, 10, 6. [Google Scholar] [CrossRef]
- Pentaerythritol Tetraacrylate; Toronto Research Chemicals: North York, ON, Canada. Available online: https://pubchem.ncbi.nlm.nih.gov/compound/Pentaerythritol-tetraacrylate (accessed on 20 April 2024).
- Song, J.; Chen, H. Preparation of aroma microcapsules with sodium alginate and tetradecylallyldimethylammonium bromide (TADAB) and its potential applications in cosmetics. Flavour. Fragr. J. 2018, 33, 160–165. [Google Scholar] [CrossRef]
- Doytcheva, M.; Dotcheva, D.; Stamenova, R.; Orahovats, A.; Tsvetanov, C.; Leder, J. Ultraviolet-induced crosslinking of solid poly(ethylene oxide). J. Appl. Polym. Sci. 1997, 64, 2299–2307. [Google Scholar] [CrossRef]
- Sadamori, S.; Shigeto, N.; Hamada, T.; Okuda, K. A method of determining residual monomer in acrylic resin using methyl ethyl ketone. Aust. Dent. J. 1990, 35, 509–513. [Google Scholar] [CrossRef] [PubMed]
- Dadsetan, M.; Liu, Z.; Pumberger, M.; Giraldo, C.V.; Ruesink, T.; Lu, L.; Yaszemski, M.J. A stimuli-responsive hydrogel for doxorubicin delivery. Biomaterials 2010, 31, 8051–8062. [Google Scholar] [CrossRef] [PubMed]
- Wong, R.S.H.; Ashton, M.; Dodou, K. Analysis of residual crosslinking agent content in UV cross-linked poly(ethylene oxide) hydrogels for dermatological application by gas chromatography. J. Pharm. Anal. 2016, 6, 307–312. [Google Scholar] [CrossRef] [PubMed]
- Moad, G.; Chiefari, J.; Mayadunne, R.T.; Moad, C.L.; Postma, A.; Rizzardo, E.; Thang, S.H. Initiating free radical polymerization. Macromol. Symp. 2002, 182, 65–80. [Google Scholar] [CrossRef]
- Luo, Z.; Wang, Y.; Xu, Y.; Wang, J.; Yu, Y. Modification and crosslinking strategies for hyaluronic acid-based hydrogel biomaterials. Smart Med. 2023, 2, e20230029. [Google Scholar] [CrossRef]
- Pirman, T.; Ocepek, M.; Likozar, B. Radical Polymerization of Acrylates, Methacrylates, and Styrene: Biobased Approaches, Mechanism, Kinetics, Secondary Reactions, and Modeling. Ind. Eng. Chem. Res. 2021, 60, 9347–9367. [Google Scholar] [CrossRef]
- Alonso, J.M.; Andrade del Olmo, J.; Perez Gonzalez, R.; Saez-Martinez, V. Injectable Hydrogels: From Laboratory to Industrialization. Polymers 2021, 13, 650. [Google Scholar] [CrossRef] [PubMed]
- Kang, L.; Sun, C.; Liu, H.; Liu, B. Determination of Frequency-Dependent Shear Modulus of Viscoelastic Layer via a Constrained Sandwich Beam. Polymers 2022, 14, 3751. [Google Scholar] [CrossRef] [PubMed]
- Bair, S.; Yamaguchi, T.; Brouwer, L.; Schwarze, H.; Vergne, P.; Poll, G. Oscillatory and steady shear viscosity: The Cox–Merz rule, superposition, and application to EHL friction. Tribol. Int. 2014, 79, 126–131. [Google Scholar] [CrossRef]
- Biehler, P. Rheometry Basics; Materials Charactriazation Lab, Materials Scine & Engineering; The University of Utah: Salt Lake City, UT, USA, 2024. [Google Scholar]
- Almawash, S.; Osman, S.K.; Mustafa, G.; El Hamd, M.A. Current and Future Prospective of Injectable Hydrogels—Design Challenges and Limitations. Pharmaceuticals 2022, 15, 371. [Google Scholar] [CrossRef] [PubMed]
- Lewandowska, K.; Sionkowska, A.; Grabska, S.; Michalska, M. Characterisation of chitosan/hyaluronic acid blend films modified by collagen. Prog. Chem. Appl. Chitin Its Deriv. 2017, XXII, 125–134. [Google Scholar] [CrossRef]
- Larrañeta, E.; Henry, M.; Irwin, N.J.; Trotter, J.; Perminova, A.A.; Donnelly, R.F. Synthesis and characterization of hyaluronic acid hydrogels crosslinked using a solvent-free process for potential biomedical applications. Carbohydr. Polym. 2018, 181, 1194–1205. [Google Scholar] [CrossRef] [PubMed]
- Ministry of Health, L.a.W.M., Ministry of the Environment (MOE). GHS Classification Results (Excel, HTML)|GHS Information|Chemical Management; National Institute of Technology and Evaluation (NITE): Tokyo, Japan, 2008.
- Nethercott, J.R. Skin problems associated with multifunctional acrylic monomers in ultraviolet curing inks. Br. J. Dermatol. 1978, 98, 541–552. [Google Scholar] [CrossRef] [PubMed]
- Björkner, B. The sensitizing capacity of multifunctional acrylates in the guinea pig. Contact Dermat. 1984, 11, 236–246. [Google Scholar] [CrossRef]
- Unwin, J. Development of an Analysis Method to Measure Airborne Acrylate in UV-Cured Motor Vehicle Repair Coatings; Health & Safety Laboratory, 2007; pp. 1–17. Available online: http://www.hsl.gov.uk/ (accessed on 20 April 2024).
- Hexyl Acrylate. Available online: https://www.sigmaaldrich.com/GB/en/sds/aldrich/408905 (accessed on 20 April 2024).
- Abdi, K.; Mandegari, A.; Amini, M.; Bagheri, M.; Geramipanah, F. Determination of Residual Methylmethacrylate Monomer in Denture Base Resins by Gas Chromatography. Iran. J. Pharm. Res. 2005, 4, 227–232. [Google Scholar]
- Craig, A.P.; Field, C.; Simpson, J. Development of a Gas Chromatography-Mass Spectrometry Method for the Quantification of Glucaric Acid Derivatives in Beverage Substrates. Int. J. Anal. Chem. 2014, 2014, 8. [Google Scholar] [CrossRef] [PubMed]
- Bernal, E.; Guo, X. Limit of Detection and Limit of Quantification Determination in Gas Chromatography. Adv. Gas. Chromatogr. 2014, 3, 57–81. [Google Scholar]
- European Medicines Agency. Note for Guidance on Validation of Analytical Procedures: Text and Methodology; CPMP/ICH/381/95; European Medicines Agency: Amsterdam, The Netherlands, 1995.
- Armbruster, D.A.; Tillman, M.D.; Hubbs, L.M. Limit of detection (LQD)/limit of quantitation (LOQ): Comparison of the empirical and the statistical methods exemplified with GC-MS assays of abused drugs. Clin. Chem. 1994, 40 Pt 1, 1233–1238. [Google Scholar] [CrossRef] [PubMed]
- Krupčík, J.; Májek, P.; Gorovenko, R.; Blaško, J.; Kubinec, R.; Sandra, P. Considerations on the determination of the limit of detection and the limit of quantification in one-dimensional and comprehensive two-dimensional gas chromatography. J. Chromatogr. A 2015, 1396, 117–130. [Google Scholar] [CrossRef]
- Mackenzie, D. Determining Concentration by Weight and by Volume—Application to Polymer Quenchants; Houghton International Inc.: Valley Forge, PA, USA, 2014. [Google Scholar]


| Formulations | Elastic Modulus G′ (Pa) | Viscous Modulus G″ (Pa) | Mean Shear Stress (Pa) in LVR Amplitude Sweep | Shear Viscosity Complex Component η* (Pa s) |
|---|---|---|---|---|
| HA-PT 1 | 8789.88 (±50.62) | 4561.09 (±231.43) | 0.8968 (±0.03) | 523.48 (±18.35) |
| HA-PT 2 | 33,587.49 (±859.68) | 48,154.24 (±754.55) | 5.0562 (±0.76) | 558.44 (±32.22) |
| HA-PT 3 | 16,577.38 (±1006.46) | 17,493.79 (±989.99) | 1.9533 (±0.23) | 3380.83 (±222.48) |
| HA-PT 4 | 24,547.31 (±984.54) | 24,905.16 (±1500.26) | 2.2613 (±0.21) | 712.41 (±7.65) |
| HA-PT 5 | 6591.36 (±232.28) | 4268.307 (±58.26) | 0.5042 (±0.01) | 2807.13 (±70.37) |
| Formulations | Elastic Modulus G′ (Pa) | Viscous Modulus G″ (Pa) | Mean Shear Stress (Pa) in LVR Amplitude Sweep | Shear Viscosity Complex Component η* (Pa s) |
|---|---|---|---|---|
| HA-PT 1 | 9298.62 (±147.41) | 1270.76 (±146.77) | 1.1411 (±0.06) | 2.3993 (±0.37) |
| HA-PT 2 | 34,715.63 (±1321.29) | 40,004.39 (±262.82) | 4.4946 (±0.17) | 2.5922 (±0.18) |
| HA-PT 3 | 9313.16 (±8.88) | 2258.15 (±186.05) | 0.7983 (±0.04) | 24.5479 (±1.31) |
| HA-PT 4 | 13,714.86 (±8082.77) | 11,458.35 (±1053.20) | 1.5095 (±0.41) | 50.7569 (±22.01) |
| HA-PT 5 | 7678.64 (±313.98) | 1180.44 (±129.02) | 0.6255 (±0.03) | 22.9670 (±1.93) |
| Filler Formulations Names | HA Concentration Added (mg/mL) | The % w/w of PT in the Formulation | %w/w of the PT in HA |
|---|---|---|---|
| HA-PT 1 | 10 mg | 0.05% | 5% |
| HA-PT 2 | 20 mg | 0.05% | 5% |
| HA-PT 3 | 30 mg | 0.05% | 5% |
| HA-PT 4 | 20 mg | 0.1% | 10% |
| HA-PT 5 | 20 mg | 0.5% | 25% |
| Selected PT Concentrations (% w/w) | Peak Area Ratio % (Mean ± SD) Intra-Day Precision | RSD% | Peak Area Ratio % (Mean ± SD) Inter-Day Precision | RSD% |
|---|---|---|---|---|
| 0.000032 | 0.28 (±0.005) | 2.00 | 0.282 (±0.001) | 0.47 |
| 0.001000 | 12.04 (±0.238) | 1.98 | 13.095 (±0.875) | 6.68 |
| 0.016600 | 106.29 (±7.071) | 6.66 | 110.304 (±1.870) | 1.70 |
| Mean | (3.54) | (2.95) |
| Selected PT Concentrations Added % w/w (Spike) | Blank Sample Concentration % w/w | Recovered Concentration % w/w | % Recovery (Accuracy) | %RSD |
|---|---|---|---|---|
| 0.0166 | 0.00014 | 0.01553 | 92.75 (± 0.51) | 0.56 |
| 0.00833 | 0.00014 | 0.0078 | 92.05 (± 1.52) | 1.65 |
| 0.00103 | 0.00014 | 0.001 | 90.35 (± 0.08) | 0.09 |
| Mean | 91.72 | 0.77 |
| Sensitivity Parameters | PT Concentration % w/w | Signal of Noise N/S (±SD) | RSD% |
|---|---|---|---|
| LOD | 0.000032 | 3.13 (± 0.05) | 1.84% |
| LOQ | 0.000130 | 19.93 (± 0.11) | 0.57% |
| Different Parameters | PT Concentration % w/w | Peak Area Ratio Mean ± SD | % RSD |
|---|---|---|---|
| No variation applied | 0.00833 | 0.988 ± 0.0042 | 0.426 |
| 0.00026 | 0.025 ± 0.0006 | 2.536 | |
| 0.00013 | 0.014 ± 0.0004 | 3.274 | |
| Detector temperature (+5) | 0.00833 | 0.654 ± 0.0316 | 4.841 |
| 0.00026 | 0.022 ± 0.0005 | 2.522 | |
| 0.00013 | 0.0140 ± 0.0005 | 4.151 | |
| Detector temperature (−5) | 0.00833 | 0.689 ± 0.0189 | 2.754 |
| 0.00026 | 0.0208 ± 0.0000 | 0.108 | |
| 0.00013 | 0.0126 ± 0.0003 | 2.939 | |
| Oven temperature (+5) | 0.00833 | 0.709 ± 0.0266 | 3.761 |
| 0.00026 | 0.0215 ± 0.0002 | 1.285 | |
| 0.00013 | 0.1341 ± 0.0002 | 1.827 | |
| Oven temperature (−5) | 0.00833 | 0.7061 ± 0.0183 | 2.596 |
| 0.00026 | 0.0235 ± 0.0001 | 0.554 | |
| 0.00013 | 0.0139 ± 0.0003 | 2.725 | |
| Flow rate (+10) | 0.00833 | 0.6839 ± 0.0137 | 2.011 |
| 0.00026 | 0.0230 ± 0.0003 | 1.329 | |
| 0.00013 | 0.0134 ± 0.0002 | 1.827 | |
| Flow rate (−10) | 0.00833 | 0.7720 ± 0.014 | 1.859 |
| 0.00026 | 0.0237 ± 0.0003 | 1.636 | |
| 0.00013 | 0.0139 ± 0.0004 | 2.908 | |
| Mean | (2.294) |
| Injectable Hydrogel/Filler Formulation Samples | PT Concentration % w/w with GC in the Samples | Acceptance of the PT Concentration ˂ 0.008% w/w |
|---|---|---|
| Freeze-dried Samples | ||
| HA-PT 1 | 0.000093 * 0.000120 * 0.000123 * Mean 0.00011 SD (± 0.000018) | Accepted |
| HA-PT 2 | Not detected | Accepted |
| HA-PT 3 | 0.000130 0.000141 0.000143 Mean = 0.000140 SD (±0.000007) | Accepted |
| HA-PT 4 | 0.000146 0.000136 0.000157 Mean 0.000150 SD (±0.000010) | Accepted |
| HA-PT 5 | 0.023402 0.024990 0.024730 Mean = 0.024370 SD (±0.008000) | Rejected |
| Direct Formulation Samples | ||
| HA-PT 1 | 0.000038 * 0.000040 * 0.000040 * Mean = 0.000040 * SD (±0.000001) | Accepted |
| HA-PT 2 | Not detected | Accepted |
| HA-PT 3 | 0.000060 * 0.000060 * 0.000070 * Mean = 0.000063 * SD (±0.000006) | Accepted |
| HA-PT 4 | 0.000022 * 0.000030 * 0.000036 * Mean = 0.00003 * SD (±0.000007) | Accepted |
| HA-PT 5 | 0.024948 0.026236 0.026103 Mean = 0.025760 SD (±0.000700) | Rejected |
Disclaimer/Publisher’s Note: The statements, opinions and data contained in all publications are solely those of the individual author(s) and contributor(s) and not of MDPI and/or the editor(s). MDPI and/or the editor(s) disclaim responsibility for any injury to people or property resulting from any ideas, methods, instructions or products referred to in the content. |
© 2024 by the authors. Licensee MDPI, Basel, Switzerland. This article is an open access article distributed under the terms and conditions of the Creative Commons Attribution (CC BY) license (https://creativecommons.org/licenses/by/4.0/).
Share and Cite
Rashid, F.; Carter, P.; Childs, S. Novel Injectable Hydrogel Formulations and Gas Chromatography Analysis of the Residual Crosslinker in Formulations Intended for Pharmaceutical and Cosmetic Applications. Gels 2024, 10, 280. https://doi.org/10.3390/gels10040280
Rashid F, Carter P, Childs S. Novel Injectable Hydrogel Formulations and Gas Chromatography Analysis of the Residual Crosslinker in Formulations Intended for Pharmaceutical and Cosmetic Applications. Gels. 2024; 10(4):280. https://doi.org/10.3390/gels10040280
Chicago/Turabian StyleRashid, Fatimah, Paul Carter, and Stephen Childs. 2024. "Novel Injectable Hydrogel Formulations and Gas Chromatography Analysis of the Residual Crosslinker in Formulations Intended for Pharmaceutical and Cosmetic Applications" Gels 10, no. 4: 280. https://doi.org/10.3390/gels10040280