Article

An Experimental Study of Pulsatile Flow in a Compliant Aortic Root Model under Varied Cardiac Outputs

Department of Mechanical Engineering, North Dakota State University, Fargo, ND 58108, USA
*
Author to whom correspondence should be addressed.
Fluids 2018, 3(4), 71; https://doi.org/10.3390/fluids3040071
Submission received: 27 July 2018 / Revised: 15 September 2018 / Accepted: 29 September 2018 / Published: 4 October 2018
(This article belongs to the Special Issue Cardiovascular Flows)

Abstract

:
The fluid dynamics of a natural aortic valve are complicated due to the highly pulsatile flow conditions, the compliant wall boundaries, and the sophisticated geometry of the aortic root. In the present study, a pulsatile flow simulator was constructed and utilized to investigate the turbulent characteristics and structural deformation of an intact silicone aortic root model under different flow inputs. Particle image velocimetry and high-frequency pressure sensors were combined to gather the pulsatile flow field information. The results demonstrated the distributions and the variations of the jet flow structures at different phases of a cardiac cycle. High turbulence kinetic energy was observed after the peak systole phase when the flow started to decelerate. Deformations of the aortic root upstream and downstream of the valve leaflets under normal boundary conditions were summarized and found to be comparable to results from clinical studies. The cardiac output plays an important role in determining the strength of hemodynamic and structural responses. A reduction in cardiac outputs resulted in a lower post-systole turbulence, smaller circumferential deformation, a smaller geometric orifice area, and a shortened valve-opening period.

1. Introduction

Valvular heart diseases affect more than 1.5 million people in the United States. In particular, the aortic valve diseases, including calcification, stenosis, and regurgitation, are among the most prevalent [1], and are also considered significant predisposing factors for many other cardiovascular diseases such as aortic aneurysm, thromboembolism, and stroke [2]. Each year, approximately 300,000 patients go through either percutaneous surgeries or transcatheter aortic valve replacement procedures [3] to replace calcified aortic valves [4]. However, the clinical outcomes of valve replacements are still far from satisfactory. Patients with replacement valves suffer from a 14% chance of recurrence of regurgitation and more than a 60% risk of death in five years [4]. These statistics clearly demonstrate that aortic hemodynamics are of paramount significance for human cardiovascular health. An improved understanding of the fluid and structural dynamics in the real aortic root geometry is critical in order to enhance clinical outcomes and future prosthetic valve designs.
In recent years, experimental studies based on particle image velocimetry (PIV) have emerged as an important alternative approach in cardiovascular hemodynamics research. PIV studies on physiological phantoms provide reliable flow simulations resembling the in vivo flow from magnetic resonance imaging (MRI) [5] and help set benchmarks for patient-specific computational fluid dynamic (CFD) simulations [6]. Over the past decades, in vitro experimental studies have contributed to the knowledge of hemodynamics within the soft-tissue organs, such as heart and other vascular systems [7,8,9,10,11], and the evaluation and validation of cardiovascular assist devices [12,13]. Hemodynamics in arterial diseases, such as thoracic and abdominal aortic aneurysms, have also been extensively studied using PIV.
The hemodynamics of the aortic replacement valves have been a focus of experimental and fluid visualization studies in the past two decades. Lim et al. [14] investigated the fluid dynamics in four prosthetic mechanical valves under steady flow conditions using PIV measurements. Ge et al. [15] performed both PIV experiments and computational fluid dynamics simulations of the steady-state flow past a fully open bi-leaflet mechanical valve. Similar research on the mechanical valves has also been conducted under pulsatile flow conditions [16]. By comparing PIV results and direct numerical simulations, Dasi et al. [17] revealed the sophisticated vortical flow characteristics of the pulsatile flow at different phases through a rigid bi-leaflet mechanical valve. Bellofiore and Quinlan [18] performed PIV measurements of flow past a mechanical valve with significantly enhanced spatial and temporal resolutions, which enabled a Lagrangian analysis of blood cell trajectories and the platelet activation at different stages of the cardiac cycle. Through various in vitro experimental setups, researchers have also been able to analyze other biomedical indicators, e.g., energy loss, to assess aortic stenosis and the performance of mechanical valves and stented valve prostheses [19,20,21].
Compared with mechanical valve replacements, compliant aortic valves, such as tissue-engineered bioprosthetic valves and polymeric valves, have soft leaflets that could result in better hemodynamics. The fluid dynamics and fluid-structure interaction (FSI) of bioprosthetics and native tissue aortic valves have been studied extensively in computational fluid dynamics and fluid-structure interaction simulations [22,23,24,25]. The dynamic responses of the soft valve leaflets under simulated physiological loadings have been studied by many finite element simulations [26,27]. In in vitro experimental studies, Leo et al. [28] assessed the fluid dynamic characteristics downstream of polymeric prosthetic valves through PIV measurements. Hasler et al. [29] performed tomographic PIV measurements on the pulsatile flow downstream of a negatively molded silicone aortic root model. Aortic valves with native tissues leaflets have also been studied through in vitro experiments to understand the changes in hemodynamics induced by morphological abnormalities, such as bicuspid aortic valves. Saikrishnan et al. [30] found that the turbulent kinetic energy and vorticity of the flow downstream of the valve were significantly increased in a bicuspid porcine tissue valve. McNally et al. [31] also studied the effects of the morphotype of bicuspid valves on the aortic hemodynamics in the aortic arch downstream using a benchtop simulator. Recently, in vitro studies also suggest that the sinuses of Valsalva (aortic sinus) play an important role in the regulation of the aortic hemodynamics. Pisani et al. [32] and Salica et al. [33] found that the presence of the sinuses of Valsalva increases the effective orifice area when the cardiac output increased, which helps minimize the flow energy loss during ejection.
However, most of the above-mentioned research addressed the hemodynamics of the artificial aortic valves, where the stented replacement valve models were placed into simplified or rigid tube models. The geometric complexity and compliance of the aortic root and the valve leaflets were seldom considered. Additionally, the effect of reduced flow rate or cardiac output (CO) on the aortic flow hemodynamics, which is often associated with the left ventricular systolic and diastolic dysfunctions [34], has not been extensively studied. The reduced CO is not a rare medical condition, and particularly the low cardiac output syndrome (LCOS) is the most common and serious complication associated with short and long-term mortality after cardiac surgeries [34,35], in which the cardiac index can be lower than 2.0 L/(min·m2). These research gaps result in a scarcity of important validation benchmark data for computational fluid dynamics and fluid-structure interaction simulations in realistic aortic root models.
In the present study, we investigated the fluid dynamics of a 1:1 scale silicone aortic root model with a realistic three-leaflet aortic valve based on an experimental cardiovascular flow simulator. The simulator was constructed as a closed flow loop driven by a programmable piston pump to simulate the natural flow waveforms, mimicking average human physiological features. The system, which was equipped with high-frequency pressure sensors, was then synchronized with a particle image velocimetry system to gather flow field data at different phases. The results were analyzed to obtain average flow information, ensemble turbulent characteristics, as well as the corresponding structural deformations. The results were then compared with those from experiments under varied cardiac outputs to generate insights on the impacts of this common variation of physiological boundary conditions.

2. Materials and Methods

2.1. The Cardiovascular Flow Simulator

The experiments have been conducted in a closed-loop flow circulation system, as shown in Figure 1. The pulsatile flow conditions were generated by a programmable pulsatile pump (PD-1100, BDC Laboratories, Wheat Ridge, CO, USA), which can be operated under arbitrary user-defined profiles with a frequency of two to 240 beats per minute (bpm), a stroke volume between 0–300 mL, and a flow rate between 0–10 L/min. A pump head module is customized to simulate the function of the left ventricle. Compliance chamber and resistance units were used downstream to maintain appropriate flow and pressure conditions for the tested model. A fluid reservoir is used to store the working circulating fluid and seed PIV tracer particles. Pressure transducers (BDC-PT, BDC laboratories, normal sensitivity: 5 µV/mmHg, < +/−1%, frequency response 5 kHz, operating pressure range −362 mmHg to 3878 mmHg) have been installed at multiple locations to monitor the pressure input inside the pump head and the pressure changes across the model. A silicone aortic root model was fixed in a transparent acrylic test section. The model was constructed (Figure 2, commercially obtained from BDC laboratories) by silicone molding based on a clinically scanned three-dimensional (3D) CAD model of a realistic aortic root. The model has an inner diameter of 25 mm and an average wall thickness of 2 mm. The average thickness of the leaflets is less than 1 mm, and they are tapered from the root to the tip. Under room temperature and low frequency (1-Hz) loading, the dynamical mechanical analysis of the material shows high elasticity (storage modulus 1.3 MPa) and low viscosity (loss modulus 0.086 MPa), suggesting that minimal energy dissipation will occur during deformation under the current cyclic loading. It should be noted that although the silicone model represents a certain degree of the compliant nature of the aortic root and valve leaflets, the material properties do not replicate those of the non-linear viscoelastic native tissues. Pressure transducers were implemented at two sides of the test section, which operates at a sampling frequency of 5 kHz, and the data was acquired through a LabView DAQ module (National Instruments, Austin, TX, USA).

2.2. Particle Image Velocimetry (PIV)

The quantitative flow parameters were measured by utilizing a phase-locked PIV system. A double-pulsed Nd:YAG laser (Gemini 200, New Wave Research, Inc., Fremont, CA, USA, 100 mJ, 532 nm) was used to illuminate the flow field. A set of spherical and cylindrical lenses were used to shape the two laser beams into a laser sheet with a thickness of 1 mm. A 2M-pixel CCD (charge-coupled device) camera (LaVision, Ypsilanti, MI, USA) was used with its axis perpendicular to the laser sheet to catch images of the model. The lasers and camera were connected to a delay generator that synchronizes these components. The PIV system is externally triggered by the pulsatile pump signal to capture phase-locked images. Instantaneous PIV velocity vectors were computed through cross-correlation, which involved successive frames of patterns of particle images in a multi-pass interrogation process from a window size of 32 × 32 to 16 × 16 pixels. An effective overlap of 50% was employed to satisfy the Nyquist criterion. The time-averaged quantities were obtained from a cinema sequence of 300 frames of instantaneous velocity fields for each case. In the present experiments, the field of view is set to be 65 mm by 45 mm, resulting a spatial scale of approximately 0.0375 mm per pixel. Therefore, the resolution of vector data based on the 16 × 16 pixels investigation windows is estimated to be 0.6 mm. The uncertainty factors affecting the PIV measurements are the optical error of the CCD camera and numerical error of the cross-correlation algorithm. The uncertainty of the PIV results in such an experimental setting is very low (approximately 0.2%) according to a similar study using the same LaVision CCD camera [30].
To minimize the optical distortion of the PIV results, a mixture of water–glycerin (40% and 60% respectively by volume) was used as the working fluid in this experiment. The refractive index (RI) of the fluid mixture measured by a digital refractometer was 1.43 under the room temperature, which matched the RI of the silicone model. The fluid mixture has a density of ρ = 1160 kg/m3 and a dynamic viscosity of μ = 0.012 Pa∙s. It should be noted that the non-Newtonian fluid properties were not considered in the present study. During the PIV experiments, the fluid was seeded with hollow glass microspheres with a seeding density of 0.1 ppm, which has been adopted by many previous experimental studies [15,36]. These particles were 10 μm in size, and of density at 1100 kg/m3, which was quite close to the density of the working liquid and results in a Stokes number that is much less than 1.

2.3. Test Conditions

In normal healthy population, the cardiac output (CO) varies from person to person due to aging. A significant reduction in CO could occur in relevant heart diseases, such as valvular stenosis, cardiac arrhythmia, and heart failure [37]. To study the effect of cardiac outputs on the flow and structure responses, three different flow rates, i.e. 4 L/min (normal), 2 L/min, and 1 L/min were tested in the present experiments, corresponding to a stoke volume of 66.7 mL, 33.3 mL, and 16.7 mL, respectively. In this experiment, a pressure waveform was generated by setting a 50% systolic duration (compression of the left ventricle) of a complete cardiac cycle. According to Sarnari et al. [38] and Chung et al. [39], the systole-to-diastole (S/D) ratio varies significantly among patients within different age, body surface area, and heart rate groups. Out of 752 patients from children to young adults [38], the S/D ratio ranges from 0.397 to 1.62, with a mean of 0.995 ± 0.23. Therefore, based on this clinical evidence, a 1:1 ratio sinusoidal wave (50% systole) has been used in many previous fluid dynamic studies [29,30]. In all of these tests, the heart rate was fixed at 60 beats per minute (bpm), i.e., one second between two heartbeats, to enable a better synchronization between the pump and the laser system.
Two non-dimensional parameters, i.e., the Womersley number and Reynolds number, are normally used to describe the periodicity and the dynamic similarity of physiological pulsatile flow in in vitro experiments. The Wo and peak Re are defined by:
  α = d a ω ρ / μ  
  R e = ρ d a u a / μ  
where d a is the diameter of the valve; u a represents the velocity of the maximum jet flow; ρ represents the density of the working liquid; μ is the dynamic viscosity; ω is the angular frequency of the pulsatile flow. The Wo and peak Re results from the present experimental conditions are listed in Table 1. The peak Re is 4370 for 4 L/min at the peak flow rate of a cycle, which is slightly lower than the normal range of peak Re for healthy subjects (around 4500–10,000 reported from different literatures, e.g. Stein [40] and Fung [41]) due to the current limitations of the setup. According to Trip et al. [42], when the mean Re is above 2500, the turbulent statistics of the pulsatile pipe flow become almost independent of Re and Wo. Therefore, many similar research studies using a moderately lower Re between 3000–4500 have all successfully captured the major characteristics of the pulsatile flow [25,29,43].
To evaluate the structure deformation under the pulsatile flow, two parameters, i.e., the area strain (AS) and geometric orifice area (GOA) were analyzed by digitizing the phase-averaged PIV raw images. The concept of AS is adapted from an in vivo clinical study of aortic valve [44], which quantifies the deformation of the aortic root wall based on the following equations:
A S = ( d m a x 2 d m i n 2 ) / d m i n 2 ,
where d m a x and d m i n represent the maximum and minimum diameters during a cardiac cycle for a specific cross-section. Specifically, AS was quantified at three sites, i.e., aortic annulus, sinus, and sinotubular junction, as shown in Figure 3a. The GOA can be estimated by calculating the area of an assumed triangular-shape opening, which is defined as:
  G O A = 9 3 16 L 2  
where L represents the length of the orifice in the investigated two-dimensional plane, which can be seen in Figure 3b. It should be noted that the GOA does not stand for the exact opening area due to the two-dimensionality of the measurements, but rather serves as a close estimate. Both the diameters and orifice length were measured manually using a computer image digitizer from the raw PIV images. The uncertainty of these calculations is estimated to be within 10% based on the limited temporal resolution of the measured PIV image data, which is calculated based on the standard deviation from many digitized data in a single phase. Since the phase-locked results do not fully resolve the temporal variations, the current calculations regarding structural deformation only served as an estimation of the quantitative trend as a function of varied flow conditions.

3. Results and Discussion

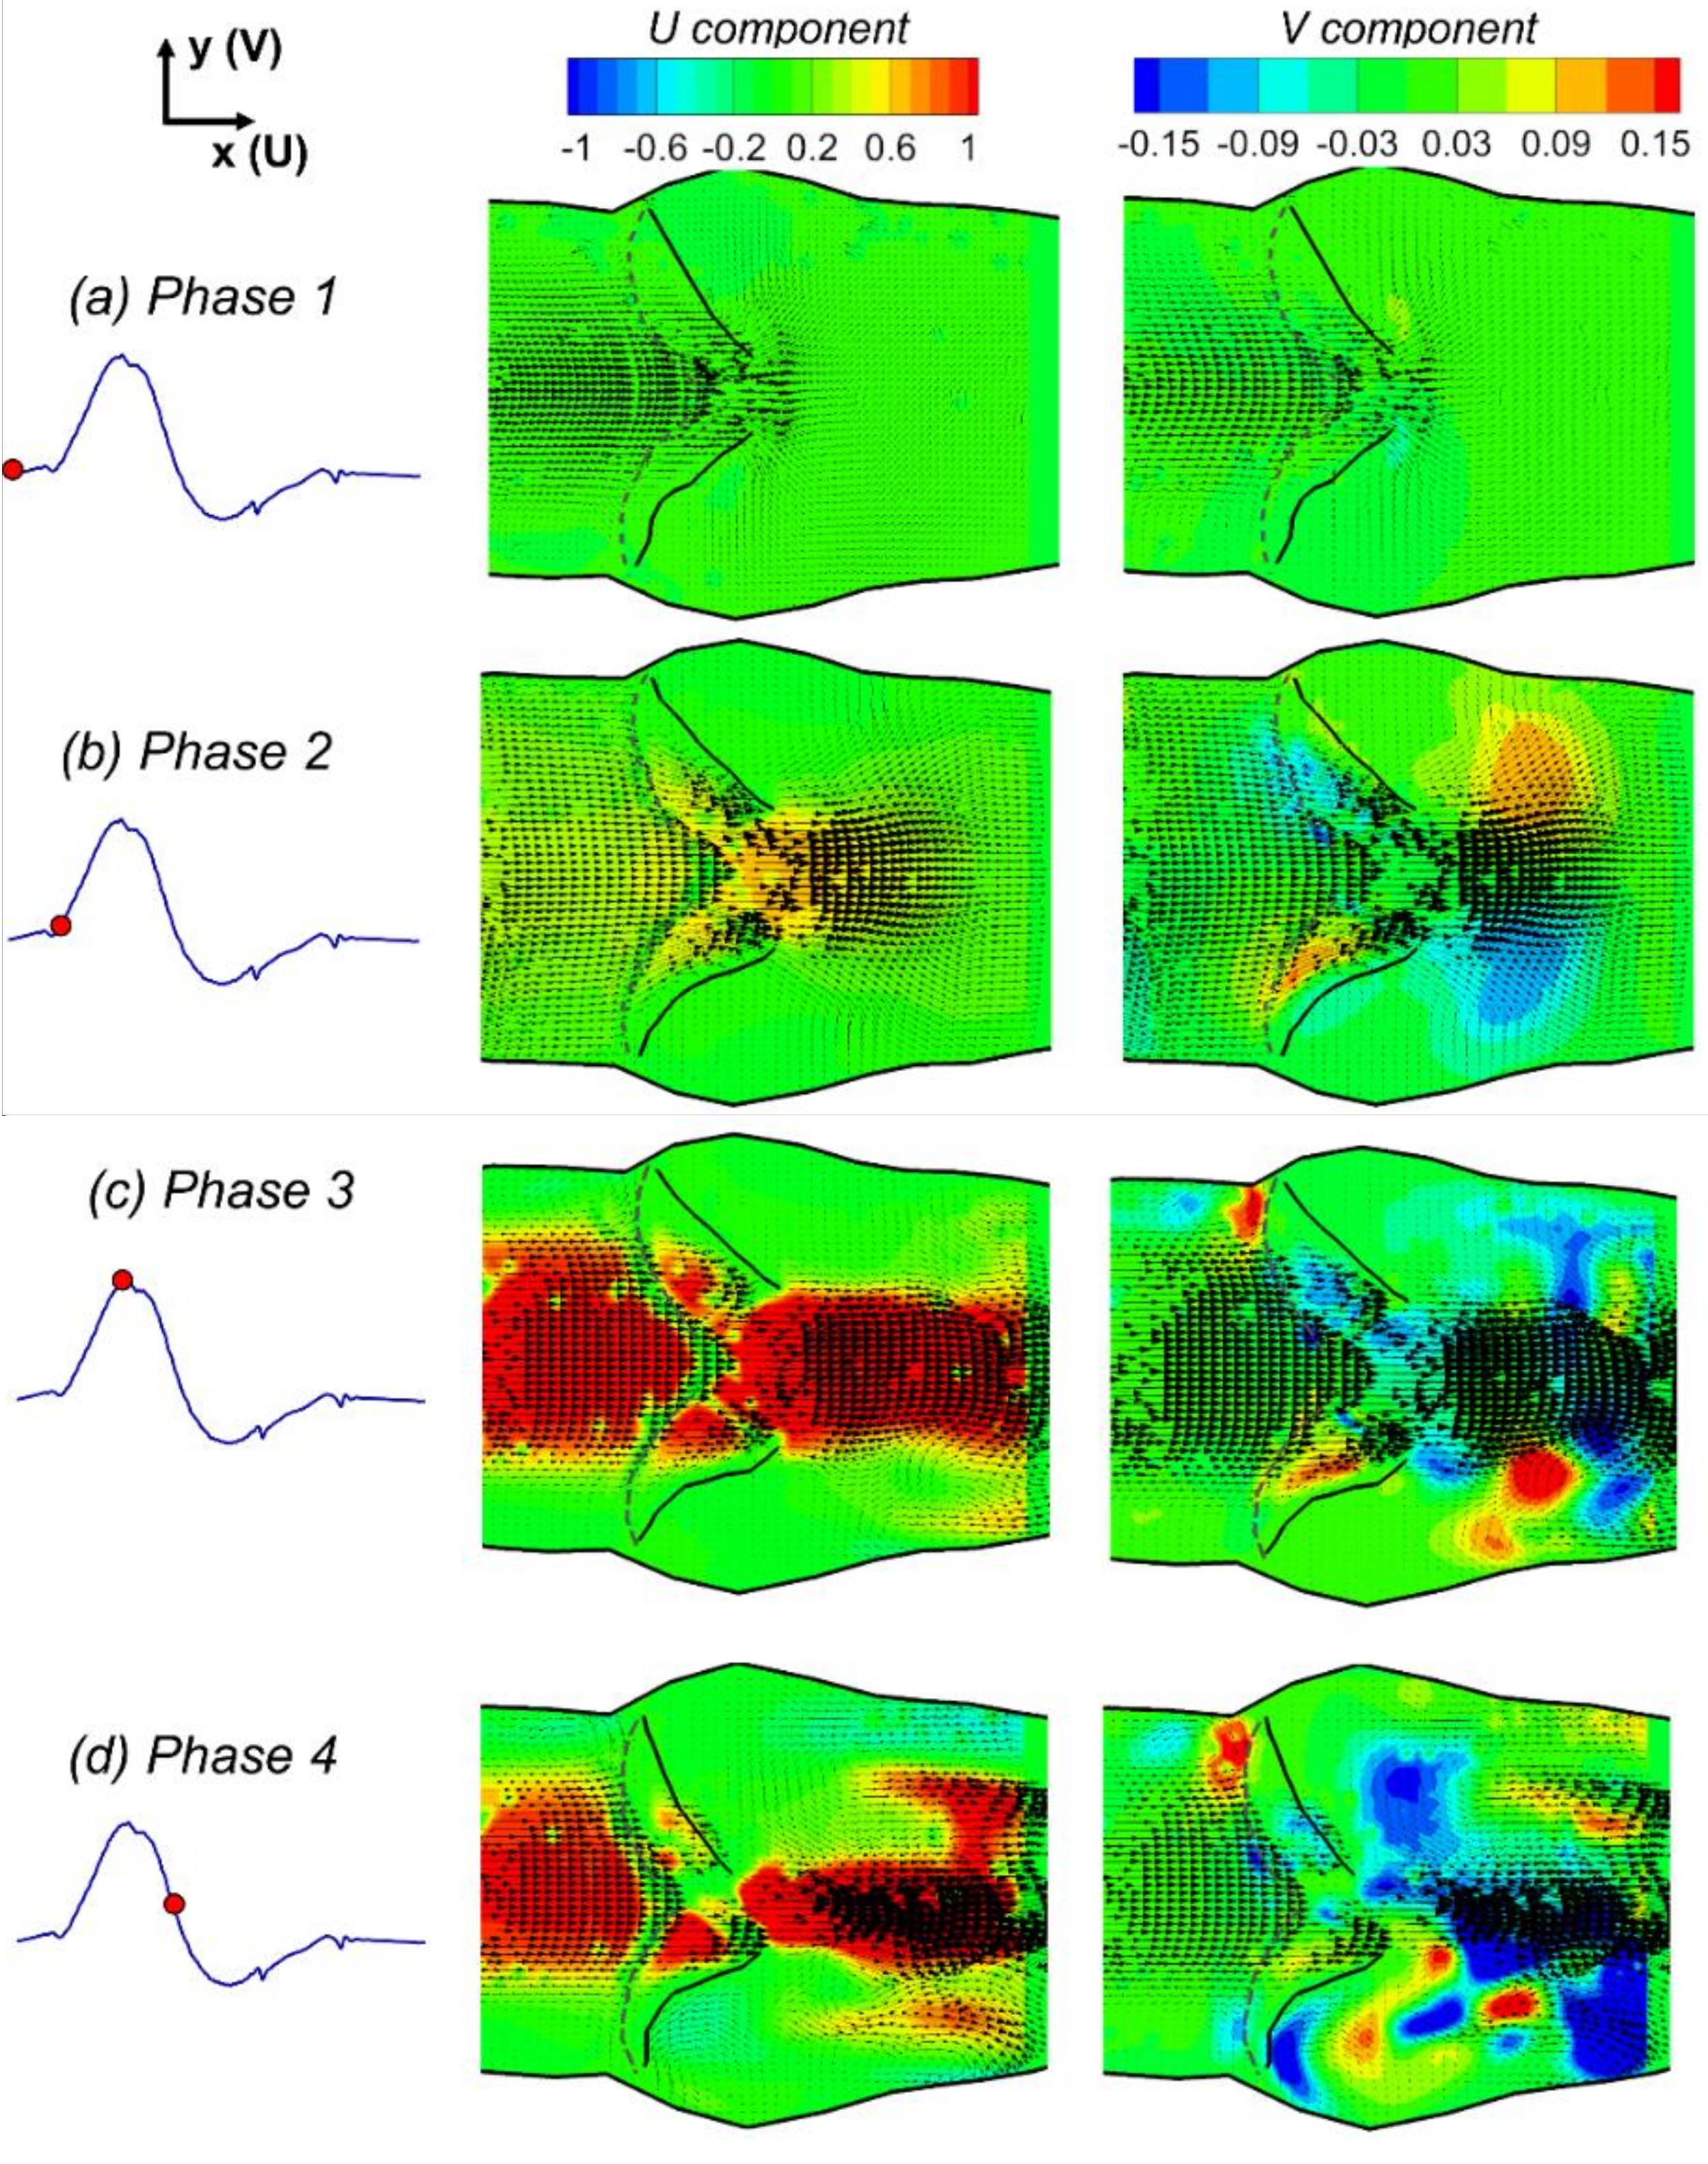
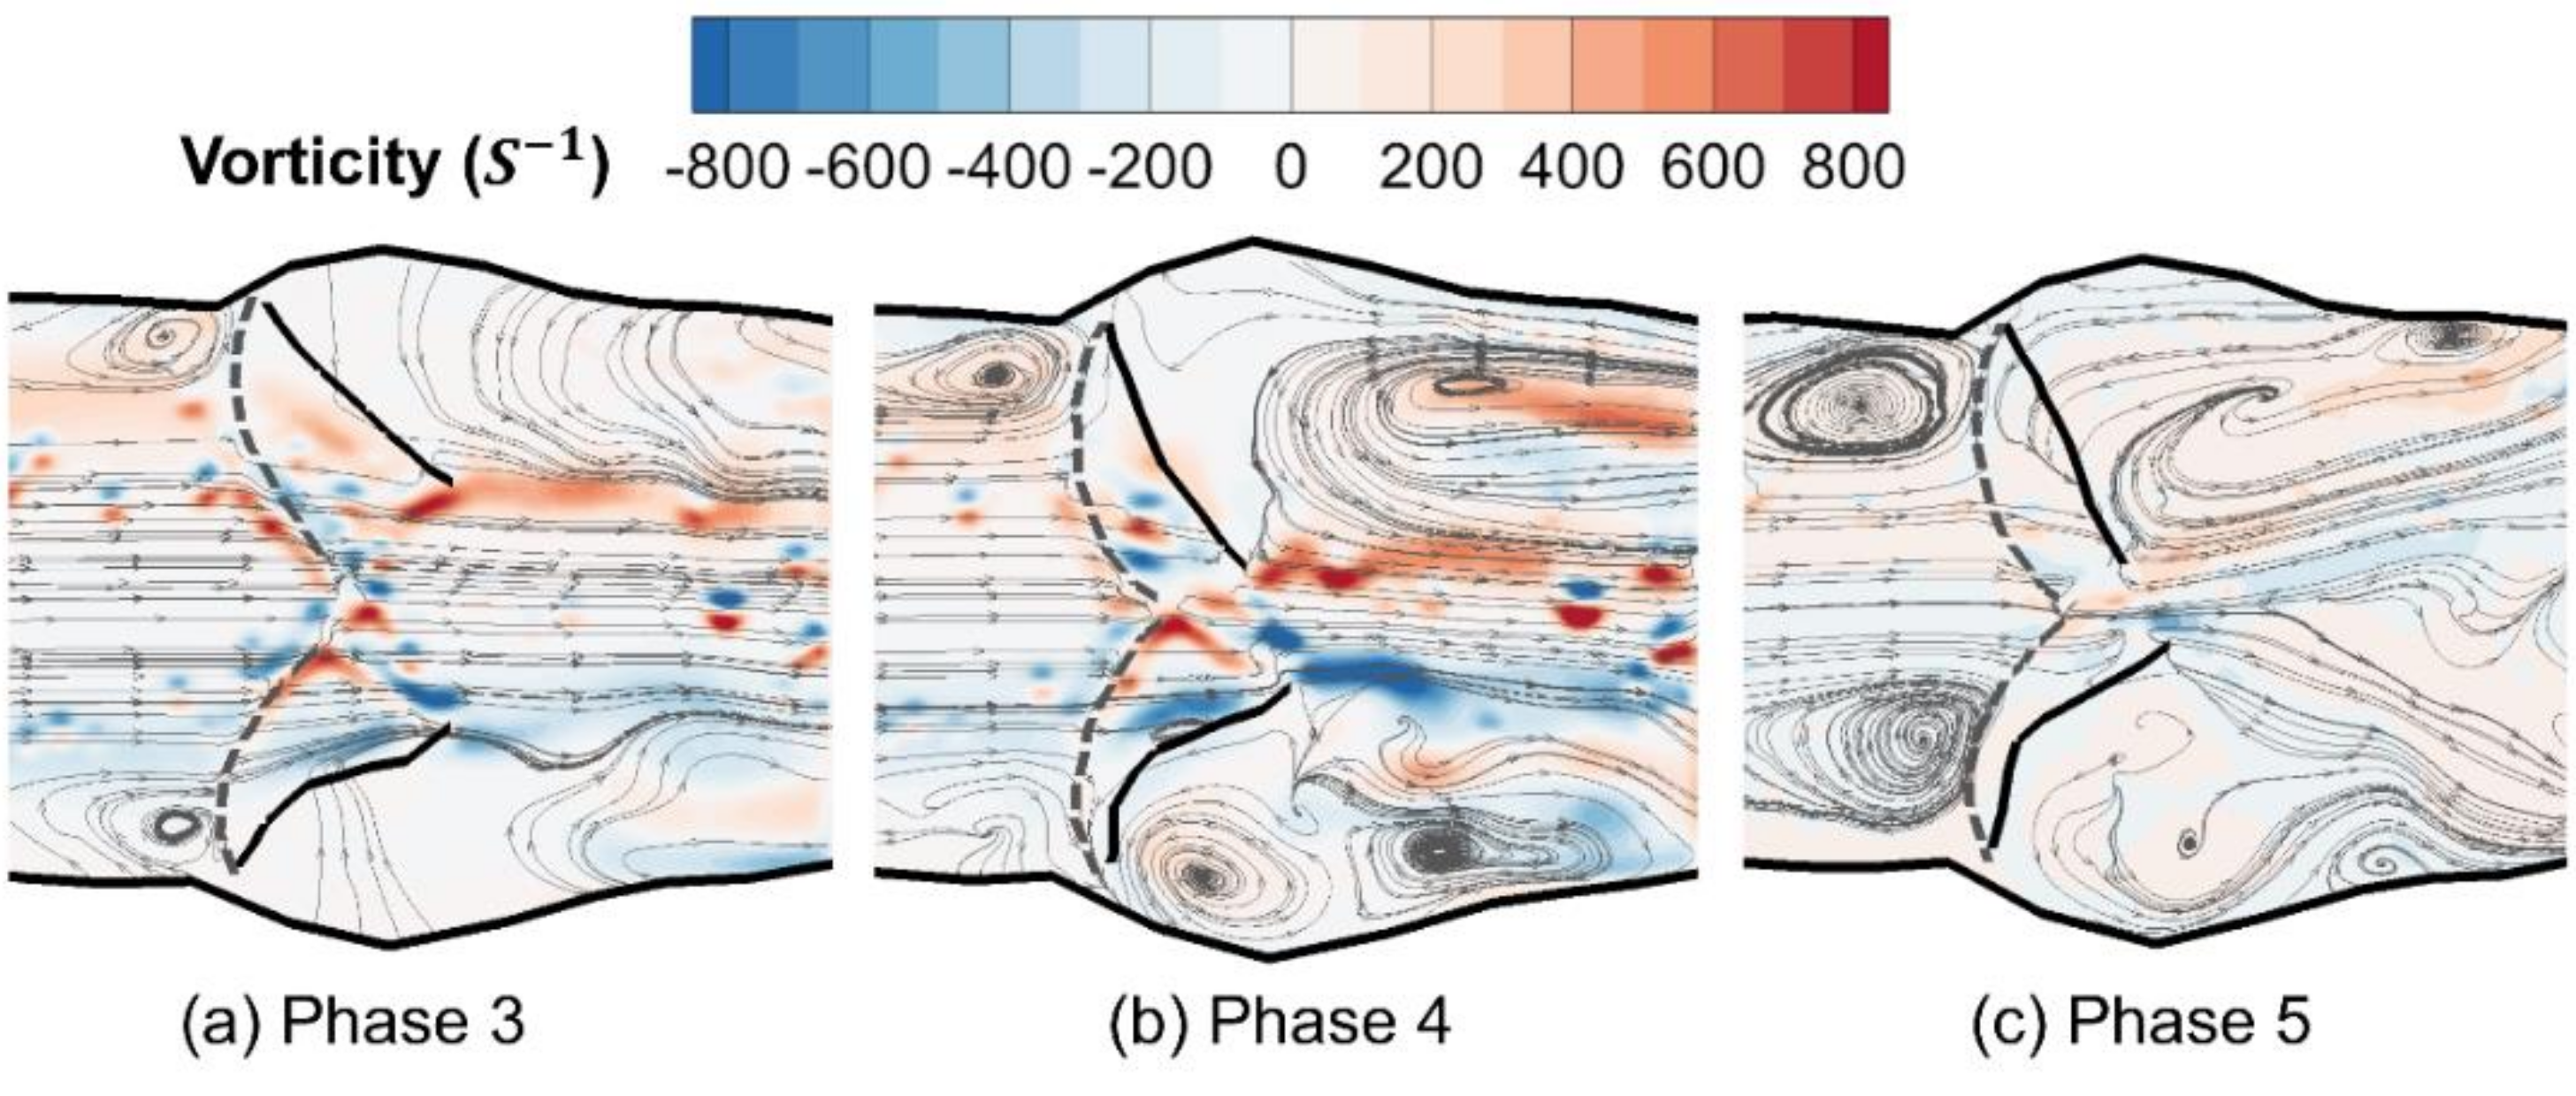
3.1. Phase-Averaged Flow Patterns in a Typical Cardiac Cycle

In the present experiments, the pulsatile flow was driven by the time-dependent pressure gradient across the aortic valve generated by the reciprocating piston pump, i.e., the left ventricular (LV) function. Figure 4 shows the pressure gradient across the aortic valve model as a function of time and the relative piston displacement during two cycles for the 4 L/min case. It is clear that during the systolic stroke of the pump (LV contraction), the positive pressure gradient spikes, and the peak value occurs at the mid-systole (maximum piston velocity). Through the transition from systole to diastole (LV relaxation), a mild negative pressure gradient briefly occurs due to the reversed piston displacement. The pressure gradient restores to approximately zero toward the end-diastole phase. The pulsatile flow variation was in accordance with the changes of the pressure gradient over time. To quantify the variations, PIV measurements were conducted at eight phase-locked conditions, as illustrated by the red dots in Figure 4a. Figure 4b shows that the peak pressure gradient and the magnitude of the negative pressure gradient during diastole both decrease proportionally as the CO reduces from 4 L/min. Meanwhile, the time to reach the peak pressure gradient is also slightly delayed due to the reduced CO. It should be noted that the maximum pressure gradient generated in the present study under 4 L/min CO is higher than that which is normally expected in a healthy native tissue aortic valve [30]. This is potentially caused by the greater flow resistance of the stiffer silicone valve leaflets in this bioengineering model compared with that of a native tissue valve.
Figure 5 shows the ensemble-averaged velocities in x and y directions inside the silicone model at different phases of a typical cardiac cycle. The boundary shapes of the aortic root and valve leaflets were also plotted as bold black lines based on the data extracted from the raw images, so that the interaction between the fluid and structures could be correlated. The dashed lines indicate the hinge locations of the valve leaflets. At phase 1 (Figure 5a), the heart valve was almost closed, and the phase-averaged flow velocities upstream and downstream of the valve were both very small. The v velocity contour clearly shows that a pair of vortices started to develop at the tip of the valve leaflets. At phase 2 (Figure 5b), the valve was pushed open, and the jet flow started to build up. The strength of both the u and v velocity components increased significantly. At phase 3 (Figure 5c), a clear central jet was developed, and the flow velocity increased dramatically both upstream and downstream (Figure 5c). At this peak systole phase, the valve reached its maximum opening, and started to close gradually afterwards. A strong out-of-plane vorticity ( ω = v / y u / x ) was observed at the interface of the jet flow (Figure 6a). At phase 4 (Figure 5d), the valve opening area decreased substantially, and the jet flow was weakened due to the decreased pressure gradient. The strength of flow recirculation (vortices) was clearly enhanced at this phase at a few sites downstream from the valve, particularly in the sinus and near the wall boundary around the sinotubular junction (Figure 6b). At phase 5 (Figure 5e), due to the development of the negative pressure gradient, the jet started to dissipate, and the flow was split into a v-shaped pattern. The magnitude of vorticity downstream from the valve became much weaker (Figure 6c). At phase 6 (Figure 5f) and afterwards, the jet flow dissipated due to the vanishing pressure gradient and the closure of the valve. It is also clear that at this phase, the remaining flow upstream of the valve induced vortices near the root of the leaflets. Overall, it is evident that the variation of flow patterns is strongly associated with both the time-dependent pressure gradient and the dynamics of the flexible structures.
The level of turbulence during the pulsatile flow process was also obtained by evaluating the ensemble turbulence kinetic energy (TKE). The normalized two-dimensional (2D) TKE were calculated as:
  T K E = 0.5 ( u 2 ¯ + v 2 ¯ ) / U p e a k 2  
where u and   v are the velocity fluctuation components in the horizontal and vertical directions, respectively, and U p e a k is the peak centerline flow velocity, which is used for normalization for all of the phases. Figure 7 shows the TKE distributions at a few selected phases. It is clear that the turbulence was minimal at the beginning of the phases during the acceleration phase of the systole (Figure 7a,b). Particularly at phase 3 when the peak systolic velocity developed, the TKE was very low, and moderate TKE areas were only found near the interface of the jet flow downstream due to the fluid shear. However, at phase 4 (Figure 7c), right after the peak systole, the TKE downstream from the aortic valve increased dramatically as the valve started to close and the flow decelerated. At phase 5, when the negative pressure gradient built up, the overall magnitude of TKE was reduced. The flow energy dissipation caused a fan-shaped TKE distribution downstream from the narrowing orifice (Figure 7d). In the following phases, the TKE in the entire flow field quickly decreases to near-zero values (not shown for brevity) until the next systolic jet flow develops. The entire process demonstrates that the instability of the pulsatile flow past the aortic valve bursts into turbulence during the initial deceleration phases and quickly dissipates (a quarter of a second in this study) during the diastole phases before the next cycle starts.
In sum, the PIV results clearly demonstrated the process of initiation and transportation of tip vortices, the development of the jet flow, as well as the dissipation of the jet at selected phases during a normal cardiac cycle. Strong vortices are also observed in the sinus region at this phase, which corresponds well with the results regarding the tension release of the compliant wall downstream from the valve [45]. The sinus vortices, which have been exclusively studied in previous in vitro experimental studies [46], are believed to contribute to the blood supply of the coronary arteries that originate from the sinus in the natural aortic root hemodynamics. Meanwhile, the highest jet velocity was found at the peak systole phase, with the highest TKE observed to occur during the deceleration phase of the pulsating flow (right after the peak systole). This phenomenon corresponds well with the well-known instability growth in the deceleration phase of a pulsatile flow in a rigid pipe flow [42], and is also a prominent feature of human arterial blood flow [40,41]. The present results suggest that the deceleration instability also occurs in the pulsatile flow within the complex aortic root wall boundaries.
In comparison to a PIV study by Saikrishnan et al. [30] in which native tissue valves with bicuspid and tricuspid morphologies were studied, the results show certain differences and similarities. On one hand, the orifice area of the current model is smaller than that measured for the tissue valves, resulting in a higher pressure gradient in the present study. This is potentially due to the stiffer material properties of the silicone material that was used in the present study. However, on the other hand, both trileaflet valve results show similar symmetric velocity, vorticity, and turbulent kinetic energy distributions near the peak systolic phases. The magnitudes of turbulence kinetic energy of the downstream jet flow at peak systole were also on the same order of magnitude (0.1 J/kg), despite the different experimental models and conditions that were used.

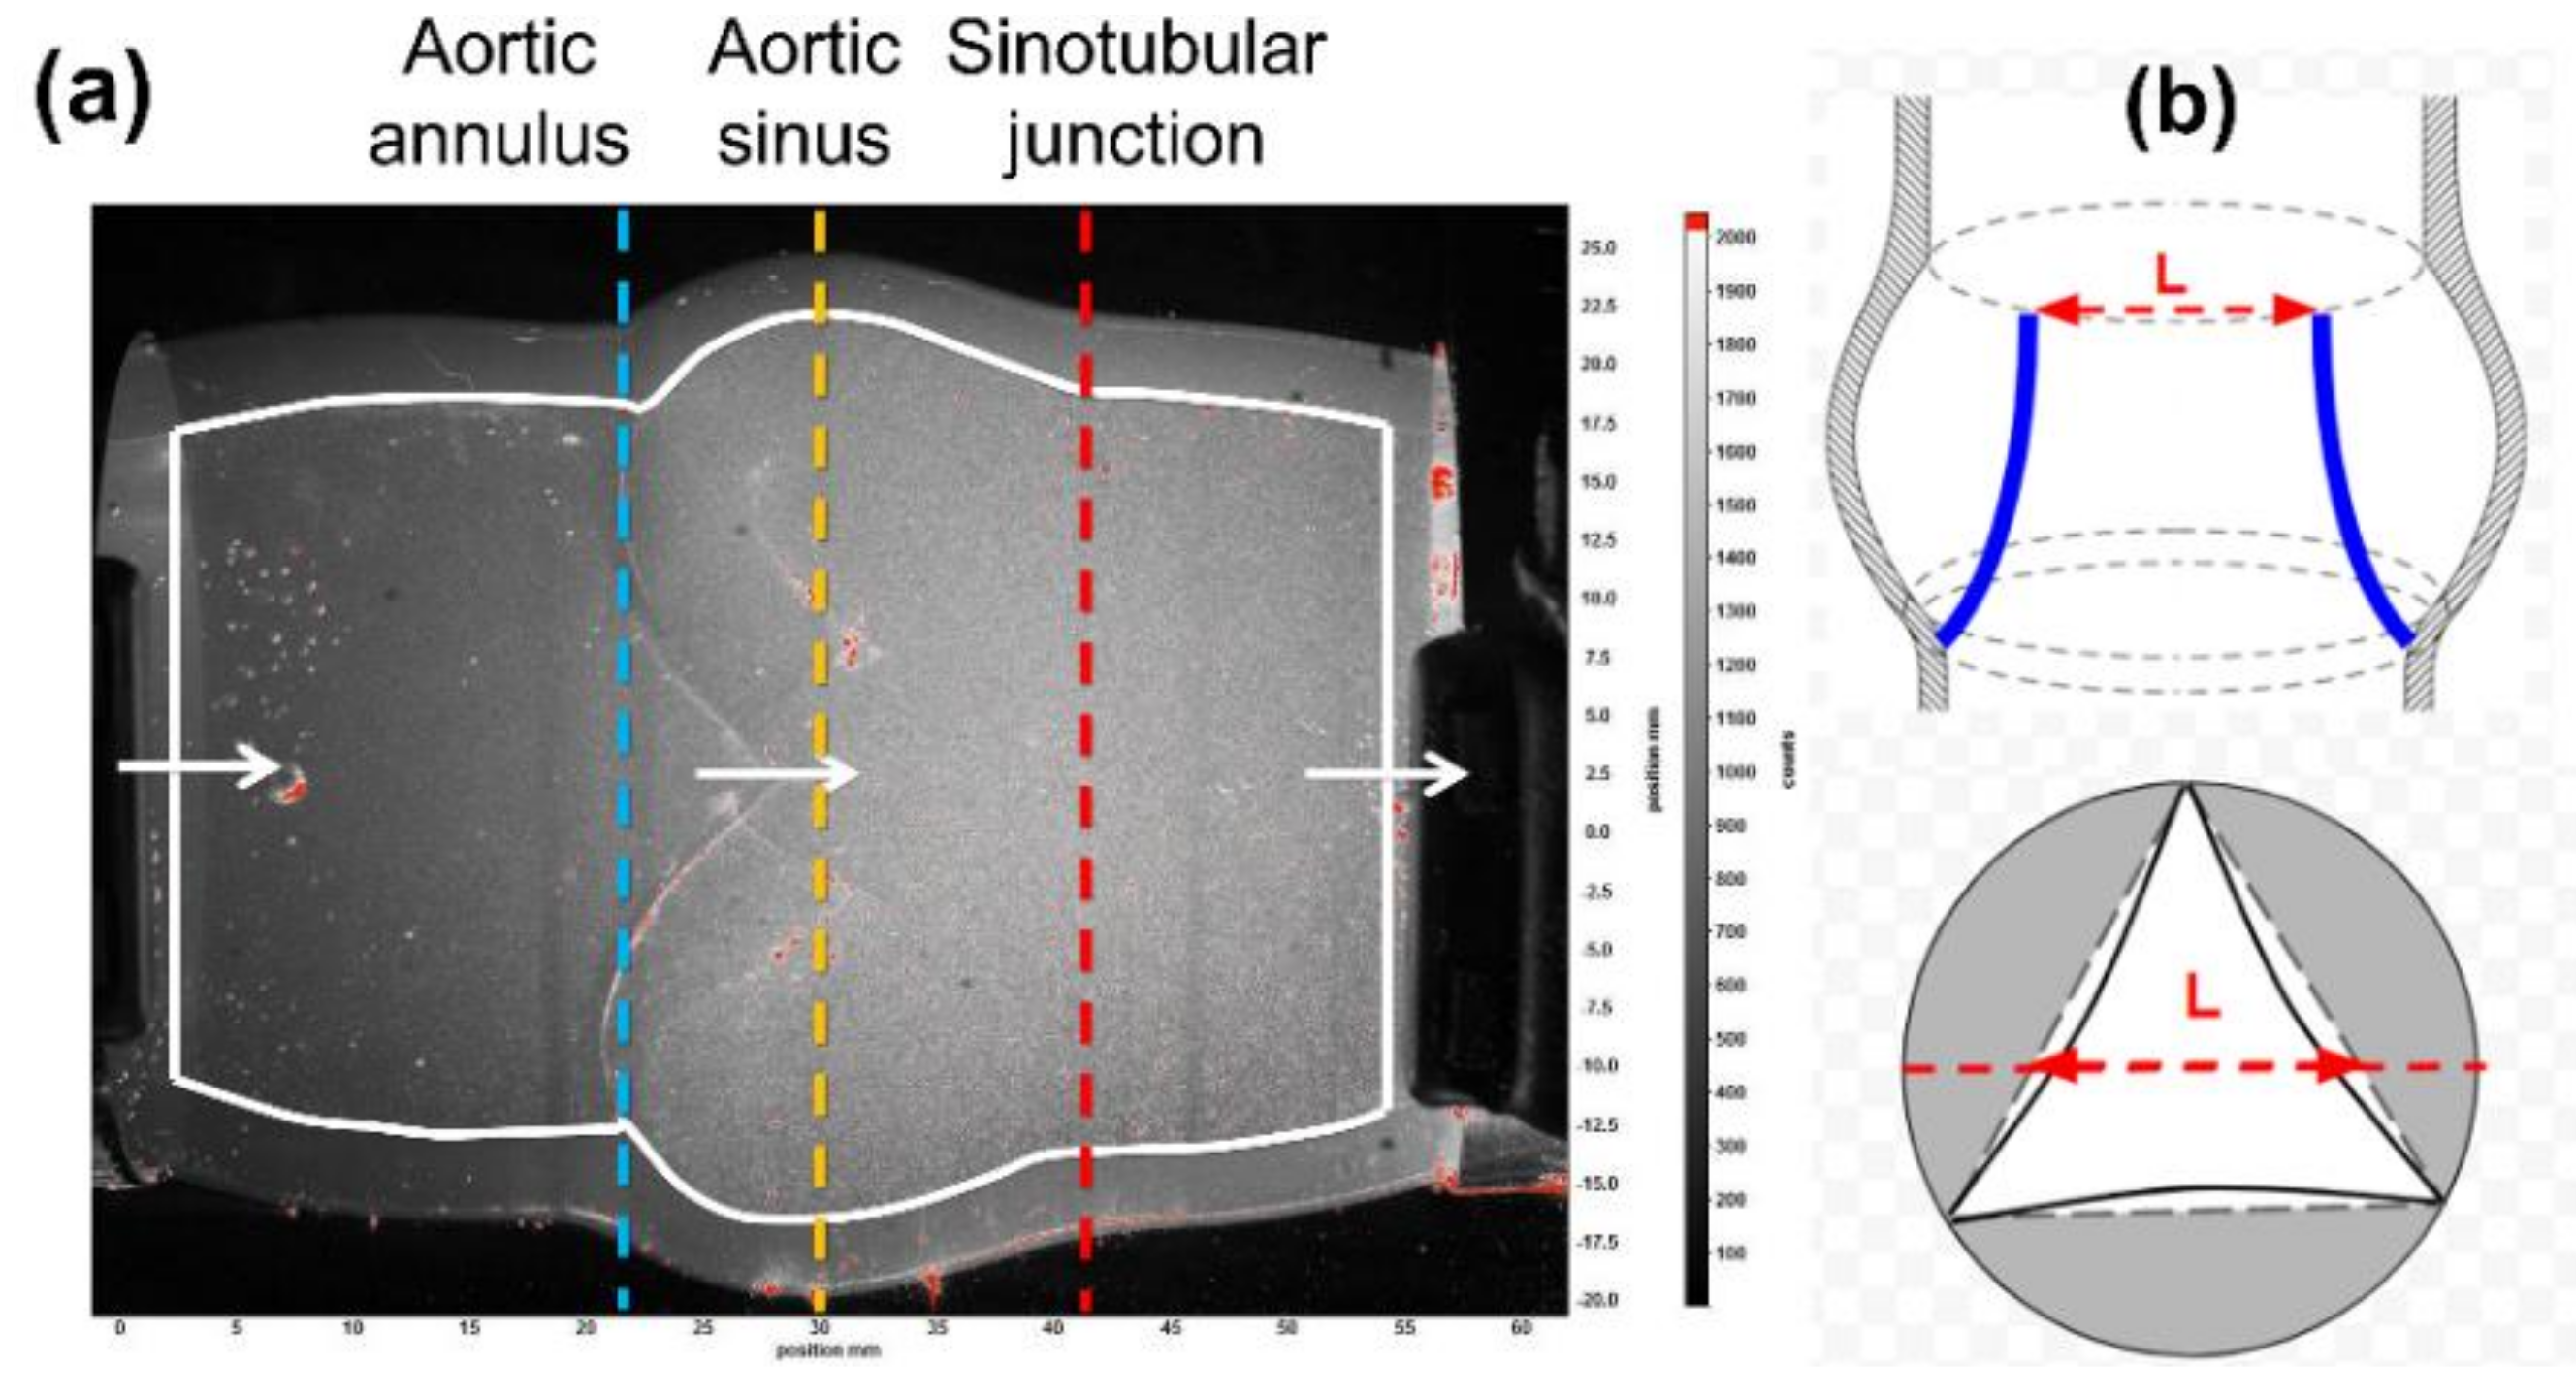
3.2. Structural Deformation in a Typical Cardiac Cycle

The deformation of the compliant model under the pulsatile flow was quantified by the variations of the tubular diameters and the leaflet orifice areas as shown in Figure 8. Figure 8a displays the changes of the normalized diameters (D/D0, D0 is the initial diameter at phase 1) during the cardiac cycle at the aortic annulus, aortic sinus, and sinotubular junction, respectively. The results show that the aortic annulus experiences the largest radial deformation during the course of the systole due to the direct exposure to the high upstream left ventricular pressure. In addition, it is interesting to note that while the maximum deformation of the aortic annulus and the sinotubular junction happened at phase 3 when the maximum jet flow occurs, the maximum deformation of the aortic annulus occurred at an earlier phase ahead of the peak systole. This early area increase of the aortic annulus (base) was also found in previous clinical studies of aortic root dynamics [47]. Figure 8b shows the dynamic motion of the leaflet in terms of the changes of GOA, which was normalized by its maximum value in a cycle. It is clear that a significant increase of the orifice area also started to occur at an earlier phase before the peak systole. The opening area of the leaflets then increased as the systolic jet developed and decreased quickly past the peak systolic phase. It should be noted that the GOA is not completely zero during diastole due to the small gaps between the silicone leaflets and the limitation of the molding manufacturing process.

3.3. Effects of Reduced Cardiac Output

Various cardiac diseases, such as myocardial infarction, hypertension, congenital heart disease, and arrhythmias, may lead to a reduction in cardiac outputs (CO). In this section, the results of the flow and structure responses of two reduced COs, i.e., 2 L/min and 1 L/min, were analyzed and compared with the results of the normal 4 L/min. Figure 9 summarizes the jet flow velocity both upstream and downstream of the aortic valve for all three cardiac outputs. The inlet and exit jet velocities were extracted from the PIV results along the centerline at the locations of the aortic annulus and the sinotubular junction, as illustrated in Figure 3a. It is clear that when the CO was reduced from 4 L/min to 2 and 1 L/min, the peak flow velocity upstream of the valve decreased to a half and a quarter, respectively (Figure 9a). These linear trends were less obvious downstream of the valve due to the interaction of the leaflets (Figure 9b). Specifically, when the CO was reduced from 4 L/min to 2 L/min, the peak exit jet velocity decreased only by approximately 34%. A reduced CO also caused a faster dissipation of the downstream jet flow manifested by the sharp decrease of velocity right after the peak systole (phase 3 to 4).
The effects of reduced CO on the diastolic turbulence have been analyzed using the ensemble 2D Reynolds shear stress (RSS), which is defined as:
  R S S = ρ u v ¯  
where u ¯ and   v ¯ represent the velocity fluctuations in x and y dimensions, respectively, and   ρ is the density of the fluid. The RSS distributions are compared among the normal 4 L/min, and the reduced CO, i.e., the 2 L/min and 1 L/min cases, at phases 3 (peak systole) and 4 (after peak) are shown in Figure 10 using the same color scales. At the peak systole phase (phase 3), the RSS magnitudes and distributions do not show apparent differences in reduced CO cases (Figure 10a). At phase 4, although the maximum values of RSS downstream of the valve are comparable among three CO cases, more scattered small-scale RSS distribution patterns are seen under reduced CO conditions (Figure 10b). Particularly, more small flow structures were observed near the center region downstream of the valve in the low CO cases. These results suggest that the turbulence is dissipated faster after the peak systolic phase under low CO conditions.
The deformation of the wall and the aortic valve leaflets is also different under reduced COs. Figure 11a shows the area strain (AS) at three different locations (aortic annulus, sinus, and sinotubular junction) and the corresponding peak systolic pressure under different cardiac outputs. It shows that the deformation at the aortic annulus is the most significant among the three locations in all of the CO cases. As the CO is reduced from 4 L/min to 2 L/min and 1 L/min, the AS at the annulus decreased from 14.3% to 11.3% and 8.1%, respectively. In comparison, the AS of the sinotubular junction downstream of the aortic valve is relatively small, and the AS at the aortic sinus is the least in all of the CO cases. However, the decreasing trends of the AS at these two sites are also apparent as the CO is reduced. These reductions are associated with the decreased peak systolic pressure when the CO is reduced.
Figure 11b displays the variation of geometric orifice area (GOA) over time for three different CO cases. As expected, the maximum GOA was significantly reduced as the cardiac output decreased. The maximum GOA at peak phase 3 was around 0.7 cm2, 1.0 cm2, and 1.6 cm2 for cardiac outputs of 1 L/min, 2 L/min, and 4 L/min, respectively. It is also evident that the GOA started to increase at phase 2 in the 4 L/min case, while in low CO cases, the orifice area did not increase before the peak systole phase. These results imply that the blood transport efficiency would be significantly reduced under low CO conditions, since both the maximum orifice area and the effective time for pumping blood out of the ventricular chamber are decreased.
The structure deformation under different cardiac outputs were summarized and compared to some in vivo data in Table 2. It is clear that the maximum GOA of the silicone aortic valve under 4 L/min cardiac output was reasonably close to the in vivo value reported in Clavel et al. [48], in which the GOA of a transcatheter Edwards SAPIEN valve (Edwards Lifesciences, Irvine, California, USA) was evaluated. The area strain at the sinotubular junction under 4 L/min was found to be smaller, but close to that of a natural aortic valve from a magnetic resonance imaging (MRI) study [44]. These comparisons suggest that some major pulsatile flow characteristics are replicated in the present in vitro experiments. However, it should be noted that the current silicone model does not have the same stiffness and other viscoelastic properties of the natural myocardium tissue. The structure deformation results that were observed in the present experiments could not be directly translated into an in vivo biological setting, where the material properties and the extravascular environment are inherently different.

4. Conclusions

An in vitro experimental study has been conducted to investigate the pulsatile flow characteristics in an intact silicone aortic root model. Particularly, the turbulent flow characteristics and structural deformation in response to varied cardiac outputs (4 L/min, 2 L/min, and 1 L/min) were examined. The pulsatile flow was generated using a programmable piston pump in a closed-loop cardiovascular flow simulator. A phase-locked particle image velocimetry system and high-frequency pressure sensors were used to obtain the quantitative flow field and pressure time series data. The key results can be summarized as follows:
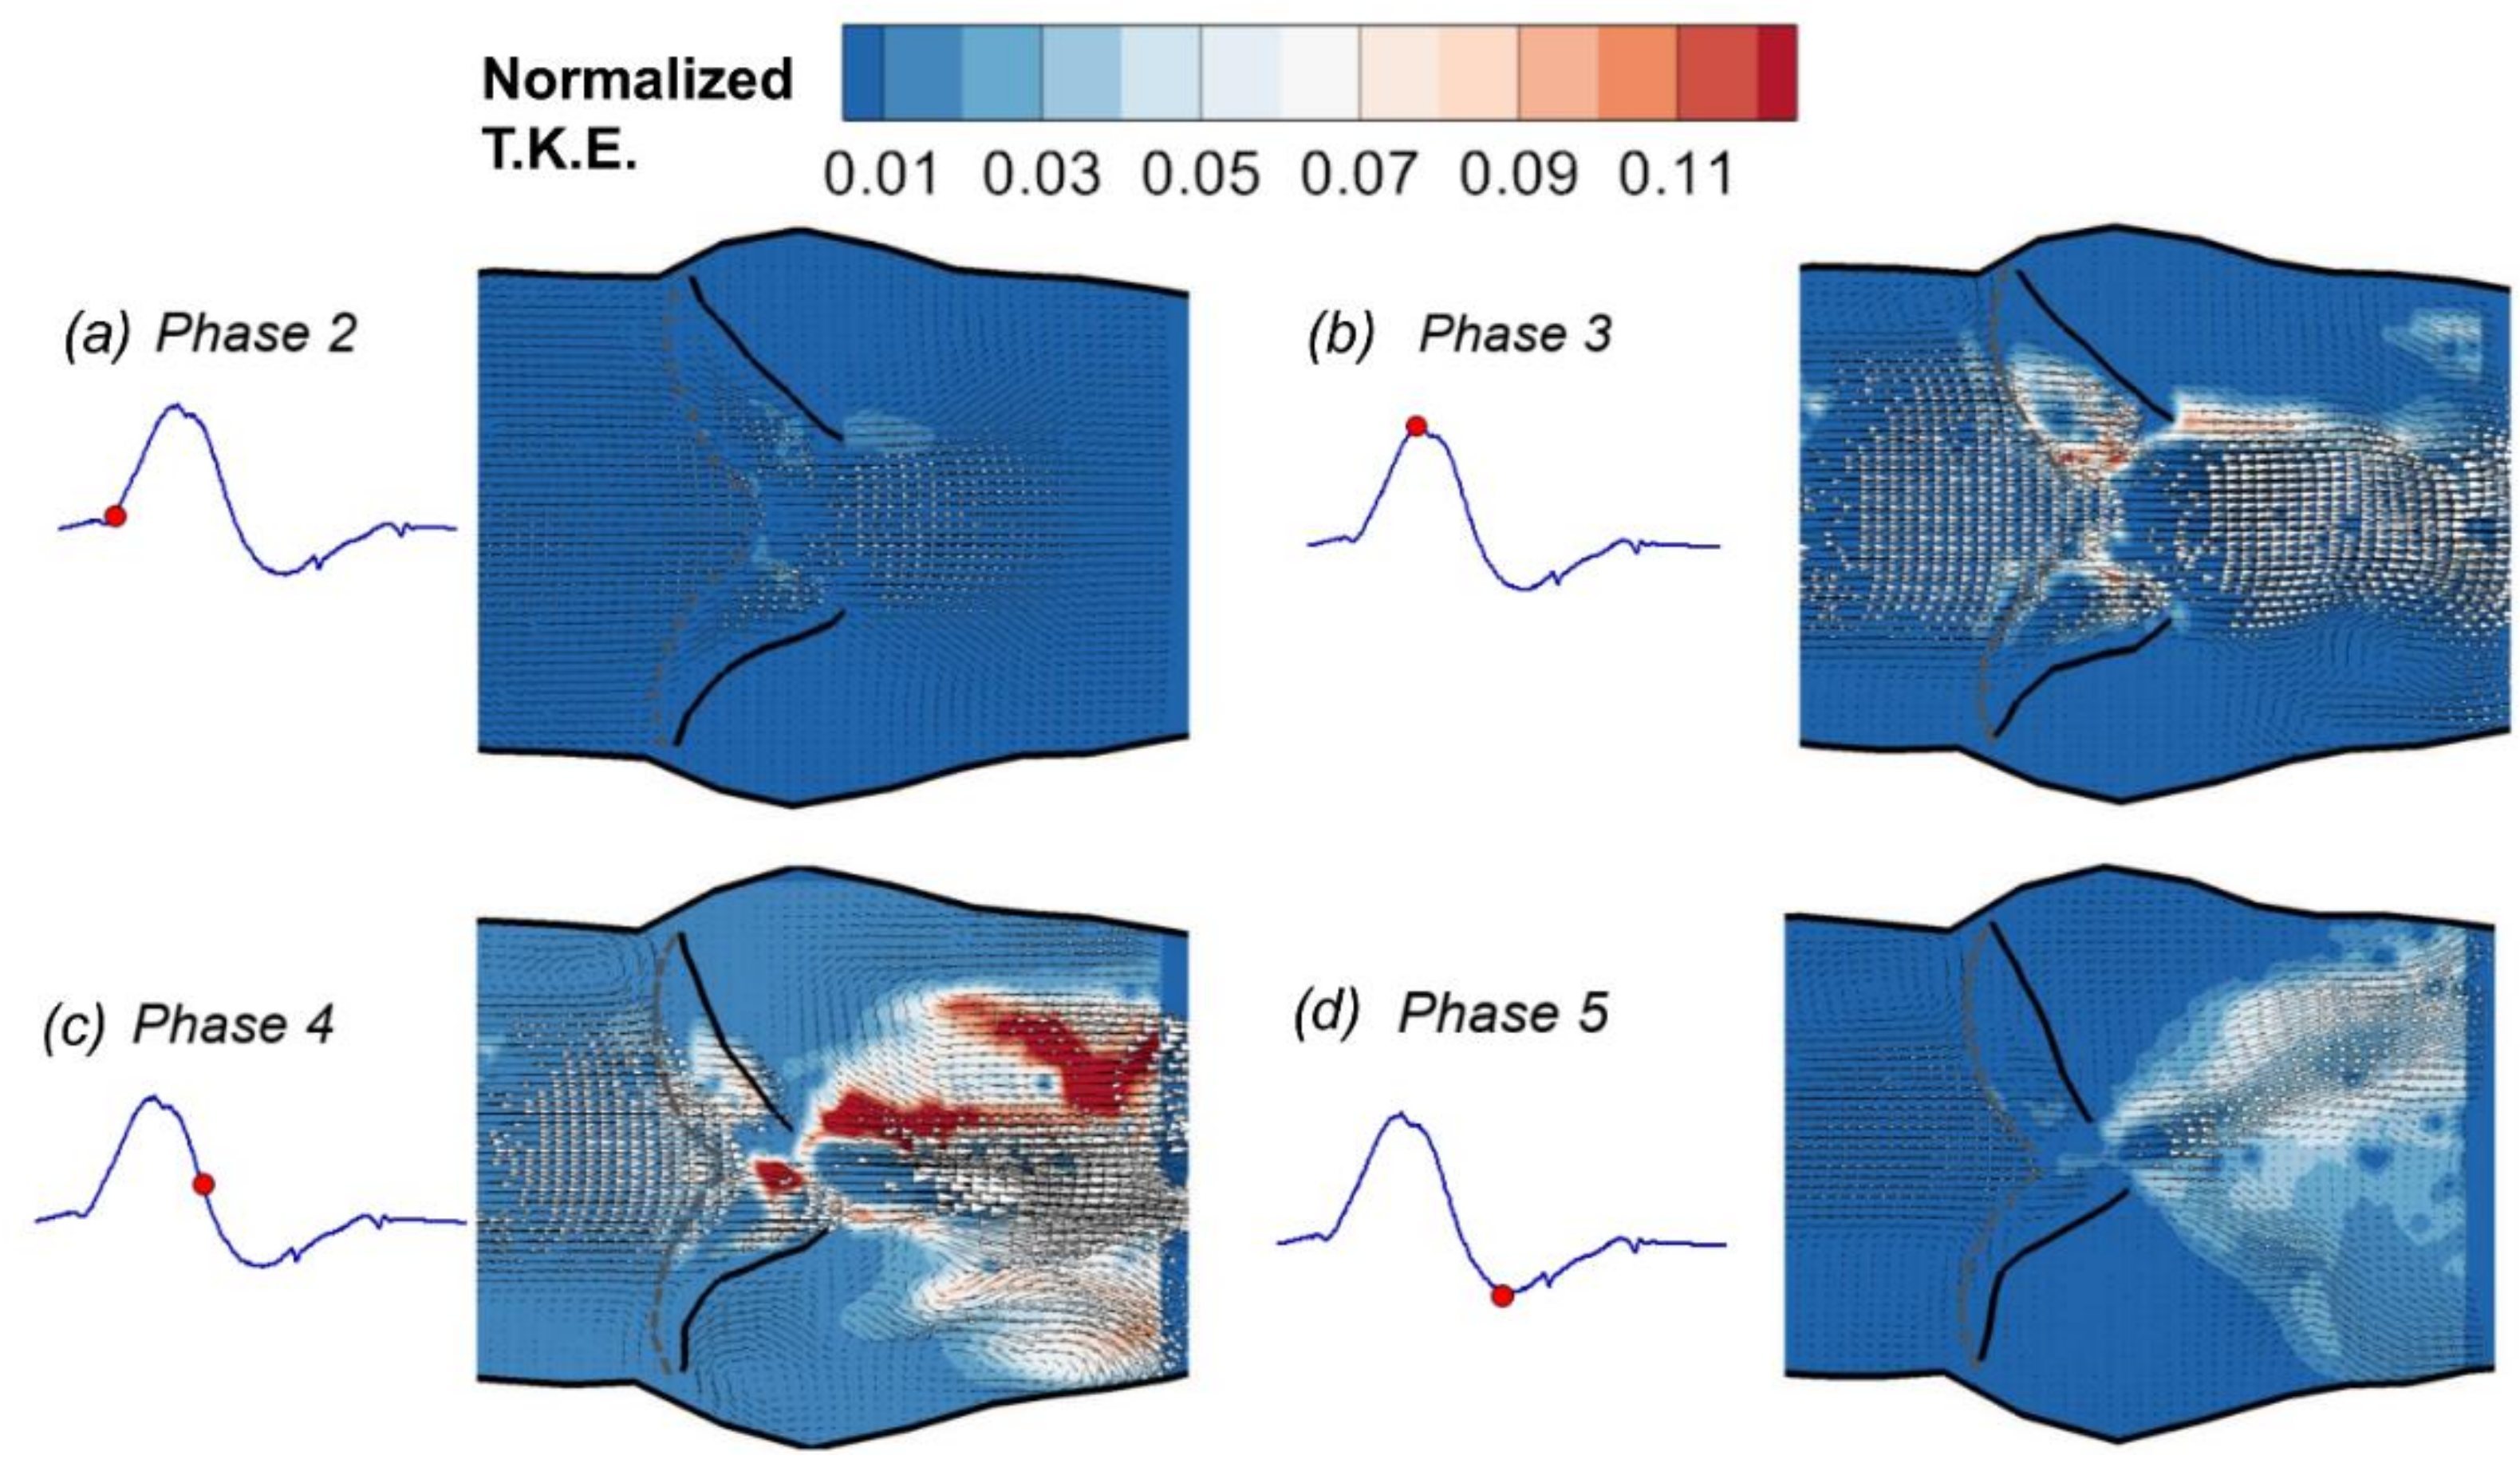
  • The flow field characteristics during a typical cardiac cycle have been revealed using phase-locked PIV. Both the jet flow patterns and the turbulence kinetic energy vary significantly at different phases with changes of the pressure gradient. High TKE was observed after the peak systole when flow started to decelerate.
  • The pulsatile flow caused noticeable structural deformations under normal cardiac output. The largest circumferential deformation was found at the aortic annulus upstream of the aortic valve at a phase prior to the peak systolic phase. The maximum valve orifice area was also found at a phase prior to the peak systole under the baseline 4 L/min condition.
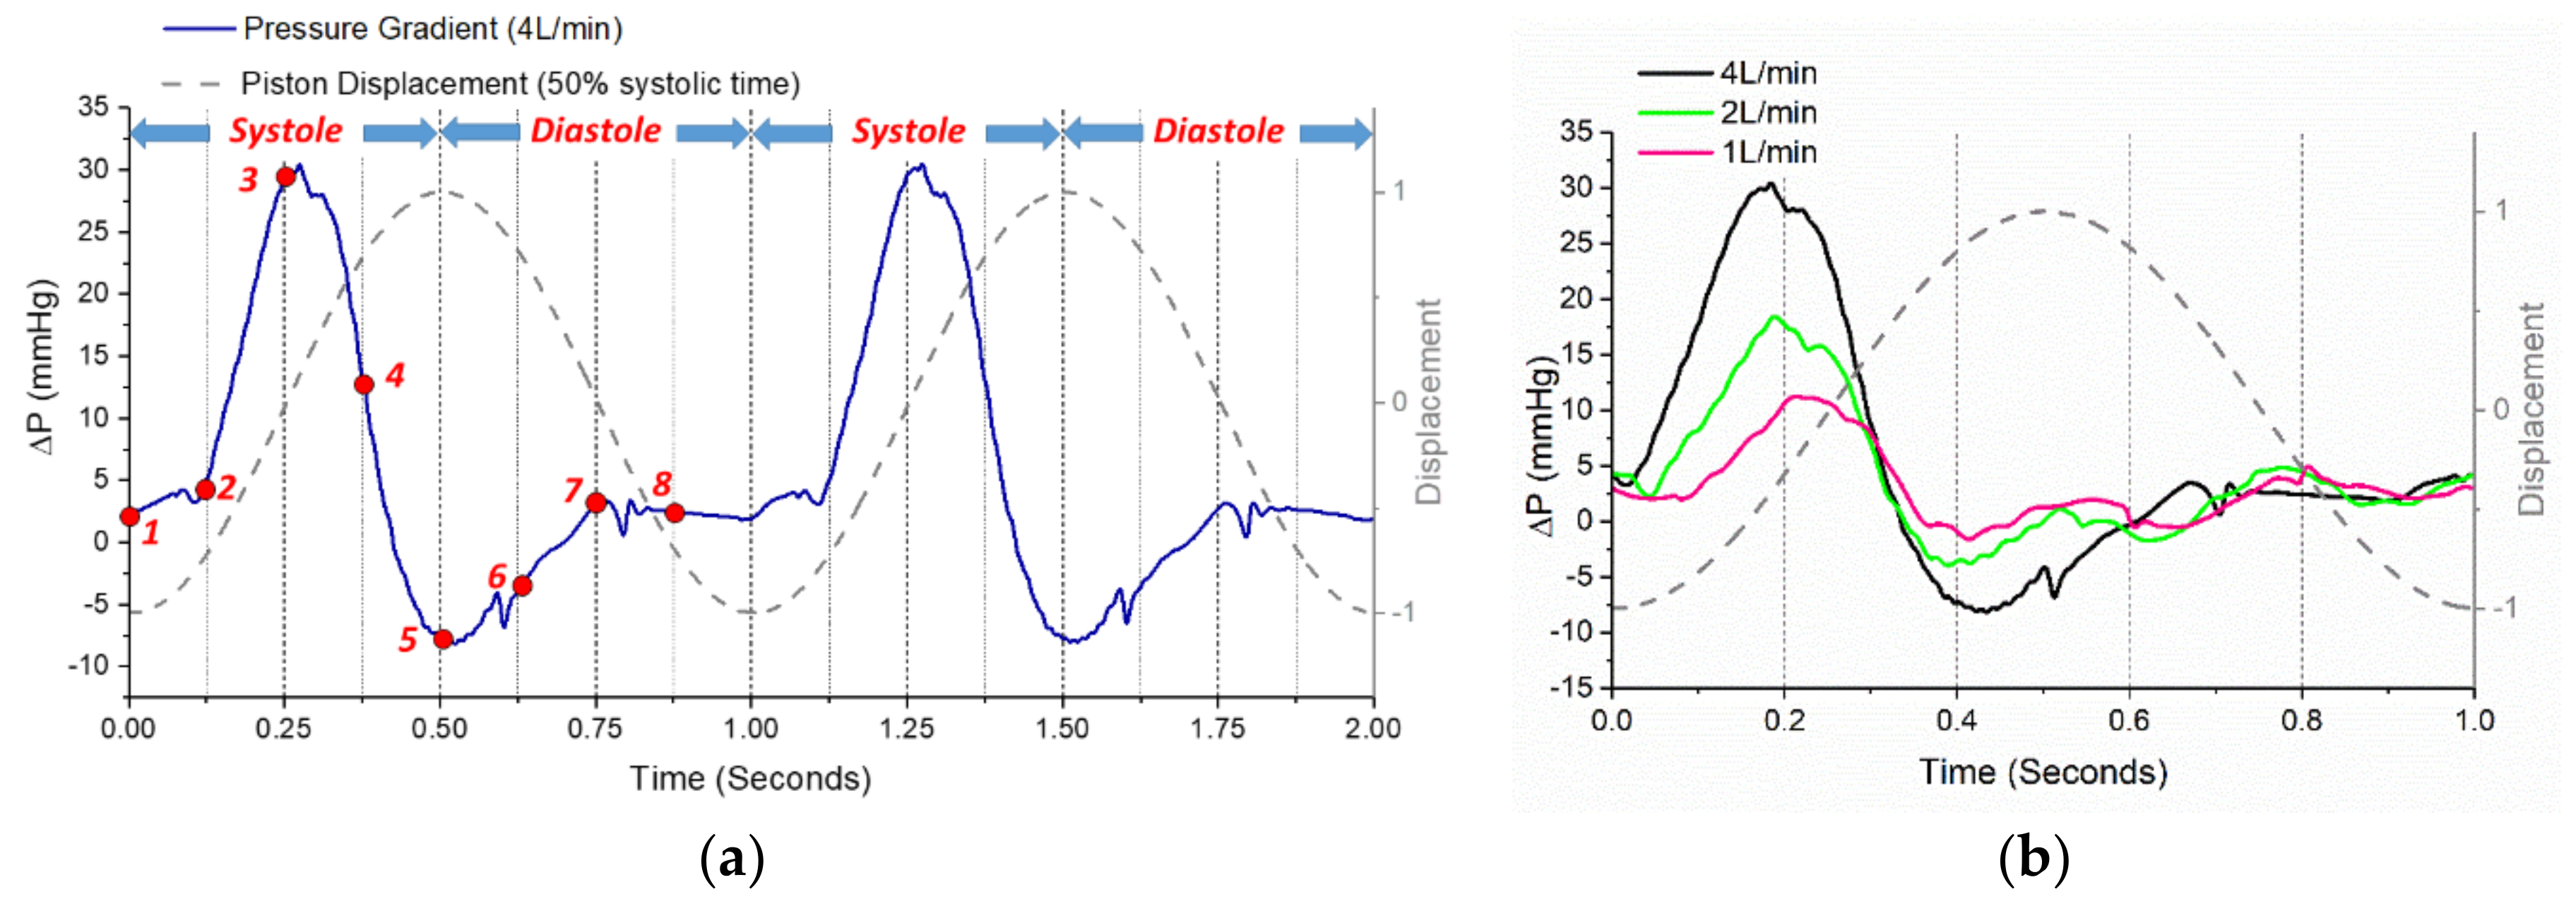
  • Cardiac output (CO) plays an important role in the hemodynamics and structural responses of the aortic valve root. A decrease of CO from 4 L/min to 2 L/min and 1 L/min resulted in a reduced exit jet flow velocity and a deceased turbulence downstream. Reduced CO also contributed to a decrease in circumferential deformation, a decrease in orifice area, and a shortened valve opening period.
Overall, the present study shows a preliminary effort to quantitatively investigate the fluid dynamics of an intact aortic root model under varied input flow conditions. The results demonstrate that an in vitro pulsatile flow system is capable of capturing some of the most prominent flow characteristics within a flexible aortic root, while providing better controllability and spatial resolution that complements the clinical imaging research. The results could provide validation benchmarks for future patient-specific computational fluid dynamics and fluid-structure interaction simulations.
Due to the nature of the present bioengineering model and experimental setup, this study has a few limitations. (1) The silicone model does not replicate the non-linear viscoelastic tissue properties. (2) The use of the same silicone materials for both the aortic root wall and the leaflets does not reflect the real histological differences of the different tissues. (3) The non-Newtonian flow properties of the blood are not involved. (4) The time-resolved flow behaviors have not been captured. Future research will focus on these aspects to improve the understanding of the hemodynamics and fluid-structure interaction phenomena in more realistic biological settings.

Author Contributions

R.Z. prepared experimental setup and performed the PIV measurements. Both authors worked in data post processing and analysis. The manuscript was prepared and written by both authors.

Acknowledgments

The authors would like to acknowledge the funding support from the 2017–2018 Research and Creative Activity Seed Award by North Dakota State University.

Conflicts of Interest

The authors declare no conflict of interest.

References

  1. Nkomo, V.T.; Gardin, J.M.; Skelton, T.N.; Gottdiener, J.S.; Scott, C.G.; Enriquez-Sarano, M. Burden of valvular heart diseases: A population-based study. Lancet 2006, 368, 1005–1011. [Google Scholar] [CrossRef]
  2. Falk, E. Coronary thrombosis: Pathogenesis and clinical manifestations. Am. J. Cardiol. 1991, 68, B28–B35. [Google Scholar] [CrossRef]
  3. Hasan, A.; Ragaert, K.; Swieszkowski, W.; Selimović, S.; Paul, A.; Camci-Unal, G.; Mofrad, M.R.K.; Khademhosseini, A. Biomechanical properties of native and tissue engineered heart valve constructs. J. Biomech. 2014, 47, 1949–1963. [Google Scholar] [CrossRef] [PubMed]
  4. Kapadia, S.R.; Leon, M.B.; Makkar, R.R.; Tuzcu, E.M.; Svensson, L.G.; Kodali, S.; Webb, J.G.; Mack, M.J.; Douglas, P.S.; Thourani, V.H.; et al. 5-year outcomes of transcatheter aortic valve replacement compared with standard treatment for patients with inoperable aortic stenosis (PARTNER 1): A randomised controlled trial. Lancet 2015, 385, 2485–2491. [Google Scholar] [CrossRef]
  5. Wang, Y.; Joannic, D.; Patrick, J.; Keromnes, A.; Aurélien, M.; Lalande, A.; Fontaine, J.F. Comparison of Flow Measurement by 4D Flow Magnetic Resonance Imaging and by Particles Image Velocimetry on Phantom of Abdominal Aortic Aneurysm. SM Vasc. Med. 2016, 1, 1008. [Google Scholar]
  6. Chen, C.-Y.; Antón, R.; Hung, M.; Menon, P.; Finol, E.A.; Pekkan, K. Effects of Intraluminal Thrombus on Patient-Specific Abdominal Aortic Aneurysm Hemodynamics via Stereoscopic Particle Image Velocity and Computational Fluid Dynamics Modeling. J. Biomech. Eng. 2014, 136, 031001. [Google Scholar] [CrossRef] [PubMed] [Green Version]
  7. Knapp, Y.; Bertrand, E. Particle imaging velocimetry measurements in a heart simulator. J. Vis. 2005, 8, 217–224. [Google Scholar] [CrossRef]
  8. Sengupta, P.P.; Khandheria, B.K.; Korinek, J.; Jahangir, A.; Yoshifuku, S.; Milosevic, I.; Belohlavek, M. Left ventricular isovolumic flow sequence during sinus and paced rhythms: New insights from use of high-resolution Doppler and ultrasonic digital particle imaging velocimetry. J. Am. Coll. Cardiol. 2007, 49, 899–908. [Google Scholar] [CrossRef] [PubMed]
  9. Hong, G.-R.; Pedrizzetti, G.; Tonti, G.; Li, P.; Wei, Z.; Kim, J.K.; Baweja, A.; Liu, S.; Chung, N.; Houle, H.; et al. Characterization and Quantification of Vortex Flow in the Human Left Ventricle by Contrast Echocardiography Using Vector Particle Image Velocimetry. JACC Cardiovasc. Imaging 2008, 1, 705–717. [Google Scholar] [CrossRef] [PubMed] [Green Version]
  10. Falahatpisheh, A.; Kheradvar, A. High-speed particle image velocimetry to assess cardiac fluid dynamics in vitro: From performance to validation. Eur. J. Mech. B Fluids 2012, 35, 2–8. [Google Scholar] [CrossRef]
  11. Asami, R.; Tanaka, T.; Kawabata, K.; Hashiba, K.; Okada, T.; Nishiyama, T. Accuracy and limitations of vector flow mapping: Left ventricular phantom validation using stereo particle image velocimetory. J. Echocardiogr. 2017, 15, 57–66. [Google Scholar] [CrossRef] [PubMed]
  12. Day, S.W.; McDaniel, J.C.; Wood, H.G.; Allaire, P.E.; Landrot, N.; Curtas, A. Particle image velocimetry measurements of blood velocity in a continuous flow ventricular assist device. ASAIO J. 2001, 47, 406–411. [Google Scholar] [CrossRef] [PubMed]
  13. Laumen, M.; Kaufmann, T.; Timms, D.; Schlanstein, P.; Jansen, S.; Gregory, S.; Wong, K.C.; Schmitz-Rode, T.; Steinseifer, U. Flow analysis of ventricular assist device inflow and outflow cannula positioning using a naturally shaped ventricle and aortic branch. Artif. Organs 2010, 34, 798–806. [Google Scholar] [CrossRef] [PubMed]
  14. Lim, W.L.; Chew, Y.T.; Chew, T.C.; Low, H.T. Steady flow dynamics of prosthetic aortic heart valves: A comparative evaluation with PIV techniques. J. Biomech. 1998, 31, 411–421. [Google Scholar] [CrossRef]
  15. Ge, L.; Leo, H.-L.; Sotiropoulos, F.; Yoganathan, A.P. Flow in a mechanical bileaflet heart valve at laminar and near-peak systole flow rates: CFD simulations and experiments. J. Biomech. Eng. 2005, 127, 782–797. [Google Scholar] [CrossRef] [PubMed]
  16. Brücker, C.; Steinseifer, U.; Schröder, W.; Reul, H. Unsteady flow through a new mechanical heart valve prosthesis analysed by digital particle image velocimetry. Meas. Sci. Technol. 2002, 13, 1043. [Google Scholar] [CrossRef]
  17. Dasi, L.P.; Ge, L.; Simon, H.A.; Sotiropoulos, F.; Yoganathan, A.P. Vorticity dynamics of a bileaflet mechanical heart valve in an axisymmetric aorta. Phys. Fluids 2007, 19, 067105. [Google Scholar] [CrossRef]
  18. Bellofiore, A.; Quinlan, N.J. High-resolution measurement of the unsteady velocity field to evaluate blood damage induced by a mechanical heart valve. Ann. Biomed. Eng. 2011, 39, 2417–2429. [Google Scholar] [CrossRef] [PubMed]
  19. Garcia, D.; Pibarot, P.; Dumesnil, J.G.; Sakr, F.; Durand, L.G. Assessment of aortic valve stenosis severity: A new index based on the energy loss concept. Circulation 2000, 101, 765–771. [Google Scholar] [CrossRef] [PubMed]
  20. Heinrich, R.S.; Fontaine, A.A.; Grimes, R.Y.; Sidhaye, A.; Yang, S.; Moore, K.E.; Levine, R.A.; Yoganathan, A.P. Experimental analysis of fluid mechanical energy losses in aortic valve stenosis: Importance of pressure recovery. Ann. Biomed. Eng. 1996, 24, 685–694. [Google Scholar] [CrossRef] [PubMed]
  21. Ismail, M.; Kabinejadian, F.; Nguyen, Y.N.; Wui, E.T.; Kim, S.; Leo, H.L. Hemodynamic assessment of extra-cardiac tricuspid valves using particle image velocimetry. Med. Eng. Phys. 2017, 50, 1–11. [Google Scholar] [CrossRef] [PubMed]
  22. Cao, K.; BukaČ, M.; Sucosky, P. Three-dimensional macro-scale assessment of regional and temporal wall shear stress characteristics on aortic valve leaflets. Comput. Methods Biomech. Biomed. Eng. 2016, 19, 603–613. [Google Scholar] [CrossRef] [PubMed]
  23. Hart, J.D.; Peters, G.W.M.; Schreurs, P.J.G.; Baaijens, F.P.T. A three-dimensional computational analysis of fluid-structure interaction in the aortic valve. J. Biomech. 2003, 36, 103–112. [Google Scholar] [CrossRef]
  24. Marom, G.; Haj-Ali, R.; Raanani, E.; Schäfers, H.-J.; Rosenfeld, M. A fluid-structure interaction model of the aortic valve with coaptation and compliant aortic root. Med. Biol. Eng. Comput. 2012, 50, 173–182. [Google Scholar] [CrossRef] [PubMed]
  25. Lavon, K.; Halevi, R.; Marom, G.; Zekry, S.B.; Hamdan, A.; Schäfers, H.J.; Raanani, E.; Haj-Ali, R. Fluid-Structure Interaction Models of Bicuspid Aortic Valves: The Effects of Nonfused Cusp Angles. J. Biomech. Eng. 2018, 140, 031010. [Google Scholar] [CrossRef] [PubMed]
  26. Haj-Ali, R.; Dasi, L.P.; Kim, H.-S.; Choi, J.; Leo, H.W.; Yoganathan, A.P. Structural simulations of prosthetic tri-leaflet aortic heart valves. J. Biomech. 2008, 41, 1510–1519. [Google Scholar] [CrossRef] [PubMed]
  27. Labrosse, M.R.; Lobo, K.; Beller, C.J. Structural analysis of the natural aortic valve in dynamics: From unpressurized to physiologically loaded. J. Biomech. 2010, 43, 1916–1922. [Google Scholar] [CrossRef] [PubMed]
  28. Leo, H.L.; Dasi, L.P.; Carberry, J.; Simon, H.A.; Yoganathan, A.P. Fluid Dynamic Assessment of Three Polymeric Heart Valves Using Particle Image Velocimetry. Ann. Biomed. Eng. 2006, 34, 936–952. [Google Scholar] [CrossRef] [PubMed] [Green Version]
  29. Hasler, D.; Landolt, A.; Obrist, D. Tomographic PIV behind a prosthetic heart valve. Exp. Fluids 2016, 57, 80. [Google Scholar] [CrossRef]
  30. Saikrishnan, N.; Yap, C.-H.; Milligan, N.C.; Vasilyev, N.V.; Yoganathan, A.P. In vitro characterization of bicuspid aortic valve hemodynamics using particle image velocimetry. Ann. Biomed. Eng. 2012, 40, 1760–1775. [Google Scholar] [CrossRef] [PubMed]
  31. McNally, A.; Madan, A.; Sucosky, P. Morphotype-Dependent Flow Characteristics in Bicuspid Aortic Valve Ascending Aortas: A Benchtop Particle Image Velocimetry Study. Front. Physiol. 2017, 8. [Google Scholar] [CrossRef] [PubMed]
  32. Pisani, G.; Scaffa, R.; Ieropoli, O.; Dell’Amico, E.M.; Maselli, D.; Morbiducci, U.; De Paulis, R. Role of the sinuses of Valsalva on the opening of the aortic valve. J. Thorac. Cardiovasc. Surg. 2013, 145, 999–1003. [Google Scholar] [CrossRef] [PubMed]
  33. Salica, A.; Pisani, G.; Morbiducci, U.; Scaffa, R.; Massai, D.; Audenino, A.; Weltert, L.; Guerrieri Wolf, L.; De Paulis, R. The combined role of sinuses of Valsalva and flow pulsatility improves energy loss of the aortic valve. Eur. J. Cardio-Thorac. Surg. 2016, 49, 1222–1227. [Google Scholar] [CrossRef] [PubMed]
  34. Lomivorotov, V.V.; Efremov, S.M.; Kirov, M.Y.; Fominskiy, E.V.; Karaskov, A.M. Low-Cardiac-Output Syndrome After Cardiac Surgery. J. Cardiothorac. Vasc. Anesthesia 2017, 31, 291–308. [Google Scholar] [CrossRef] [PubMed]
  35. Rao, V.; Ivanov, J.; Weisel, R.D.; Ikonomidis, J.S.; Christakis, G.T.; David, T.E. Predictors of low cardiac output syndrome after coronary artery bypass. J. Thorac. Cardiovasc. Surg. 1996, 112, 38–51. [Google Scholar] [CrossRef]
  36. Buchmann, N.A.; Atkinson, C.; Jeremy, M.C.; Soria, J. Tomographic particle image velocimetry investigation of the flow in a modeled human carotid artery bifurcation. Exp. Fluids 2011, 50, 1131–1151. [Google Scholar] [CrossRef]
  37. Bombardini, T.; Gemignani, V.; Bianchini, E.; Venneri, L.; Petersen, C.; Pasanisi, E.; Pratali, L.; Alonso-Rodriguez, D.; Pianelli, M.; Faita, F.; et al. Diastolic time–frequency relation in the stress echo lab: Filling timing and flow at different heart rates. Cardiovasc. Ultrasound 2008, 6, 15. [Google Scholar] [CrossRef] [PubMed]
  38. Sarnari, R.; Kamal, R.Y.; Friedberg, M.K.; Silverman, N.H. Doppler assessment of the ratio of the systolic to diastolic duration in normal children: Relation to heart rate, age and body surface area. J. Am. Soc. Echocardiogr. Off. Publ. Am. Soc. Echocardiogr. 2009, 22, 928–932. [Google Scholar] [CrossRef] [PubMed]
  39. Chung, C.S.; Karamanoglu, M.; Kovács, S.J. Duration of diastole and its phases as a function of heart rate during supine bicycle exercise. Am. J. Physiol. Heart Circ. Physiol. 2004, 287, H2003–H2008. [Google Scholar] [CrossRef] [PubMed] [Green Version]
  40. Stein, P.D.; Sabbah, H.N. Measured Turbulence and Its Effect on Thrombus Formation. Circ. Res. 1974, 35, 608–614. [Google Scholar] [CrossRef] [PubMed] [Green Version]
  41. Fung, Y.C. Biomechanics: Mechanical Properties of Living Tissues; Springer Science & Business Media: Berlin, Germany, 2013; ISBN 978-1-4757-2257-4. [Google Scholar]
  42. Trip, R.; Kuik, D.J.; Westerweel, J.; Poelma, C. An experimental study of transitional pulsatile pipe flow. Phys. Fluids 2012, 24, 014103. [Google Scholar] [CrossRef] [Green Version]
  43. Borse, M.; Bhushan, S.; Walters, D.K.; Burgreen, G.W. Numerical simulations of flow pattern and particle trajectories in feline aorta for hypertrophic cardiomyopathy heart conditions. Eng. Appl. Comput. Fluid Mech. 2018, 12, 57–73. [Google Scholar] [CrossRef]
  44. Bell, V.; Mitchell, W.A.; Sigurðsson, S.; Westenberg, J.J.M.; Gotal, J.D.; Torjesen, A.A.; Aspelund, T.; Launer, L.J.; de Roos, A.; Gudnason, V.; et al. Longitudinal and Circumferential Strain of the Proximal Aorta. J. Am. Heart Assoc. Cardiovasc. Cerebrovasc. Dis. 2014, 3. [Google Scholar] [CrossRef]
  45. Büsen, M.; Arenz, C.; Neidlin, M.; Liao, S.; Schmitz-Rode, T.; Steinseifer, U.; Sonntag, S.J. Development of an In Vitro PIV Setup for Preliminary Investigation of the Effects of Aortic Compliance on Flow Patterns and Hemodynamics. Cardiovasc. Eng. Technol. 2017, 8, 368–377. [Google Scholar] [CrossRef] [PubMed]
  46. Moore, B.; Dasi, L.P. Spatiotemporal complexity of the aortic sinus vortex. Exp. Fluids 2014, 55, 1770. [Google Scholar] [CrossRef] [PubMed]
  47. Lansac, E.; Lim, H.S.; Shomura, Y.; Lim, K.H.; Rice, N.T.; Goetz, W.; Acar, C.; Duran, C.M.G. A four-dimensional study of the aortic root dynamics. Eur. J. Cardio-Thorac. Surg. 2002, 22, 497–503. [Google Scholar] [CrossRef] [Green Version]
  48. Clavel, M.-A.; Rodés-Cabau, J.; Dumont, É.; Bagur, R.; Bergeron, S.; De Larochellière, R.; Doyle, D.; Larose, É.; Dumesnil, J.G.; Pibarot, P. Validation and Characterization of Transcatheter Aortic Valve Effective Orifice Area Measured by Doppler Echocardiography. JACC Cardiovasc. Imaging 2011, 4, 1053–1062. [Google Scholar] [CrossRef] [PubMed] [Green Version]
Figure 1. Schematic of the cardiovascular flow simulator.
Fluids 03 00071 g001
Figure 2. The silicone aortic valve model and refractive index matching.
Fluids 03 00071 g002
Figure 3. Example raw image of the aortic root demonstrating (a) three major sites (aortic annulus, sinus, and sinotubular junction) for deformation analysis and (b) the effective length of the orifice (L).
Fluids 03 00071 g003
Figure 4. Pressure gradient waveforms (a) the pressure gradient in two cardiac cycles and the particle image velocimetry (PIV) measurement phases; (b) the pressure gradients under different reduced cardiac outputs.
Fluids 03 00071 g004
Figure 5. Contours of PIV phase-averaged velocity in x and y directions.
Fluids 03 00071 g005aFluids 03 00071 g005b
Figure 6. Out-of-plane vorticity fields at selected phases.
Fluids 03 00071 g006
Figure 7. Normalized turbulence kinetic energy.
Fluids 03 00071 g007
Figure 8. Deformation of the aortic root: (a) diameters at three sites; (b) the geometric orifice area of the valve during a cycle under the 4 L/min cardiac output.
Fluids 03 00071 g008
Figure 9. The inlet (a) and exit (b) jet centerline velocities at different phases under three cardiac outputs.
Fluids 03 00071 g009
Figure 10. Reynolds shear stress under reduced cardiac outputs (a) peak systole (phase 3); (b) after peak systole (phase 4).
Fluids 03 00071 g010
Figure 11. The structure deformation under reduced cardiac outputs. (a) The area strain; (b) geometric orifice area.
Fluids 03 00071 g011
Table 1. Basic hemodynamic and non-dimensional fluid dynamic parameters.
Cardiac OutputStroke VolumeReWo
[L/min][mL]
116.790311.7
233.32249
466.74370
Table 2. Area strain (AS) and maximum geometric orifice area (GOA) comparisons.
Cardiac Output1 L/min2 L/min4 L/minEffective Orifice Area of a Bioprosthetic Aortic Valve [48]Area Strain (Mean) [44]
GOA (cm2)0.71.01.61.37–1.9-
AS (%) at Aortic Annulus8.111.314.3--
AS (%) at Aortic Sinus2.84.67.0--
AS (%) at Sinotubular Junction2.97.27.9-8.1

