1. Introduction
The flow behavior of non-Newtonian fluid in small-caliber tubes is of high interest in practical applications (e.g., flow, mixing and separation of various biological species in microchips) [
1]. Blood exhibits non-Newtonian behavior, meaning that its viscosity depends on shear rate. The ability to predict blood flow pressure drop is essential in therapy strategy and the design of surgical repairments and implantable medical devices [
2]. An investigation on blood flow in small arteries is of both fundamental interest and practical significance [
2].
Blood is a two-phase suspension of plasma and cells that behaves as a non-Newtonian shear-thinning viscoplastic liquid. The plasma exhibits Newtonian behavior with a viscosity ranging from 1.10 to 1.35 mPa·s at 37 °C. It comprises of proteins (albumin, globulins and fibrinogen) that represent about 7–8 wt% of plasma, glucose, clotting factors, inorganic ions, dissolved gases, hormones and other substances at low concentration [
3]. The most abundant cells are the red blood cells (RBCs) or erythrocytes comprising about 95% of the cellular component of blood while the remaining 5% are comprised of white cells and platelets. The non-Newtonian shear-thinning character of blood results from variations in the aggregation and deformation of the red cells. On the other hands, its viscosity is primarily affected by the volume percentage of red blood cells in blood, i.e., the hematocrit value.
The equations that define non-Newtonian flow, although well established, are highly complex compared to those defined for Newtonian flow [
4]. This is why in many papers, blood is treated as a Newtonian fluid. Although this assumption holds practically true for high shear rates, i.e., greater than 1000 s
−1, it is not valid for blood flow in small vessels [
5], where the Reynolds numbers are low, and the flow is laminar.
Research that addresses non-Newtonian fluid flow is based on the pioneering work of Metzner and Reed [
6] in 1955. According to their approach the same friction factor chart could be used for Newtonian and time-independent non-Newtonian fluids in the laminar or turbulent region. However, only provided that an appropriate effective Reynolds number can be estimated. In this way the problem reduces to the quest of an appropriate effective viscosity, which would relate the behavior of the non-Newtonian fluid to an equivalent one of a hypothetical Newtonian fluid [
7]. Nevertheless, the calculations seem to be complex and rather laborious because the suggested equations must be solved iteratively.
Many models have been developed to describe blood viscosity, e.g., Casson, Hershel-Bulkley, Carreau and Quemada [
8]. Chilton and Stainsby [
4] suggested a model for Hershel-Bulkley fluids that iteratively computes the friction factor both in laminar and turbulent flow in pipes. However, this method does not take into account the effect of hematocrit. Cruz et al. [
9] proposed a generalized method for predicting friction factors in fully developed non-Newtonian laminar flow in circular pipes using several viscoelastic models i.e., Herschel-Bulkley, Bingham, Casson and Carreau-Yasuda. Their method, apart from the fluid velocity, the pipe diameter and the parameters of each rheological model utilized an apparent flow behavior index, where estimation was quite complicated. Therefore, the most prevalent model for predicting blood viscosity is the Casson model [
10] because its constants can be expressed as a function of hematocrit [
8] and it is reported to lead to reliable results [
11].
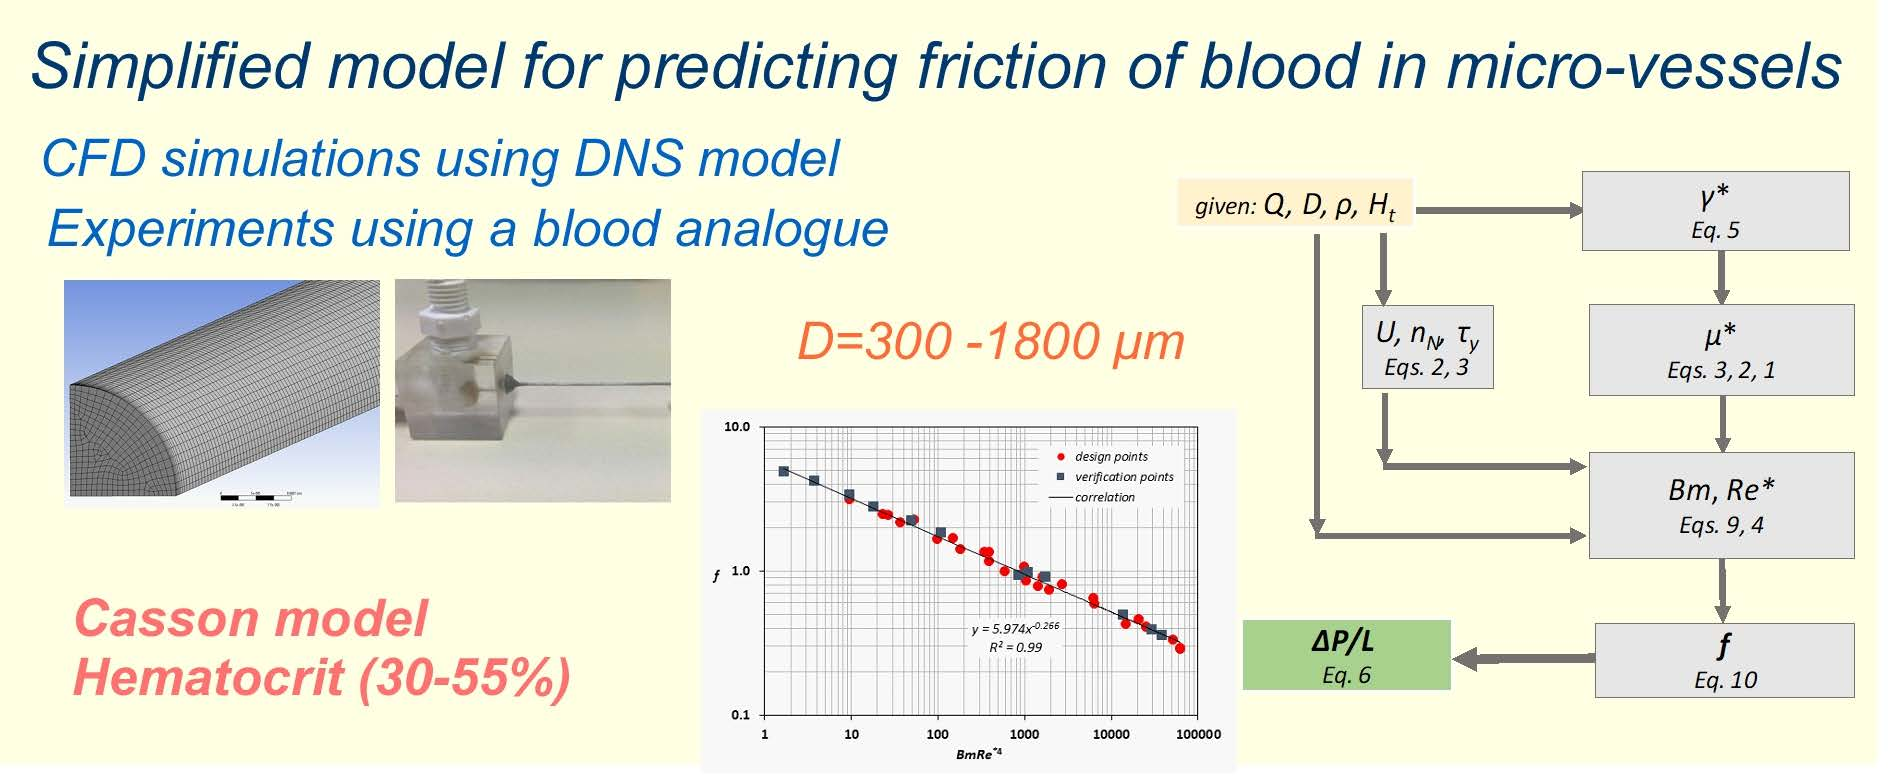
The pressure drop exerted during blood flow depends mainly on the diameter of a blood vessel, the blood flow rate as well as the hematocrit value [
11]. The aim of this study was to provide engineers and physicians with a simple, straightforward algorithm that could be applied to the prediction of the pressure losses, or equivalently, the Fanning friction factor during blood flow in small-diameter healthy vessels. As the experiments were difficult to perform and time consuming, the effect of the various parameters was evaluated by performing a series of Computational Fluid Dynamics (CFD) simulations, using a previously validated code. Due to the small diameter of the conduit, the corresponding Reynolds numbers were low (i.e., less than 50) and consequently the flow was regarded laminar.
2. Experimental Setup and Procedure
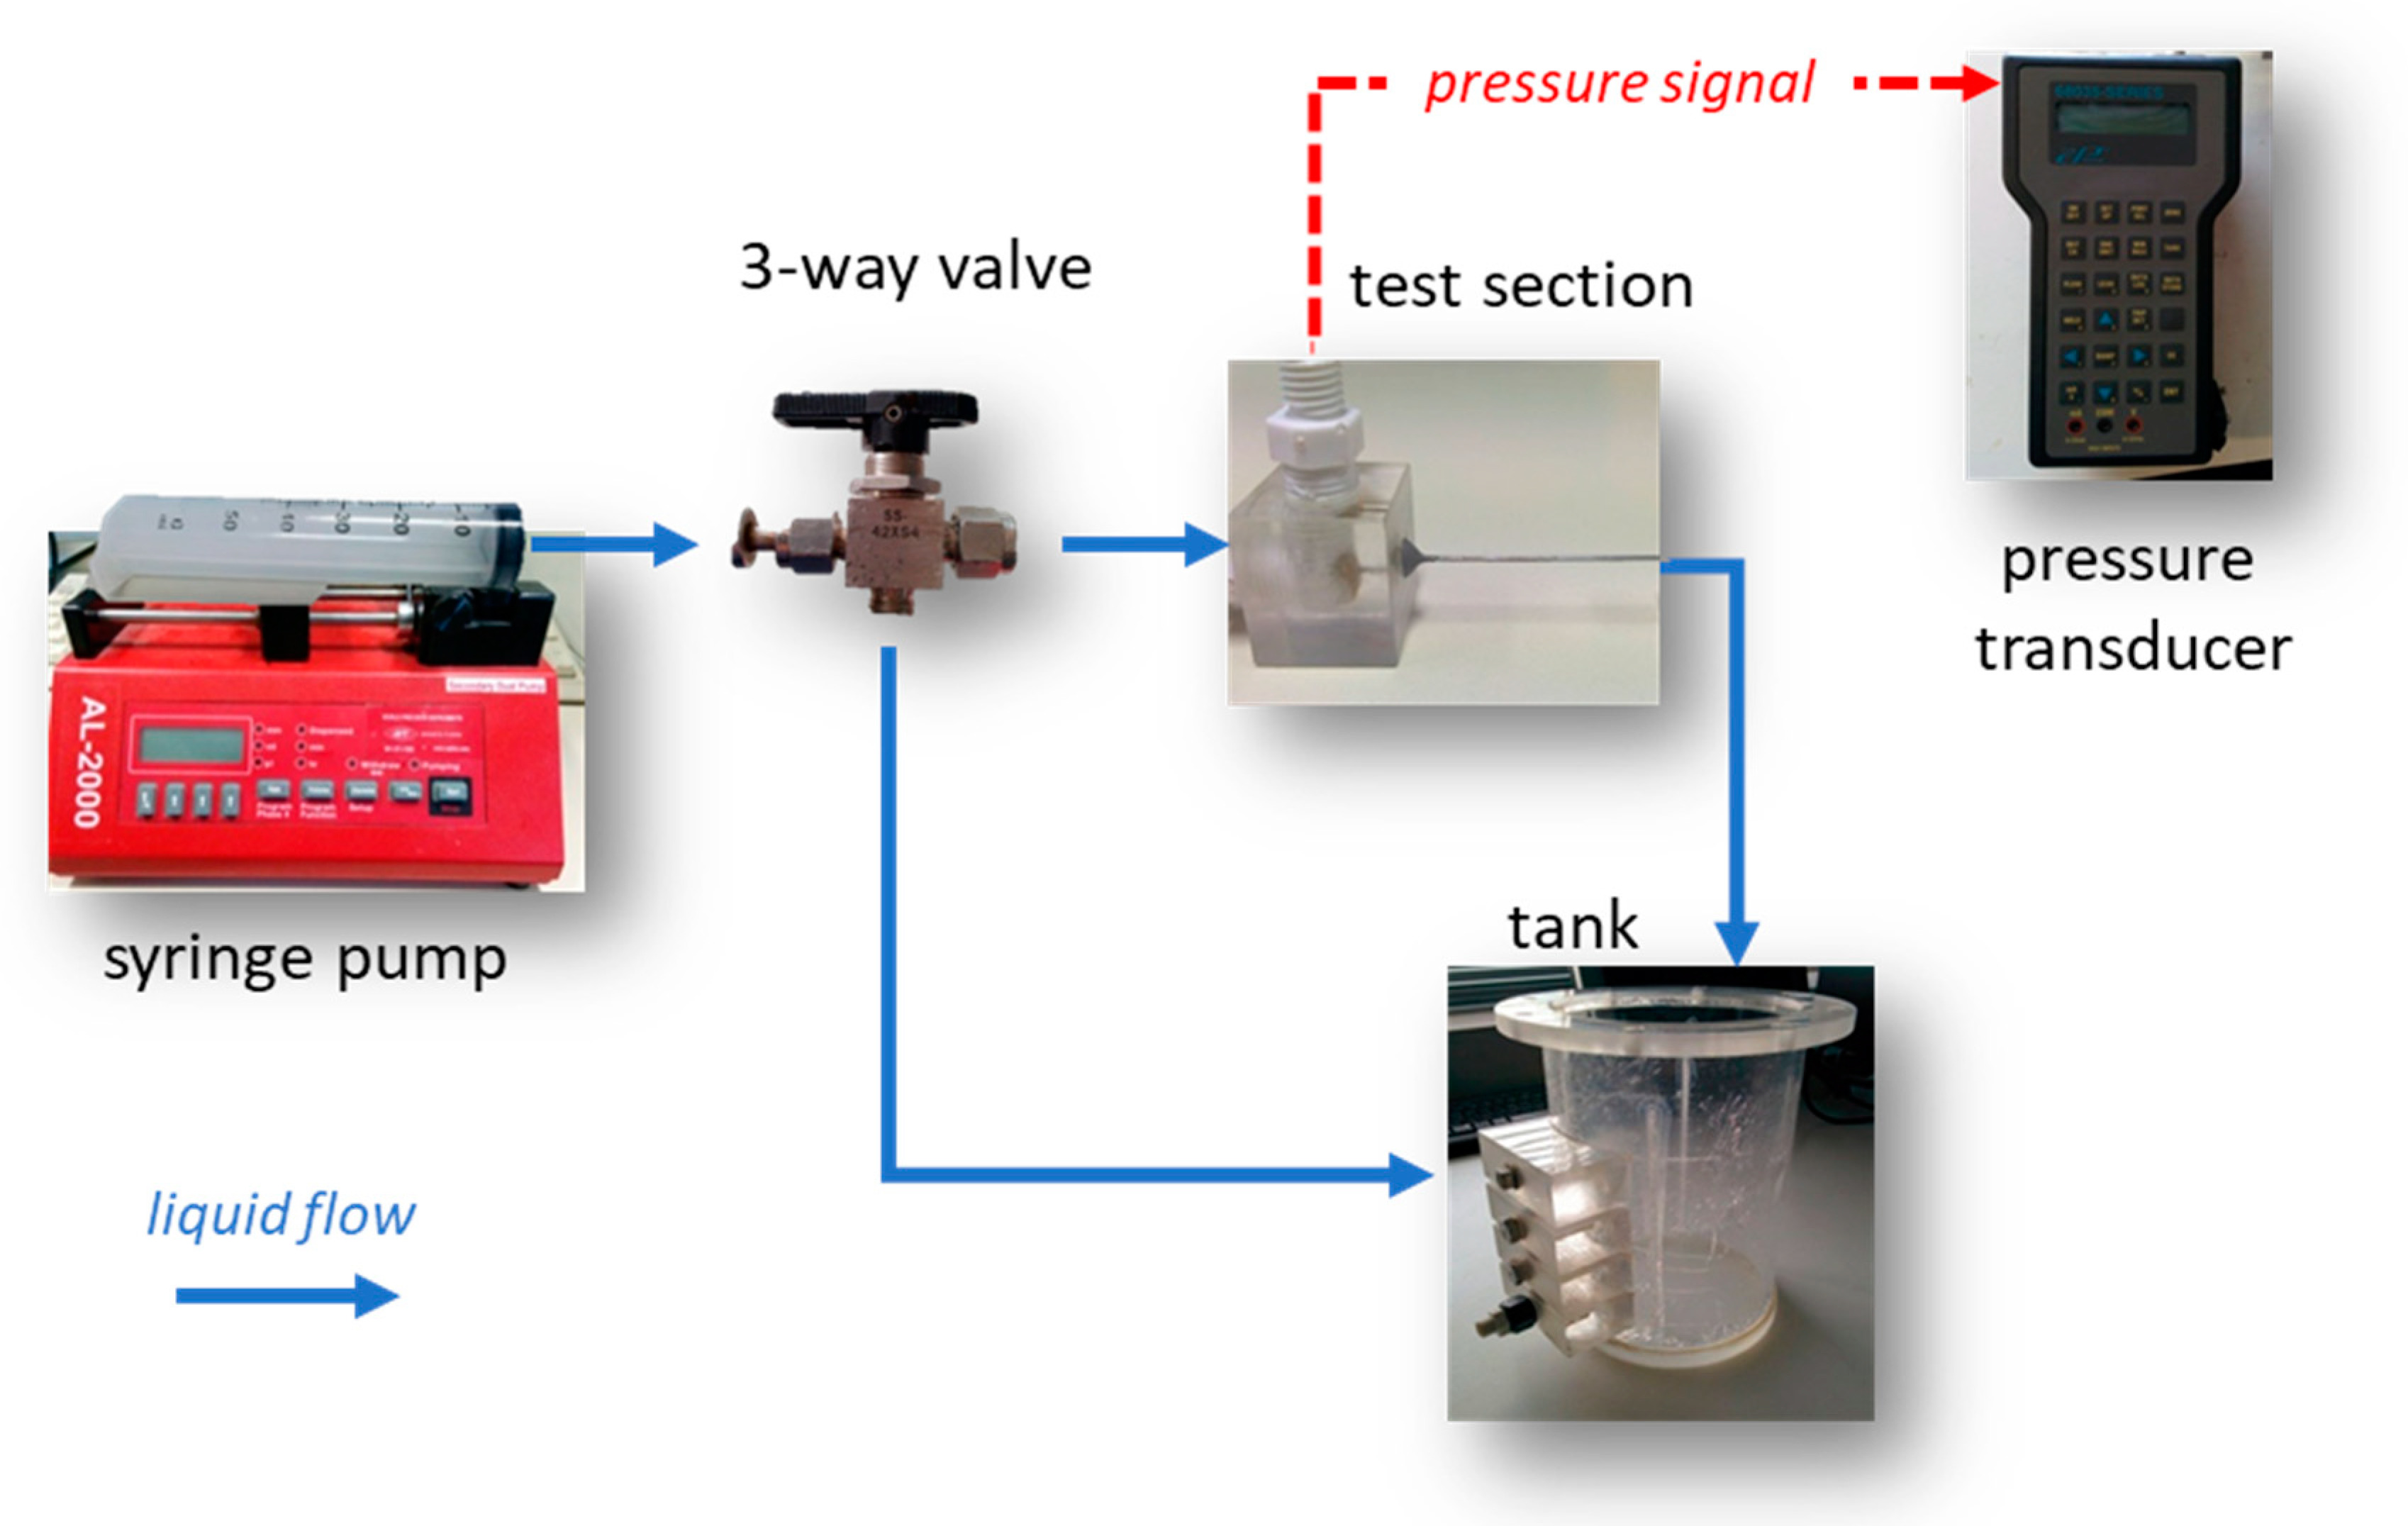
It is common practice prior to proceeding with simulations to validate the CFD code using data acquired by performing relevant experiments. The experimental setup used for the pressure drop measurements (
Figure 1) comprised the test section (
Figure 2), two syringe pumps (AL-2000, World Precision Instruments
®, Sarasota, FL, USA), a three-way valve and a digital pressure transducer (68035, Cole Palmer, Vernon Hills, IL, USA).
The use of two pumps was necessary to cover the desired Reynolds number range (i.e., 1–50). The three-way valve allowed for the refilling of the syringes without exposing the system to the atmospheric air. The pressure was monitored by connecting one of the manometer tubes to the microtube inlet, while the second was left open to the atmosphere.
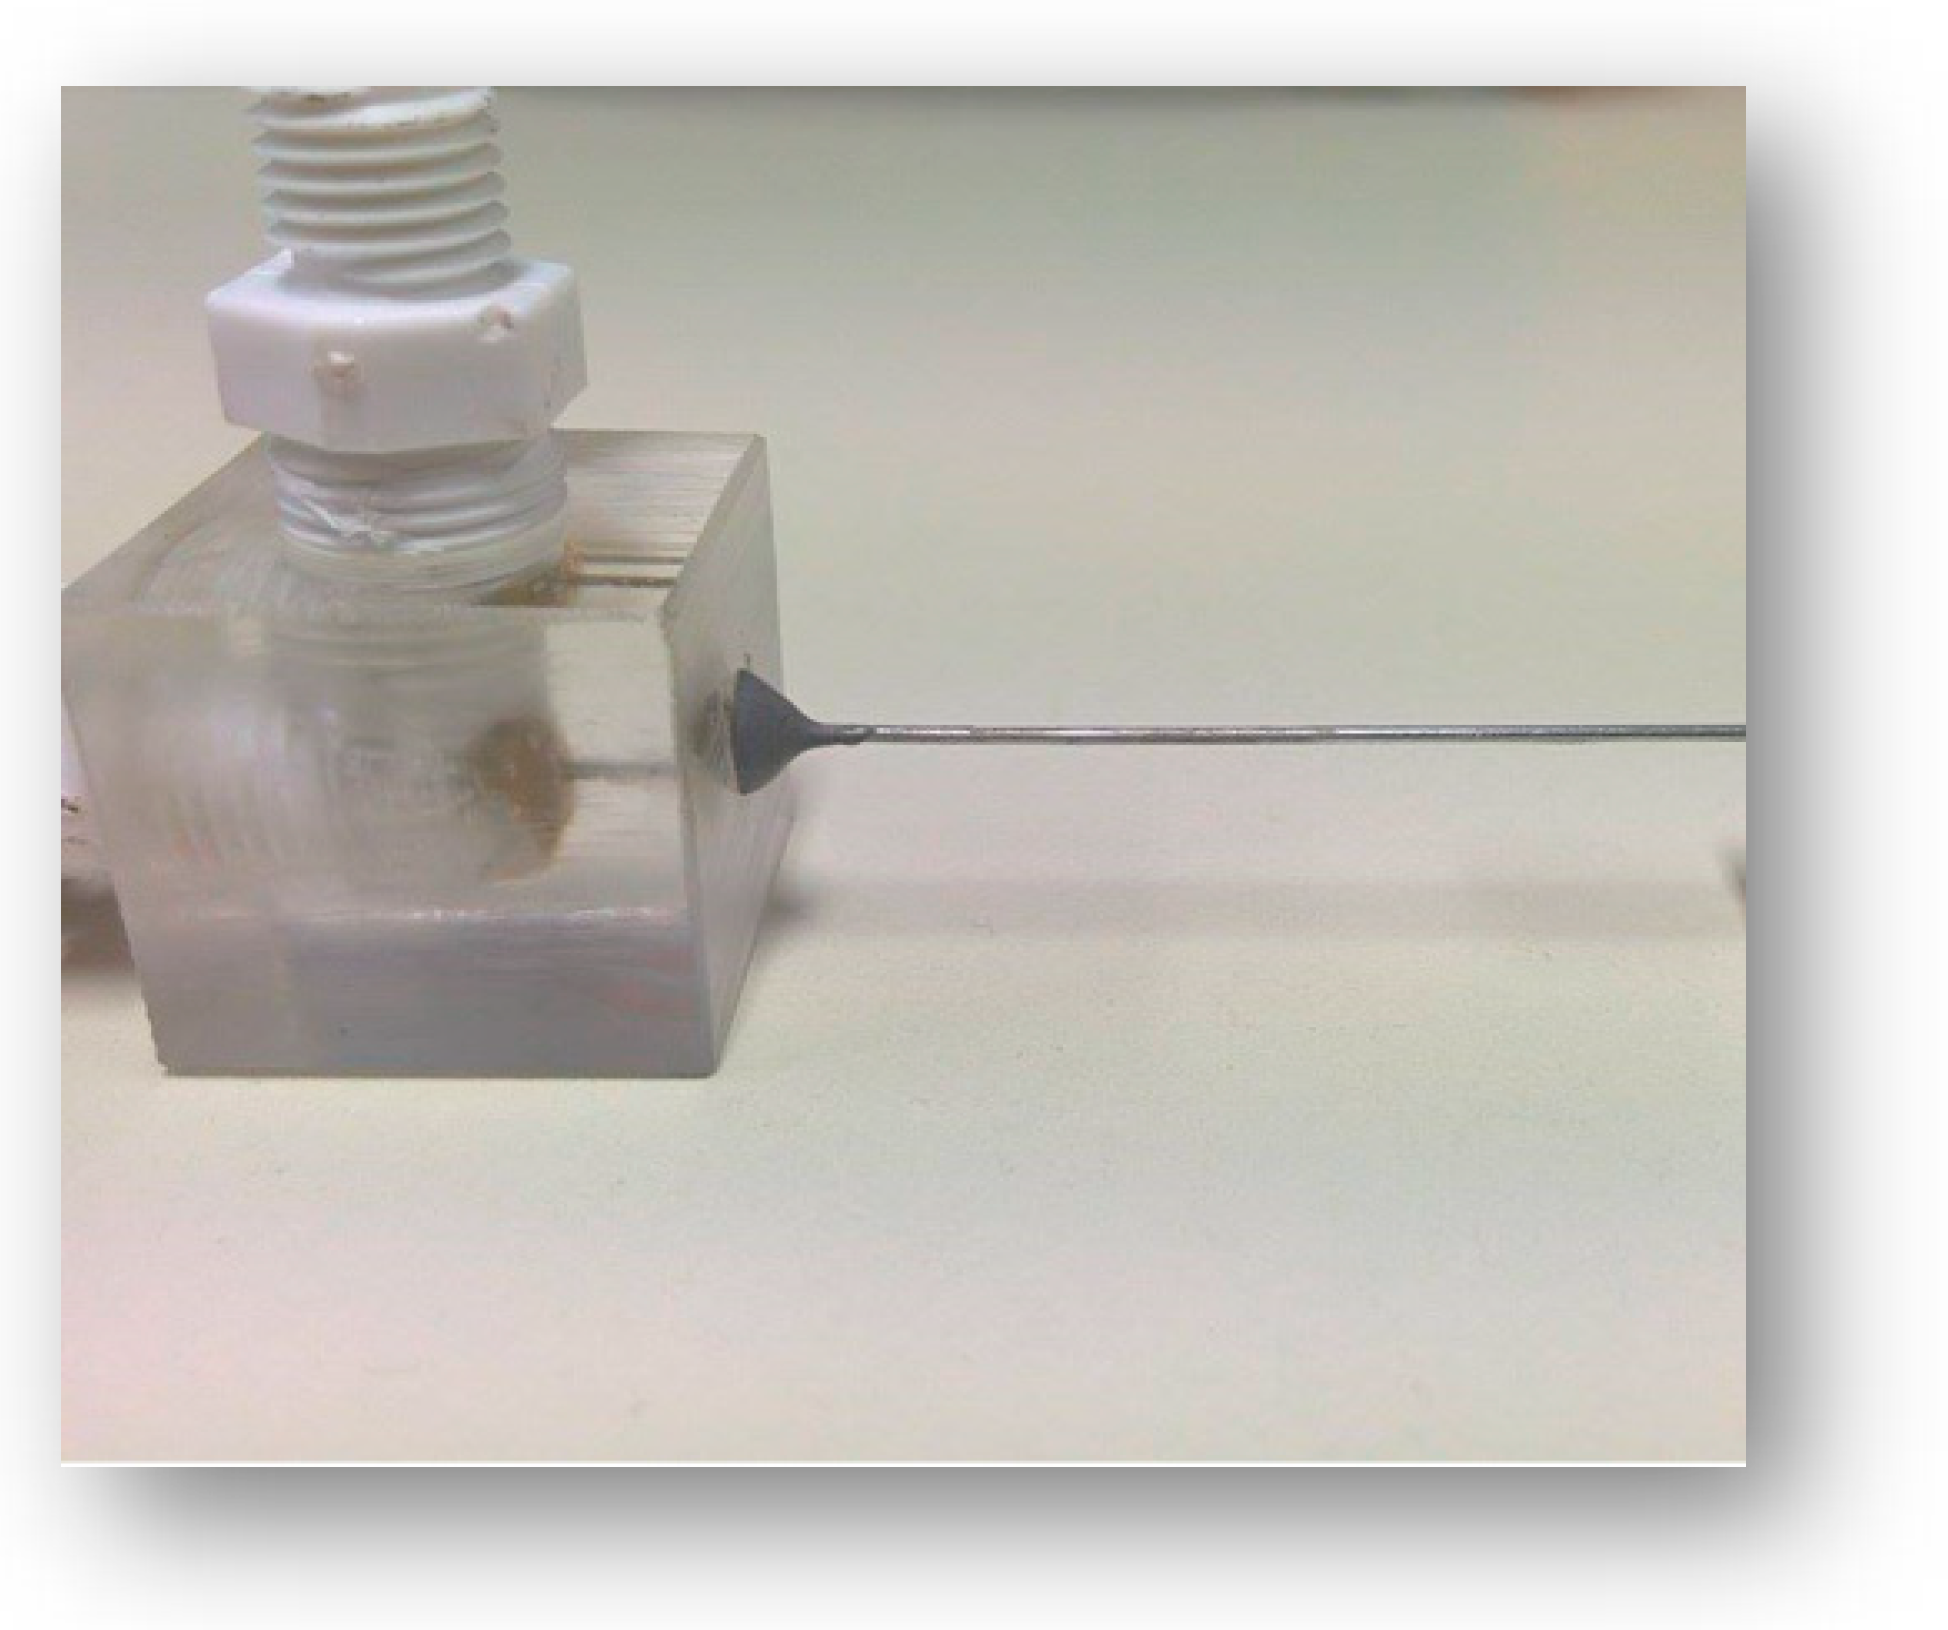
The test section (
Figure 2) consisted of a 50 mm microtube, i.e., a stainless steel (SS 304) chromatography needle (Gauge 33, Hamilton, Merck, Darmstadt, Germany) adjusted on a polymethyl methacrylate (PMMA) cube and connected to the feed and the manometer. All experiments were conducted at room temperature (i.e., 20 ± 1 °C).
The functionality of the setup was confirmed by performing experiments with a Newtonian fluid (i.e., water), while the CFD model was validated with data obtained from performing experiments with a non-Newtonian fluid, i.e., a blood analogue.
Blood Analogue
As experiments with blood are difficult to perform due to coagulation, blood-mimicking fluids were used, i.e., fluids whose rheological properties are similar to blood and whose viscosity follow the Casson model. As previously mentioned, the constants of the Casson model depend on the hematocrit value where the normal range is between 30% and 55% [
8].
The viscosity of blood can be expressed by Equation (1) [
3]:
where
μ is the viscosity of blood,
γ is the shear rate,
τy is the yield stress and
nN is the viscosity corresponding to high shear rates (asymptotic value). The yield stress is a measure of the amount of energy required to break down the aggregates of red blood cells formed at very low shear rates. Merrill [
8] extensively investigated blood rheology and confirmed the strong relationship between viscosity and hematocrit (
Ht) and suggested that the terms
nN and
τy of Equation (1) could be expressed as functions of hematocrit, i.e.,
where
np is the viscosity of the plasma,
and
Htc is the critical hematocrit below which the yield stress (
τy) can be considered negligible. For normal blood,
Htc ranges between 4 and 8 and
A is a constant, ranging between 0.6 × 10
−7 and 1.2 × 10
−7 Pa. These expressions are employed hereafter for predicting blood viscosity as a function of hematocrit [
8]. In this study, the values selected for
A and
Htc were 0.9 × 10
−7 Pa, and 6, respectively, i.e., the middle values of the corresponding range.
For the sake of simplicity, the variations in viscosity previous mentioned, could be attributed to several factors and were expressed in the simulations as a function of hematocrit alone. Blood density (ρ) was assumed to be constant, i.e., independent of the hematocrit value investigated and equal to 1060 kg/m3.
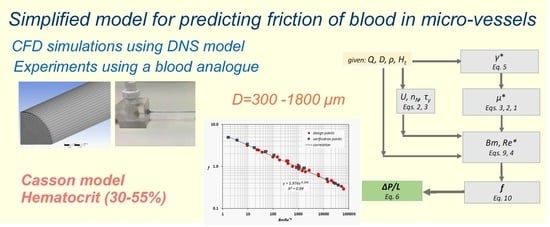
Thus, human blood with a
Ht of ~55% can be simulated by a 30%
v/
v aqueous glycerol solution that contains 0.035%
w/
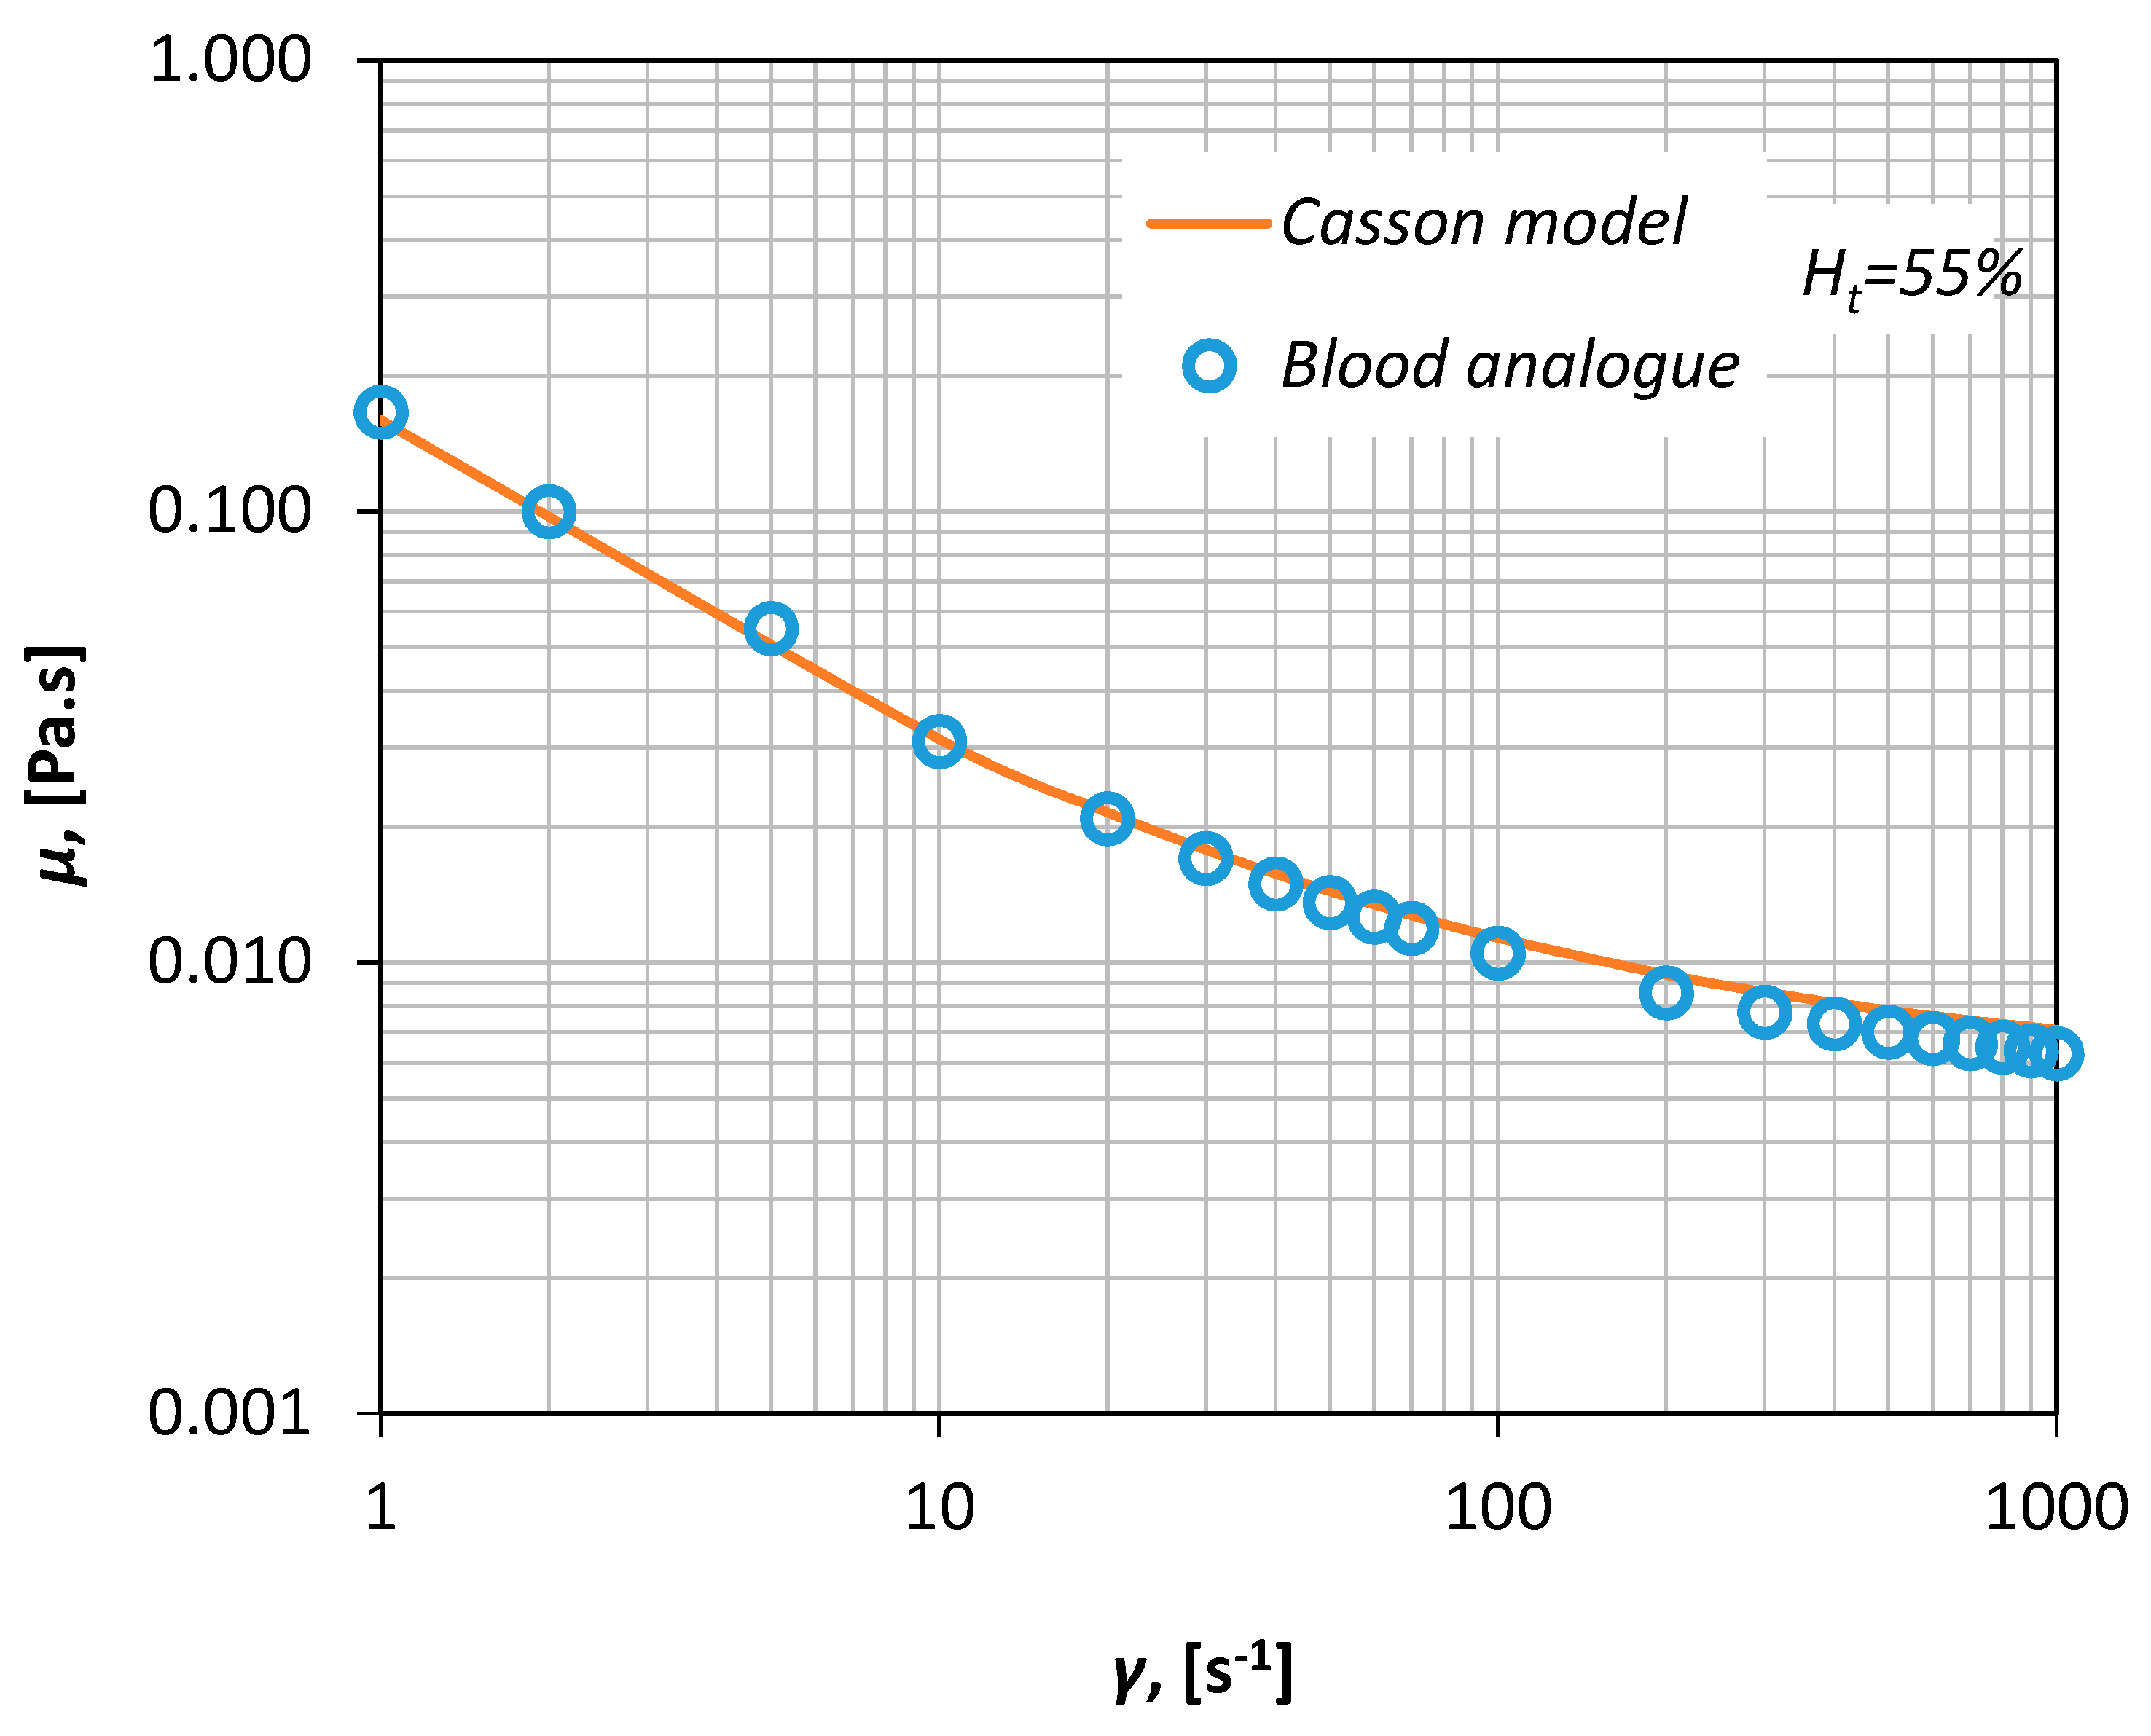
v xanthan gum, i.e., a polysaccharide that acts as a rheology modifier and renders the fluid non-Newtonian. The viscosity curve of the fluid was measured in our laboratory via a magnetic rheometer (AR-G2, TA Instruments, Sussex, UK), for shear rates between 1–1000 s
−1 (
Figure 3) resulting in an excellent fit shown by a Casson-type curve (Equation (1)).
3. Numerical Simulations
CFD modeling is considered a dependable tool for studying blood flow characteristics in small-caliber vessels [
11]. In this study, a CFD code (ANSYS CFX 18.1, ANSYS, Inc., Karnosboro, PA, USA) was employed for simulating the flow. The code comprised of the usual parts of a standard CFD code, i.e., the pre-processing part, where the computational domain and the grid are constructed, the solver, where the discretized differential equations are iteratively solved and the post processing part where the results are analyzed and displayed in an illustrative way.
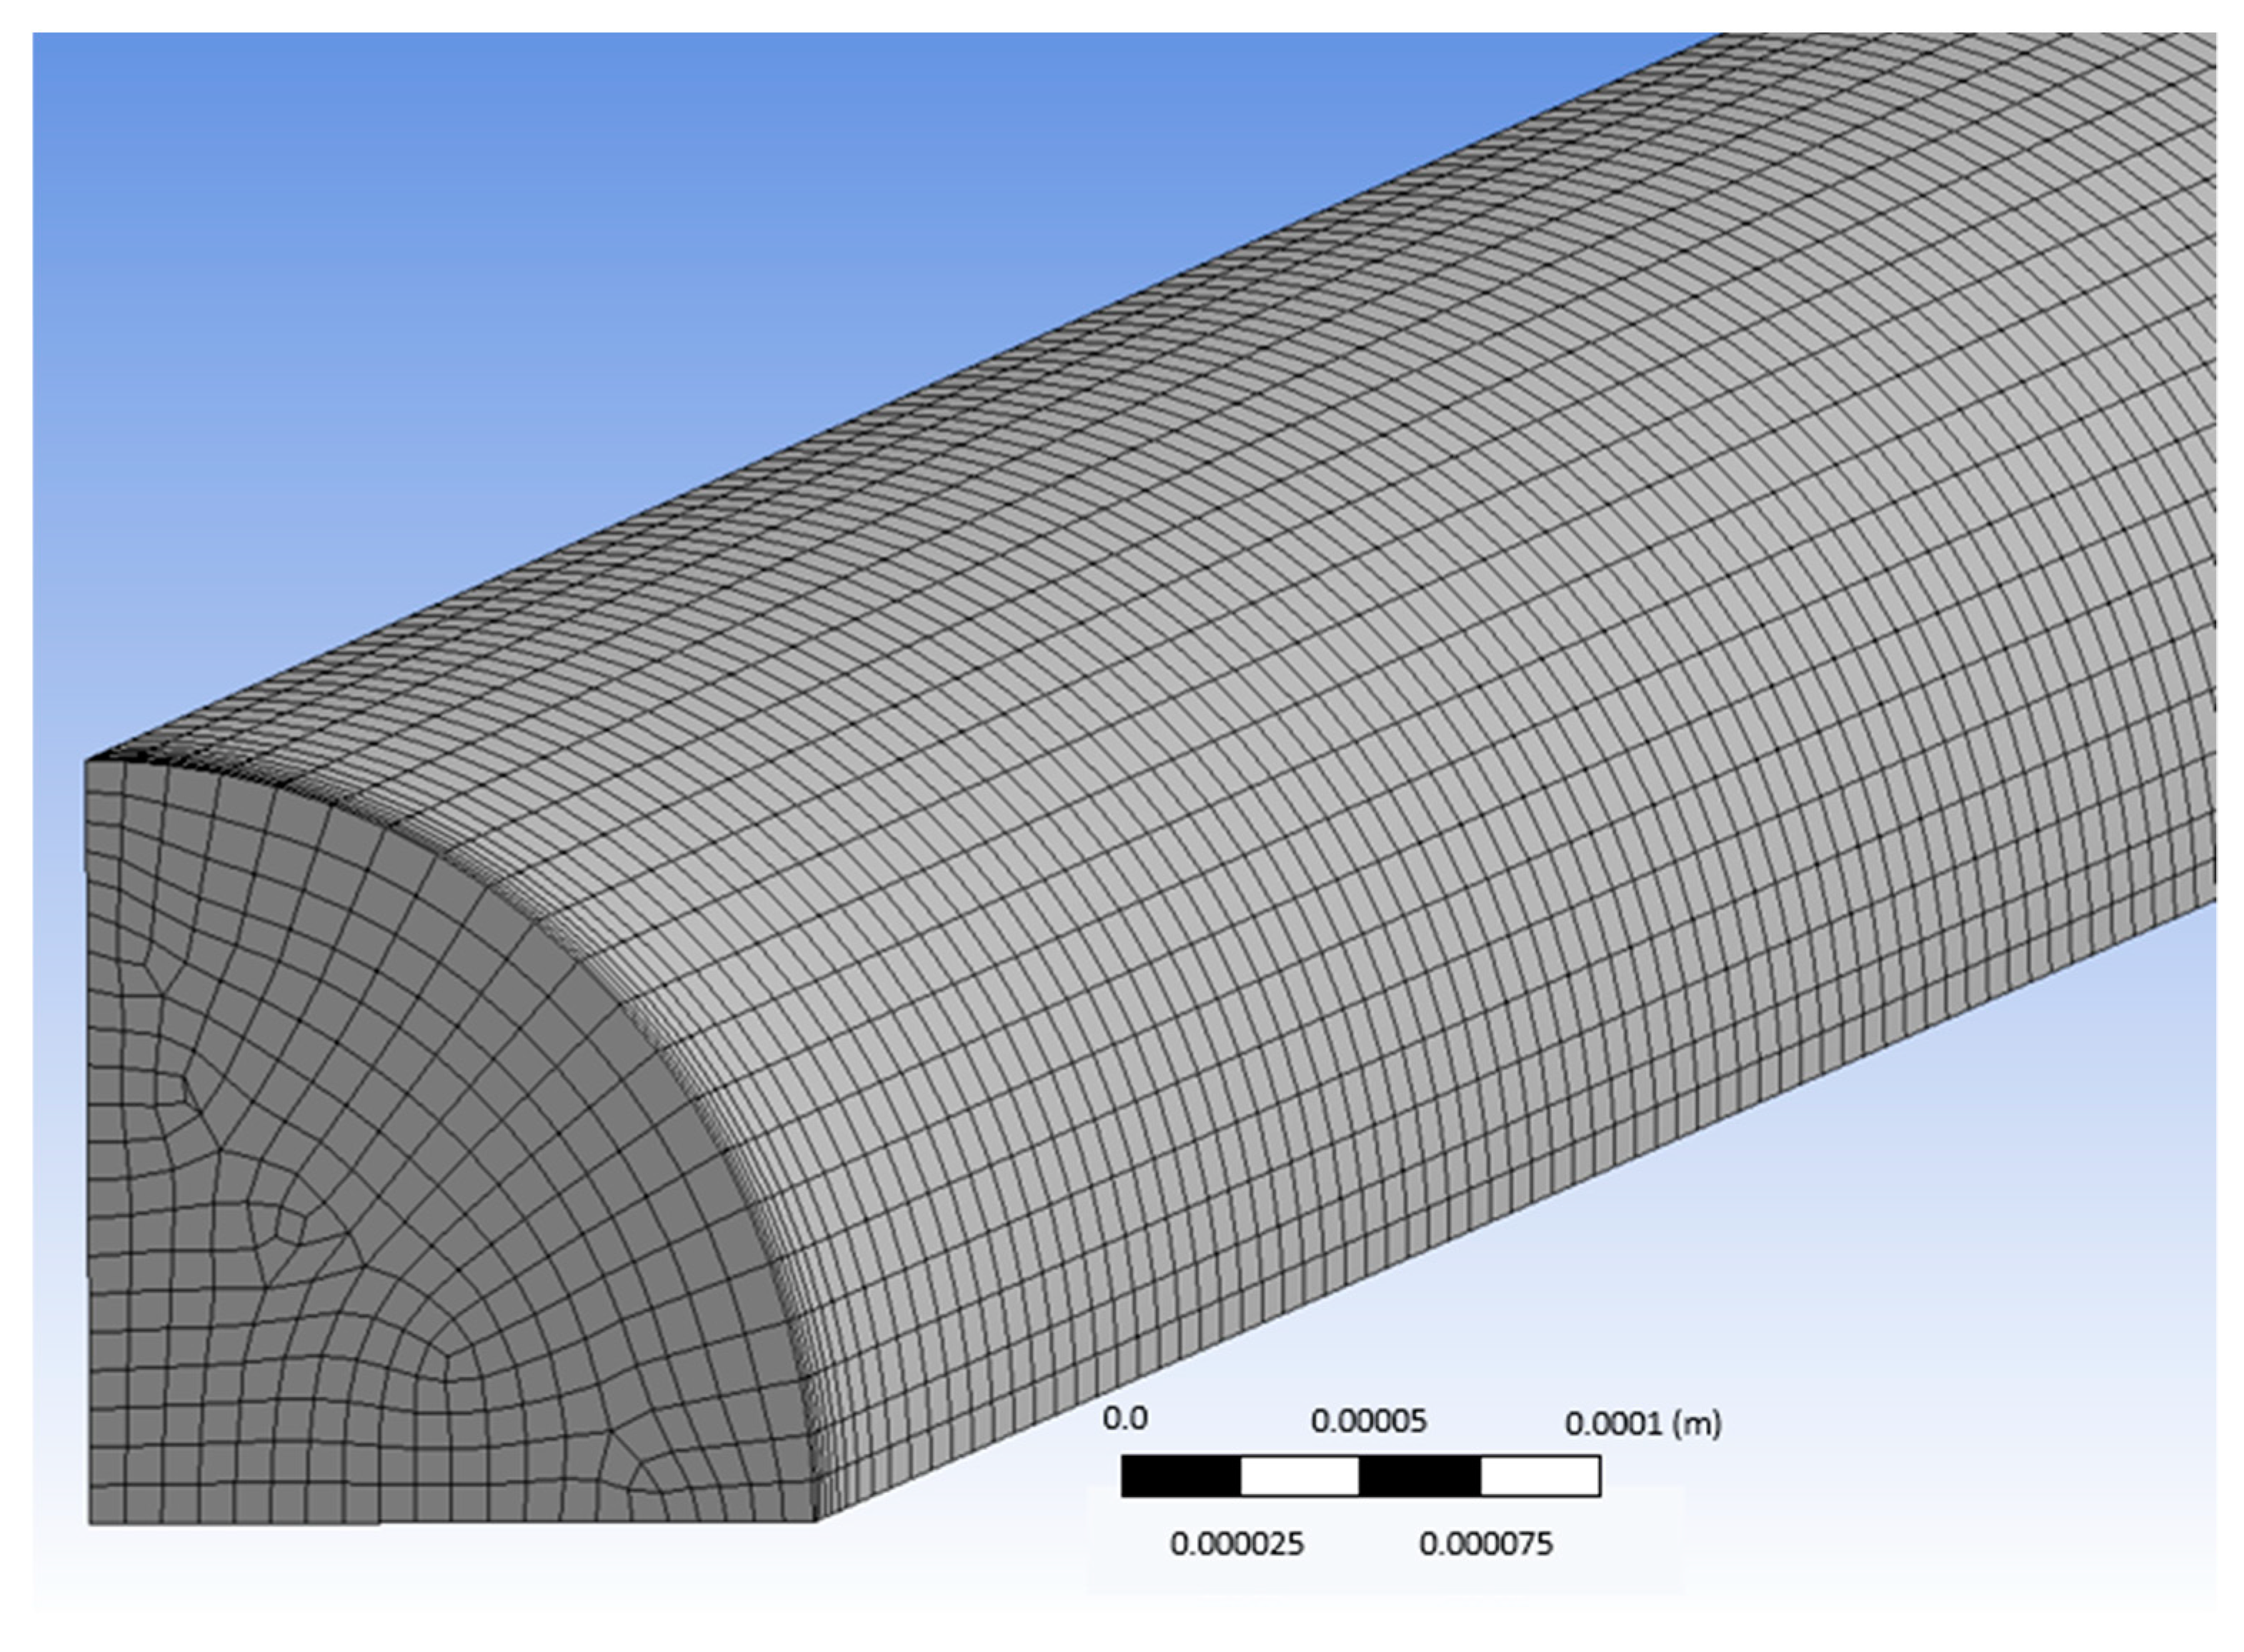
A blood vessel was modeled as a three-dimensional (3D) computational domain, while the geometry of the computational domain and the mesh were designed using the parametric features of the ANSYS Workbench package (version 18.1). The length of the conduit was 5 cm, the fluid density was assumed to be constant (i.e., 1060 kg/m
3), while the diameter of the conduit was a parametric variable and was set to be between 0.3–1.8 mm. With the aim of reducing memory consumption and CPU time and as the geometry consisted of two symmetry planes, only one fourth of the domain was used (
Figure 4).
Due to the small characteristic dimension of the conduit, the flow is laminar. Hence, the Direct Numerical Simulation (DNS) model was selected while the high-resolution advection scheme was used for the discretization of the momentum equations. A custom-made high-performance unit for parallel computing was used (24 nodes, 64 GB RAM). The simulations were run in a steady state, the vessel walls were considered smooth and the non-slip boundary condition was imposed at the walls, while the flow rate was kept constant for each run.
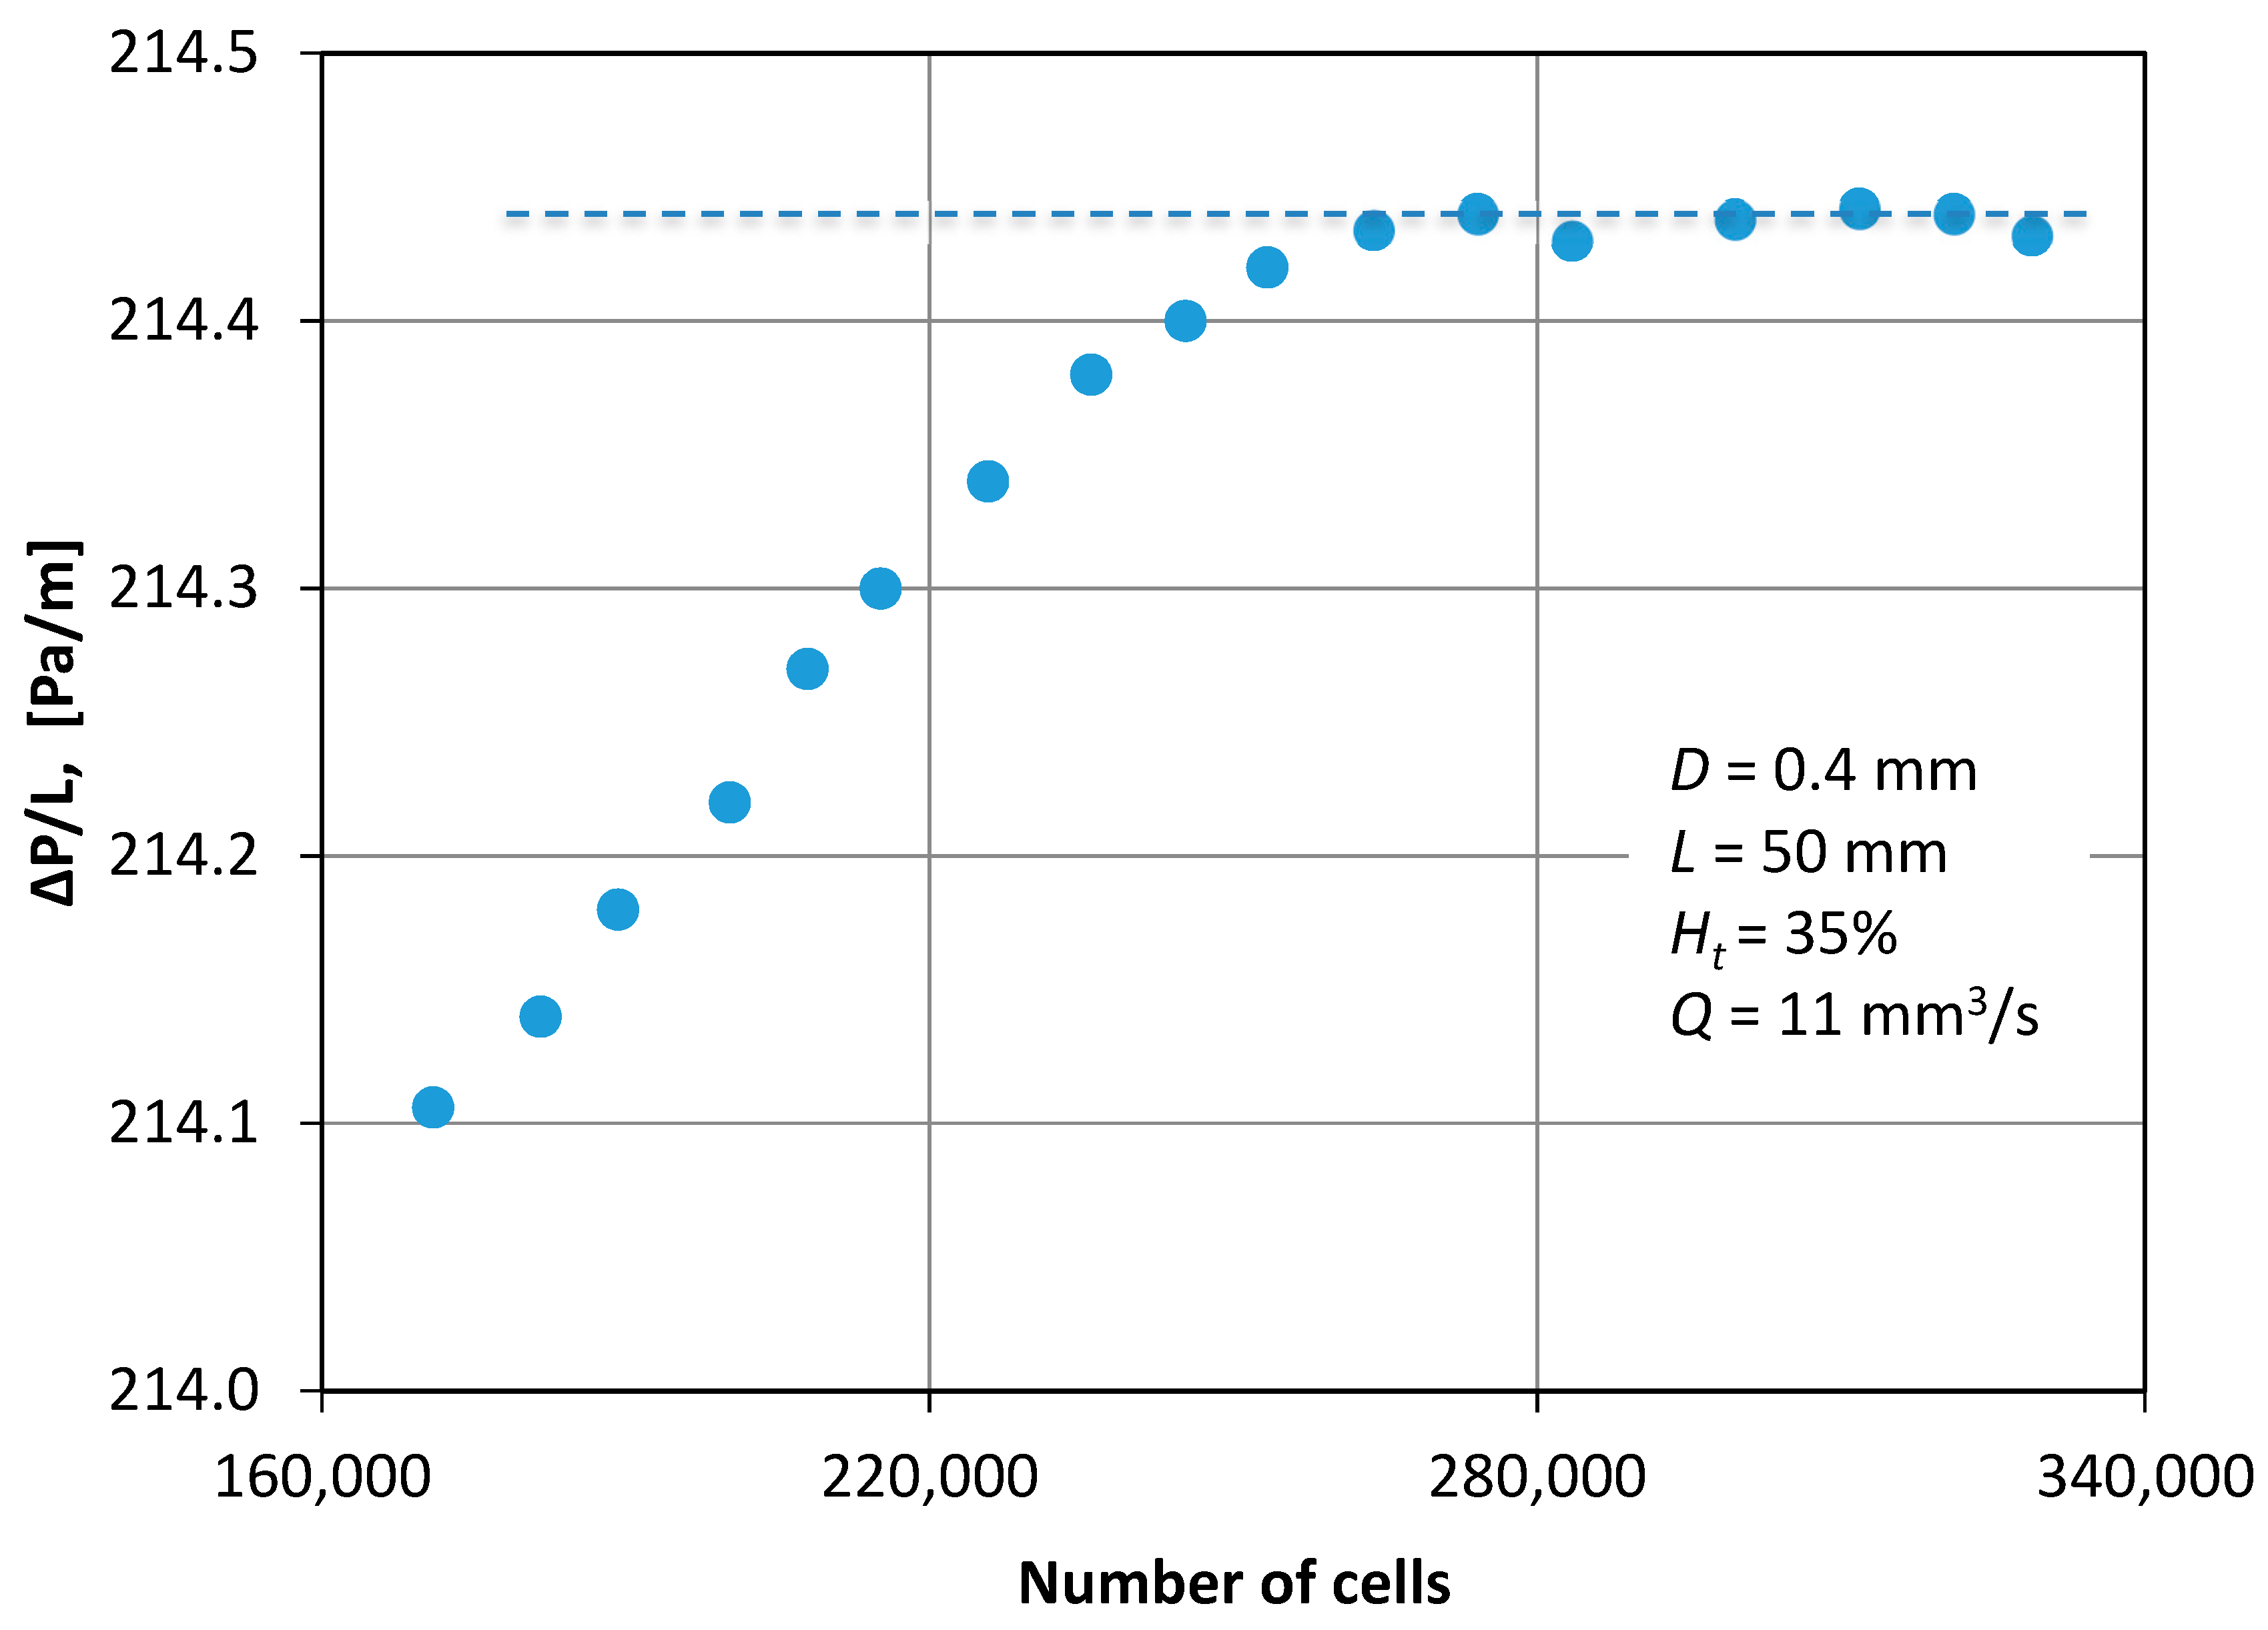
As the numerical diffusion in the CFD calculations are known to influence the accuracy of the calculations, an optimum grid density was chosen by performing a grid dependency study.
Figure 5 shows typical results that illustrate the dependence of pressure drop on the number of cells and corresponds to the maximum flow rate that was tested. Hence, 270,000 cells were chosen to ensure that the solution was independent of the grid density.
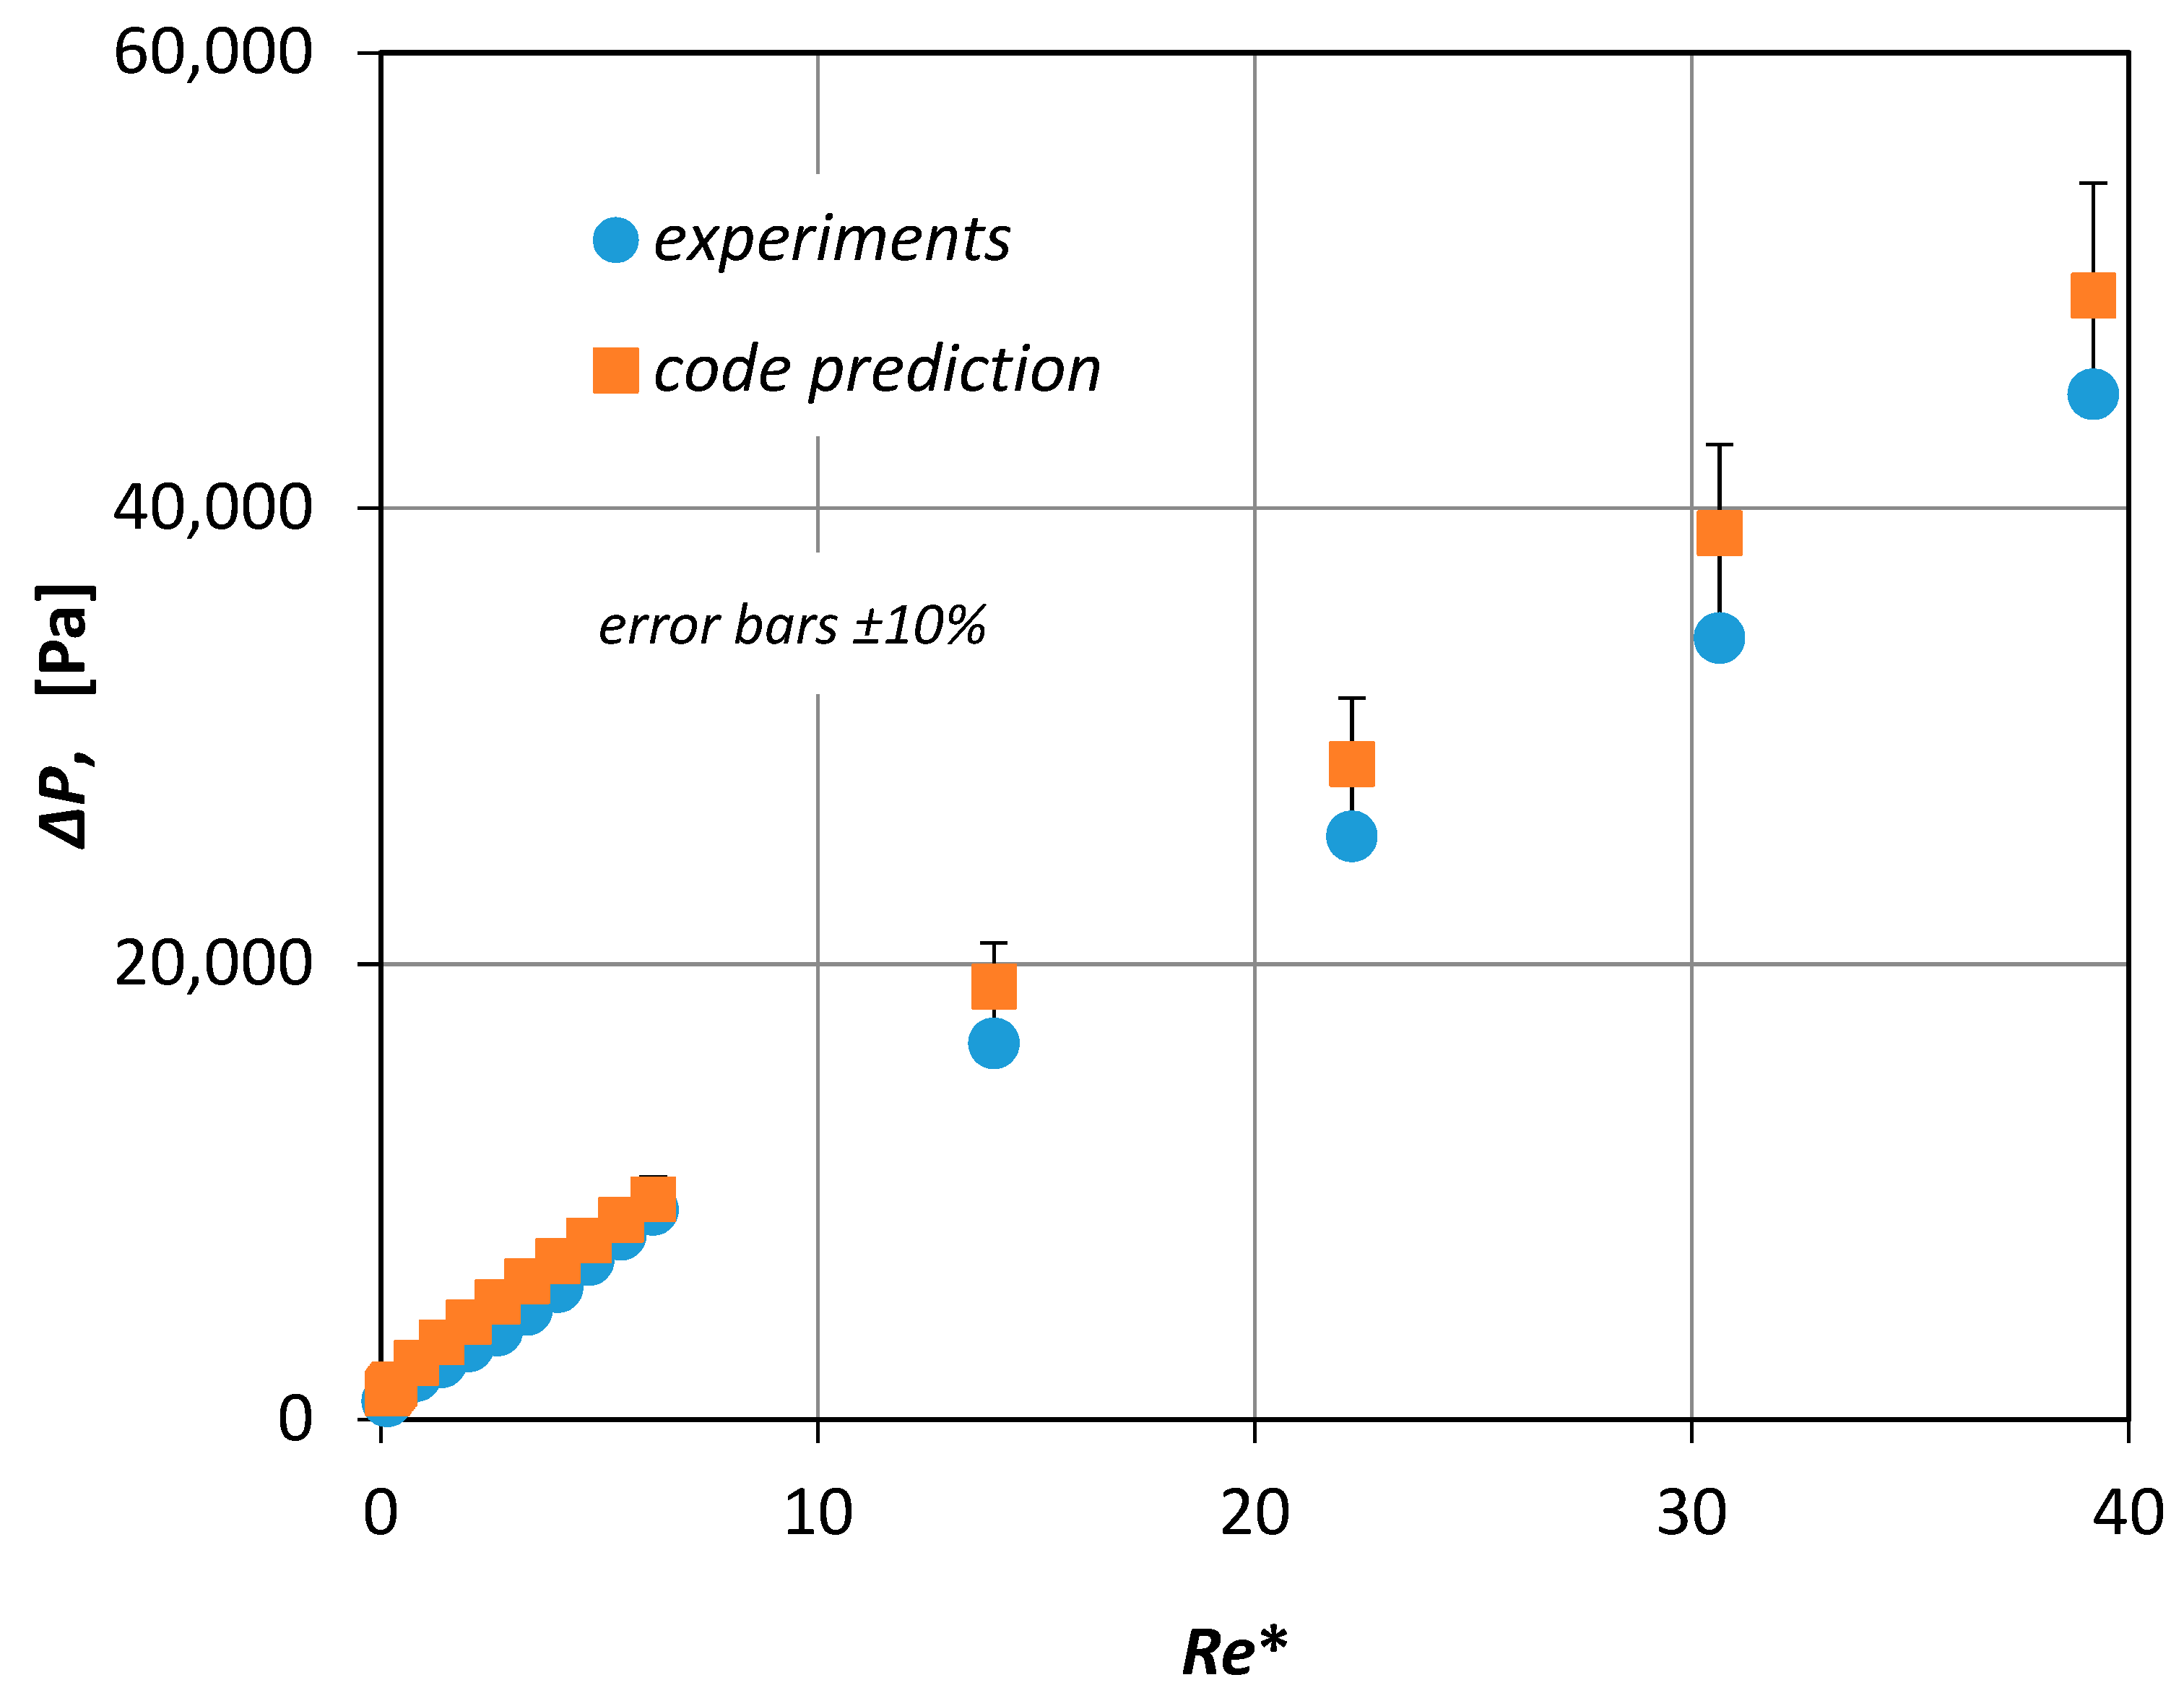
3.1. Code Validation
Usually, the validity of a CFD code is checked by comparing the numerical results with relevant experimental data. In the present study, appropriate experiments were performed using the experimental setup described in
Section 2. Furthermore, the experimental data presented in
Figure 6 together with the computational results proved to be in very good agreement (±10%). Since the viscosity of the non-Newtonian fluids was not constant, the pressure drop was plotted versus a modified Reynolds number
Re* (
Figure 6)
which in place of the fluid viscosity uses an effective viscosity
μ*, that corresponds to the pseudo-shear rate
γ* defined by Equation (5) [
3].
Here,
is the average fluid velocity,
Q is the volumetric blood flow rate and
D is the inside diameter of the vessel.
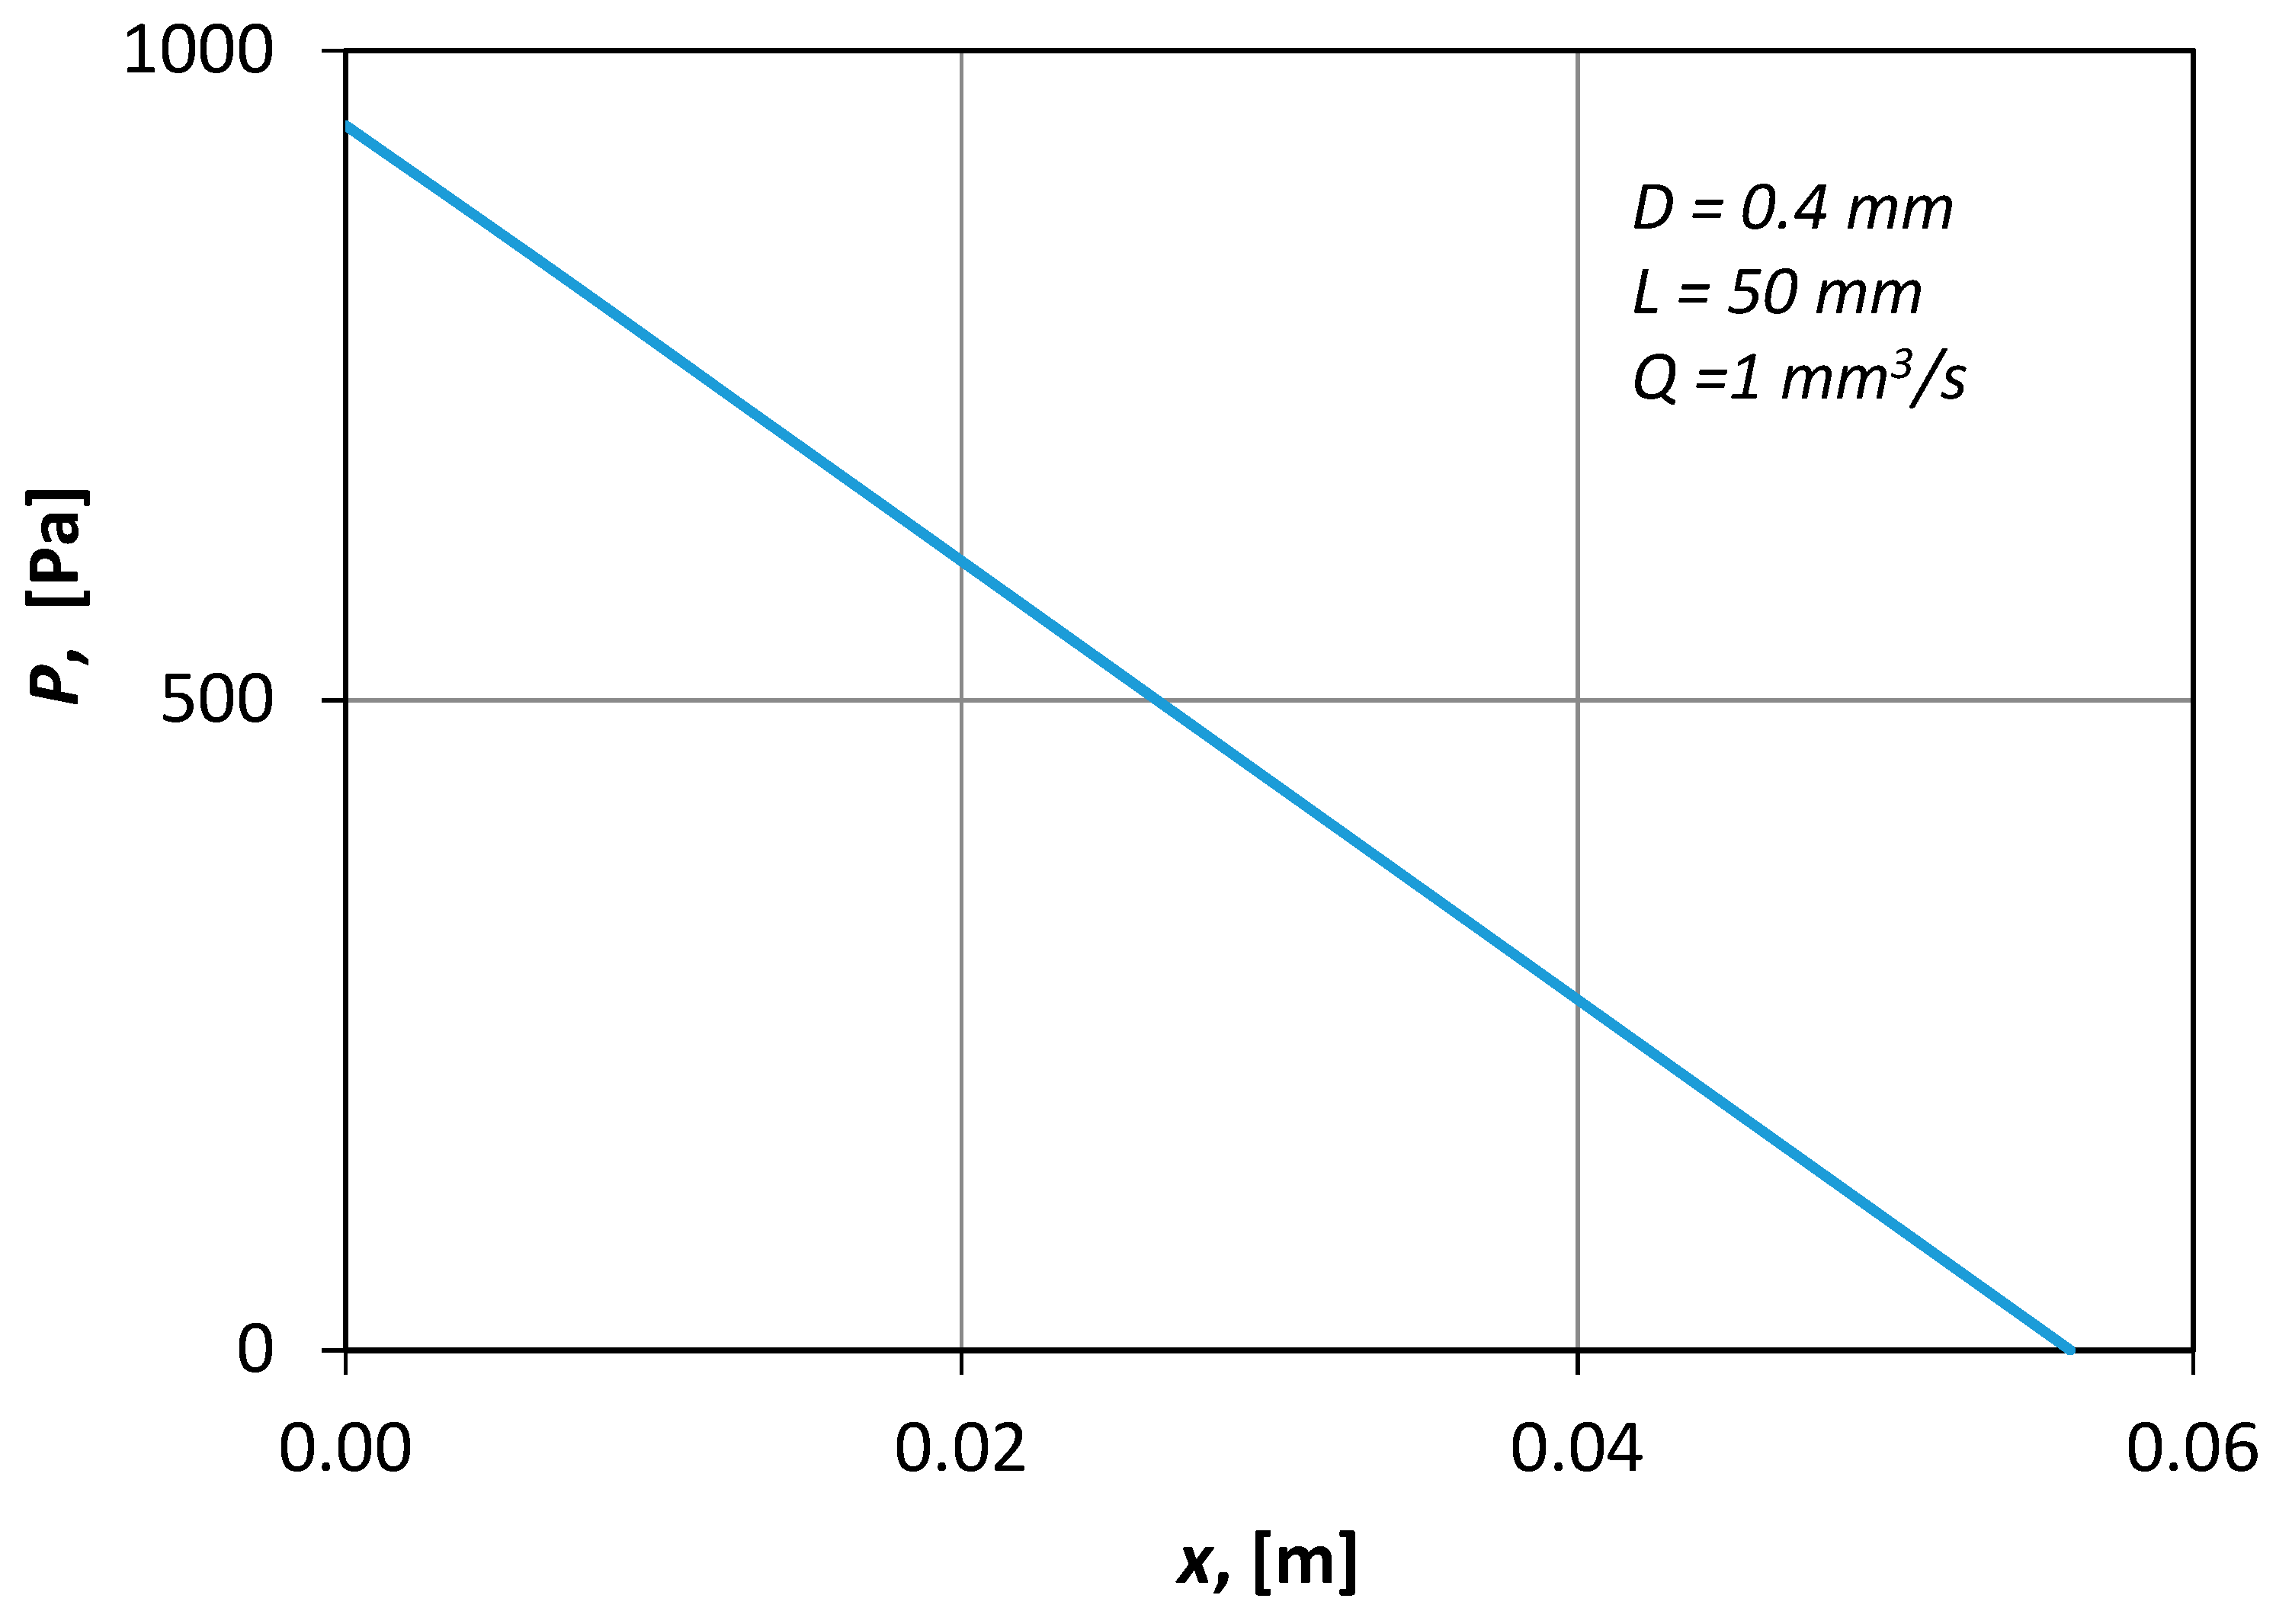
Figure 7 presents typical CFD results of the pressure distribution along the axis of the conduit. The shape of the curve (i.e., straight line) denotes that the flow was fully developed.
3.2. Numerical Procedure
A parametric study was performed by employing the Design Exploration features of the ANSYS Workbench
® package. The design variables selected along with the imposed upper and lower bounds are presented in
Table 1. The upper bound of the vessel inside diameter corresponds to the larger arterioles and venules of an adult male [
12], while the corresponding lower bound was chosen to be 500 μm to avoid the consequences of the Fahraeus-Lindqvist effect [
12]. Due to this effect in small vessels (smaller than 300 μm), red blood cells tend to drift towards the central axis of the vessel, forming a cell-free layer called a plasma layer along the vascular wall. This effect results in an apparent blood viscosity, which declines substantially with decreasing diameter [
13]. The hematocrit range that was chosen is typical for healthy adult humans [
8] and the blood flow rate bounds imposed are typical for such
μ-vessels.
To extract the necessary information from a limited number of test cases, the Design of Experiments (DOE) methodology was followed. In the present study, the effect of the design parameters was investigated by performing a series of “computational experiments” for certain values of the design parameters chosen by employing the Box-Behnken method [
14], i.e., an established DOE technique.
A DOE technique leads to reliable conclusions from the least possible number of design points.
Table 2 presents the various design points selected. Based on the computational results, the aim is to formulate appropriate design correlations that can be applied for the prediction of friction factor values during laminar blood flow in micro vessels.
The first three columns of
Table 2 include the design points dictated by the Box-Behnken method. The following three columns contain some additional points that extend the
D range to 0.3 mm. The last three columns of
Table 2 present appropriate verification points that lay within the range of design points. These were arbitrarily chosen and were used for testing the applicability of the design equation.
4. Results
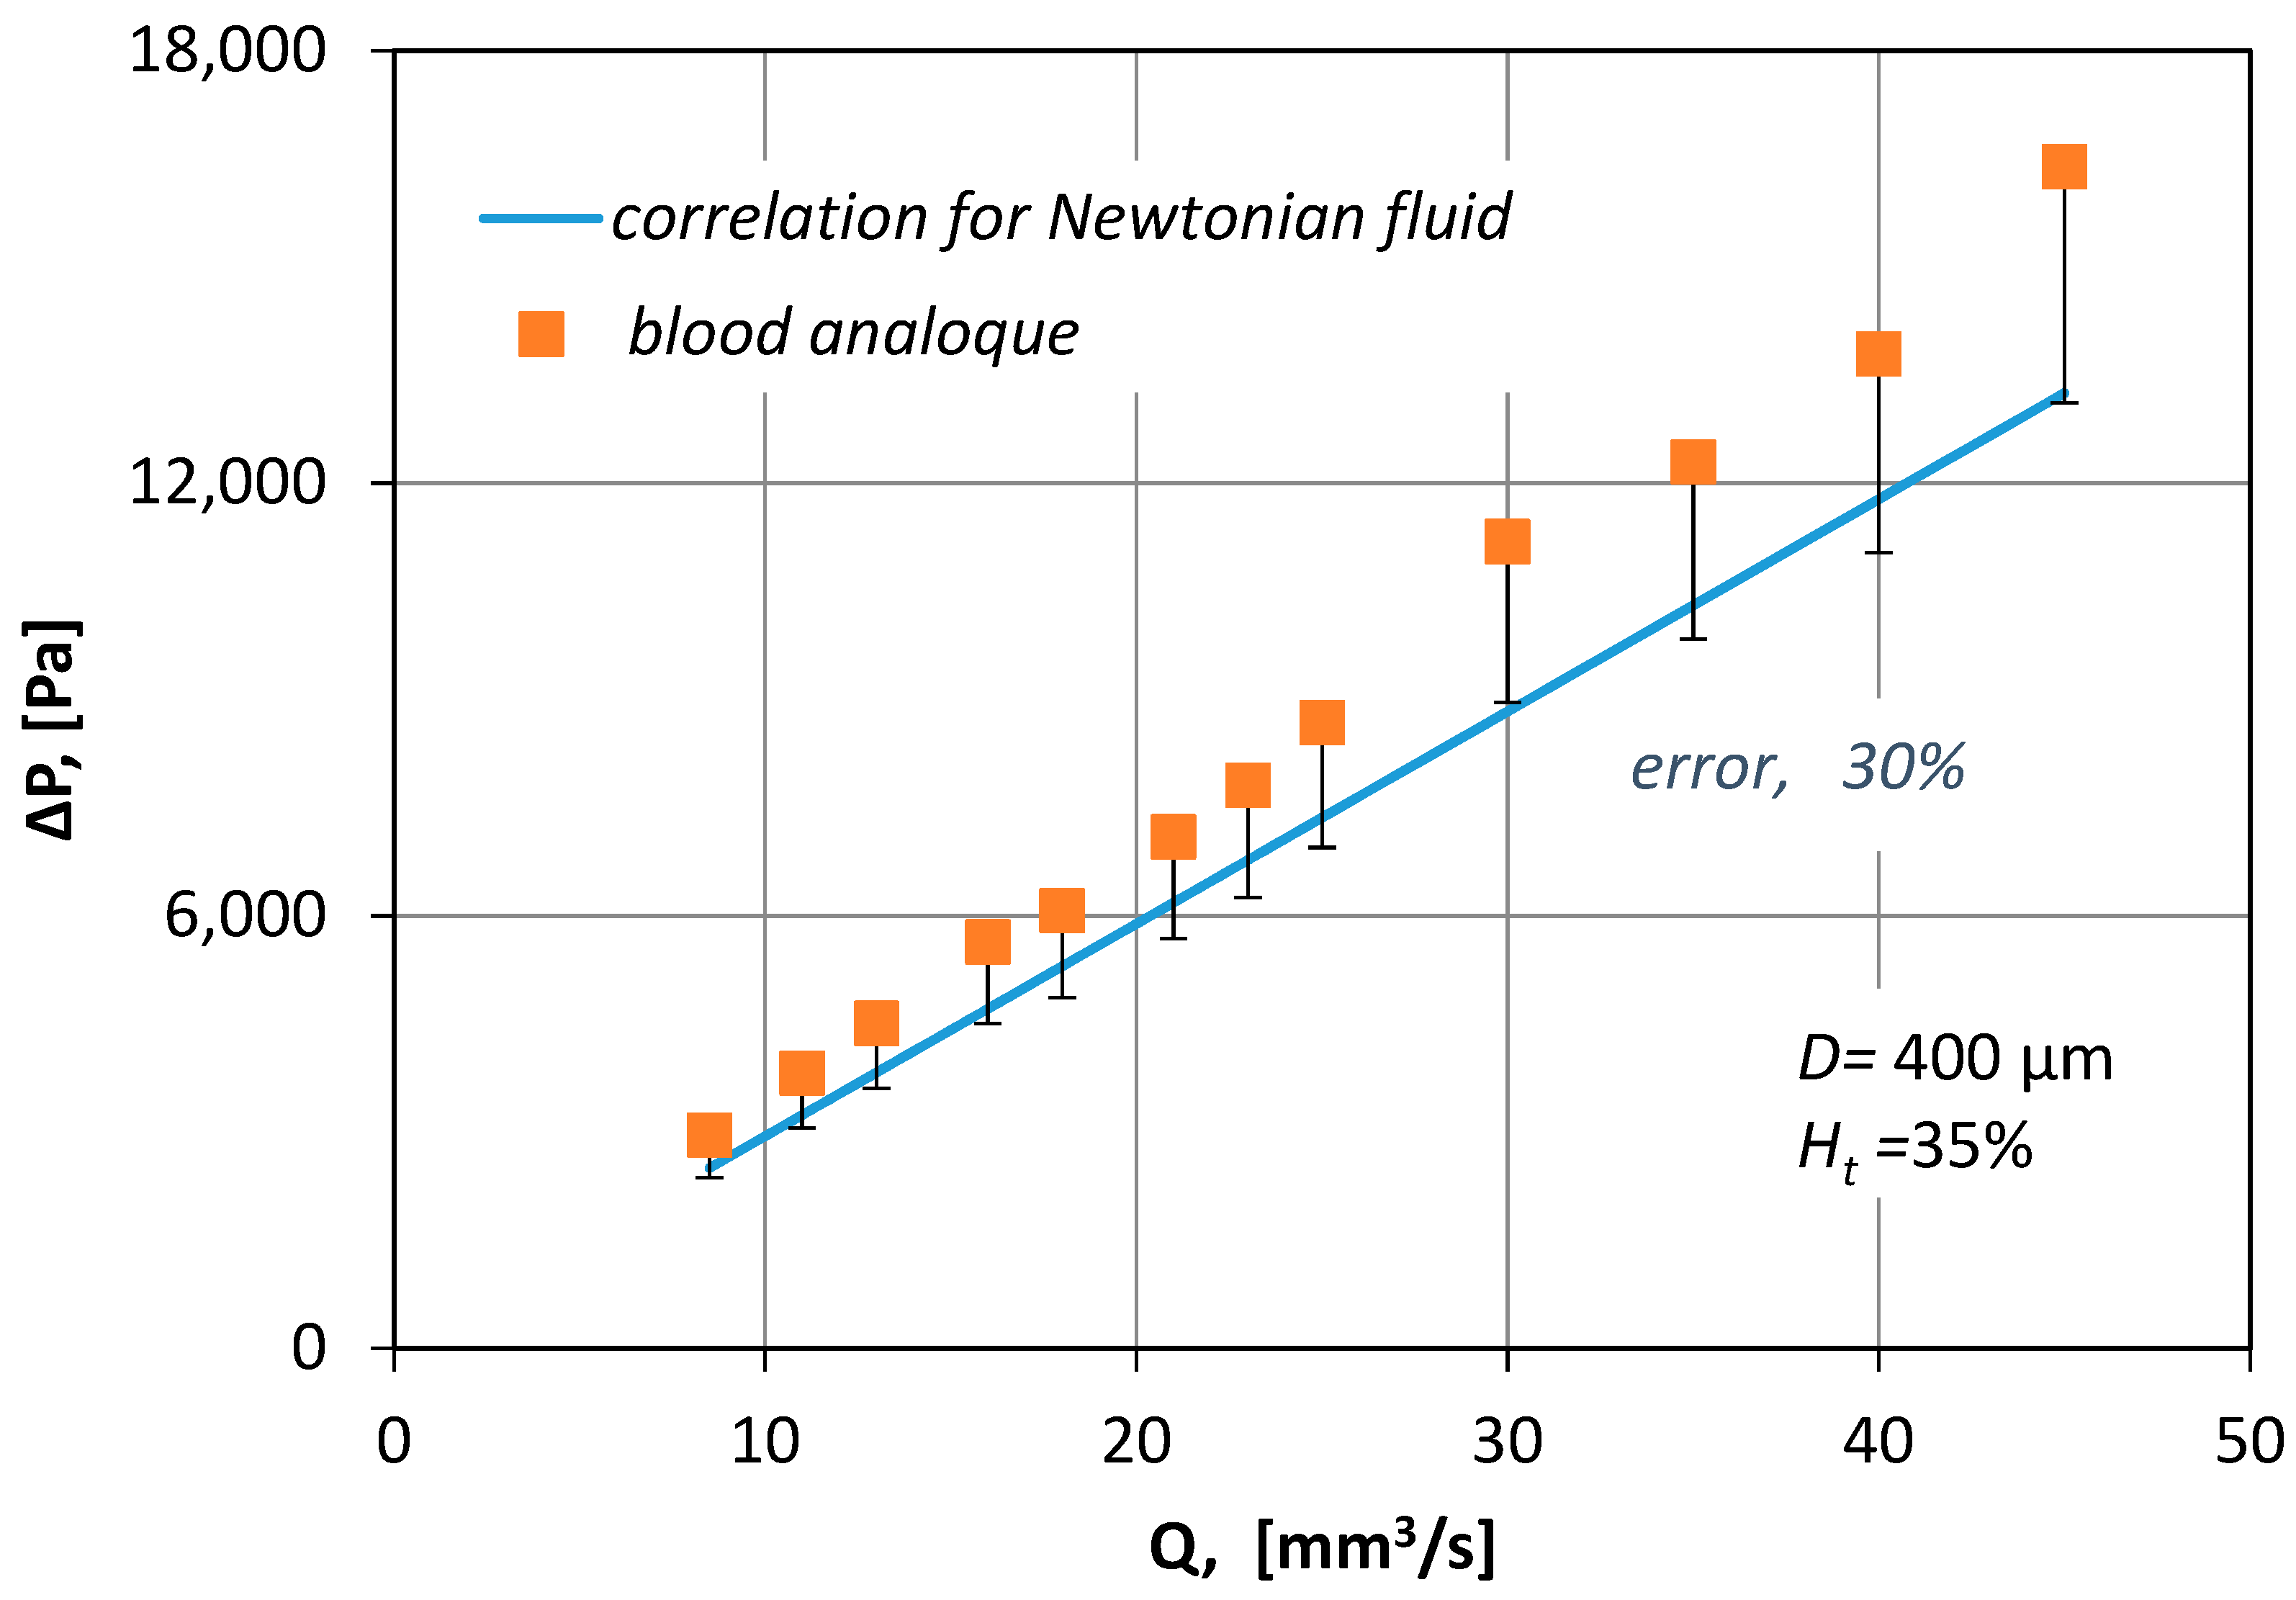
In
Figure 8, the measured pressure drop values for various blood flow rates (
Q), are compared with pressure drop losses (Equation (6)):
where
f is the Fanning friction factor given by:
where
Re∞ is a Reynolds number that uses the asymptotic value (
μ∞) of blood viscosity. From
Figure 8 it is obvious that by no means can the correlation for Newtonian fluids be applied to non-Newtonian fluids because it underestimates Δ
P by 30%.
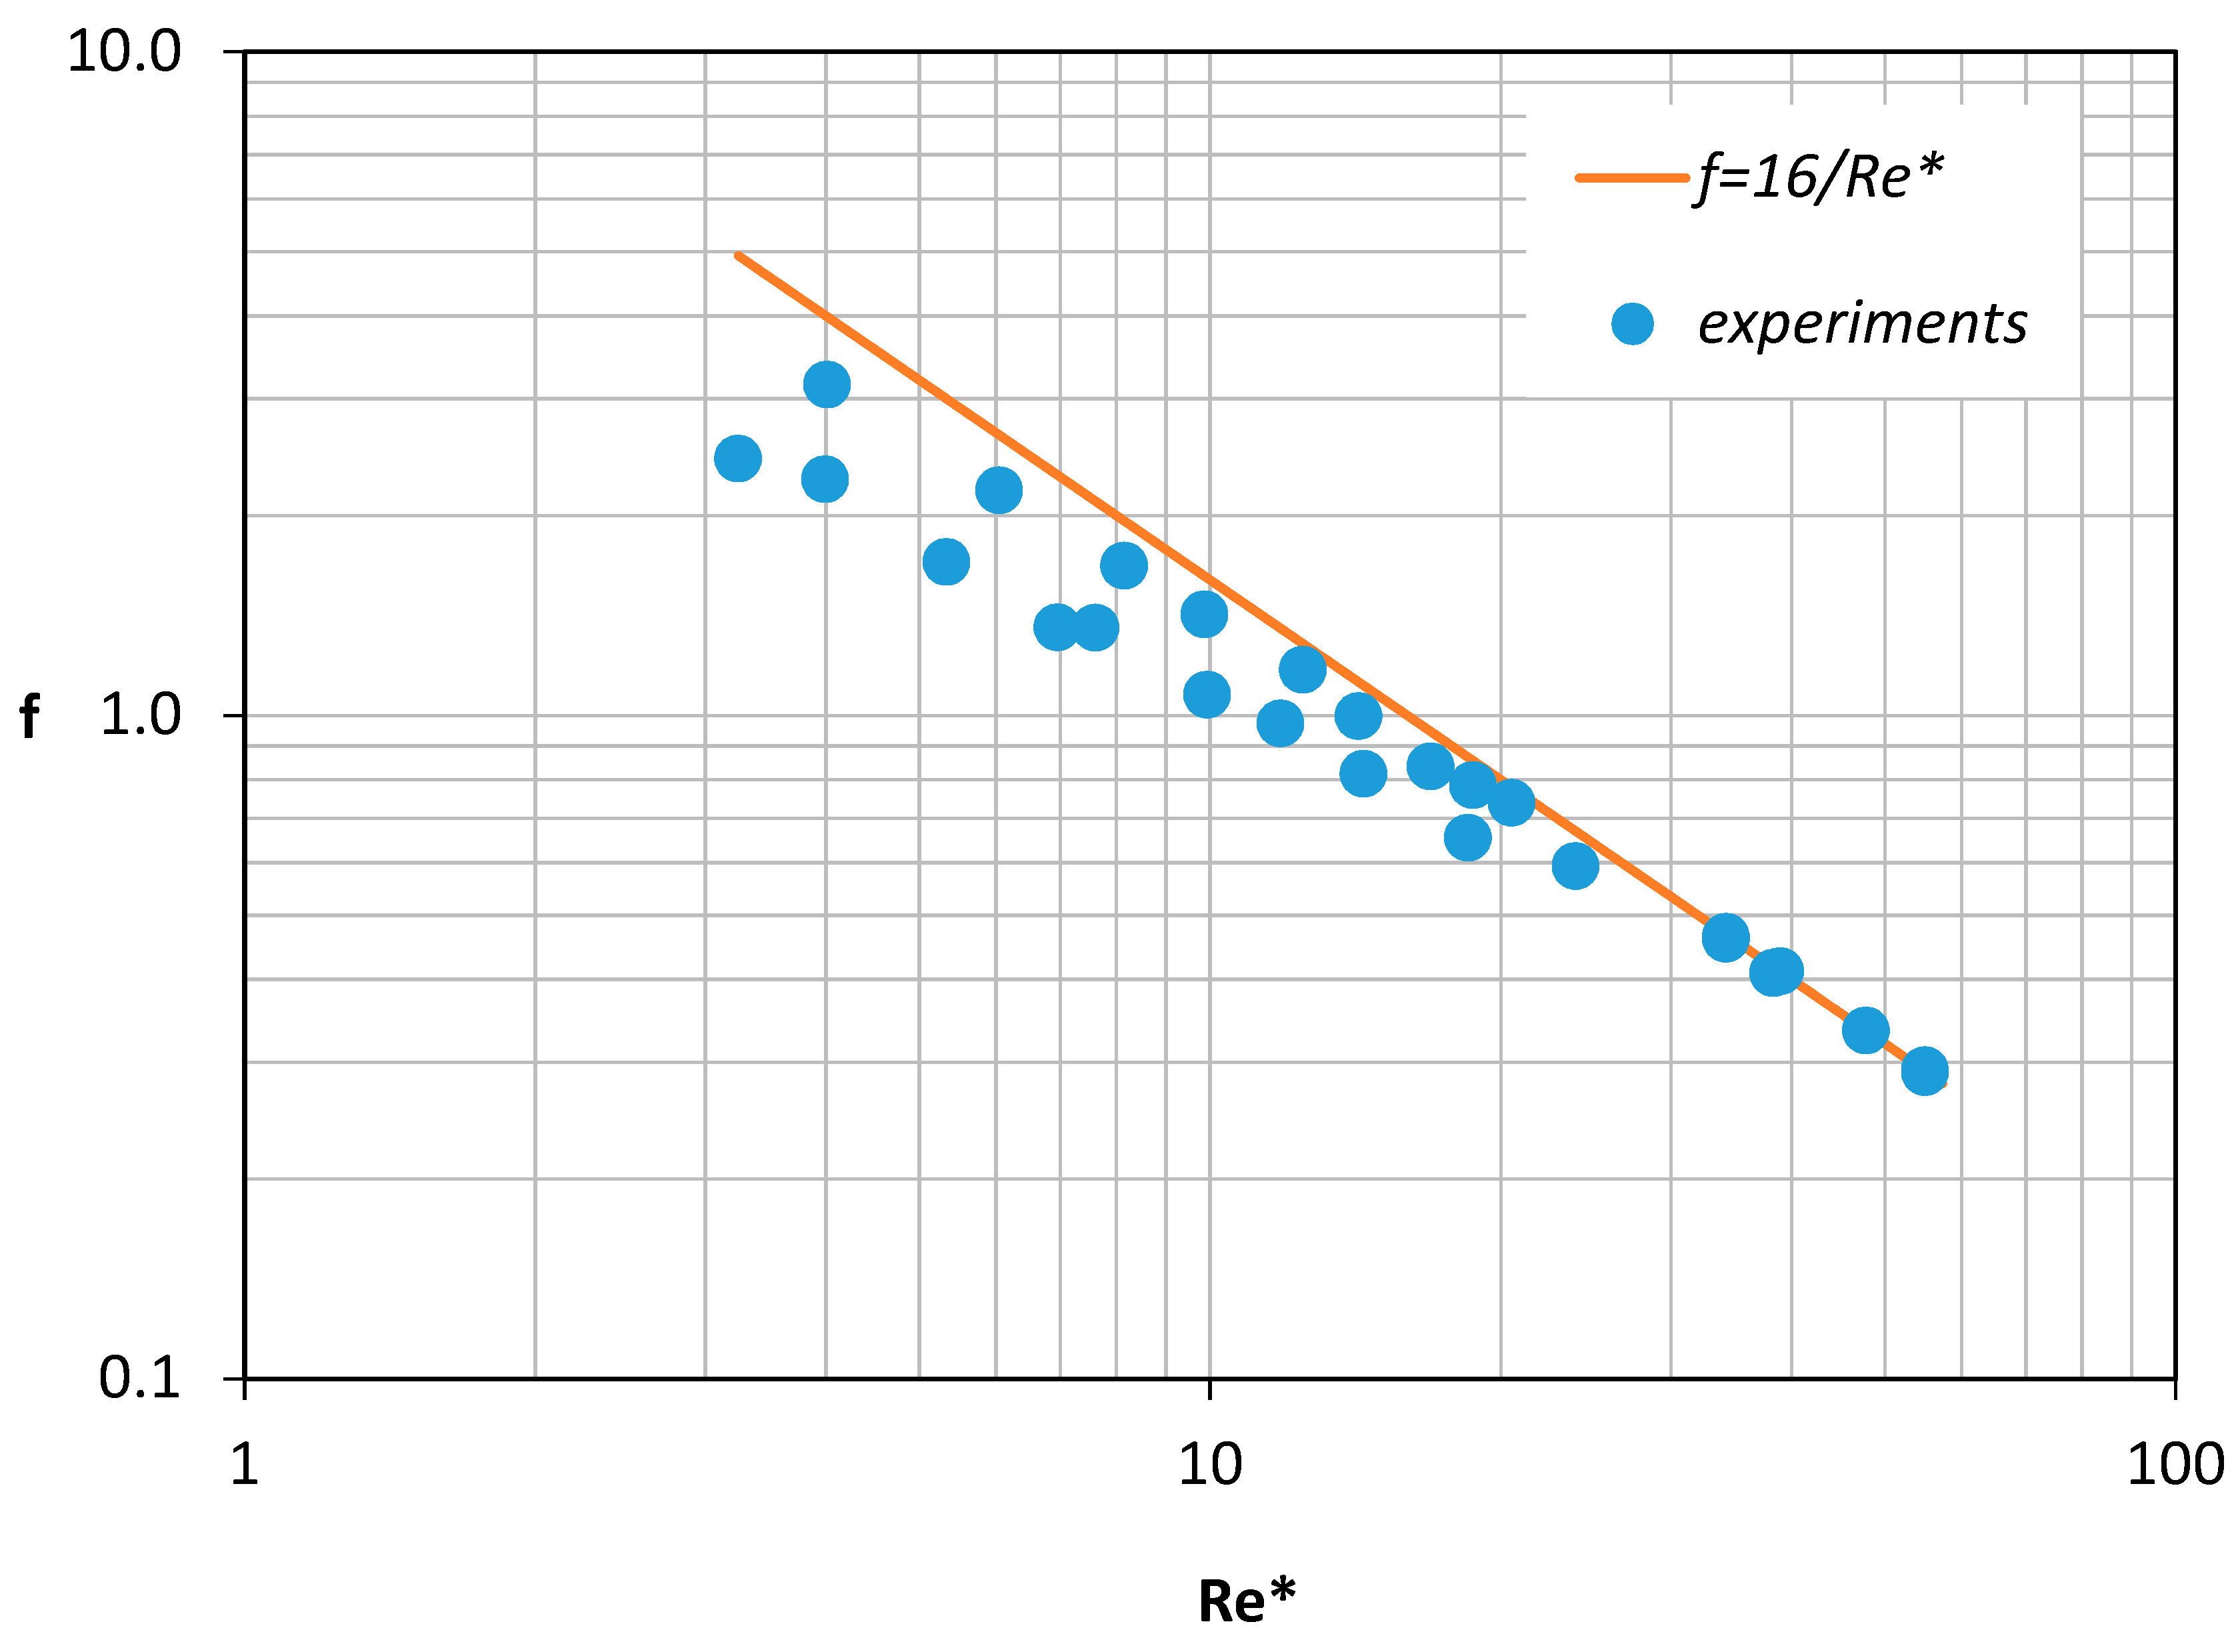
Initially, the numerically predicted pressure drop value was used to calculate Equation (6), the Fanning friction factor that corresponds to each “experiment”. In
Figure 9, the calculated friction factors were compared with the values predicted by Equation (8) that related the Fanning friction factor with
Re* (defined by Equation (4)), i.e.,
The calculated friction factors deviated considerably from the ones predicted by Equation (8) especially for the lower Re* values. It was obvious that a new correlation had to be formulated.
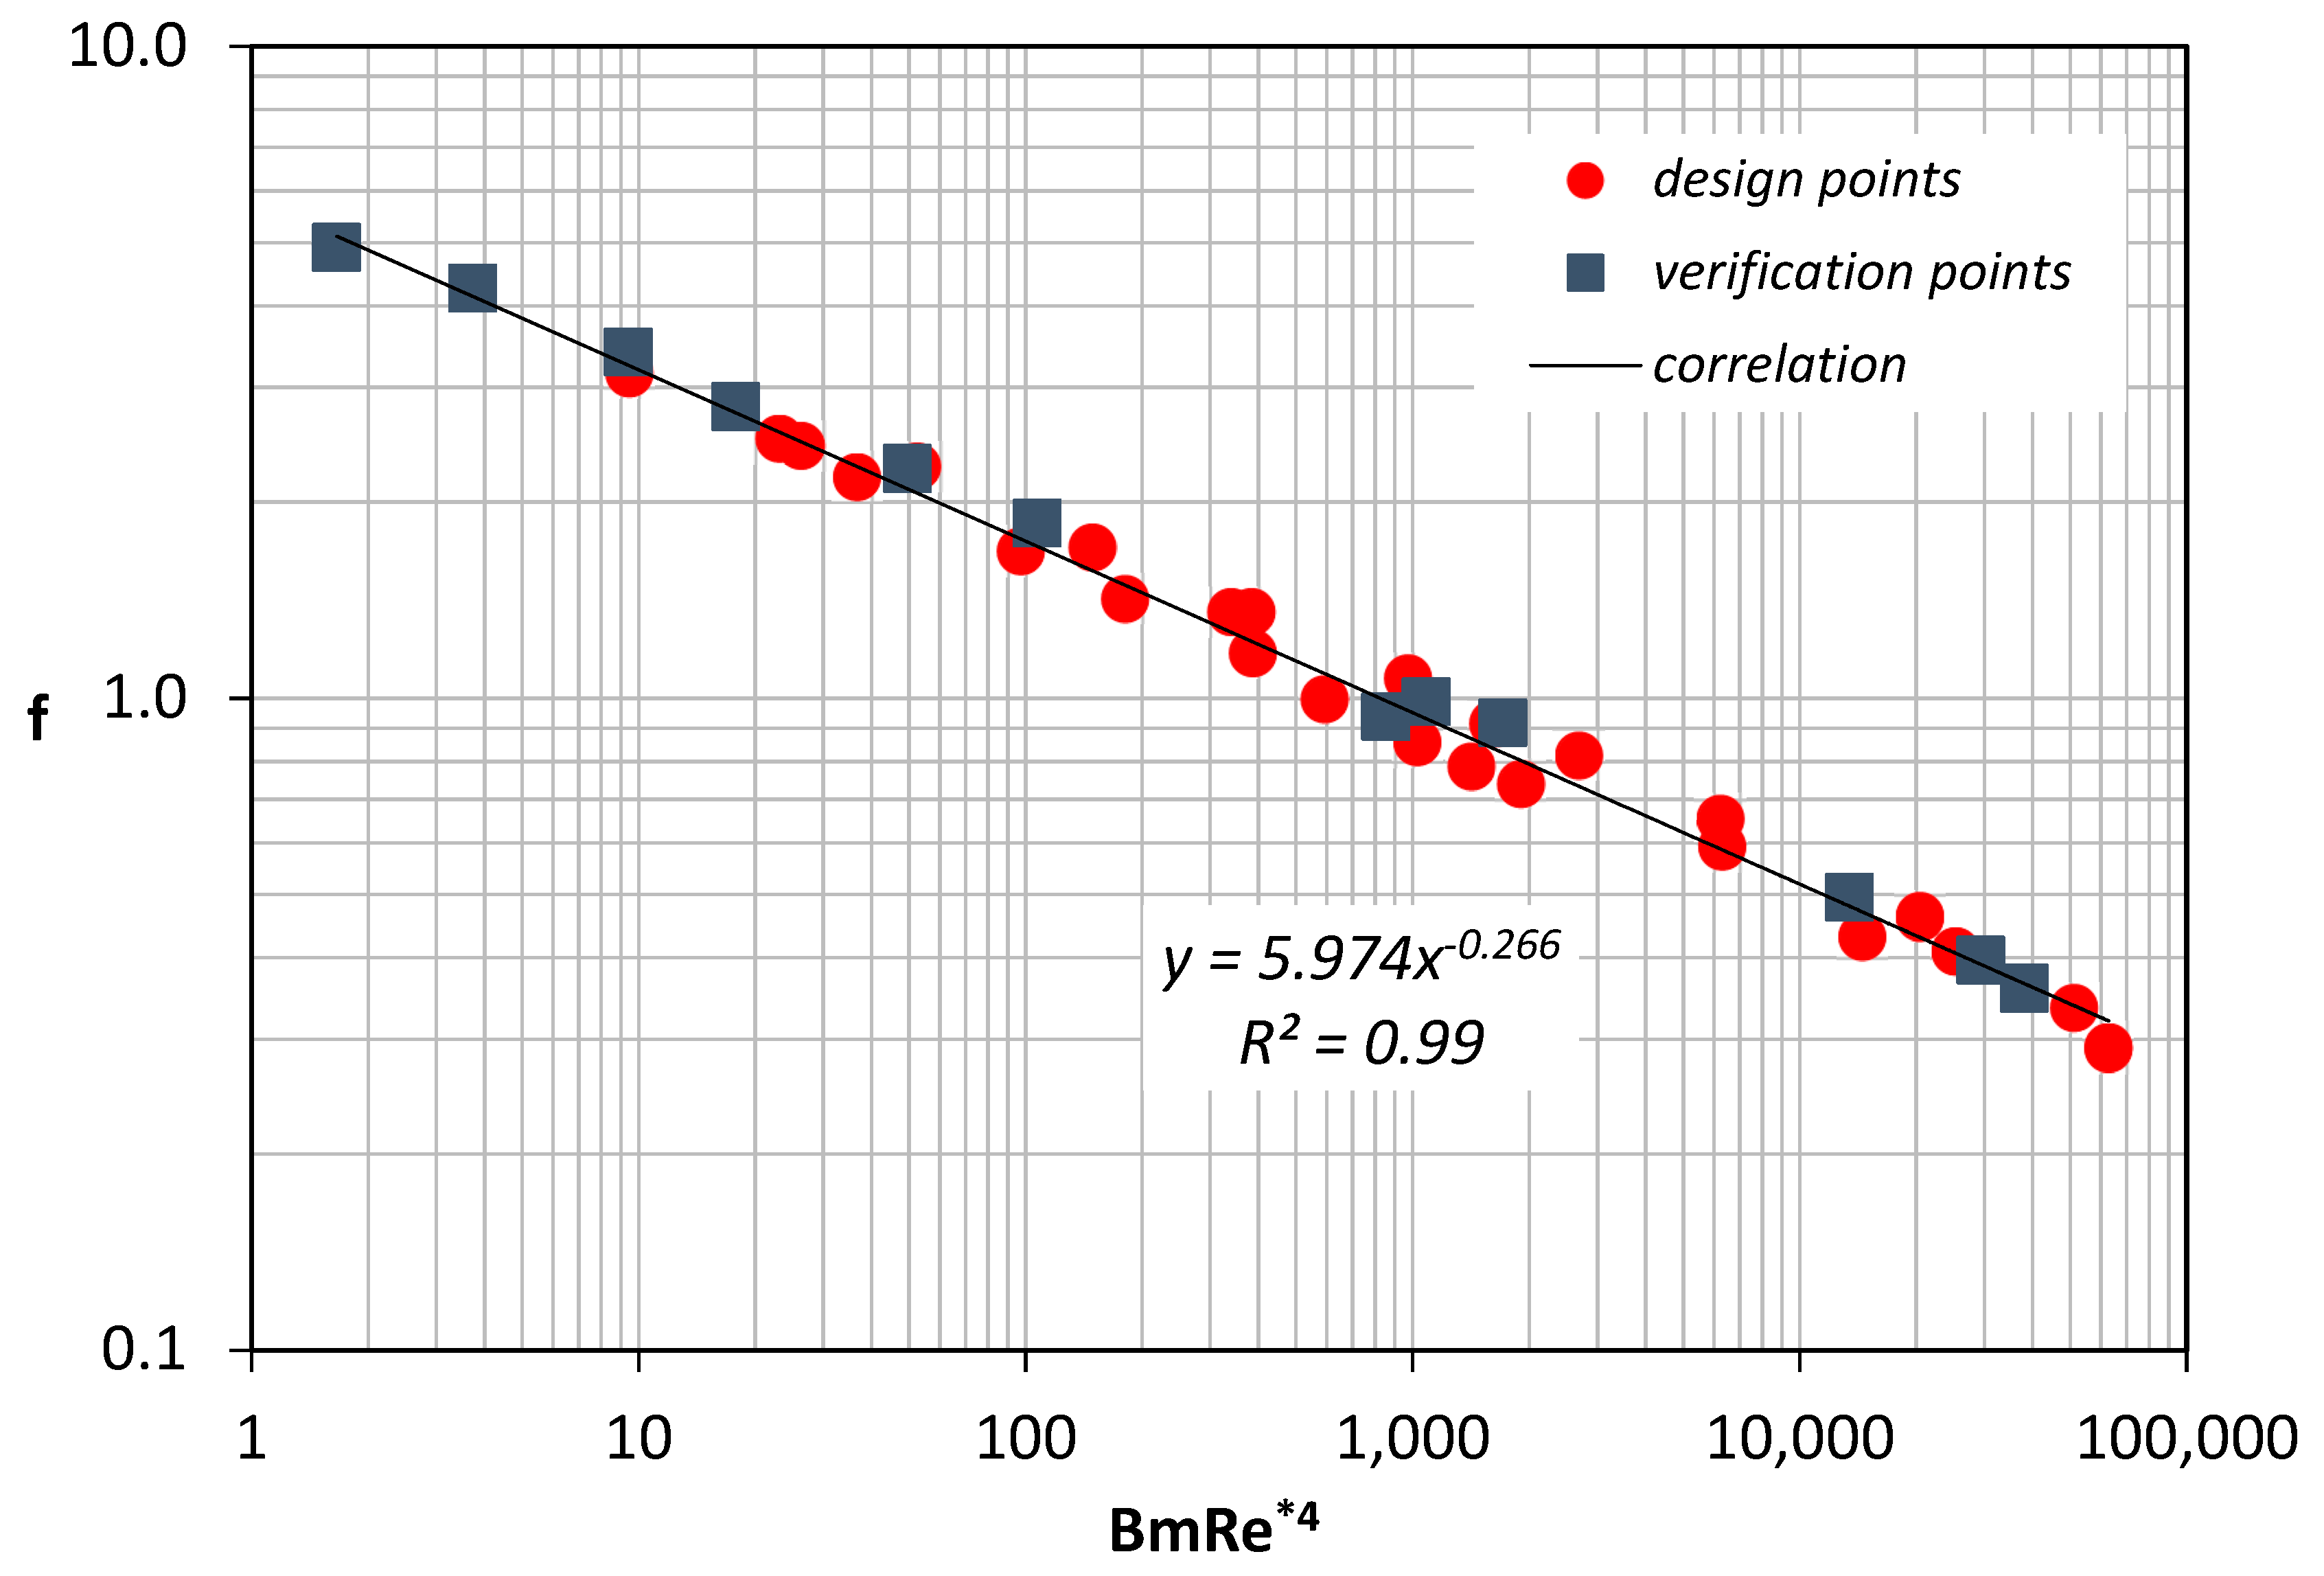
As blood is a non-Newtonian fluid, we attempted to strengthen the contribution of its viscoplastic nature [
7] by multiplying
Re* with the Bingham number, which for viscoplastic materials, expresses the relative importance of yield stress to viscous stress. This is defined as:
It is found that the friction factor can be well predicted using Equation (10):
Coefficients are determined by fitting the numerical data that correspond to the design points (
Figure 10). The validity of Equation (10) was further tested by comparing it with the data obtained using the verification points.
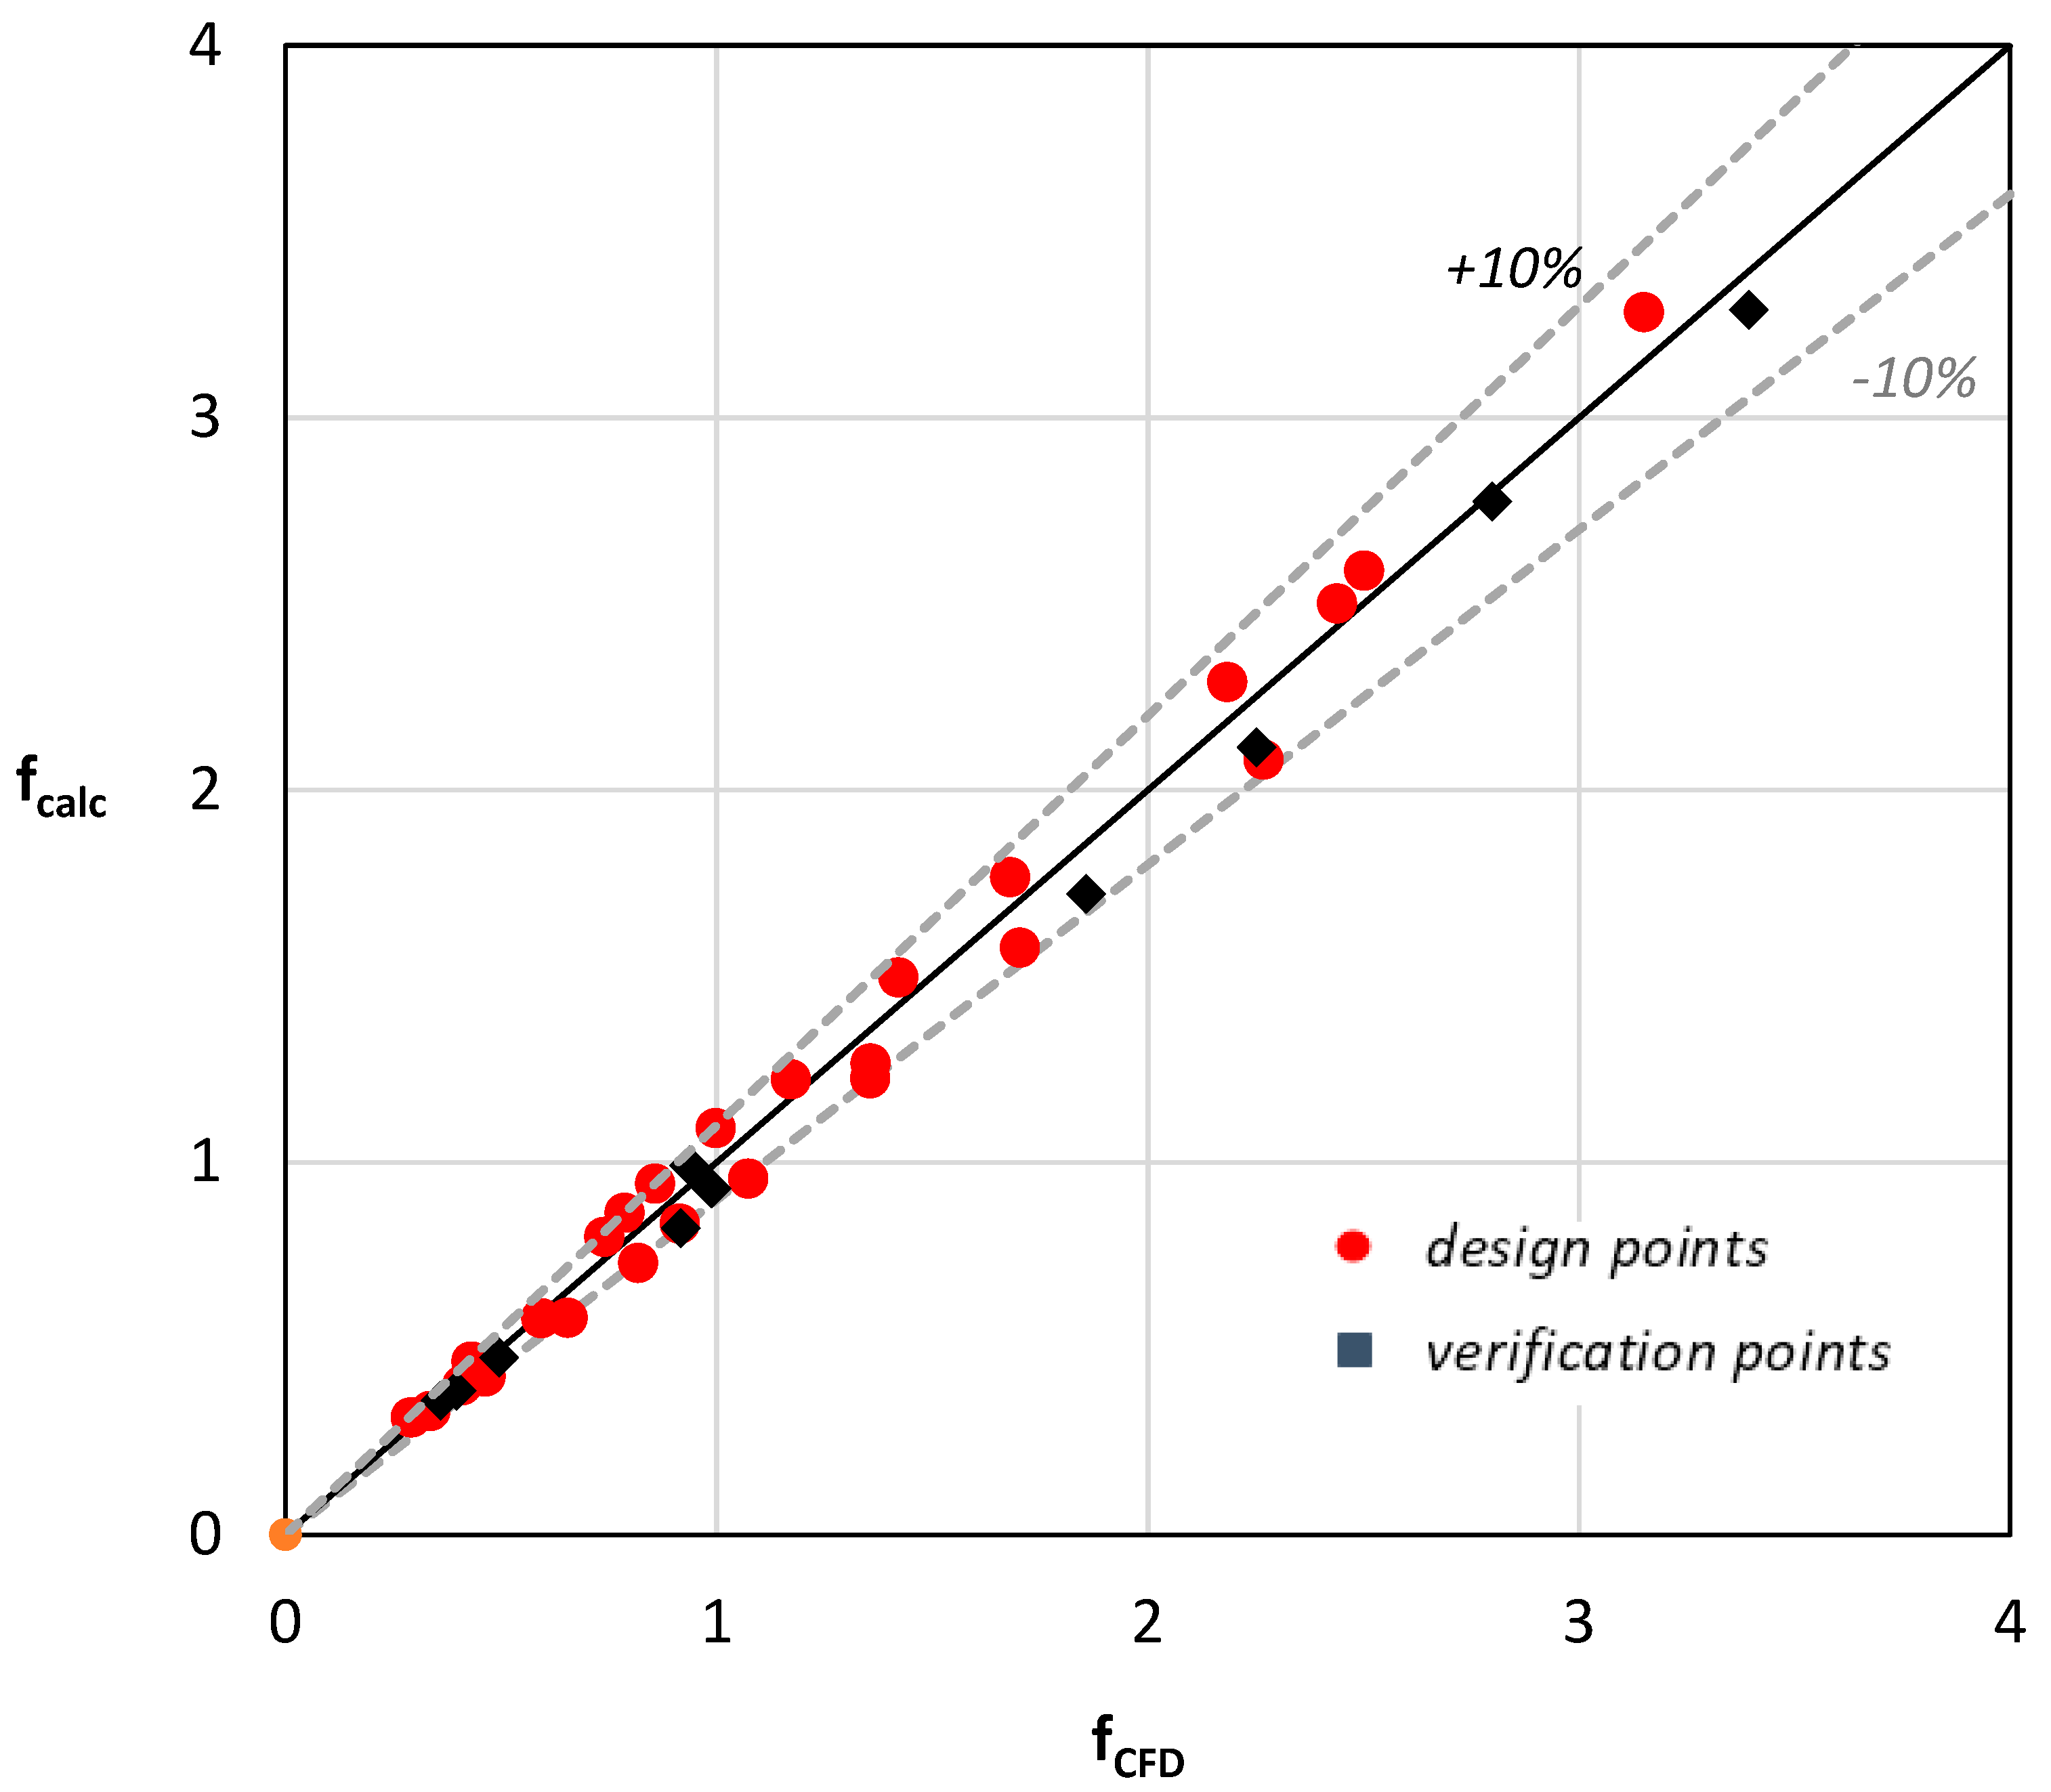
Figure 10 shows that the proposed correlation was in excellent agreement with all the results.
Figure 11 compares the friction factor values (
fcalc), calculated by Equation (10) with the values that resulted from the CFD simulations (
fCFD). It was proven that Equation (10) could predict the Fanning friction factor with 10% uncertainty.
5. Concluding Remarks
In this study, a simplified model that can predict Fanning friction factors of laminar blood flow in small-caliber vessels was proposed. The study was conducted using CFD simulations that were validated with relevant experimental data acquired by employing an appropriate experimental setup. The effect of the flow rate, the hematocrit value and the vessel diameter on the pressure drop was considered. The interpretation of the resulting data led to the proposal of a straightforward method of estimating with reasonable accuracy (i.e., better than ±10%) the Fanning friction factor and consequently, the pressure drop during the flow of blood (for a hematocrit range 35–55%) in small-diameter vessels (300–1800 μm).
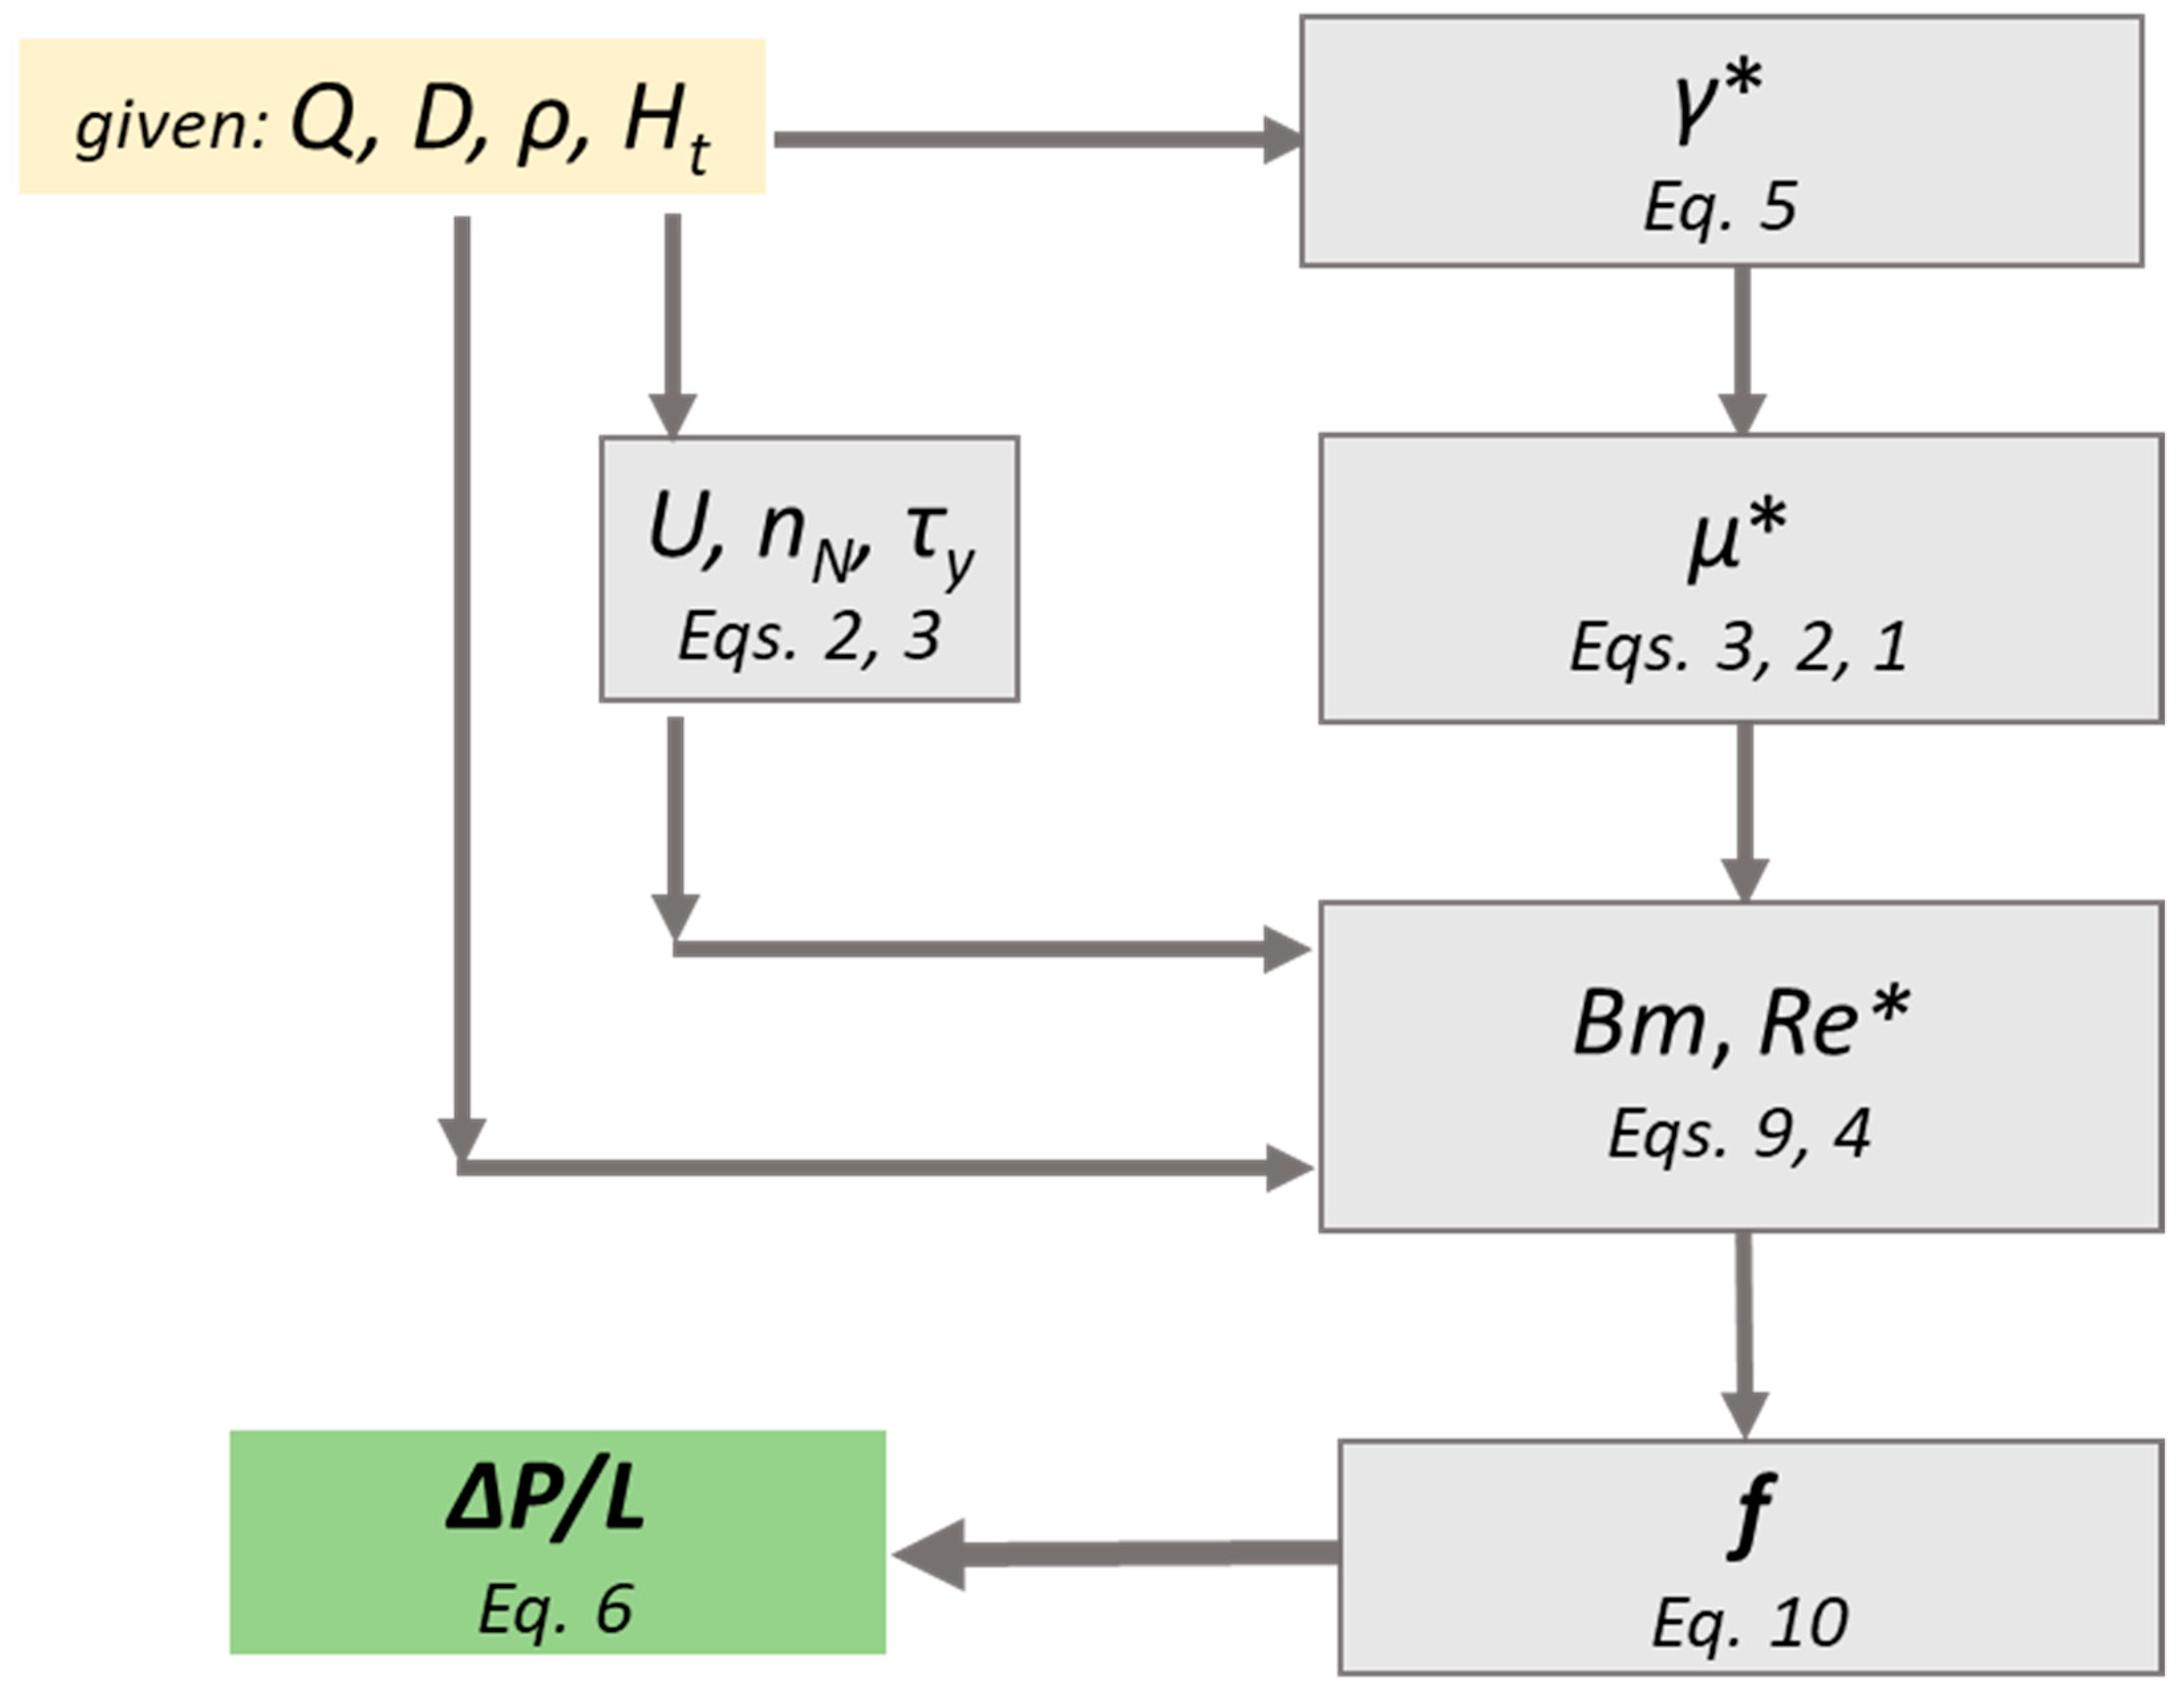
The calculation procedure comprises the following steps:
For a given volumetric flow rate (Q) and vessel inside diameter (D), the pseudo-shear rate (γ*) is calculated using Equation (5).
For a given hematocrit value (Ht), an effective viscosity (μ*), that corresponds to the pseudo-shear rate is estimated using Equations (1)–(3).
The corresponding Re* and Bm numbers are calculated by Equations (4) and (9).
The Fanning friction factor (f) is then calculated by the proposed correlation (Equation (10)).
Finally, the pressure drop (ΔP/L) is calculated using Equation (6).
The proposed methodology (
Figure 12) is an easy-to-use tool that can help scientist to quickly and accurately estimate the pressure drop exerted during blood flow in healthy, small caliber vessels. It is clear, that this methodology is not exclusively applicable for blood flow, however, if step two is excluded, it can be applied to any shear thinning Casson fluid.


