A Decision Tree Approach to the Risk Evaluation of Urban Water Distribution Network Pipes


1
Beijing Research Center of Urban Systems Engineering, Beijing 100035, China
2
School of Automation, Beijing Information Science and Technology University, Beijing 100192, China
*
Authors to whom correspondence should be addressed.
Safety 2020, 6(3), 36; https://doi.org/10.3390/safety6030036
Submission received: 31 March 2020
/
Revised: 6 July 2020
/
Accepted: 8 July 2020
/
Published: 22 July 2020
Abstract
:To evaluate the risk of a pipe in the water supply network of Beijing, we used the accident records of the gridding urban management (GUM) system. In addition, road and building information derived from a three-dimensional (3D) electronic map was also employed. A machine learning algorithm, the decision tree, was employed to train and evaluate the dataset. The results show that the contributions of the surrounding buildings and roads are neglectable, except for super-high-rise buildings, which have limited contributions. This finding is consistent with the results of other studies. The decision tree identifies dominant features and isolates the risk contribution of such features. The output tree structure indicated that the time since the last accident is a dominant factor, to which super-high-rise buildings contribute slightly. A cut-off value of 0.019 was chosen to predict high-risk regions. Approximately 0.4% of the data were predicted to be high risk, and the corresponding gain in risk rate was approximately 19.2. This model may be used in cities where detailed profiles of water supply pipes and maintenance records are not available or are expensive to achieve.
1. Introduction
Water supply is an important part of the urban lifeline in a city. In China, the Water Pollution Prevention and Control Action Plan was initiated by the State Council in April 2015. This plan is also known as the Water Ten Plan (WTP). The WTP proposed several measures and set out long-term objectives at a national level [1], and the renovation and upgradation of aging water pipes in distribution networks was initiated. These pipes have been in service for more than 50 years and are mostly made of outdated materials. In addition, a long-term goal for the national average leakage rate in water distribution networks was proposed. After achieving this goal, the average leakage rate would be lower than 12% by 2017 and 10% by 2020. It is worth noting that the national average water loss rate was 14.32% in 2015 [2].
However, it is usually difficult to predict when, where, and how severe a pipe failure may occur in a water supply network. The frequency of the breakage and failure of pipes in water distribution networks tends to increase over time. This may be caused by a variety of reasons, such as environmental temperature variations and different operation pressure levels in pipes.
Some researchers have tried to locate leakage sites in order to prevent water loss. Different methods have been proposed to detect leakages in water distribution systems. These methods include artificial neural networks, state estimation, stochastic process control, and time series modeling [3]. The accuracy of these methods requires extensive system monitoring due to the measurement of system parameters such as pipe flow rate and pressure head [3].
Some researchers have focused on prediction pipeline leakage using stochastic models, namely certainty and probability models [4]. Popular certainty models include the time index model, the time power model, and the time linear model. Either the number of leakages per unit of time or pipe length or the total number of pipe leakages is predicted by these models. As a probability model, a hazards model predicts the probability of a pipe leakage in an instant for one specified pipe. In recent years, various artificial intelligent algorithms, such as artificial neural networks, the ant colony algorithm, and the genetic algorithm, have been used for predicting leakages in pipe networks. Furthermore, models combining several of the aforementioned algorithms have flourished.
Some groups have studied pipeline state prediction methods, including pipe leakage, pipe burst, and comprehensive assessment [5]. Pipe leakages are usually caused by very slight damage to pipes. These events are frequently modeled as a time series when the number of current leaks in the same pipeline is more than four. The gray forecasting theory was adopted by Zhang et al. [6] to find an inherent pattern by suppressing the influence of random factors through data washing and to determine the occurrence trend of future leakages. Wang et al. [7], Jin et al. [8], and Wang et al. [9] modeled the pipeline leakage time interval, the pipeline monthly maintenance times, and the annual leakage rate as the time series data, and they then carried out forecast analysis. These methods are a second exponential smoothing model, a third exponential smoothing model, and a wavelet neural network, respectively. When the frequency of pipeline leakage did not hold for the time series assumption, linear models were proposed by Zhang et al. [6,10] and Wang et al. [7] to predict the next time a pipe leakage would occur. These models used the depth of installation, the hydraulic pressure, and the pipe diameter as features. Grey relational analysis (GRA) was employed to analyze and evaluate all the factors and to draw the order of the factors influencing pipeline leakage [4]. Additionally, a linear prediction model was trained to determine the first leakage time after the networks were deployed.
Pipe burst refers to the situation where a pipeline leakage rises to the ground due to structural damage to the pipeline, and it must be repaired immediately [11]. Most research on pipe burst is based on the hypothesis proposed by Shamir et al. [12], which states that the number of bursts is exponential to the age of the pipe. A model was proposed by Ma et al. [13] to predict pipe replacement time by employing the predicted pipe burst rate and the limit pipe burst rate equation proposed by Shamir et al. [12]. This model was designed to minimize the total cost of repairing and replacing pipes during their service life. A method combining survival analysis and burst hazard was proposed by Zhou et al. [14] and Ke et al. [15]. Their studies used the age, diameter, and material of the pipe as features to predict the pipe burst rate per unit of length. The assumption was that the baseline hazard is a quadratic function of the age of the pipe.
In recent years, comprehensive assessment methods involving more variables have been proposed. Zeng et al. [16] evaluated dynamic hydraulic factors and their impact on pipe bursts in a stage-by-stage fashion. The time series of the evaluation index vectors, composed of velocity, pressure, and the pressure difference of the pipe sections, were used as the input for a back propagation neural network (BPNN) to obtain the safety level of each time point of a pipe section. They used a revised evaluation metric of pipe burst rate to carry out a comprehensive evaluation of pipeline safety [15]. Chang et al. [17] also employed BPNN to comprehensively predict pipeline damage risk using the material, age, diameter, length, and coupling of the pipe.
A more comprehensive study was performed by Kumar et al. [18]. They modeled the failure of water pipes as a binary classification task, which predicted whether a failure may or may not occur for a city block within a specified period. Several data sources were combined, leading to a comprehensive dataset composed of pipe diameter, pipe age, pipe material, installation year, soil type, rock type, pressure zone, road rating, the number of previous breaks in that city block, etc.
However, the capability and application of the above models remain constrained. First of all, these models require information about the pipeline itself, namely the diameter, age, materials, depth, pressure, etc. In addition to this detailed information about the pipelines, some of these models also require accident records to be continuously acquired, with little missing or corrupted data. Moreover, the prediction method of the leakage model has only achieved limited results so far and can only be applied to a simple and specific pipeline network system. For complex pipe network systems, the calculation speed and accuracy of real-time simulation software need to be further improved [19].
The municipality faces challenges not only in managing the expected large amount of replacements but also in quickly identifying and fixing problems as soon as possible. The situation is even worse in Beijing, where a large proportion of the water pipelines have been serving for longer than their projected lifetimes. Approximately 2000 km of water pipelines are scheduled for renewal during both the 12th FP (the 5-year plan) and the 13th FP. In addition, gridding urban management (GUM) is employed by the Beijing municipality to collect accurate and timely information on urban problems. GUM divides an area (e.g., a district) into a number of spatial grids and collects 173 types of urban problems, including pipe blasts and leaks, within five categories [20]. Urban management inspectors patrol the streets regularly and report problems to management centers.
Complete and detailed profiles of pipelines are not publicly available, which prohibits the application of the previously mentioned methods. In addition, the irregularity of the pipe leakage records also limits the potential application of these methods.
Therefore, we propose a decision tree machine learning method to assess the risk of water pipe accidents on a regional level. The water supply accident records collected by GUM were used as features. Moreover, the impact of the surrounding roads and buildings were included in this model; this extra information was extracted from a 3D electronic map.
2. Materials and Methods
2.1. Data
This study used 859 accident records of water supply pipelines collected by the Beijing GUM System, spanning from 1 January 2013 to 30 December 2016.
Roads and building information were derived from a 3D electronic map around the accident site. This information was parameterized by the width and height of the road, the area, and the coordinate values of buildings. The widths of the roads reflect the traffic load borne by the pipeline, and the surrounding buildings contribute to the static load of the pipes underneath.
A deformation analysis model of pipelines under static load was derived using Mindlin’s solution [21]. The maximum settlement displacement was specified as 30 mm, a common criterion for most cities [22]. The impact of buildings and roads within 240 m of the site of an accident was evaluated. This value was chosen in order to cut off buildings whose contribution to the settlement displacement is less than 3 mm [23].
Moreover, the construction time was assumed to be the construction time of nearby buildings. Then, it was transformed into a categorical variable (Table 1).
2.2. Preprocessing of Variables
In total, 12 relevant factors were derived by processing the acquired accident data. There were seven building factors, three time factors, one accident type factor, and one road factor.
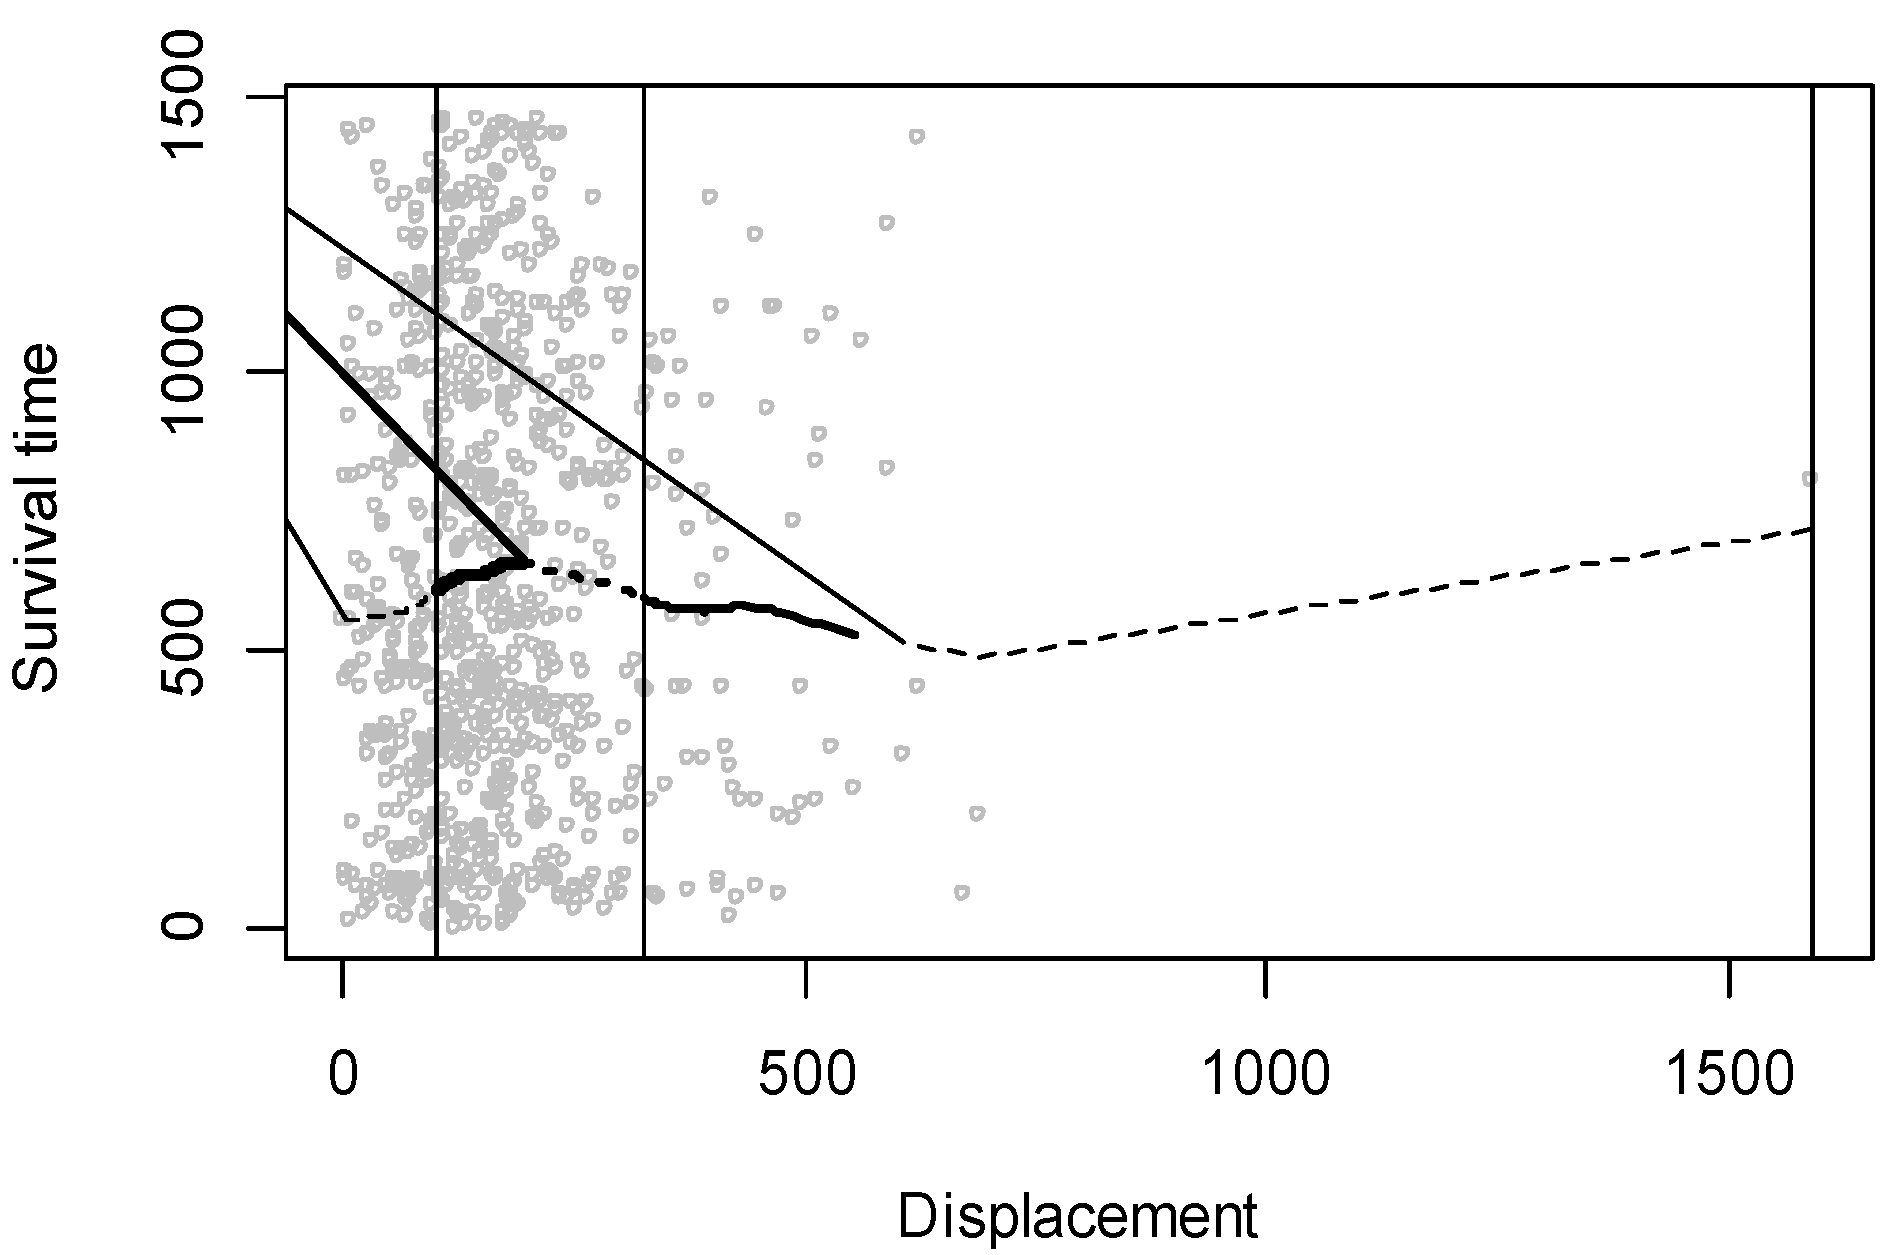
All continuous variables were categorized, and the results of these factors are listed in Table 1. To facilitate categorization, lowess curves were first fitted using lowess in R. The curves were then clustered using K-means and subdivided into different segments according to the clustering results.
Below is an example of how the displacement was categorized (Figure 1). A lowess curve was first fitted based on the displacement and survival time since 1 January 2013. The curve was then clustered into five segments, and the final category was further manually reduced into three.
2.3. Data Preprocessing
Biganzoli et al. [24,25] showed that artificial neural networks (ANNs) can be applied to the modeling of survival data. Time intervals were used as additional inputs with explanatory variables, logic functions were used in the hidden layer, and the single output was the estimated failure probability. The survival data were transformed before fitting an ANN model.
Table 2 is an example of the converted data. An original sample with a lifetime of four days was converted into four samples. Two new variables were added, namely time interval and outcome (i.e., survival or death), while the other variables, X1 and X2, remained unchanged.
Our dataset contained 859 accident records. These events were converted using this method, resulting in approximately 530,000 records on a daily basis, with 1 for an accident and 0 for none.
The converted dataset was randomly divided into approximately 35,000 samples (approximately 66%) for the training set and the rest (approximately 34%) for testing.
2.4. Model
To build the decision tree model, we used the function ctree in an R package named Party [26]. The inputs included the 12 accident-related factors, in addition to the time interval. The only output was the risk coefficient, ranging between 0 and 1, which revealed the probability of pipeline accidents. The closer the output is to 1, the more likely the pipeline is to be damaged.
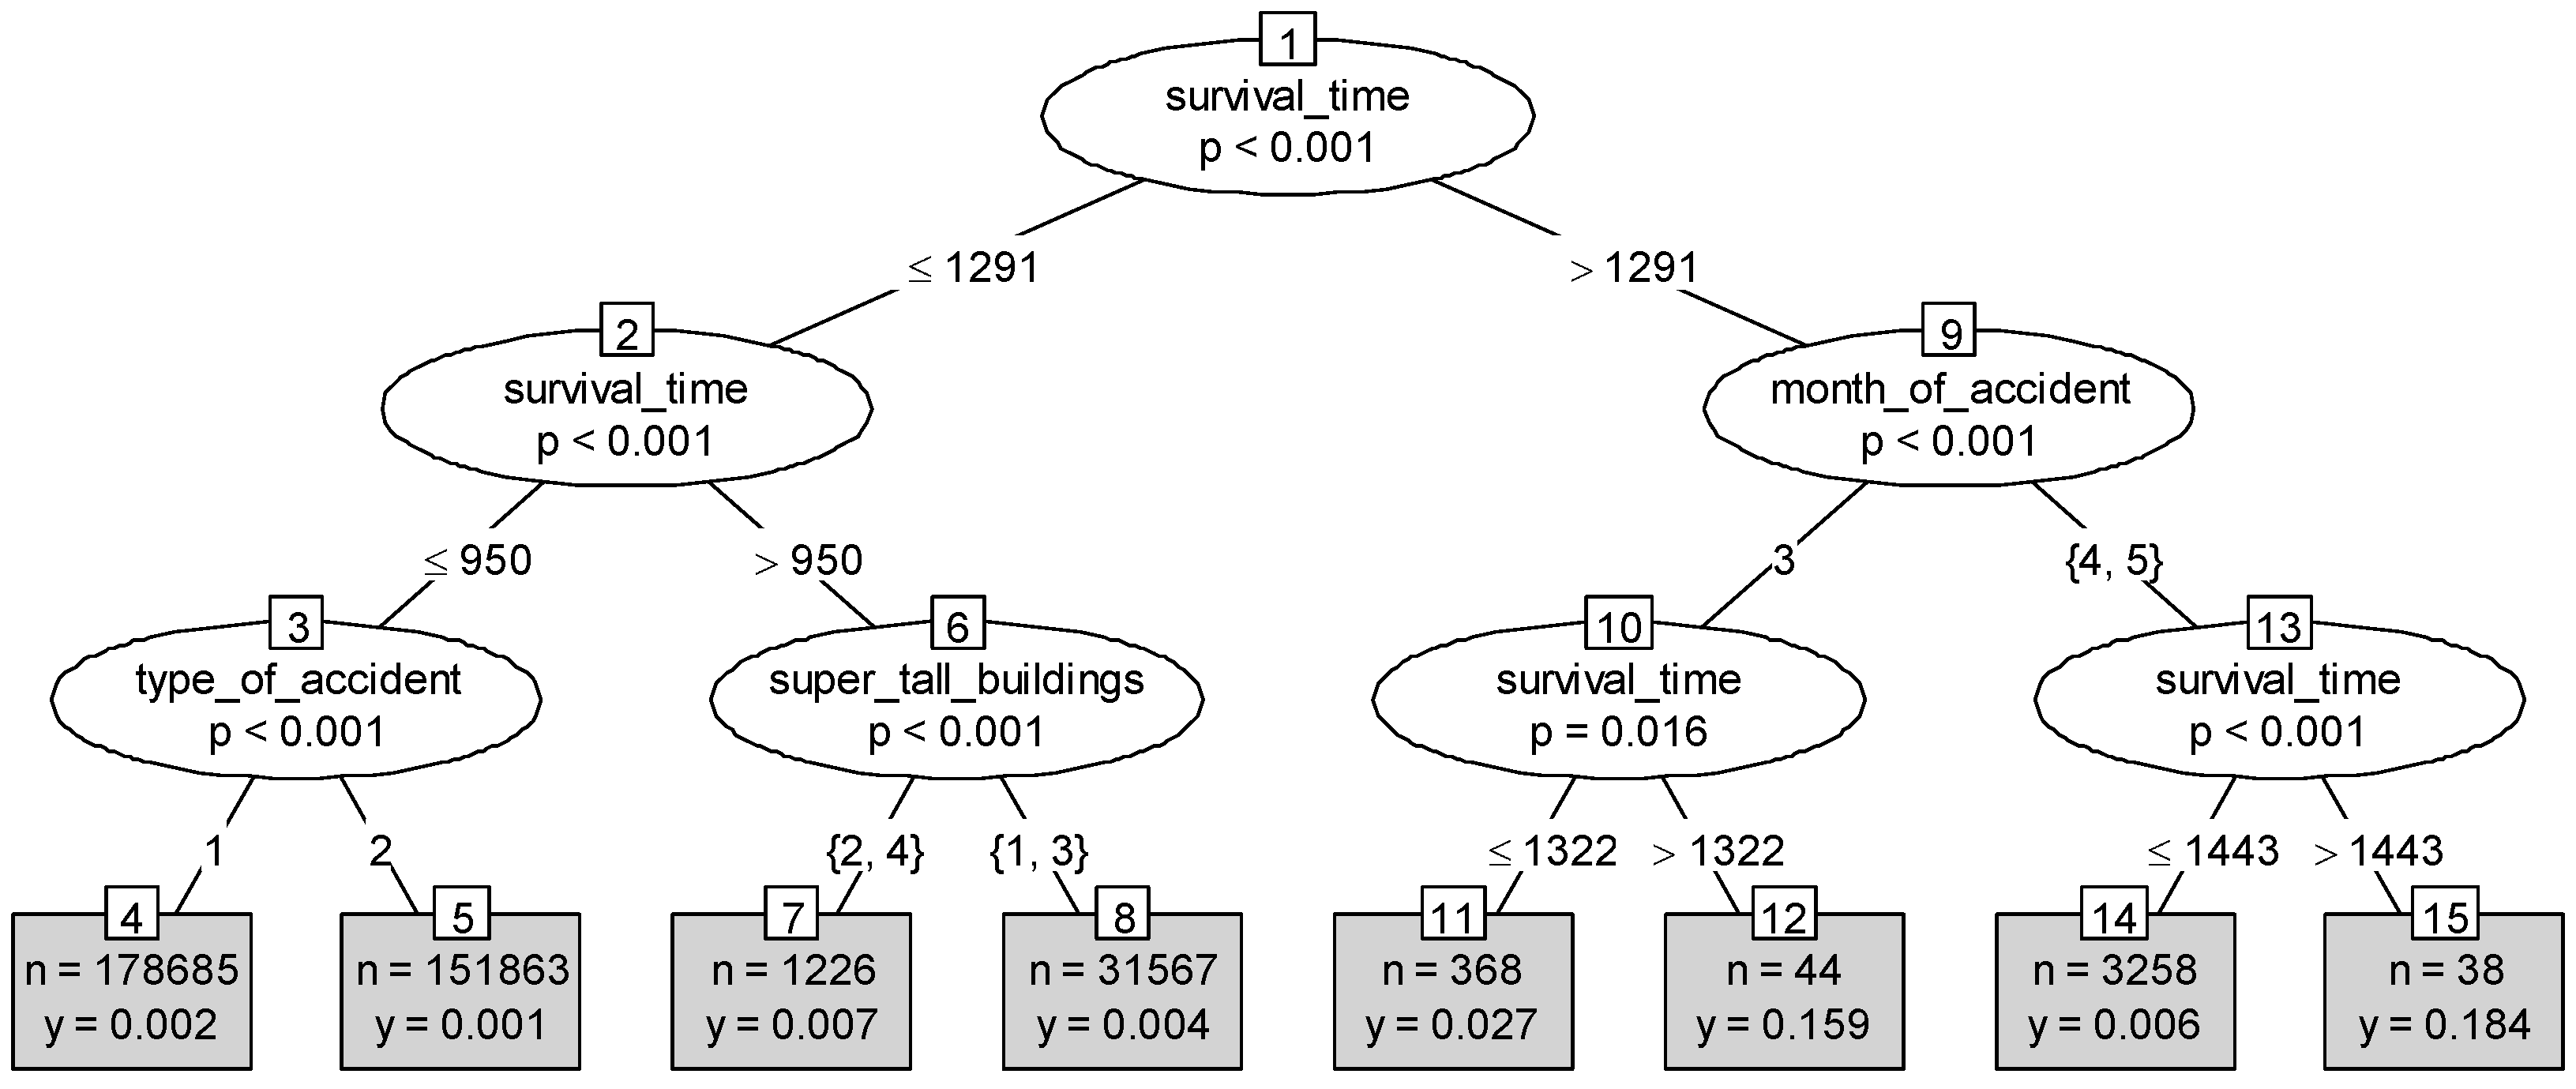
Based on all 530,000 day-based events, the average accident rate was approximately 0.16%. This is a typical configuration of an extremely unbalanced dataset. The decision tree outputted the accident risk (Figure 2). The probabilities of leaves 12 and 15 were considerably higher than the average accident rate, indicating discriminative features. To quantify their effects, we introduced the amplification ratio of risk (ARR) to evaluate the model.
Precision = number of true positives / (number of true positives + number of false positives)
ARR = precision / average accident rate
The model parameters were optimized by two-fold cross-validation. Minsplit (the minimum number of samples in a node) was set to 100–800, span 100; minbusket (the minimum number of samples in a leaf node) was set from 25 to half of minsplit, span 25; maxdepth (the depth of the decision tree) was set from 3 to 8. Based on different combinations of the input parameters, a two-fold cross-validation model was established and the ARR was calculated. The results showed that the minimum sample size of the node set had no effect. When the minimum sample size of the leaf was 25 and the maxdepth was 3, the model results were optimal.
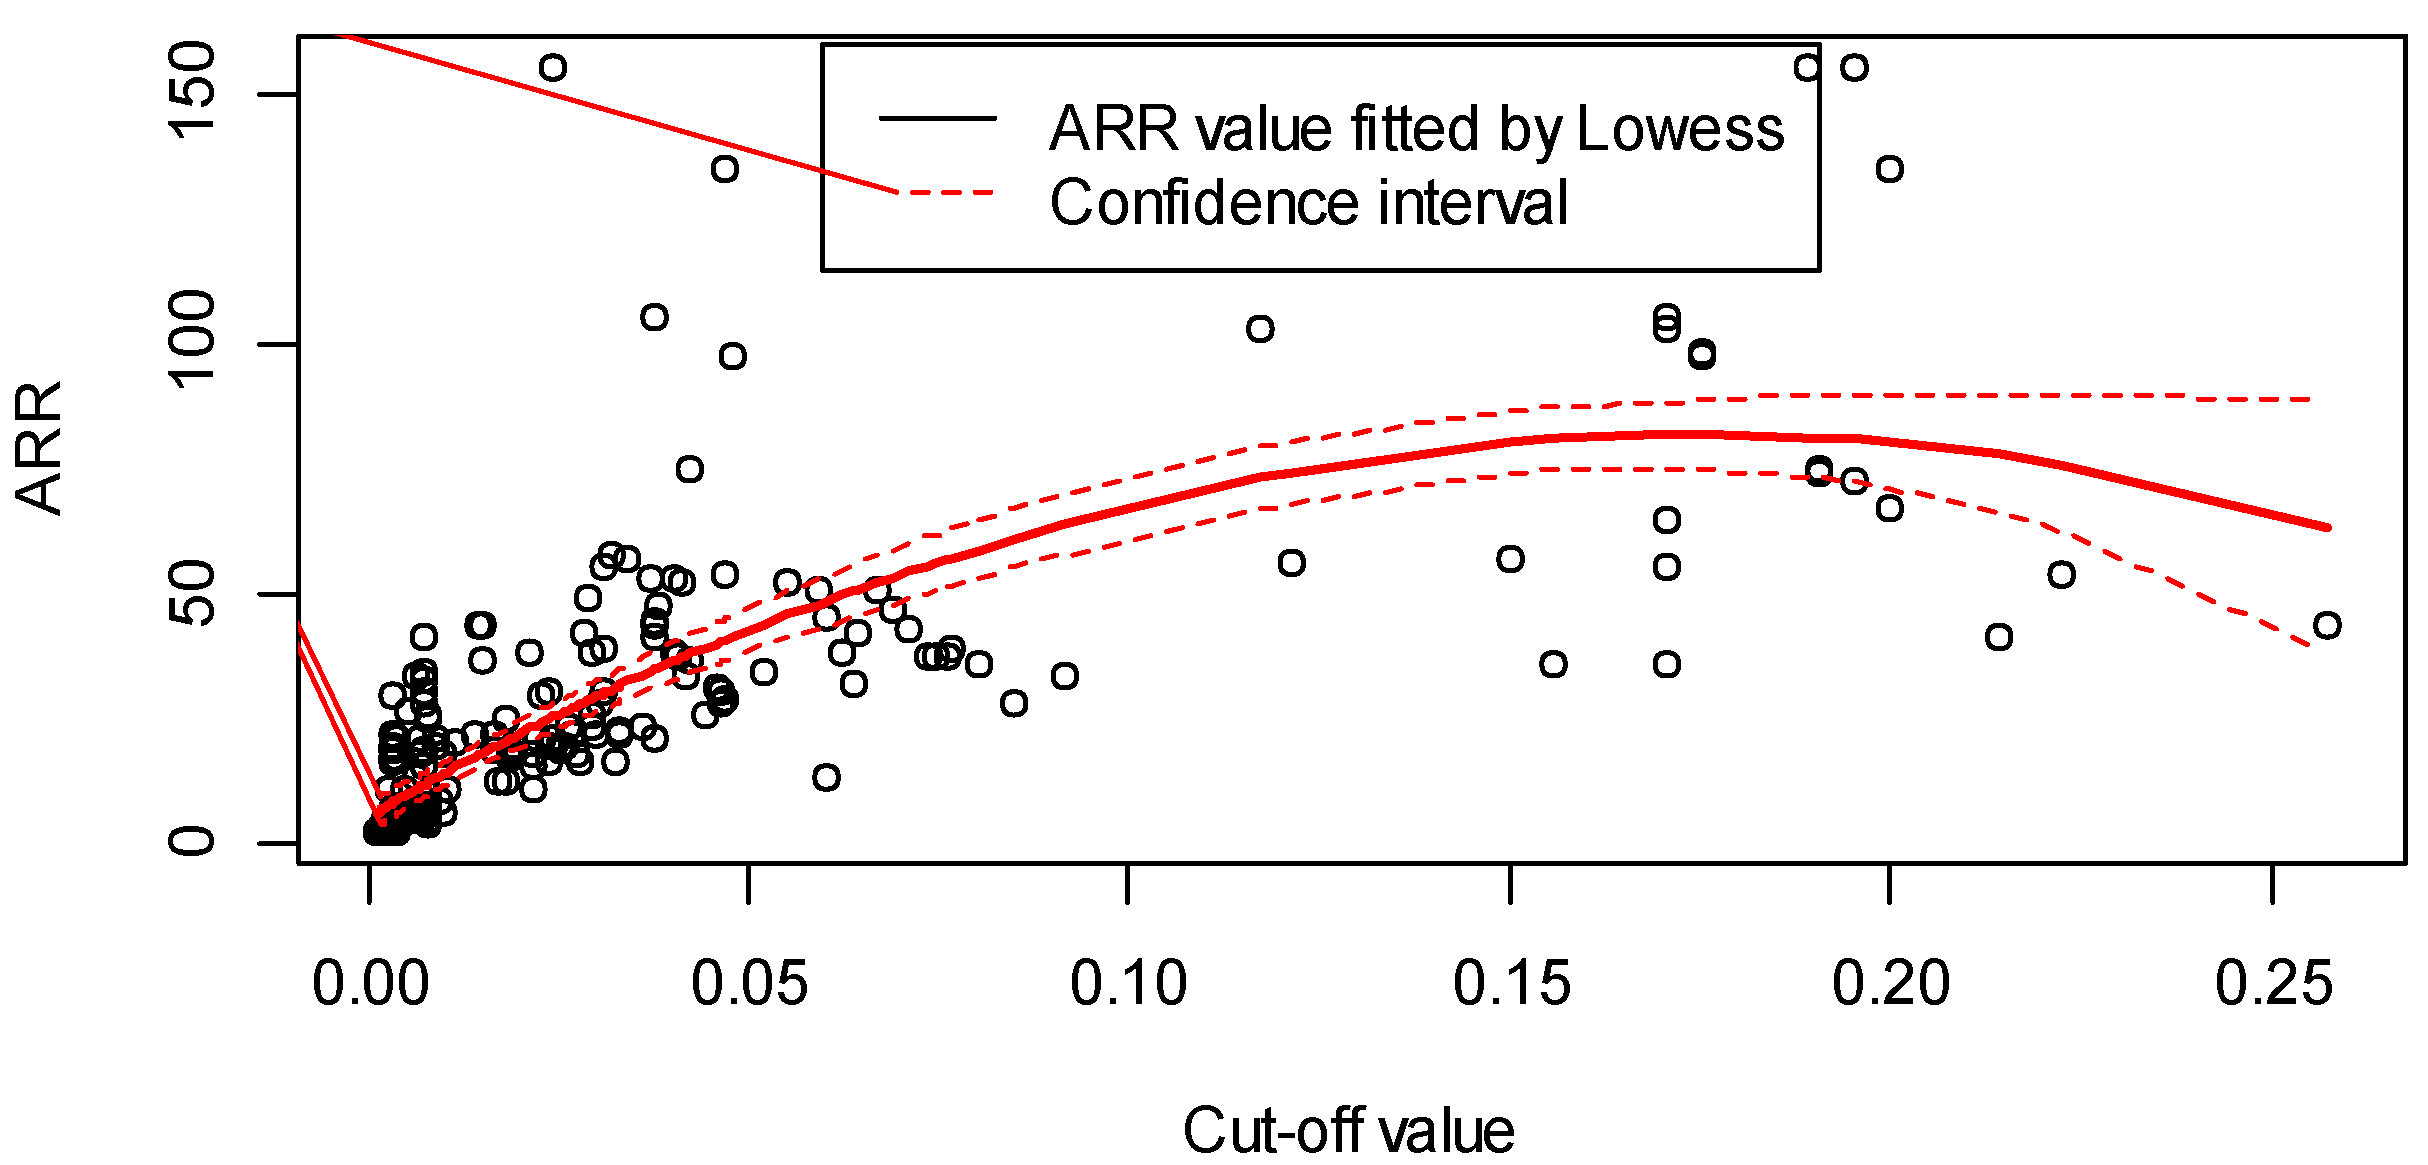
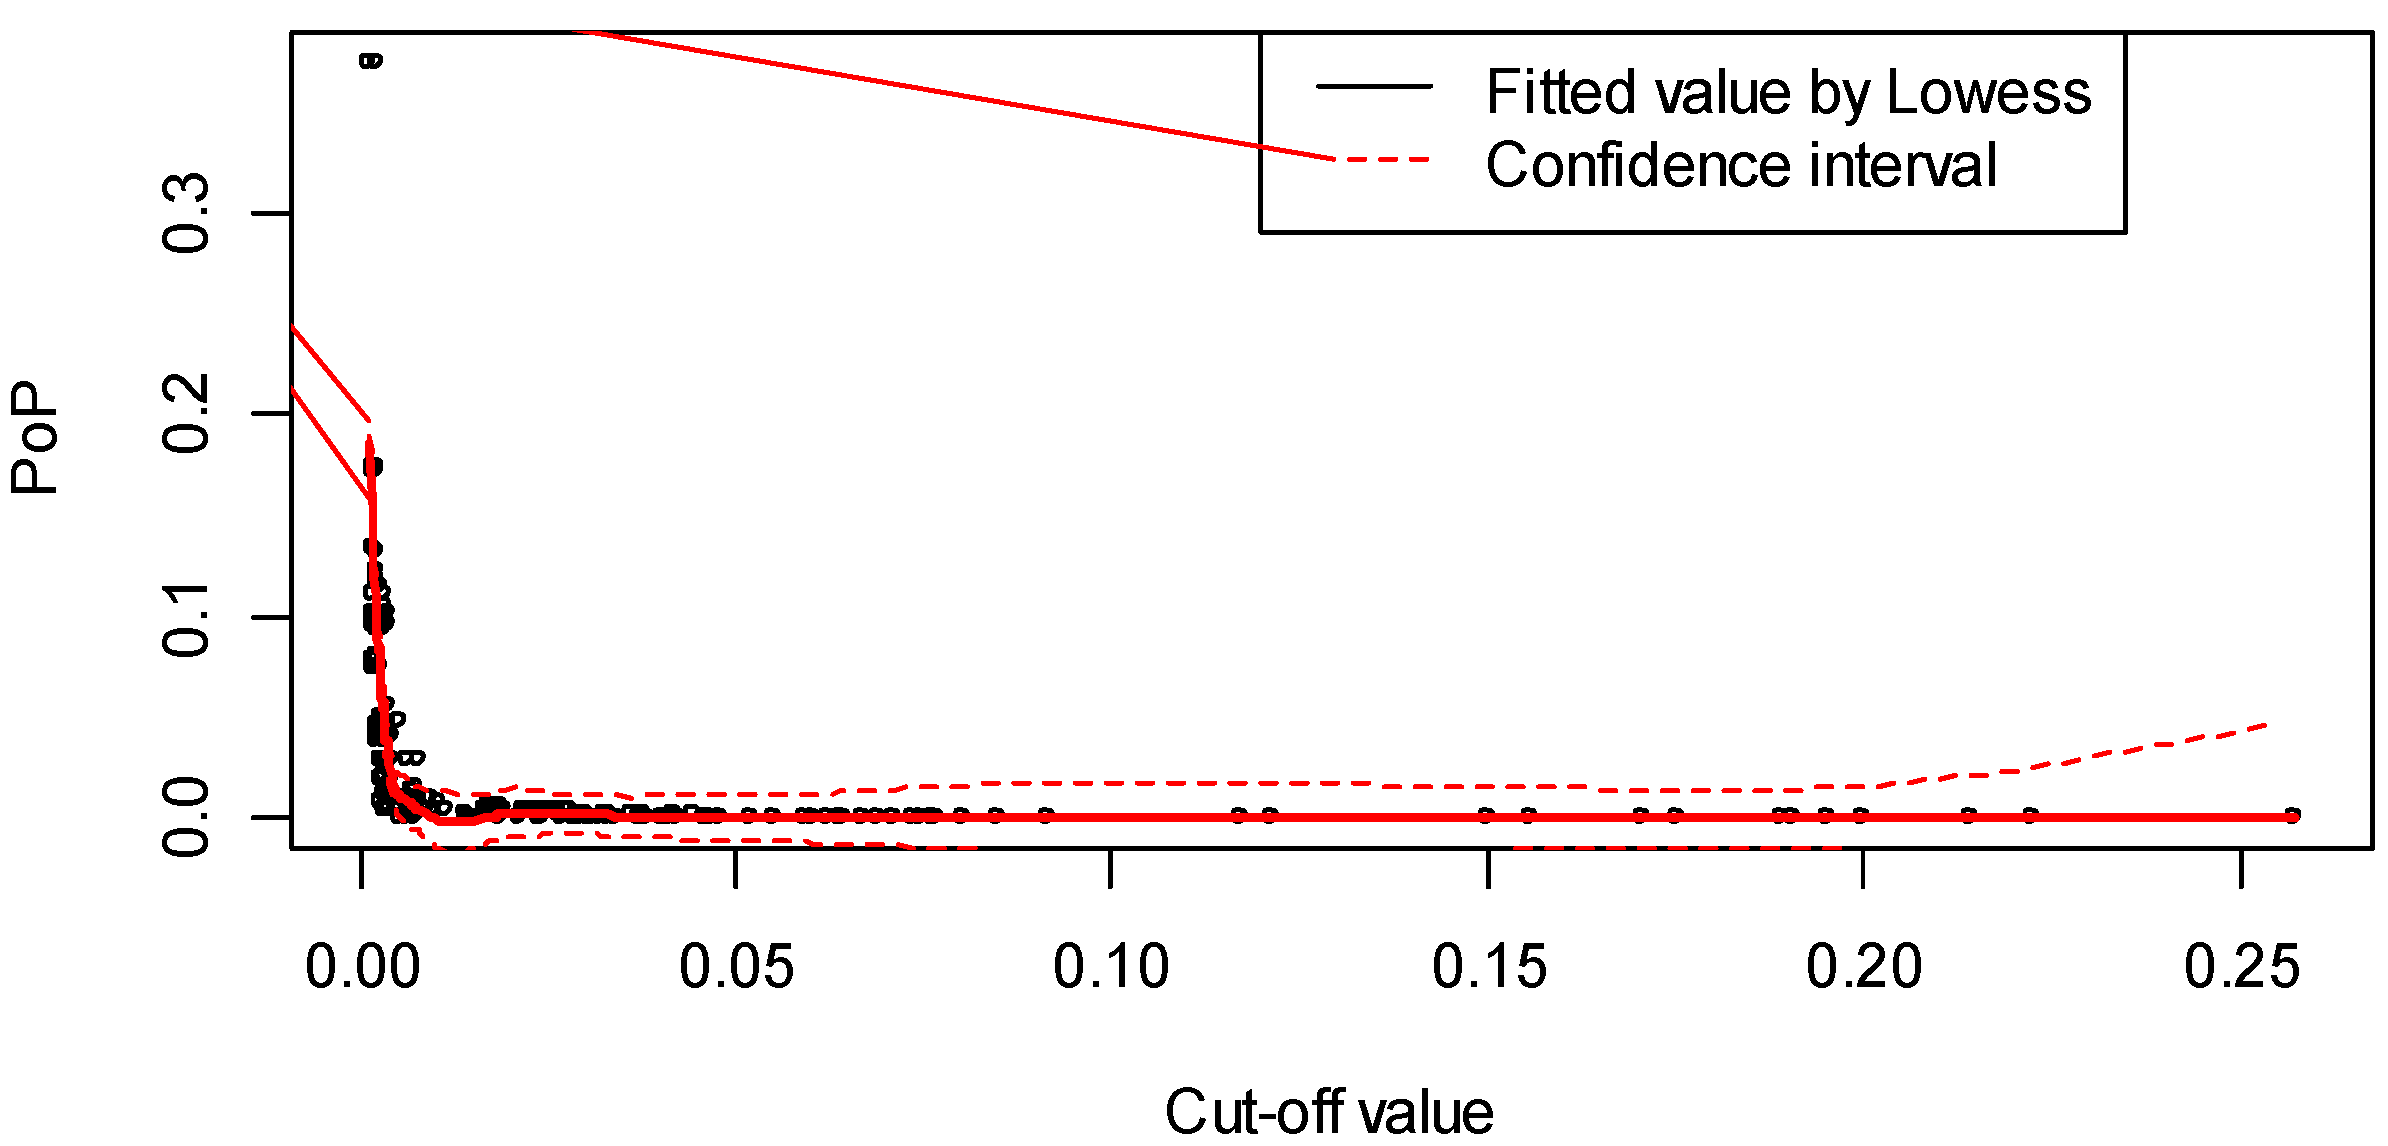
To determine the cut-off value, a trade-off between the ARR in the span of high risk and the percentage of positives (PoP) of the data needs to be achieved. A higher PoP indicates more regions to patrol, which may lead to extra costs. A higher ARR, on the other hand, may miss high-risk regions. To determine a reasonable trade-off, the training data were modeled 50 times by cross-validation, and lowess curves were fitted for different cut-offs with the ARR and PoP, respectively, as shown in Figure 3 and Figure 4, respectively.
3. Results
3.1. Output Model
The structure of the decision tree shows that time is the dominant factor in determining the risk of pipes in a region. For samples with a survival time longer than 1291 days (for example, a pipe older than 1291 days with no event records), the risk of an event occurring during June to December is higher than during the other months of the year. For samples with a survival time longer than 950 days, a super-high-rise building may slightly increase the risk.
3.2. Fifty-Fold Cross-Validation
The 50-fold cross-validation results are listed in Figure 3 and Figure 4. Figure 3 shows that the ARR increases along with the increment of the cut-off value, whereas the PoP decreases rapidly with the increment of the cut-off value, as shown in Figure 4.
A reasonable cut-off value may be picked from (0.018, 0.038), as a rapid drop of the PoP exists in this range. The lower limit was chosen to ensure that the ARR was greater than 20 (it reads 20.0 at 0.018 in Figure 3), and the upper limit was chosen to ensure that the PoP was higher than 0.1% (in Figure 4, it reads 0.105% at 0.038).
3.3. Model Performance
We chose the cut-off value to be 0.019, and we evaluated our model on the test set to determine its performance. The PoP and ARR results are listed in Table 3. The model predicts 0.41% of the test samples as being of high risk; the risk probability is 19.2 times higher than the average risk rate, i.e., an ARR of 19.2.
A discrepancy of approximately 20% was found in the ARR of the test data compared to that of the 50-fold cross-validation. This indicates that the generalization capability of this model needs further improvement. This could be attributed to our limited dataset; moreover, the dataset was extremely unbalanced.
4. Discussion
Most of the aforementioned models in the literature survey require information about pipes, which is usually limited, especially for old urban regions for periods before the establishment of the information system for city management. We used event records collected by the GUM system. Compared to other methods, the advantage is its quick and cheap data acquisition, while the disadvantage is its limited prediction accuracy.
Despite the limited accuracy, management efficiency may be improved by identifying high-risk regions using model prediction. For example, for a PoP of 0.4% and an ARR of 19, approximately 8% (0.4%×19) of events may be found by patrolling 0.4% of the regions which are predicted to be of high risk by our model.
However, the generalization capability of our model needs to be further improved, as its accuracy is approximately 8%. This limited accuracy may be attributed to the quality of the raw data. Moreover, the absence of more discriminative features, such as the pipe material and diameter, the working pressure of the pipes, and the depth and age of the pipes, may also contribute to this limited accuracy. The features that we used were pressure from nearby buildings and roads, the age of the pipe as estimated from surrounding construction time, seasons when events occurred, and event type. To the best of our knowledge, none of the first three features have ever been used by other researchers.
It can be concluded from the output of the decision tree that the most discriminative factor in determining a high-risk region is survival time (Figure 2). The next discriminative feature is the month of the year. Figure 2 shows that the risk of an event occurring during June to December is considerably higher than in other months of the same year. The event types in the GUS event records are mostly given by non-professionals or non-experts, which is usually a subjective decision based on the severity of the leakage. This inaccuracy may be attributed to the insignificance of this feature. The width of roads, the pressure of buildings, and the regional construction year contribute little to the identification of high-risk regions. However, super-high-rise buildings may slightly increase the risk of pipe events. The feature of age shows limited contribution to this risk, which is consistent with [4].
Additionally, the transformed data are extremely imbalanced. This could also have contributed to the limited accuracy. If the data were transformed in a month-based way, such an imbalance could be alleviated.
Accumulating more data always improves the prediction accuracy. Meanwhile, a hierarchical data model would help, since the maintenance and management of different urban areas affects the occurrence of pipeline events.
Author Contributions
Conceptualization, Y.Y. and J.Z.; Methodology, Y.Y. and Y.H.; Software, Y.Y. and Y.H. All authors have read and agree to the published version of the manuscript.
Funding
This research was funded by National Key R&D Program of China (2018YFC0809703) and by National Science Foundation of China (7177030217).
Conflicts of Interest
The authors declare no conflict of interest.
References
- Liu, X.Y.; Shu, S.H. Policy on water loss control in China. J. Geosci. Environ. Prot. 2018, 6, 100–107. [Google Scholar] [CrossRef] [Green Version]
- China Urban Water Association. Urban Water Supply Statistical Yearbook; China Urban Water Association: Beijing, China, 2017. [Google Scholar]
- Majidi Khalilabad, N.; Mollazadeh, M.; Akbarpour, A.; Khorashadizadeh, S. Leak detection in water distribution system using non-linear kalman filter. Int. J. Optim. Civil Eng. 2018, 8, 169–180. [Google Scholar]
- Kang, J.; Zou, Z.-H. Time prediction model for pipeline leakage based on grey relational analysis. Phys. Procedia 2012, 25, 2019–2024. [Google Scholar]
- Yang, Y.-Y.; Han, Y.-H.; Zheng, J.-C.; Wang, J.-J.; Zhao, M.; Zhu, W. Risk Evaluation of urban water distribution network pipes using neural network. In Proceedings of the 4th ACM SICSPATIAL International Workshop on Safety and Resilience, Seattle, WA, USA, 6 November 2018. [Google Scholar] [CrossRef]
- Zhang, H.-W.; Wang, L.; Yue, L.; Lian, P. Study on time-prediction models for urban water supply network leakage. China Water Wastewater 2006, 5, 52–55. [Google Scholar]
- Wang, X.; Wang, Y.; Tian, W.-B. Time-prediction model for leakage in urban water supply network. J. Water Resour. Water Eng. 2012, 4, 151–154. [Google Scholar]
- Jin, S.; Tao, T. Comparison of the application of water supply network leakage forecast model. Water Technol. 2015, 6, 35–38. [Google Scholar]
- Wang, J.; Wang, Y.; Qin, Z.-F. Prediction of the leakage of urban water supply networks by wavelet neural network. Comput. Digit. Eng. 2016, 45, 1357–1360. [Google Scholar]
- Zhang, H.-W.; Niu, Z.-G.; Chen, C.; Hong, X. Study on the prediction model for water supply net leakage. China Water Wastewater 2001, 17, 7–10. [Google Scholar]
- He, F.; Liu, S.-Q. Analysis on pipe break in water distribution system and its countermeasures. Pipeline Tech. Equip. 2004, 5, 20–23. [Google Scholar]
- Shamir, U.; Charles, D.; Howard, D. An analytic approach to scheduling pipe replacement. J. Am. Water Works Assoc. 1979, 71, 248–258. [Google Scholar] [CrossRef]
- Ma, X.-W.; Xia, L.; Cheng, L. Urban water supply pipeline renewal time prediction model. J. Shenyang Jianzhu Univ. (Nat. Sci.) 2008, 1, 129–131. [Google Scholar]
- Zhou, C.; Xin, K.-L.; Tao, T.; Yin, Z.-L. Risk assessment and visualization of water supply pipe burst. City Town Water Supply 2015, 1, 68–70. [Google Scholar]
- Ke, Q.; Zhou, C.; Wang, L.-S.; Tao, T. Burst risk assessment model for water supply networks. Water Wastewater Eng. 2016, 7, 114–118. [Google Scholar]
- Zeng, H.; Ke, Q.; Zhou, C.; Tao, T. Dynamic risk assessment of water pipes burst in water supply distribution network. Water Purif. Technol. 2018, 2, 94–99. [Google Scholar]
- Chang, T.; Liu, S.-M.; Wang, M.; Li, M.-M.; Wu, X. Health condition assessment of urban water supply network based on BP neural network. Water Wastewater Eng. 2016, 6, 138–141. [Google Scholar]
- Kumar, A.; Asad Rizvi, A.A.; Brooks, B.; Vanderveld, R.A.; Wilson, K.H.; Kenney, C.; Edelstein, S.; Finch, A.; Maxwe, A.; Zuckerbraun, J.; et al. Using machine learning to assess the risk of and prevent water main breaks. In Proceedings of the ACM SIGKDD (SIGKDD’18), London, UK, 19–23 August 2018. [Google Scholar]
- Li, F.; Tao, T. Assessment and control of water leakage from water supply system. China Water Wastewater 2012, 18, 35–39. [Google Scholar]
- Hu, Y.-C.; Xing, D.-L.; Dong, S. A new digital city management based on the adaptive spatial information multi-grid technology. In Proceedings of the Asia-Pacific Computer Science and Application Conference, Shanghai, China, 27–28 December 2014. [Google Scholar]
- Ai, Z.-Y.; Yang, M. Extended mindlin solution of horizontal force at a point in the interior of a layered soil. J. Tongji Univ. (Nat. Sci.) 2000, 28, 272–276. [Google Scholar]
- Zhang, P.; Han, X. Study on control standards of deformation and damage of underground pipelines under metro construction. In Proceedings of the 2nd National Conference on Engineering Safety and Protection, Beijing, China, 10 August 2010. [Google Scholar]
- Yang, Y.-Y.; Han, Y.-H.; Zheng, J.-C.; Yu, F.-C. Study on the performance evaluation model of underground pipeline using big data. In Tech. Rep.; 2017; pp. 35–48. Available online: https://mis.kw.beijing.gov.cn/bstrs/ (accessed on 17 February 2020).
- Biganzoli, E.; Boracchi, P.; Mariani, L.; Marubini, E. Feed forward neural networks for the analysis of censored survival data: A partial logistic regression approach. Stat. Med. 1998, 17, 1169–1186. [Google Scholar] [CrossRef]
- Binganzoli, E.; Borrachi, P.; Marubini, E. A general framework for neural network models on censored survival data. Neural Netw. 2002, 15, 209–218. [Google Scholar] [CrossRef]
- Hothorn, T.; Zeileis, A. partykit: A modular toolkit for recursive partytioning in R. J. Mach. Learn. Res. 2015, 16, 3905–3909. [Google Scholar]
Figure 1.
Categorizing displacement.

Figure 2.
Decision tree structure. Leaves represent class labels; y refers to the probability of the risk and n is the number of samples. Branches represent variables that lead to these class labels; p is the significance measure of branches.
Figure 2.
Decision tree structure. Leaves represent class labels; y refers to the probability of the risk and n is the number of samples. Branches represent variables that lead to these class labels; p is the significance measure of branches.

Figure 3.
Lowess curve of the amplification ratio of risk (ARR) versus cut-off.

Figure 4.
Lowess curve of the percentage of positives (PoP) versus cut-off.


Table 1.
Clustering of accident-related factors [5].
Table 1.
Clustering of accident-related factors [5].
| No. | Factors | Description | Classification Boundary |
|---|---|---|---|
| 1 | Number of buildings | Number of buildings within 240 m of the accident site | 0–104, 105–133, 134–168, 169–208, ≥ 209 |
| 2 | Total area of buildings | Total area of buildings within 240 m of the accident site, m2 | 0–53, 329, 53, 330–97, 121, 97, 122–155, 373, 155, 374–253, 347,≥ 253, 348 |
| 3 | Mean area of buildings | Mean area of buildings within 240 m of the accident site, m2 | 0–512, 513–753, 754–1100, 1101–1591, ≥1592 |
| 4 | Number of high-rise buildings | Number of high-rise buildings (buildings with ten or more floors, Code for Design of Civil Building) | 0–1, 2–5, 6–7, 8–17, ≥18 |
| 5 | Number of super-high-rise buildings | The number of super-high-rise buildings (higher than 100 m, Code for Design of Civil Building) surrounding the accident site | 0, 1, 2–3, ≥4 |
| 6 | Mean pressure of buildings | Mean pressure contributed by all surrounding buildings, kN | 0–25, 213, 25, 214–60, 763, 60, 764–93, 101, ≥ 93, 102 |
| 7 | Displacement | Displacement caused by surrounding buildings, estimated by the aforementioned deformation analysis model | 0–100, 101–323, ≥ 324 |
| 8 | Regional construction year | The construction year of the area where the accident occurred | ≤1987, 1988–1993, 1994–2005, ≥2006 |
| 9 | Pipeline lifetime | The interval between the regional construction year and the year of the accident, years | ≤20, 20–30, ≥30 |
| 10 | Month of accident | Month of the accident | 1–4, 5–6, 7–8, 9–10, 11–12 |
| 11 | Road width | The width of the road close to the accident site, m | 0–6, 7–9, 10–18, 19–21, 22–30, ≥31 |
| 12 | Category of accident | The category was defined by the gridding urban management (GUM) system, including 539 leakages and 320 bursts | Leakage/burst |
Table 2.
Example of survival data transformation [5].
Table 2.
Example of survival data transformation [5].
| No. | Input | Target | ||
|---|---|---|---|---|
| X1 | X2 | Time Interval | ||
| 1 | 1 | 2 | 1 | 0 |
| 2 | 1 | 2 | 2 | 0 |
| 3 | 1 | 2 | 3 | 0 |
| 4 | 1 | 2 | 4 | 1 |
Table 3.
Partial model validation results.
| Cut-Off Value | Test Data | Training Data | ||
|---|---|---|---|---|
| ARR | Percentage of Positives | ARR | Percentage of Positives | |
| 0.019 | 19.2 | 0.41% | 24 | 0.23% |
© 2020 by the authors. Licensee MDPI, Basel, Switzerland. This article is an open access article distributed under the terms and conditions of the Creative Commons Attribution (CC BY) license (http://creativecommons.org/licenses/by/4.0/).
Share and Cite
MDPI and ACS Style
Yang, Y.; Hu, Y.; Zheng, J. A Decision Tree Approach to the Risk Evaluation of Urban Water Distribution Network Pipes. Safety 2020, 6, 36. https://doi.org/10.3390/safety6030036
AMA Style
Yang Y, Hu Y, Zheng J. A Decision Tree Approach to the Risk Evaluation of Urban Water Distribution Network Pipes. Safety. 2020; 6(3):36. https://doi.org/10.3390/safety6030036
Chicago/Turabian StyleYang, Yanying, Yu Hu, and Jianchun Zheng. 2020. "A Decision Tree Approach to the Risk Evaluation of Urban Water Distribution Network Pipes" Safety 6, no. 3: 36. https://doi.org/10.3390/safety6030036
Note that from the first issue of 2016, this journal uses article numbers instead of page numbers. See further details here.