
Modeling the Impact of Driving Styles on Crash Severity Level Using SHRP 2 Naturalistic Driving Data

Department of Industrial and Systems Engineering, University at Buffalo, Buffalo, NY 14260, USA
*
Author to whom correspondence should be addressed.
Safety 2022, 8(4), 74; https://doi.org/10.3390/safety8040074
Submission received: 30 September 2022
/
Revised: 31 October 2022
/
Accepted: 1 November 2022
/
Published: 5 November 2022
(This article belongs to the Special Issue Human Factors in Road Safety and Mobility)
Abstract
:Previous studies have examined driving styles and how they are associated with crash risks relying on self-report questionnaires to categorize respondents based on pre-defined driving styles. Naturalistic driving studies provide a unique opportunity to examine this relationship differently. The current study aimed to study how driving styles, derived from real-road driving, may relate to crash severity. To study the relationship, this study retrieved safety critical events (SCEs) from the SHRP 2 database and adopted joint modelling of the number of the aggregated crash severity levels (crash vs. non-crash) using the Diagonal Inflated Bivariate Poisson (DIBP) model. Variables examined included driving styles and various driver characteristics. Among driving styles examined, styles of maintenance of lower speeds and more adaptive responses to driving conditions were associated with fewer crashes given an SCE occurred. Longer driving experiences, more miles driven last year, and being female also reduced the number of crashes. Interestingly, older drivers were associated with both an increased number of crashes and increased number of non-crash SCEs. Future work may leverage more variables from the SHRP 2 database and widen the scope to examine different traffic conditions for a more complete picture of driving styles.
1. Introduction
Proposed by Mckenna in 1983 [1], the term “differential accident involvement” describes a study area of understanding individual differences in traffic safety. For the past 30 years, many studies have been carried out to investigate whether specific behaviors or personal characteristics are associated with the susceptibility of involvement in certain traffic accidents [2,3,4,5,6]. Understanding factors that lead to susceptibility to crash risk at the driver level facilitate the development of potential countermeasures to reduce crash severity. Factors impacting crash severity could be physical, physiological and/or behavioral [7], and may include personality, demographics, driving under the influence, seatbelt use, habitual driving behaviors and so on [6,8,9,10,11,12].
Of particular interest in the present study is how driver’s habitual driving behaviors (i.e., driving style) are associated with crash severity levels. Severity analysis is usually modeled at the individual level involved in a safety-critical situation. For many years, self-report measurements have played an important role in the studies of differential accident involvement, allowing drivers to report their own attributes and to recall their crash involvement history. With the advancement in sensor technology and computational power, recent studies also recorded and analyzed crash events at the driver level in naturalistic driving studies [5,6]. Such an observation of the drivers in a naturalistic driving context also provides the opportunity to directly identify drivers’ habitual driving maneuvers to describe driver driving style.
This paper contributes to the existing body of the literature studying the relationships between driving style and crash severity by utilizing naturalistic driving data to identify driving styles in an objective way and reporting our investigation of how one’s driving style may relate to crash severity from the source of a large-scale naturalistic driving study database. We utilized the Naturalistic Driving Study (NDS) database from the Strategic Highway Research Program 2 (SHRP 2), which recorded real-road driving behaviors and safety-critical events (SCEs).
2. Literature Review
2.1. Identifying Driving Styles
Sagberg et al. [13] compiled studies in driving styles and outlined a study framework inductively. They summarized driving style as the “habitual way of driving”, which represents relatively stable characteristics of a driver or a group of drivers. In this line of research, identification of driving styles has heavily relied on subjective measurements. Questionnaires such as the Driving Behavior Questionnaire (DBQ) [14], the Driving Style Questionnaire (DSQ) [3] and the Multidimensional Driving Style Inventory (MDSI) [15] were frequently used to identify drivers’ driving styles.
These questionnaires are simple and inexpensive to administer, however, they are potentially affected by “impression management” as described earlier, and it may be challenging for drivers to recall and reflect on their vehicle maneuvers accurately. An alternative to self-reporting measures is through vehicle performance metrics, with data collection methods ranging from driving simulators [16,17,18] to cell phone censors [19,20,21] to in-vehicle sensing technologies [22,23,24,25,26].
To identify driving styles with objective measurements, some studies have predefined driving styles or aggressive behavior thresholds and then adopted different algorithms (including supervised machine learning methods) for driving style classification [20,21,25]. These predefined driving styles were obtained mainly by asking drivers to drive in particular styles (e.g., aggressive, normal and drowsy styles) from their own perception [27], filling out questionnaires [21] or evaluated by experts [25,26]. The corresponding driving profiles were then mapped as the driving style ground truth for classification. Although these attempts demonstrated the feasibility of use of objective data for driving styles recognition, the driving styles definitions were mainly subjective. Other researchers have also attempted to study driving styles without prior assumptions of driving styles but looking at the driving profiles directly. For example, Desai and Haque [18] developed a “spikiness index” from a vehicle jerk profile to indicate the individual driving style based on driver alertness in a driving simulator study. Chen, Fang and Tien [16] proposed an algorithm named “Driving Habit Graph” to group drivers into clusters according to driver behavior variables collected from a driving simulator. A growing number of driving styles field studies explore the possibilities to infer driving styles directly from vehicle parameters. In [23], a hierarchical cluster analysis identified six groups of driving styles. Four main factors that segmented driving styles were aggressivity, speed, accelerating and braking. A study by [24] aimed at combining subjective and objective measurements of driving styles to infer accident risk levels. A journey of about 1100 km was covered by five expert drivers, who were asked to drive as they normally would. The objective measurement of driving style was limited to speed (relative to predefined threshold), and that the perceived risk-level self-reported by five expert drivers are not likely to capture the potential spectrum of driving styles. The authors of [19] adopted a two-stage clustering analysis intended to identify unsafe driving behaviors. The first stage of clustering resulted in aggressive and non-aggressive driving behaviors and the second stage of clustering further clustered trips showing aggressive and non-aggressive behaviors into normal, distracted or risky trips. Our own prior work [22] also attempted to identify driving styles without assuming what numbers and types driving styles should be and examined large-scale naturalistic driving data on straight highway sections. Vehicle kinematics were extracted and fed into random forest clustering that generated three driving style clusters. The driving styles we identified showed significant differences in age, gender, driving experience and annual mileage across each cluster.
The abovementioned studies demonstrated the potential for using vehicle kinematics to capture individual differences in driving styles. Specifically, adopting objective measures has the benefit to reduce the impression management bias, and at the same time may be better at capturing unobserved factors beyond personalities, emotions or driver demographics.
2.2. Relationship between Driving Styles and Crash Severity
Early research by Hakkinen [28] found that drivers seem to differ in crash involvement risk and these differences seem to be relatively stable over time. It was found that safe drivers demonstrated some habitual driving behaviors in the similar driving situations compared to the unsafe drivers. Over recent decades, there is a growing body of studies dedicated to the study of crash involvement risk at the driver level. Specifically, researchers have been interested in understanding the factors affecting crash severity. For example, Sahar and Jehan [29] studied the relationship between driver level characteristics and crash involvement in Egypt. Using the DSQ, they found that having risky driving styles (e.g., exceeding recommended speed, disregarding road signs and deviance during driving) is associated with more involvement in the mild severity of a car crash. With similar intentions, Useche et al. [30] investigated factors that contributed to traffic crashes. They adopted the MDSI and showed that drivers with inconsiderate, careless, anxious and angry driving styles increased the severity of traffic crashes among professional drivers.
Objective crash records have also been used instead of self-report crash history. Paleti et al. [12] utilized an accident database to estimate the influence of driver aggressiveness on injury severity. Structural Equation Models built to account for unobserved factors found aggressiveness to be positively correlated to the severity level of injury. Younger males were also more likely to drive aggressively, thus having an indirect effect on injury severity.
Not wearing a seat belt when driving is sometimes viewed as an unsafe driving habit and could affect injury severity. Eluru and Bhat [31] collected crash data from the 2003 General Estimates System (GES) and found that safety-conscious drivers were more likely to wear seat belts when driving, and their defensive habits also led to less severe injuries when they were involved in crashes.
In addition to the self-report crash history and police report crash database, naturalistic driving studies have also yielded valuable information regarding pre-crash contributing factors. Utilizing the data from the 100-Car Naturalistic Driving Study conducted by Virginia Tech Transportation Institute, [5] analyzed driving styles associated with crash events with subjective measurement tools—Dula Dangerous Driving Index (DDDI) and Life Stress Index (LSI). Higher scores on the Aggressive driving index in DDDI as well as LSI were found to be associated with a higher likelihood of being involved in crashes of critical severity. In addition, driver experience was found to be significant at the level of α = 0.01, with longer driving experiences associated with a lower likelihood of crash or near-crash occurrence. In [6], the authors retrieved run-off-road events from the same naturalistic driving dataset to study the association between crash risks and a driver’s precursor state (stress and emotion index, sleep hours per day) and personal attributes (age, years of driving experience). Precursor states that affected the crash and near-crash numbers were sleep habits and hours. Again, a positive association was also found between aggressive driving (measured by DDDI) and number of crashes.
3. Rationale and Objective
Through direct observation with unobtrusive recordings, naturalistic data has the potential to address the issue of under-reporting no injury or minor injury events. On the other hand, previous studies on crash risk analysis conducted in naturalistic settings mainly relied on questionnaires to study the association between specific type of human factors (e.g., driving behaviors, personalities, skills, attitudes and habitual driving styles) and crash risk. Although these subjective measures have expanded the knowledge base on crash risk factors for improving traffic safety, their validity in establishing correlations between factors of interest and accidents has been questioned, due to the tendency of giving favorable self-descriptions (“impression management”) when drivers respond to relevant traffic behavior inventories [32]. Beyond collecting data on near crash and crash events, naturalistic studies also afford the opportunity to examine individual differences in driving styles, thereby providing an objective set of measures on driving styles, complementary to the self-reported scales.
With more than 1800 crash events and 20,000 baseline (normal) events recorded, the SHRP 2 program provides the opportunity for us to investigate the relation between driving styles directly measured from vehicle kinematic parameters and the level of crash severity among safety critical events. One benefit of using this large-scale naturalistic driving data is to overcome the under-report issues in archival data (e.g., accidents database), where drivers involved in minor incidents may choose not to report them [33]. Furthermore, safety critical but non-crash events are seldom included in archival data. The inclusion of such events in the SHRP2 data allows for a larger range of safety critical levels that are important to study. Building on our prior work, which successfully derived distinct driving styles from a subset of SHRP2 data, the current study aims to examine the relationship between driving styles and the severity level of crash and near-crash events.
4. Materials and Methods
Most of the previous studies in the naturalistic driving context adopted subjective measures to identify drivers’ psychological states as driving styles and then studied the association between the identified driving styles and crash risk. In order to fully explore the potential use of naturalistic driving study, the present study utilized the driving style identified from vehicle kinematics and studied its association with severity level.
4.1. SHRP 2 Database
To study the association between driving styles and crash risks, the SHRP 2 Naturalistic Driving Study database was utilized [34]. From 2010 to 2013, the SHPR 2 program monitored over 3400 drivers driving in their own vehicles. The data collection covered more than 35 million vehicle miles in 6 sites across the United States over this 3-year study.
Given the research interest in habitual driving style and its association with crash severity, data sets of both baseline (normal) drives and safety critical events were collected. The “baselines” samples were utilized for the driving style identification, and these baselines are time series data without a crash or near-crash event. This information was extracted for the reason that the maneuvers to avoid contingency events (e.g., emergency hard braking) in the safety critical events were not considered as habitual ways of driving.
About 20,000 baseline trips were available in the NDS database, and baselines were random sample stratified by vehicle and proportion of time driven over 5 mph. An additional 12,586 baselines were extracted for some drivers, and these were balanced samples taking driving exposure of each driver into consideration [35]. As an exploratory study, the study scope was narrowed down to straight sections of highways without severe traffic congestions (to decrease the likelihood of analyzing behaviors in stop-and-go traffic).
In total, 7524 baseline trips met the filter criteria to support further analysis. Corresponding time series data from integrated sensors, driver demographics questionnaires and driver history questionnaires were obtained. Each time series record consists of a 20 s epoch. Variables related to vehicle kinematics, including speed, lateral and longitudinal variables of these 20 s epochs were obtained.
The other data set consists of all SCEs. The original NDS database includes 4254 SCEs. Among them, 1549 are crashes and 2705 are near crashes [35]. The same filter criteria on alignment, traffic density and locality were applied to SCEs to perform further association analysis. Eventually, 1676 records of SCEs were received to support the association analysis. Table 1 summarizes the selection criteria for the study.
4.2. Independent Variables
4.2.1. Driving Styles
The present study adopted as independent variables the driving styles clustering results from our previous work [22]. We utilized Random Forest (RF) and Partitioning Around Medoids (PAM) methods to perform a cluster analysis on 2487 time series records from the baseline trips collected in the SHRP 2 program. The time series data analyzed mainly consists of vehicle kinematics of speed, lateral acceleration and longitudinal acceleration. Variables for cluster analysis were further derived from these three types of vehicle kinematic parameters for their maximum, minimum, average and variation variables (See Table 2). A positive longitudinal acceleration in the NDS database represents a forward acceleration parallel to vehicle travel direction, and a negative longitudinal acceleration is the deceleration. For lateral acceleration, positive values indicate acceleration to the right and negative values represent acceleration to the left. In clustering driving styles, accelerations were separated by positive and negative values as drivers might vary in their acceleration control in different directions.
The result of clustering analysis from [22] identified three driving style clusters. Based on a principal component analysis (PCA), these clusters showed correlations and differences in speed maintained, lateral acceleration, braking behavior and longitudinal acceleration. We did not attempt to define or name the three clusters in [22], and simply refer to them as Cluster A, Cluster B and Cluster C. Characteristics of each driving style cluster are summarized in Table 3. Cluster A represents the group of drivers with higher speed and low acceleration maneuvering, Cluster B represents the group of drivers with higher speed, low to moderate acceleration control and finally, Cluster C represents the group of drivers with lower speed, high variability in longitudinal acceleration maneuvering but with full range of lateral acceleration and braking control. These driving styles represent drivers’ ways of vehicle maneuvers on straight highway sections during normal drives. It is important to note that the driving styles were based on trips made, rather than individual drivers. In other words, some drivers might be associated with more than one style due to having multiple trips recorded in the data set. There were 1458 unique drivers responsible for the 2487 baseline trips examined, and each driver made at least 1 trip and at most 13 trips. Overall, 1064 drivers had trips that were associated with only one of the three clusters; 326 drivers made trips that were categorized into two of the clusters; and 68 drivers had trips found in all three clusters. As such, driving style clusters were further aggregated from the three basic clusters (A, B and C) to form four more driving styles: Style AB being the combination of drivers assigned with both Style A and Style B, Style AC being the style that drivers were assigned with Style A and Style C, Style BC being assigned with Style B and Style C and Style ABC as drivers being clustered with all three styles (See Table 4).
4.2.2. Other Driver Characteristics
In addition to driving styles, we also included driver characteristic variables in the model, as previous literature often found associations between these variables and crash risk and or severity. These variables came from the SHRP2-NDS’s driver demographics and driving history database: gender, age (grouped into young—16 to 29 years old, middle—30 to 59 years old, and old—over 60 years old), years of driving, miles driven last year and annual mileage (low—under 10,000 miles, medium—10,000 to 20,000 miles, and high—over 20,000 miles. Table 4 presents the list of the independent variables used in the study.
4.3. Dependent Variables
The dependent variables were crash severity levels of SCEs. The event data file retrieved from SHRP 2 database was filtered first and excluded the baseline and additional balanced baseline. The remaining safety critical events in the event records has two variables of crash severity, i.e., Crash severity 1 and Crash severity 2. These were logged based on the sequence of crash occurrence of a single event, with the cash severity definition of 5 levels, including I. Most severe, II. Police reportable crash, III. Minor crash, IV. Low-risk tire strike and V. Not a crash (Near-crash events and excluded baseline normal events). In the current study, Crash severity 1 and Crash severity 2 from the NDS database were combined into one crash severity variable taking on the value with the more severe consequence as an overall event severity.
The SCEs were first matched to drivers who made the event. The numbers of each crash severity level were then counted for each driver. After data aggregation and removing the missing records, 491 drivers with their corresponding crash counts of each severity level during the data collection period were used for studying the association between driving styles and crash severity level. The definition of each crash severity level and the frequencies after data processing for further analysis were summarized in Table 5.
However, further aggregation was necessary for modeling. SCE levels were aggregated into Crash (combination of the original level 1 to level 4 SCE) and Non-Crash (the original level 5 SCE) levels, as the number of events associated with the individual driver, whose driving style were identified from the cluster analysis, was very small.
Table 6 presents the cross-tabulation of numbers of drivers having crash severity levels and the corresponding number of non-crash severity levels during the data collection period. From the table, it can be seen that the most frequently observed condition was that drivers experienced at least one non-crash SCE and zero records of crash counts.
4.4. Model Selection—Diagonal Inflated Bivariate Poisson Regression
The choice of statistical modeling method relies on the characteristics of the dependent variables. Traditionally, to analyze highway safety, studies have modeled the counts of severity level of different severity levels using either univariate Poisson or Negative Binomial models. However, variations of these univariate models are developed considering the nature of the dependent variables as well as the research question. The review by Savolainen et al. [38] pointed out that severity level data is usually ordinal by nature, and the failure to account for the ordinal properties could result in biased parameter estimation given the potential correlation across neighbor categories (e.g., in the KABCO scale, where K-fatality, A-incapacitating injury, B-non-incapacitating, C-possible injury, O-no injury, the neighbor categories could be correlated), leading to inappropriate inferences due to the effect of unobserved factors across severity levels. In view of this limitation, studies have attempted to expand univariate analysis to multivariate methods to account for count data with multiple levels instead of building separate count models for each severity level.
By jointly estimating different severity levels, multivariate methods could better account for the correlation between severity levels. For example, Ma and Kockelmann [39] adopted the Multivariate Poisson (MVP) model to estimate counts of different severity levels using data from highway segments in Washington state. The result found a positive correlation between unobserved factors across severity levels which affect the prediction of count numbers and showed better model performance than using a univariate Poisson model. One major issue of MVP, however, is the inability to account for overdispersion, which is an issue commonly observed in crash data. The multivariate Poisson-Lognormal (MVPLN) method was therefore adopted to better model the crash counts [40,41,42,43,44]. Parameter estimation for MVPLN adopts Bayesian Framework with Markov Chain Monte Carlo (MCMC) simulation. These studies have also shown that there is significant correlation across different crash severity levels.
Multivariate Poisson regression was first considered for analysis in this study for two reasons. First, according to Ma and Kockelman [39], it has the advantages of estimation efficiency and better capability of characterizing overall risk using joint probability than separated count models. Second, Wu et al. [6] found that crash numbers between different severity levels were significantly correlated in their study using a naturalistic driving database, which supported the use of multivariate analysis in this similar context.
More specifically, bivariate count analysis was conducted with two dependent variables, i.e., Crash and Non-Crash levels of severity. Given that the basic bivariate Poisson (BP) model was only suitable for counts that are positively correlated between the two dependent variables [45], in this study, a variant model named diagonal inflated bivariate Poisson (DIBP) was adopted for the analysis for its characteristic of also taking the negative correlation between two dependent variables into account. One more important characteristic of the DIBP model is that DIBP model is a special case of bivariate Poisson regression that is able to handle over- or under-dispersed count data [46], which can be an issue in crash data analysis [47,48]. The DIBP model has been successfully applied in the analysis of health care and sports [46] as well as traffic safety [49]. The form of the DIBP model is briefly described below, and a more detail description of the model has been previously reported [46].
The original bivariate Poisson (BP) model is defined as follows:
where x and y are the two dependent variables (in this study, two severity levels) that are considered to be related. λ1, λ2 and λ3 are the event occurrence rate for independent Poisson distributions. Moreover, the expected value of x, E[x] = λ1 + λ3 and the expected value of y, E[y] = λ2 + λ3. The covariance between x and y is equal to λ3, indicating the correlation between the two dependent variables. If λ3 = 0, the bivariate Poisson model becomes a double Poisson model (DP) (two independent Poisson distributions) [50]. To further expand BP, a mixing proportion parameter (pm) and a discrete distribution (fD) were introduced. The intention of adding mixing proportion was to consider the inflated counts of the same values of two dependent variables, that is, the portion of crash counts equal to non-crash counts on the diagonal of the cross-tabulation (see Table 6 for example). The inflated diagonal count is assumed to follow fD. Therefore, the diagonal inflated bivariate Poisson (DIBP) is defined as:
where pm is the mixing proportion and fD is the probability mass function of a discrete distribution D(x; θ). Geometric, Poisson or simple discrete distribution could be used for D; in this research, simple discrete distribution was selected, and its form is shown as below:
where . J controls the number in the diagonal cells in the cross-tabulation for the paired datasets considered by the model. The expected numbers of x and y can be calculated as:
5. Model Estimation Results
Table 7 presents the estimation results of the parameters of the DIBP model. The standard error and t-value was estimated using 200 bootstrap replications as [46] suggested. Simple discrete distribution was selected for fD with J = 3, meaning three parameters were estimated. λ1 and λ2 are the mean estimation for severity “Crash” and severity “Non-Crash”, respectively, whereas λ3 is the estimation of the average number of the overlapped (numbers on the diagonal of the cross-tabulation that indicate crash and non-crash correlation) and represent the covariance between two dependent variables. The model also estimated the mixing proportion pm, which indicates that the cross-tabulation of the SCE counts (Table 6) should have proportion higher than 1.10% on the diagonal area. This was consistent with the actual counts shown in Table 6, which indeed was about 3%.
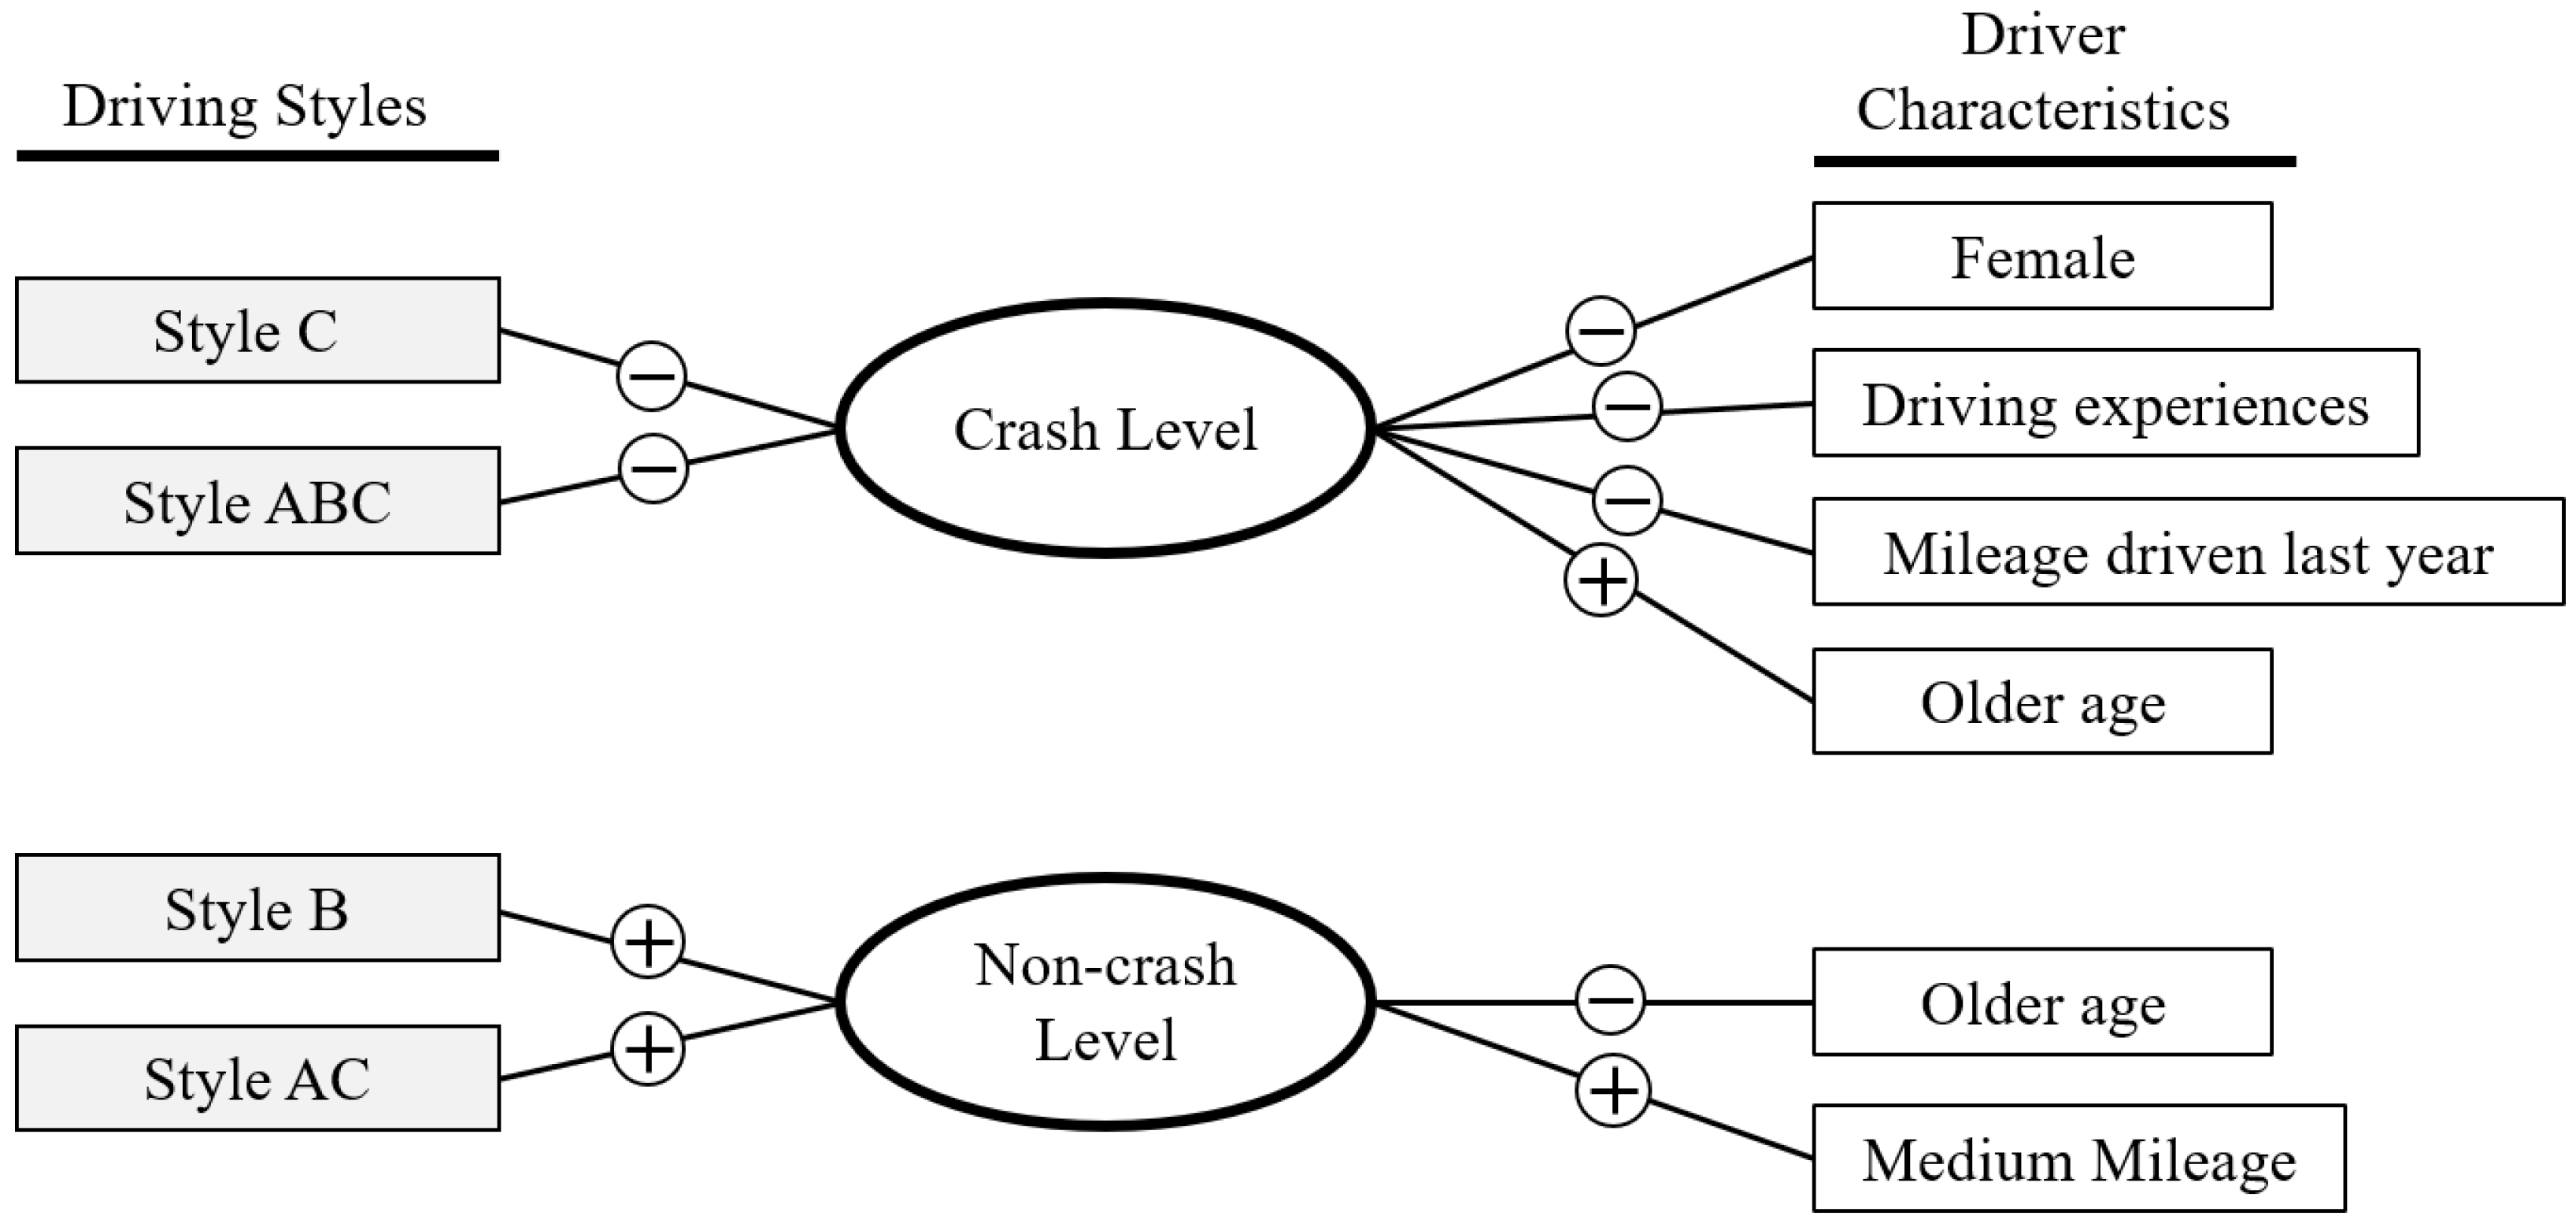
The estimation results for the DIBP model could be interpreted separately for the Crash level and the Non-crash level. For the Crash level, in terms of driving styles, the estimation showed that driving style ABC was significantly associated with crash counts, whereas driving style C was marginally significant. Both of the two driving styles had negative coefficients, which indicated that the presence of style ABC and C were lower than the expected numbers of occurrence of crash events (λ1). Other significant factors that were associated with crash occurrence were the presence of female drivers, miles driven last year, years of driving and old age group. If the drivers were female, the expected number of crashes was reduced. Similarly, drivers who had more mileage in the previous year and more driving experience also translated into a reduction in the occurrence of crashes. Drivers defined as the old age group was the only factor that increased the expected number of crash occurrences.
On the other hand, for the non-crash severity level (λ2), driving style B and AC were significant and had positive coefficients; the old age group was found to be significant and had negative coefficients. Drivers with medium level of annual mileage was marginally significant and increased the number of non-crash occurrences. Finally, given that λ3 = 0, there was no overlapped portion of the expected number of counts under Crash level and Non-crash level.
We also note that the overall model fit (AIC = 2096.52) was found to be an improvement over a simplified model without driving style variables (AIC = 2116.91), supporting the inclusion of driving styles as explanatory variables.
6. Discussion
This study presents an analysis of association between driving styles and crash severity, both derived from SHRP 2 naturalistic driving data. The SHRP 2 program provides an opportunity to examine this relationship using objective measures (vehicle maneuvers) rather than subjective measures of habitual driving manners (e.g., drivers being prone to drive aggressively or commit in risky driving behaviors). The driving styles analyzed in this study were based on our earlier clustering of driving behaviors using naturalistic vehicle kinematic parameters without prior knowledge or hypothesis about the driving styles [22]. Findings from the present analysis thus contribute to the current understanding of crash risk by examining the combination of driver characteristics that may be predictive of crash severity. Furthermore, the use of the DIBP model enabled the analysis to differentiate the level of severity in crashes to understand, predict and provide correction methods for potential hazardous driving styles.
In the present analysis, we expanded on the number of driving styles by allowing some combinations of the three driving styles found in our earlier work [22], as we observed that some drivers were found to be associated with multiple driving styles (See Figure 1). In terms of driving styles, Style C and Style ABC were negatively associated with crash occurrence in our model. Drivers with driving Style C maintained lower speeds and showed high acceleration variability. It may be that at lower speeds, drivers had more time to maneuver and reduce crash severity when a safety critical event happened. For drivers identified with driving Style ABC, which means they exhibit all three original styles, one plausible explanation is that they may be more adaptive of the transient situation with regard to their maneuvering behaviors and are thus associated with fewer crashes. Further research may be necessary to understand the role of environmentally adaptive behavior in lowering crash risks and/or crash severity, and to study individual differences in such adaptive behaviors.
On the other hand, holding all other factors fixed, driving Styles B and AC were found to positively contribute to the occurrence of the non-crash SCEs. Driving style AC is the combination of driving Styles A and C, which were two extreme vehicle controlling behaviors (higher and lower speeds, respectively) in terms of the four factors of driving styles. It may be that drivers with both excessive and insufficient speeds during their trips are more likely to lead to SCEs when interacting with other road users. This is different from drivers with only Style C (lower speeds), which was associated with significantly fewer crashes and not associated with non-crash occurrences. On the other hand, such deviation from moderate speed maintenance may suggest an overall lower ability to maintain proper speed, potentially an indicator of lesser driving skills. Interestingly, driving Style B alone (moderate maneuver behaviors) also contributes positively to the non-crash occurrence and was not associated with crash occurrence. It is possible that it is the moderate maneuvers that allow drivers to have the time and ability to perform avoidance maneuvers when they were in SCEs.
Being female, driven more miles in the previous year and having more years of driving experiences all reduced the probability of crash occurrence. This seems consistent with findings from previous naturalistic driving study [5]; drivers with more driving experiences are likely more acquainted with driving at both the tactical and operational levels so as to reduce the chance of being involved themselves in crashes. Our finding regarding gender effect is also generally consistent with previous studies [52,53]; female drivers are less likely to be involved in higher severity crash levels.
When it comes to age effects, older drivers (age greater than 60) were the only age group that had significant associations with crash counts. In our model, the older age group, compared to other age groups, was associated with a higher number of SCEs resulting in crashes, which is similar to the finding of [12] where older drivers were more likely to be involved in higher severity levels compared to the young age group. This may be related to age-related declines in cognitive and motor control abilities that prevents older drivers from effective and agile maneuvers to avoid crashes in already critical situations. However, we also observed that the older age group had a significant association with lower number of SCEs resulting in non-crashes. The effects of age groups may be biased due to the SHRP 2 program’s sampling protocol that oversampled participants in the young and older age groups.
Finally, we also note that the third estimation λ3 in the model, which can be interpreted as the average number of the overlap of crash and non-crash, was close to 0. This to some extent reflects that drivers who experienced one of the severity levels are not likely involved in another level, i.e., no observed shared factors that informs joint occurrence of both severity levels. This result may also suggest that there are no specific characteristics to imply one group of drivers is more prone to be involved in SCEs than the others.
Several limitations should be noted for this study. The driving style analysis was limited to the particular type of road investigated as per the data inclusion criteria mentioned, with straight highway segments only. Vehicle parameters more relevant to curve road were not considered, e.g., yaw rate, lane position and steering wheel position. Therefore, the driving styles being identified may reflect only the transient behaviors rather than individual driving style. We provided a more thorough discussion on limitations related to the driving styles identified in [22]. The present analysis was also limited by the same scope. The selection of safety critical events in the study focused on a specific driving context (e.g., straight highway segments) and limited driving conditions (e.g., free flow driving) to match the conditions employed for the driving style analysis. These constraints limit the analysis to only a subset of all possible safety critical events a driver might have experienced. Furthermore, due to limited data available, aggregation of severity levels across all crashes was necessary. Analysis of a more detailed breakdown of crash severity levels would be more beneficial for understanding and proposing countermeasures to reduce crash risk. It is also worth noting that the SHRP 2 program used different approaches to identify SCEs. The identified SCEs, however, did not include crash-relevant conflicts (CRCs) and were not further reduced [35]. Therefore, the CRCs were not included in the present study as well. Future studies may also consider taking CRCs together for analysis if they are available, and there may be two ways to consider the use of CRCs, 1. Since CRCs in SHRP 2 were considered as events that required less urgent maneuvering, CRC could be incorporated into driving style identification; and 2. CRCs and near-crashes together may form comprehensive traffic conflicts and traffic conflicts may provide a clearer picture for understanding crash risk [54], real-time traffic safety estimation [55] and how identified driving styles are associated with them.
Finally, according to Jovanis et al. [5], the influence of omitted variables was much less apparent for driver-related variables, and these were successfully modeled with DIBP in the study. In the future, including driving environment variables, such as roadway geometrics and traffic conditions, would yield a more comprehensive analysis that may capture a fuller picture of risk factors associated with accidents and other safety critical events.
7. Conclusions
One important topic in roadway safety is to understand the differences in risk factors leading to different levels of crash severities to help combat the rate of high severity crashes. Using naturalistic data from the SHRP2 program, this paper presents an analysis of the relationship between driving styles and crash severity levels using the DIBP model. In particular, driving styles investigated were based on the results of a cluster analysis of vehicle kinematic parameters without any prior assumption about the driving styles. Our model results show some interesting findings relating potential driving styles to crash severity; for example, drivers who maintained lower speeds and appeared more adaptive to the driving conditions were associated with a smaller number of SCEs that resulted in a crash. We found the DIBP modelling approach useful in allowing the simultaneous modelling of two dependent variables (crash and non-crash SCE counts in this case) and also flexible in that, depending on the results of parameter estimations, it may be reduced to simpler forms of bivariate models (e.g., a double Poisson model).
Author Contributions
Conceptualization, K.-T.C. and H.-Y.W.C.; methodology, K.-T.C. and H.-Y.W.C.; formal analysis, K.-T.C.; resources, H.-Y.W.C.; data curation, K.-T.C.; writing—original draft preparation, K.-T.C.; writing—review and editing, H.-Y.W.C.; supervision, H.-Y.W.C.; project administration, K.-T.C. and H.-Y.W.C. All authors have read and agreed to the published version of the manuscript.
Funding
This research received no external funding.
Institutional Review Board Statement
The study was conducted in accordance with the Declaration of Helsinki and approved by the University at Buffalo Institutional Review Board (IRB ID STUDY00002158). The University at Buffalo Institutional Review Board review decision was that this research was exempt (dated 09 January 2018).
Informed Consent Statement
Informed consent was obtained from the participants in the original SHRP 2 study from which the naturalistic driving study dataset was extracted. The analyses conducted in the present study are secondary analyses and did not involve human subject data collection. As part of the original Informed Consent Statement of the original SHRP 2 study, the participants consented to the subsequent use of all or part of their data for follow-on analyses by other research institutes if done under the provisions of a Data Usage License (DUL) administered by the Virginia Tech Transportation Institute (VTTI).
Data Availability Statement
The SHRP 2 naturalistic driving data set used in this study can be requested from: https://doi.org/10.15787/VTT1/LKCXAL, accessed on 1 September 2022.
Acknowledgments
The SHRP 2 Data was made available through the TRB student paper competition: SHRP 2 Safety Data Bonanza 2017–2018. The research is supported by the Department of Industrial and Systems Engineering at the State University of New York at Buffalo.
Conflicts of Interest
The authors declare no conflict of interest.
References
- Mckenna, F.P. Accident Proneness: A Conceptual Analysis. Accid. Anal. Prev. 1983, 15, 65–71. [Google Scholar] [CrossRef]
- Elander, J.; West, R.; French, D. Behavioral Correlates of Individual Differences in Road-Traffic Crash Risk: An Examination of Methods and Findings. Psychol. Bull. 1993, 113, 279–294. [Google Scholar] [CrossRef]
- French, D.J.; West, R.J.; Elander, J.; Wilding, J.M. Decision-Making Style, Driving Style, and Self-Reported Involvement in Road Traffic Accidents. Ergonomics 1993, 36, 627–644. [Google Scholar] [CrossRef] [PubMed]
- Shinar, D. Traffic Safety and Human Behavior, 1st ed.; Emerald Publishing Limited: Bradford, UK, 2007; ISBN 0080450296. [Google Scholar]
- Jovanis, P.; Aguero-Valverde, J.; Wu, K.-F.; Shankar, V. Analysis of Naturalistic Driving Event Data. Transp. Res. Rec. J. Transp. Res. Board 2011, 2236, 49–57. [Google Scholar]
- Wu, K.F.; Aguero-Valverde, J.; Jovanis, P.P. Using Naturalistic Driving Data to Explore the Association between Traffic Safety-Related Events and Crash Risk at Driver Level. Accid. Anal. Prev. 2014, 72, 210–218. [Google Scholar] [CrossRef] [PubMed]
- Milton, J.C.; Shankar, V.N.; Mannering, F.L. Highway Accident Severities and the Mixed Logit Model: An Exploratory Empirical Analysis. Accid. Anal. Prev. 2008, 40, 260–266. [Google Scholar] [CrossRef] [PubMed]
- Haleem, K.; Alluri, P.; Gan, A. Analyzing Pedestrian Crash Injury Severity at Signalized and Non-Signalized Locations. Accid. Anal. Prev. 2015, 81, 14–23. [Google Scholar] [CrossRef]
- Chen, C.; Zhang, G.; Tarefder, R.; Ma, J.; Wei, H.; Guan, H. A Multinomial Logit Model-Bayesian Network Hybrid Approach for Driver Injury Severity Analyses in Rear-End Crashes. Accid. Anal. Prev. 2015, 80, 76–88. [Google Scholar] [CrossRef]
- Behnood, A.; Roshandeh, A.M.; Mannering, F.L. Latent Class Analysis of the Effects of Age, Gender, and Alcohol Consumption on Driver-Injury Severities. Anal. Methods Accid. Res. 2014, 3–4, 56–91. [Google Scholar] [CrossRef]
- Yasmin, S.; Eluru, N.; Bhat, C.R.; Tay, R. A Latent Segmentation Based Generalized Ordered Logit Model to Examine Factors Influencing Driver Injury Severity. Anal. Methods Accid. Res. 2014, 1, 23–38. [Google Scholar] [CrossRef]
- Paleti, R.; Eluru, N.; Bhat, C.R. Examining the Influence of Aggressive Driving Behavior on Driver Injury Severity in Traffic Crashes. Accid. Anal. Prev. 2010, 42, 1839–1854. [Google Scholar] [CrossRef] [PubMed]
- Sagberg, F.; Selpi; Bianchi Piccinini, G.F.; Engström, J. A Review of Research on Driving Styles and Road Safety. Hum. Factors: J. Hum. Factors Ergon. Soc. 2015, 57, 1248–1275. [Google Scholar] [CrossRef] [PubMed]
- Reason, J.; Manstead, A.; Stephen, S.; Baxter, J.; Campbell, K. Errors and Violations on the Roads: A Real Distinction? Ergonomics 1990, 33, 1315–1332. [Google Scholar] [CrossRef] [PubMed]
- Taubman-Ben-Ari, O.; Mikulincer, M.; Gillath, O. The Multidimensional Driving Style Inventory—Scale Construct and Validation. Accid. Anal. Prev. 2004, 36, 323–332. [Google Scholar] [CrossRef]
- Chen, S.W.; Fang, C.Y.; Tien, C.T. Driving Behaviour Modelling System Based on Graph Construction. Transp. Res. Part C Emerg. Technol. 2013, 26, 314–330. [Google Scholar] [CrossRef]
- Kalsoom, R.; Halim, Z. Clustering the Driving Features Based on Data Streams. In Proceedings of the International Multi Topic Conference (INMIC), Lahore, Pakistan, 19–20 December 2013; IEEE: New York, NY, USA, 2013; pp. 89–94. [Google Scholar]
- Desai, A.V.; Haque, M.A. Vigilance Monitoring for Operator Safety: A Simulation Study on Highway Driving. J. Saf. Res. 2006, 37, 139–147. [Google Scholar] [CrossRef]
- Mantouka, E.G.; Barmpounakis, E.N.; Vlahogianni, E.I. Identifying Driving Safety Profiles from Smartphone Data Using Unsupervised Learning. Saf. Sci. 2019, 119, 84–90. [Google Scholar] [CrossRef]
- Johnson, D.A.; Trivedi, M.M. Driving Style Recognition Using a Smartphone as a Sensor Platform. In Proceedings of the 14th International Conference on Intelligent Transportation Systems (ITSC), Washington, DC, USA, 5–7 October 2011; IEEE: New York, NY, USA, 2011; pp. 1609–1615. [Google Scholar]
- Hong, J.-H.H.; Margines, B.; Dey, A.K. A Smartphone-Based Sensing Platform to Model Aggressive Driving Behaviors. In Proceedings of the 32nd Annual Conference on Human Factors in Computing Systems—CHI ’14, Toronto, ONT, Canada, 26 April–1 May 2014; ACM Press: New York, NY, USA, 2014; pp. 4047–4056. [Google Scholar]
- Chen, K.-T.; Chen, H.-Y.W. Driving Style Clustering Using Naturalistic Driving Data. Transp. Res. Rec. J. Transp. Res. Board 2019, 2673, 176–188. [Google Scholar] [CrossRef]
- Constantinescu, Z.; Marinoiu, C.; Vladoiu, M. Driving Style Analysis Using Data Mining Techniques. Int. J. Comput. Commun. Control. 2010, 5, 654. [Google Scholar] [CrossRef]
- Eboli, L.; Mazzulla, G.; Pungillo, G. How to Define the Accident Risk Level of Car Drivers by Combining Objective and Subjective Measures of Driving Style. Transp. Res. Part F Traffic Psychol. Behav. 2017, 49, 29–38. [Google Scholar] [CrossRef]
- Chen, D.; Chen, Z.; Zhang, Y.; Qu, X.; Zhang, M.; Wu, C. Driving Style Recognition under Connected Circumstance Using a Supervised Hierarchical Bayesian Model. J. Adv. Transp. 2021, 2021, 6687378. [Google Scholar] [CrossRef]
- Li, G.; Li, S.E.; Cheng, B.; Green, P. Estimation of Driving Style in Naturalistic Highway Traffic Using Maneuver Transition Probabilities. Transp. Res. Part C: Emerg. Technol. 2017, 74, 113–125. [Google Scholar] [CrossRef]
- Xie, J.; Zhu, M. Maneuver-Based Driving Behavior Classification Based on Random Forest. IEEE Sens. Lett. 2019, 3, 1–4. [Google Scholar] [CrossRef]
- Häkkinen, S. Traffic Accidents and Driver Characteristics: A Statistical and Psychological Study. Ph.D. Thesis, Institute of Technology Otaniemi, Helsinki, Finland, 1958. [Google Scholar]
- Sabbour, S.M.; Ibrahim, J.M. Driving Behaviour, Driver Style and Road Traffic Accidents among Young Medical Group. Inj. Prev. 2010, 16, A33. [Google Scholar] [CrossRef] [Green Version]
- Useche, S.A.; Cendales, B.; Alonso, F.; Orozco-Fontalvo, M. A Matter of Style? Testing the Moderating Effect of Driving Styles on the Relationship between Job Strain and Work-Related Crashes of Professional Drivers. Transp. Res. Part F Traffic Psychol. Behav. 2020, 72, 307–317. [Google Scholar] [CrossRef]
- Eluru, N.; Bhat, C.R. A Joint Econometric Analysis of Seat Belt Use and Crash-Related Injury Severity. Accid. Anal. Prev. 2007, 39, 1037–1049. [Google Scholar] [CrossRef] [Green Version]
- Lajunen, T.; Corry, A.; Summala, H.; Hartley, L. Impression Management and Self-Deception in Traffic Behaviour Inventories. Personal. Individ. Differ. 1997, 22, 341–353. [Google Scholar] [CrossRef]
- Arthur, W.; Graziano, W.G. The Five-Factor Model, Conscientiousness, and Driving Accident Involvement. J. Personal. 1996, 64, 593–618. [Google Scholar] [CrossRef]
- Transportation Research Board of the National Academies of Science. The 2nd Strategic Highway Research Program Naturalistic Driving Study Dataset. 2013. Available online: https://insight.shrp2nds.us (accessed on 27 January 2018).
- Hankey, J.M.; Perez, M.A.; McClafferty, J.A. Description of the SHRP 2 Nauralistic Database and the Crash, Near-Crash, and Baseline Data Set. Task Report; Virginia Tech Transportation Institute: Blacksburg, VA, USA, 2016. [Google Scholar]
- Virginia Tech Transportation Institute. Event Detail Table Data Dictionary. 2015. Available online: https://insight.shrp2nds.us/ (accessed on 12 December 2017).
- Virginia Tech Transportation Institute. SHPR 2 Researcher Dictionary for Video Reduction Data. 2015. Available online: https://insight.SHRP2nds.us/ (accessed on 30 September 2018).
- Savolainen, P.T.; Mannering, F.L.; Lord, D.; Quddus, M.A. The Statistical Analysis of Highway Crash-Injury Severities: A Review and Assessment of Methodological Alternatives. Accid. Anal. Prev. 2011, 43, 1666–1676. [Google Scholar] [CrossRef] [Green Version]
- Ma, J.; Kockelman, K.M. Bayesian Multivariate Poisson Regression for Models of Injury Count, by Severity. Transp. Res. Rec. J. Transp. Res. Board 2006, 1950, 24–34. [Google Scholar] [CrossRef]
- Ma, J.; Kockelman, K.M.; Damien, P. A Multivariate Poisson-Lognormal Regression Model for Prediction of Crash Counts by Severity, Using Bayesian Methods. Accid. Anal. Prev. 2008, 40, 964–975. [Google Scholar] [CrossRef] [PubMed]
- Park, E.S.; Lord, D. Multivariate Poisson-Lognormal Models for Jointly Modeling Crash Frequency by Severity. Transp. Res. Rec. 2007, 2019, 1–6. [Google Scholar] [CrossRef] [Green Version]
- El-Basyouny, K.; Sayed, T. Collision Prediction Models Using Multivariate Poisson-Lognormal Regression. Accid. Anal. Prev. 2009, 41, 820–828. [Google Scholar] [CrossRef] [PubMed]
- Aguero-Valverde, J.; Jovanis, P.P. Bayesian Multivariate Poisson Lognormal Models for Crash Severity Modeling and Site Ranking. Transp. Res. Rec. 2009, 2136, 82–91. [Google Scholar] [CrossRef]
- Wang, K.; Ivan, J.N.; Ravishanker, N.; Jackson, E. Multivariate Poisson Lognormal Modeling of Crashes by Type and Severity on Rural Two Lane Highways. Accid. Anal. Prev. 2017, 99, 6–19. [Google Scholar] [CrossRef]
- Bermúdez i Morata, L. A Priori Ratemaking Using Bivariate Poisson Regression Models. Insur. Math. Econ. 2009, 44, 135–141. [Google Scholar] [CrossRef] [Green Version]
- Karlis, D.; Ntzoufras, I. Bivariate Poisson and Diagonal Inflated Bivariate Poisson Regression Models in R. J. Stat. Softw. 2005, 14, 1–36. [Google Scholar] [CrossRef] [Green Version]
- Ver Hoef, J.M.; Boveng, P.L. Quasi-Poisson vs. Negative Binomial Regression: How Should We Model Overdispersed Count Data? Ecology 2007, 88, 2766–2772. [Google Scholar] [CrossRef] [Green Version]
- Oh, J.; Washington, S.P.; Nam, D. Accident Prediction Model for Railway-Highway Interfaces. Accid. Anal. Prev. 2006, 38, 346–356. [Google Scholar] [CrossRef]
- Lao, Y.; Wu, Y.J.; Corey, J.; Wang, Y. Modeling Animal-Vehicle Collisions Using Diagonal Inflated Bivariate Poisson Regression. Accid. Anal. Prev. 2011, 43, 220–227. [Google Scholar] [CrossRef]
- Karlis, D.; Ntzoufras, L. Analysis of Sports Data by Using Bivariate Poisson Models. J. R. Stat. Soc. Ser. D Stat. 2003, 52, 381–393. [Google Scholar] [CrossRef]
- McLachlan, G.J.; Krishnan, T. The EM Algorithm and Extensions, 2nd ed.; Wiley Series in Probability and Statistics; John Wiley & Sons, Inc.: Hoboken, NJ, USA, 2007; ISBN 9780470191613. [Google Scholar]
- Zhou, H.; Zhao, J.; Pour-Rouholamin, M.; Tobias, P.A. Statistical Characteristics of Wrong-Way Driving Crashes on Illinois Freeways. Traffic Inj. Prev. 2015, 16, 760–767. [Google Scholar] [CrossRef] [PubMed]
- Regev, S.; Rolison, J.J.; Moutari, S. Crash Risk by Driver Age, Gender, and Time of Day Using a New Exposure Methodology. J. Saf. Res. 2018, 66, 131–140. [Google Scholar] [CrossRef] [PubMed]
- Arun, A.; Haque, M.M.; Bhaskar, A.; Washington, S.; Sayed, T. A Systematic Mapping Review of Surrogate Safety Assessment Using Traffic Conflict Techniques. Accid. Anal. Prev. 2021, 153, 106016. [Google Scholar] [CrossRef]
- Fu, C.; Sayed, T. A Multivariate Method for Evaluating Safety from Conflict Extremes in Real Time. Anal. Methods Accid. Res. 2022, 36, 100244. [Google Scholar] [CrossRef]
Figure 1.
Illustration of modeling results with significant driver level characteristics. Negative signs indicate negative association and positive signs indicate positive association.
Figure 1.
Illustration of modeling results with significant driver level characteristics. Negative signs indicate negative association and positive signs indicate positive association.

Table 1.
Data selection criteria for baseline trips and safety critical events. (Adapted from Event Detail Table Data Dictionary [36], available at https://insight.shrp2nds.us/, accessed on 12 December 2017).
Table 1.
Data selection criteria for baseline trips and safety critical events. (Adapted from Event Detail Table Data Dictionary [36], available at https://insight.shrp2nds.us/, accessed on 12 December 2017).
| Variable | Selection Criteria |
|---|---|
| Event Severity 1 | (1) Balanced-Sample Baseline; (2) Additional Baseline. (3) Crash. (4) Near Crash. |
| Alignment | Straight Alignment. |
| Traffic Density | (1) LOS A1; (2) LOS A2; (3) LOS B; (4) LOS C. |
| Locality | (1) Interstate or Bypass or Divided highway with no traffic signals; (2) Bypass or Divided Highway with traffic signals. |
Table 2.
Variables aggregated for cluster analysis. (Adapted from Chen, K.-T.; Chen, H.-Y.W. Driving Style Clustering Using Naturalistic Driving Data. Transp. Res. Rec. J. Transp. Res. Board 2019, 2673, 176–188) [22].
Table 2.
Variables aggregated for cluster analysis. (Adapted from Chen, K.-T.; Chen, H.-Y.W. Driving Style Clustering Using Naturalistic Driving Data. Transp. Res. Rec. J. Transp. Res. Board 2019, 2673, 176–188) [22].
| Vehicle Kinematic Parameters | Variables |
|---|---|
| Speed | Mean Speed Standard Deviation of Speed Maximum Speed Minimum Speed |
| Lateral Acceleration | Mean Positive Acceleration Mean Negative Acceleration Standard Deviation of Acceleration Maximum Acceleration to the right Maximum Acceleration to the left |
| Longitudinal Acceleration | Mean Positive Acceleration Mean Negative Acceleration Standard Deviation of Acceleration Maximum Acceleration Minimum Acceleration |
Table 3.
Interpretation of driving styles of each cluster. (Adapted from Chen, K.-T.; Chen, H.-Y.W. Driving Style Clustering Using Naturalistic Driving Data. Transp. Res. Rec. J. Transp. Res. Board 2019, 2673, 176–188) [22].
Table 3.
Interpretation of driving styles of each cluster. (Adapted from Chen, K.-T.; Chen, H.-Y.W. Driving Style Clustering Using Naturalistic Driving Data. Transp. Res. Rec. J. Transp. Res. Board 2019, 2673, 176–188) [22].
| Factors | Cluster A | Cluster B | Cluster C |
|---|---|---|---|
| Speed maintenance | Medium to high speed | Medium to high speed | Low to medium speed |
| Lateral acceleration maneuver | Low lateral maneuver variability | Low lateral maneuver variability | High lateral maneuver variability |
| Braking Maneuver | Mild braking maneuver | Moderate braking | Harder braking maneuver |
| Longitudinal acceleration Maneuvering | Mild variability in acceleration maneuvering | Moderate variability in acceleration maneuvering | High variability in acceleration maneuvering |
Table 4.
Independent variables used for the crash risk analysis at driver level.
| Explanatory Variable | Description |
|---|---|
| Gender | Female (n = 235) |
| Male (n = 256) | |
| Miles Driven Last Year/1000 | The approximation of miles participant drove last year divided by 1000. (Mean = 21.8, Std. = 16.5, n = 491) |
| Years of Driving | The number of years the participant has been driving. (Mean = 18.71, Std. = 18.67, n = 491) |
| Age Group | Young age group (Age 16–29, n = 283) |
| Middle age group (Age 30–59, n = 136) | |
| Old age group (Age over 60, n = 72) | |
| Annual Mileage | Low mileage (<10,000 miles, n = 110) |
| Medium mileage (10,000–20,000 miles, n = 130) | |
| High mileage (over 20,000 miles, n = 251) | |
| Identified Driving Style | Style A (n = 129) |
| Style B (n = 91) | |
| Style C (n = 85) | |
| Style AB (n = 58) | |
| Style AC (n = 52) | |
| Style BC (n = 40) | |
| Style ABC (n = 36) |
Table 5.
Definition of crash severity in NDS database. (Reproduced from: SHPR 2 Researcher Dictionary for Video Reduction Data [37], available at: https://insight.SHRP2nds.us/, accessed on 30 September 2018).
Table 5.
Definition of crash severity in NDS database. (Reproduced from: SHPR 2 Researcher Dictionary for Video Reduction Data [37], available at: https://insight.SHRP2nds.us/, accessed on 30 September 2018).
| Level | Description | Frequency |
|---|---|---|
| I. Most Severe | Any crash that includes an airbag deployment; any injury of driver, pedal cyclist or pedestrian; a vehicle roll over; a high Delta V (speed change of the subject vehicle during impact greater than 20 mph); or that requires vehicle towing. Injury if present should be sufficient to require a doctor’s visit. | 10 |
| II. Police Reportable Crash | Severity that does not meet level 1 requirement. Includes sufficient property damage that is police-reportable. Includes crashes that reach an acceleration on any axis greater than +/− 1.3 g (excluding curb strikes) as well. | 9 |
| III. Minor Crash | Crashes not included in above levels. Includes physical contact with another object but with minimal damage. Includes most road departures, small animal strikes, all curbs and tires strikes potentially in conflict with oncoming traffic and other curb strikes with an increased risk element. | 32 |
| IV. Low-Risk Tire Strike | Tire Strike, Low Risk. Tire strike only with little/no risk element. | 5 |
| V. Not a crash | Includes all event severity levels except for crash. (Baseline excluded in the analysis) | 850 |
Table 6.
Cross-tabulation of non-crash and crash data.
| Count of Crash | Count of Non-Crash | |||||||
|---|---|---|---|---|---|---|---|---|
| 0 | 1 | 2 | 3 | 4 | 5 | 6 | >6 | |
| 0 | 0 | 278 | 80 | 40 | 18 | 11 | 3 | 10 |
| 1 | 21 | 15 | 7 | 3 | 0 | 0 | 0 | 0 |
| 2 | 3 | 1 | 0 | 1 | 0 | 0 | 0 | 0 |
Table 7.
DIBP Model estimation results.
| Variable | Crash | Non-Crash | Covariance | ||||||
|---|---|---|---|---|---|---|---|---|---|
| λ1 = 0.155 | λ2 = 1.690 | λ3 = 0.000 | |||||||
| Coef. | Std. err. | |t-Stat| | Coef. | Std. err. | |t-Stat| | Coef. | Std. err. | |t-Stat| | |
| Constant | 0.291 ** | 0.006 | 3.210 | 0.291 ** | 0.006 | 3.210 | −14.790 * | 0.621 | 1.685 |
| Gender (Female = 1, Male = 0) | −1.082 ** | 0.020 | 3.896 | 0.072 | 0.005 | 1.083 | |||
| Miles Driven Last Year (divided by 1000) | −0.035 ** | 0.000 | 3.649 | −0.001 | 0.000 | 0.508 | |||
| Years of Driving | −0.055 ** | 0.001 | 4.012 | 0.004 | 0.000 | 0.981 | |||
| Age Group (Middle age group = 1, otherwise = 0) | −0.117 | 0.131 | 0.063 | 0.054 | 0.008 | 0.465 | |||
| Age Group (Old age group = 1, otherwise = 0) | 2.123 ** | 0.046 | 3.254 | −0.509 ** | 0.016 | 2.236 | |||
| Annual Mileage (Low mile = 1, otherwise = 0) | −0.124 | 0.025 | 0.352 | 0.013 | 0.006 | 0.015 | |||
| Annual Mileage (Medium mile = 1, otherwise = 0) | −0.145 | 0.022 | 0.477 | 0.166 * | 0.007 | 1.653 | |||
| Driving Style (Style B = 1, otherwise = 0) | −1.725 | 0.131 | 0.929 | 0.247 ** | 0.007 | 2.362 | |||
| Driving Style (Style C = 1, otherwise = 0) | −0.687 * | 0.026 | 1.889 | 0.128 | 0.007 | 1.173 | |||
| Driving Style (Style AB = 1, otherwise = 0) | −1.214 | 0.130 | 0.660 | 0.178 | 0.009 | 1.330 | |||
| Driving Style (Style AC = 1, otherwise = 0) | −1.220 | 0.131 | 0.656 | 0.372 ** | 0.009 | 2.953 | |||
| Driving Style (Style BC = 1, otherwise = 0) | −1.17 | 0.141 | 0.588 | 0.115 | 0.010 | 0.839 | |||
| Driving Style (Style ABC = 1, otherwise = 0) | −15.674 ** | 0.02 | 54.426 | 0.133 | 0.011 | 0.893 | |||
| Pm = 0.0105 † | |||||||||
| θ1, θ2, θ3 = 1, 0, 0 | |||||||||
**: significant at 95% level; *: significant at 90% level; †: mixing proportion.
Publisher’s Note: MDPI stays neutral with regard to jurisdictional claims in published maps and institutional affiliations. |
© 2022 by the authors. Licensee MDPI, Basel, Switzerland. This article is an open access article distributed under the terms and conditions of the Creative Commons Attribution (CC BY) license (https://creativecommons.org/licenses/by/4.0/).
Share and Cite
MDPI and ACS Style
Chen, K.-T.; Chen, H.-Y.W. Modeling the Impact of Driving Styles on Crash Severity Level Using SHRP 2 Naturalistic Driving Data. Safety 2022, 8, 74. https://doi.org/10.3390/safety8040074
AMA Style
Chen K-T, Chen H-YW. Modeling the Impact of Driving Styles on Crash Severity Level Using SHRP 2 Naturalistic Driving Data. Safety. 2022; 8(4):74. https://doi.org/10.3390/safety8040074
Chicago/Turabian StyleChen, Kuan-Ting, and Huei-Yen Winnie Chen. 2022. "Modeling the Impact of Driving Styles on Crash Severity Level Using SHRP 2 Naturalistic Driving Data" Safety 8, no. 4: 74. https://doi.org/10.3390/safety8040074
Note that from the first issue of 2016, this journal uses article numbers instead of page numbers. See further details here.