
Analysis of Entropy in a Hardware-Embedded Delay PUF


Abstract
:1. Introduction
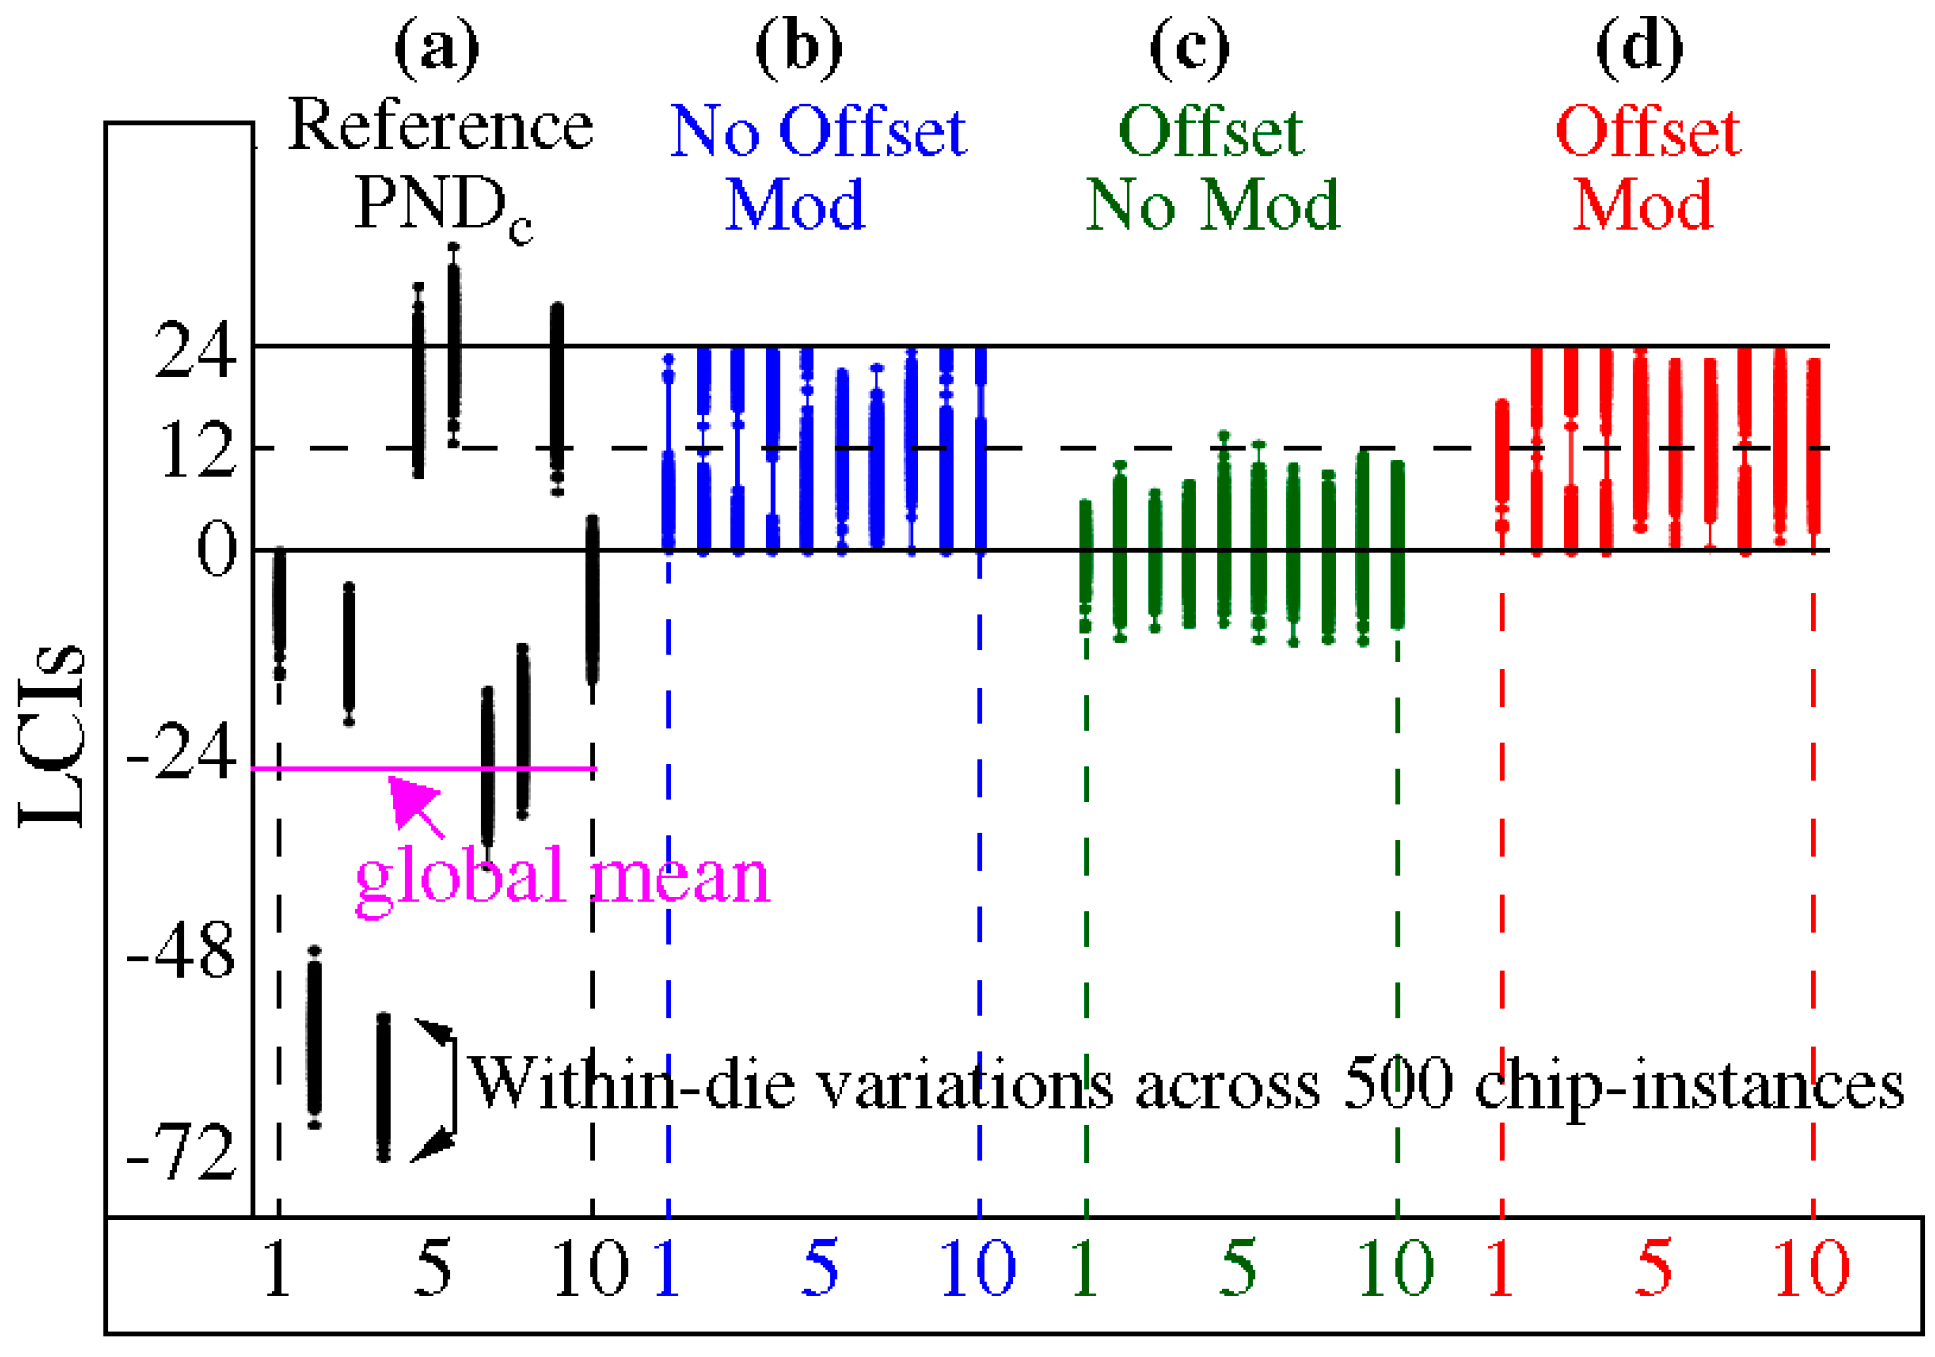
- Strong experimental evidence that HELP leverages within-die variations (WDV) almost exclusively as its source of entropy.
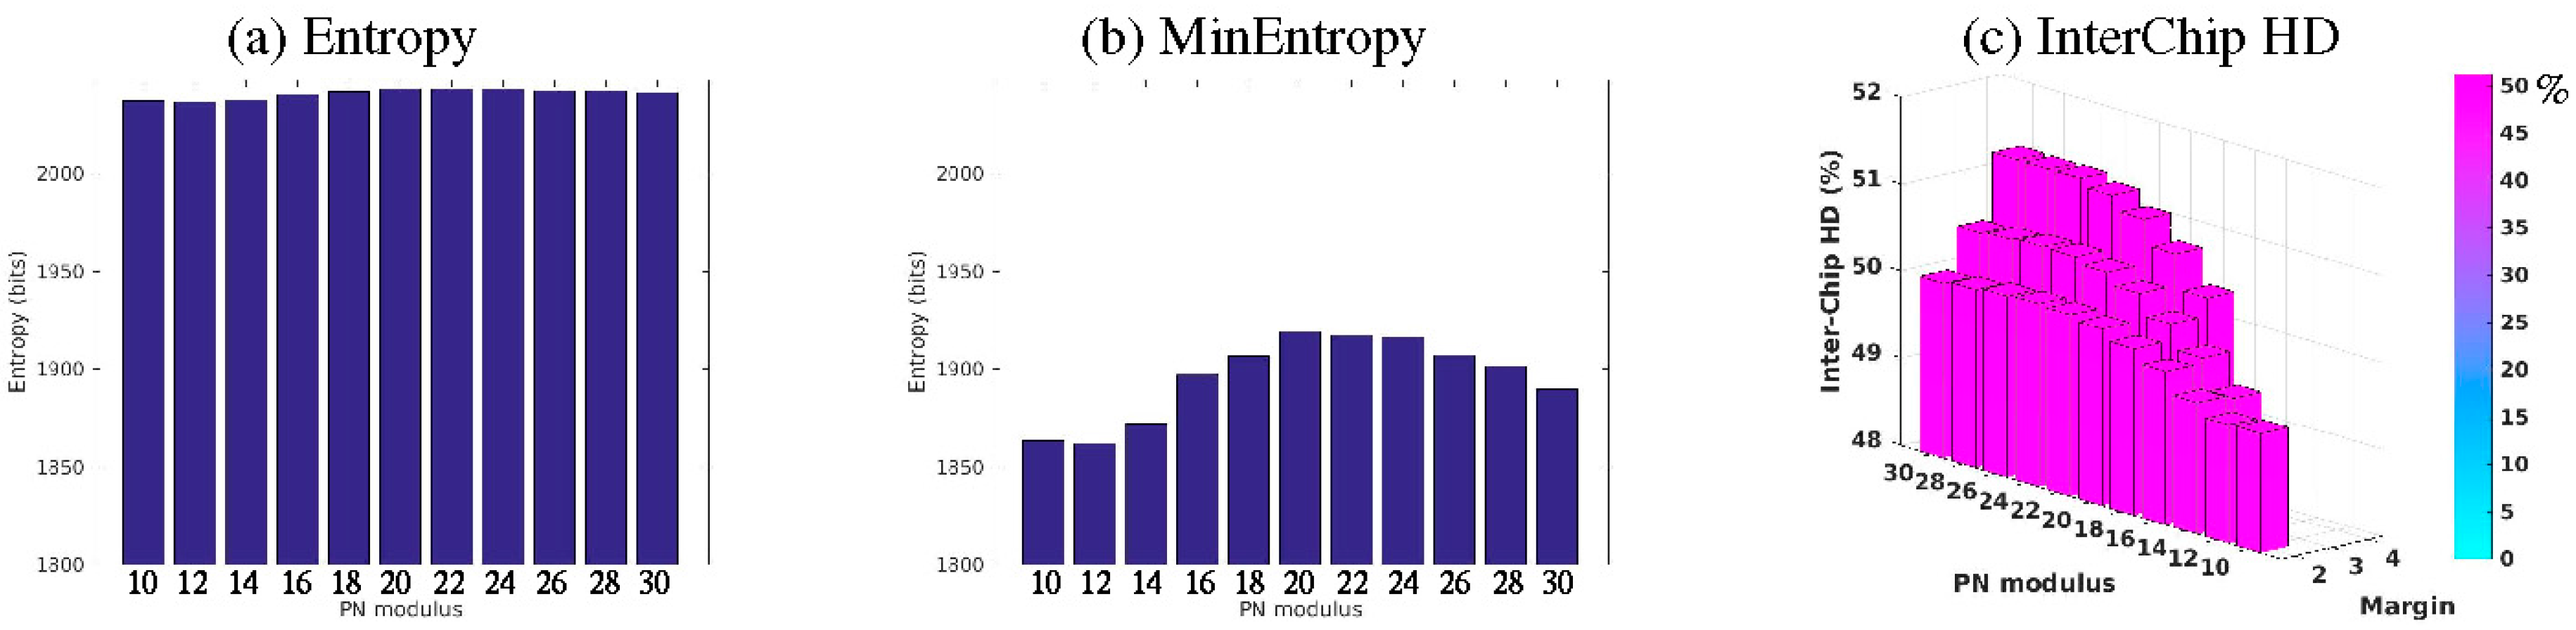
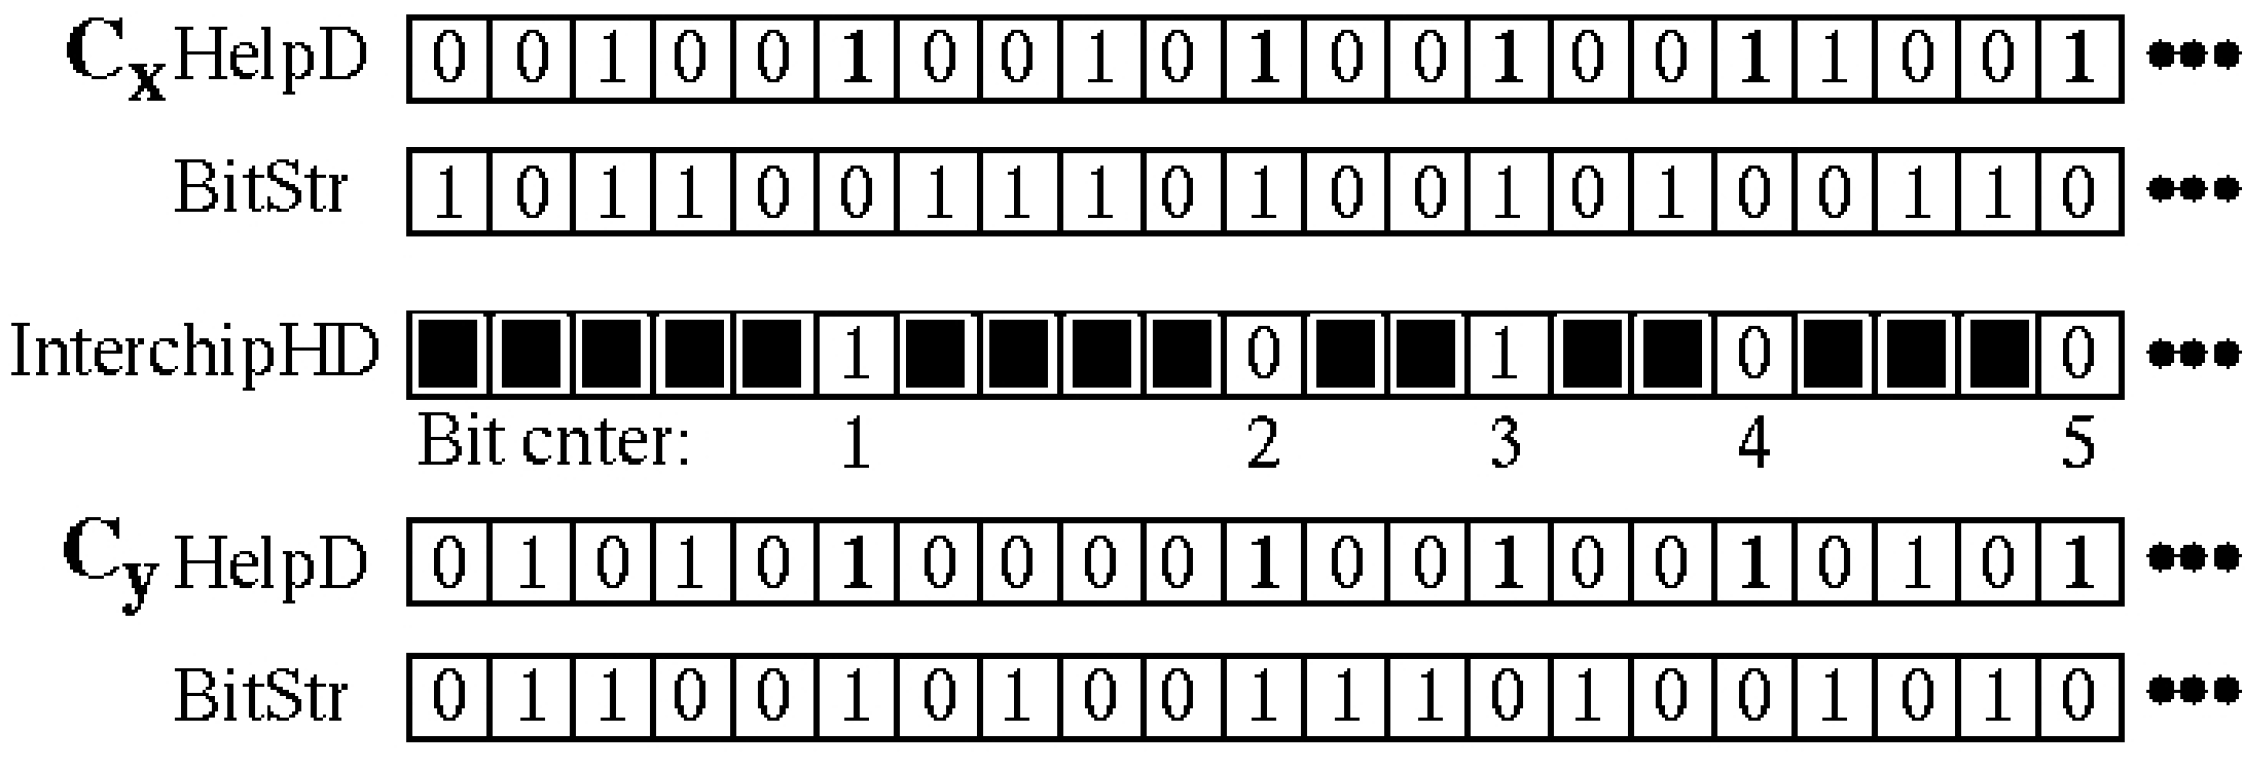
- A statistical evaluation of Entropy, MinEntropy, conditional MinEntropy, Interchip hamming distance and NIST statistical test results on hardware generated bitstrings.
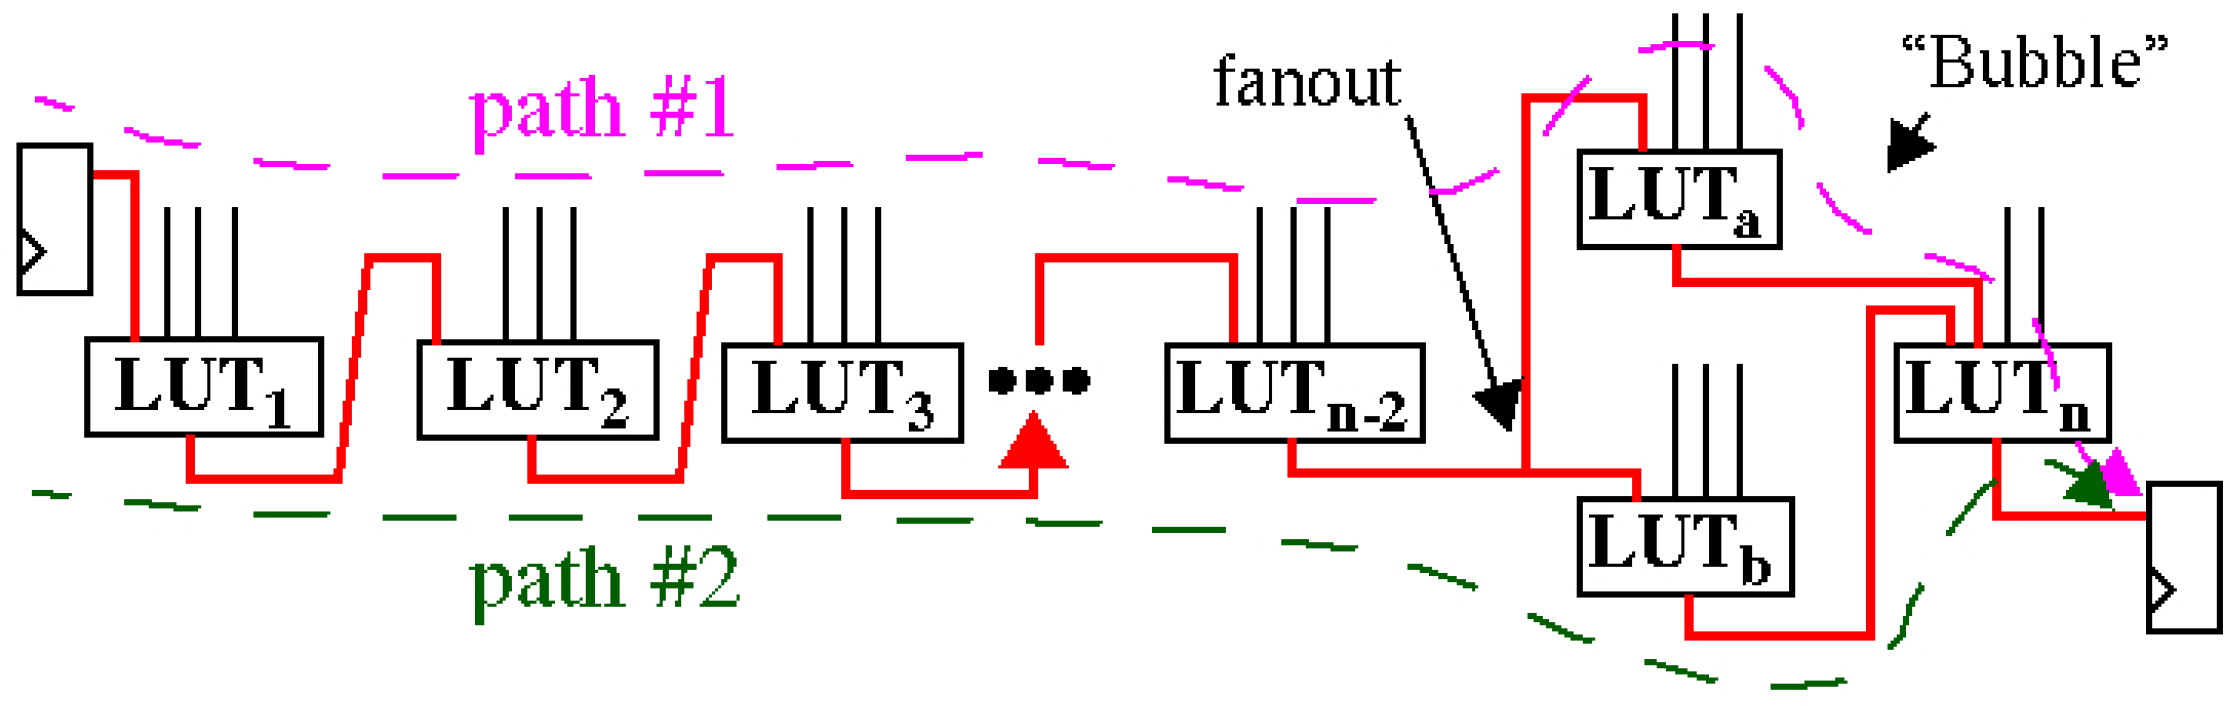
- A special worst-case analysis that maximizes correlations and dependencies introduced by (1) full path reuse and (2) partial path reuse where the same paths in different combinations or paths with many common segments are used to generate distinct bits.
2. Related Work
3. HELP Overview
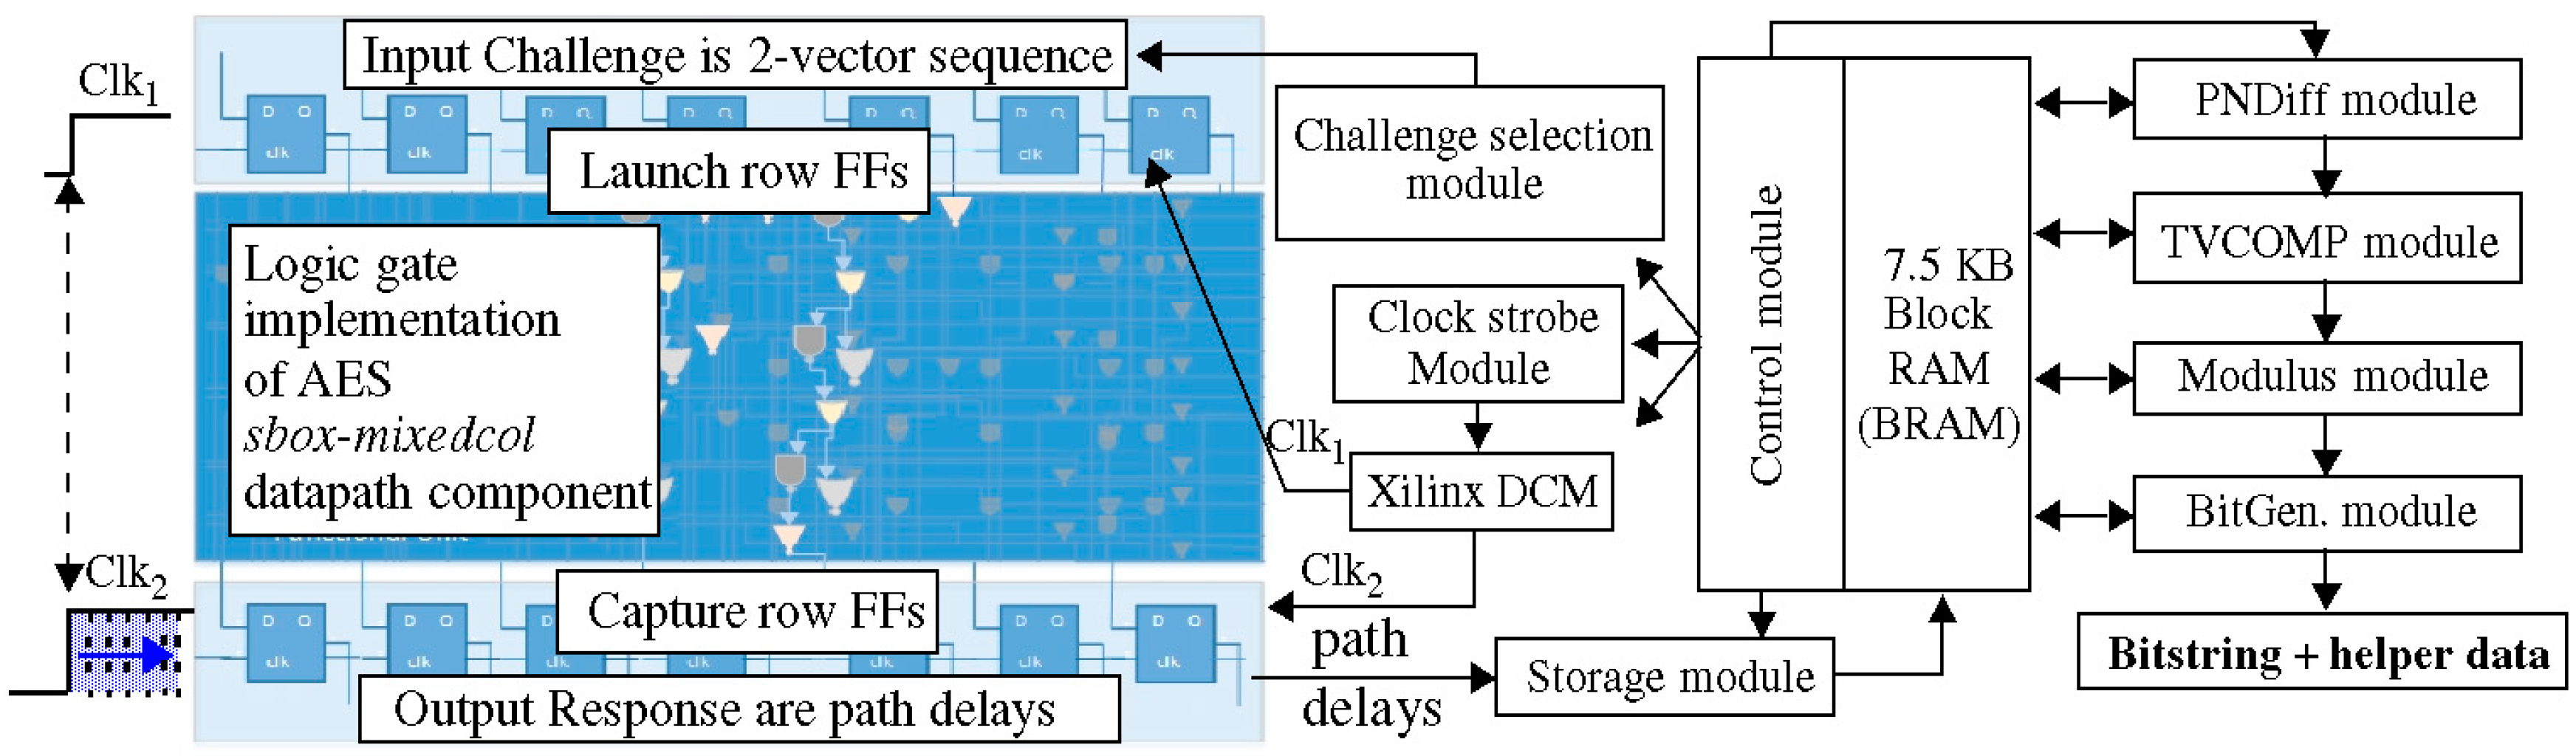
3.1. Implementation Details
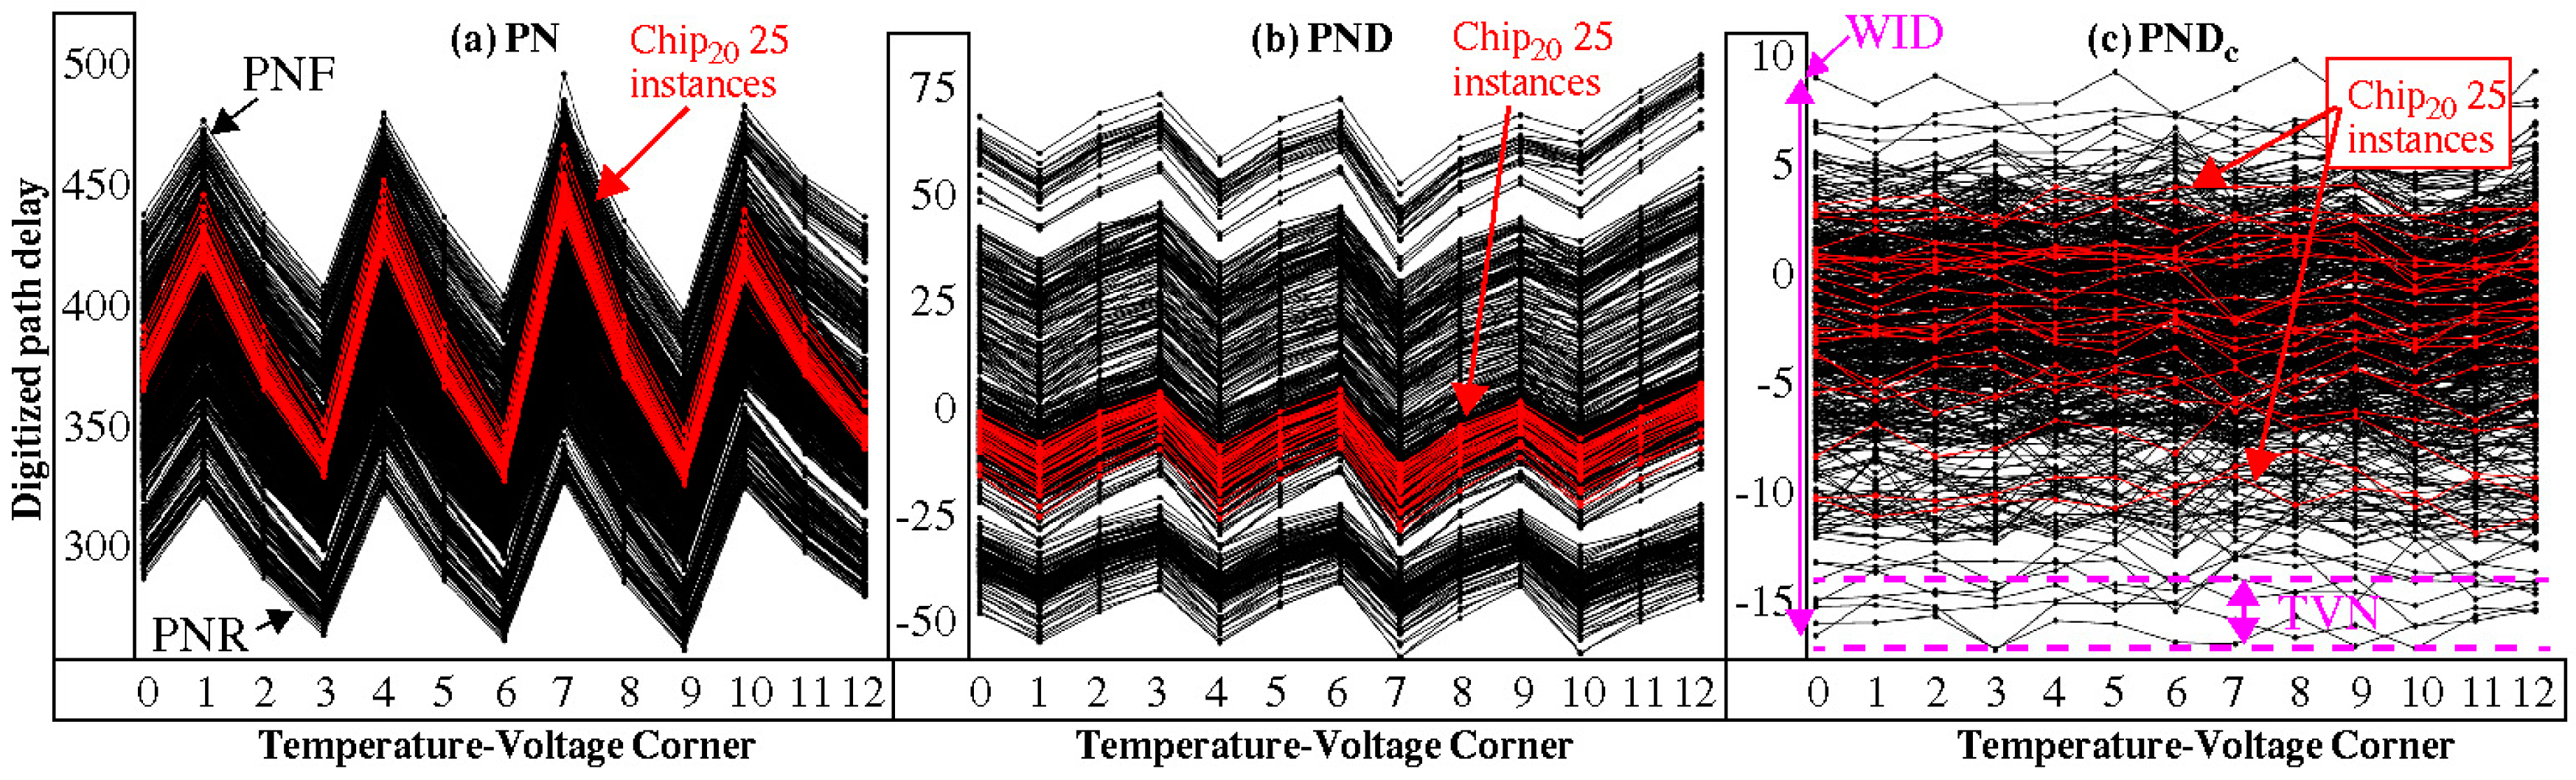
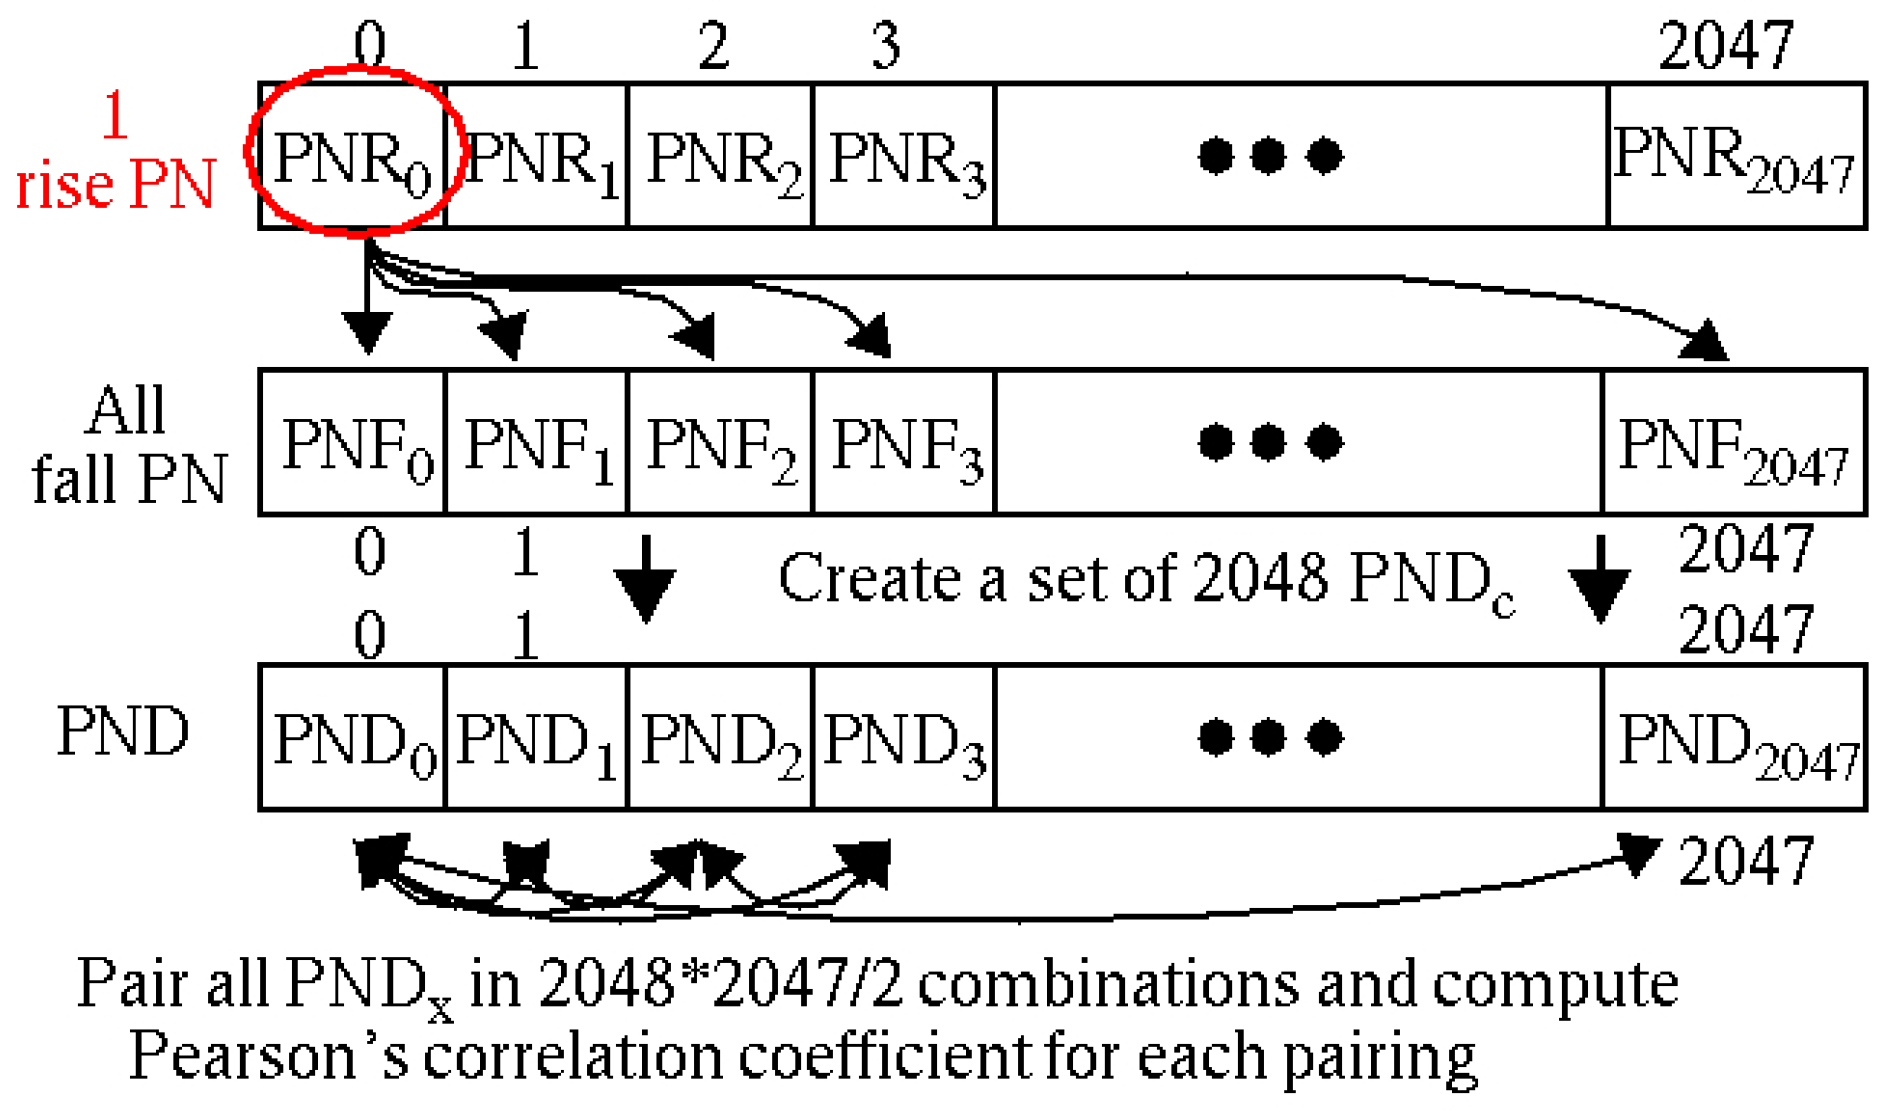
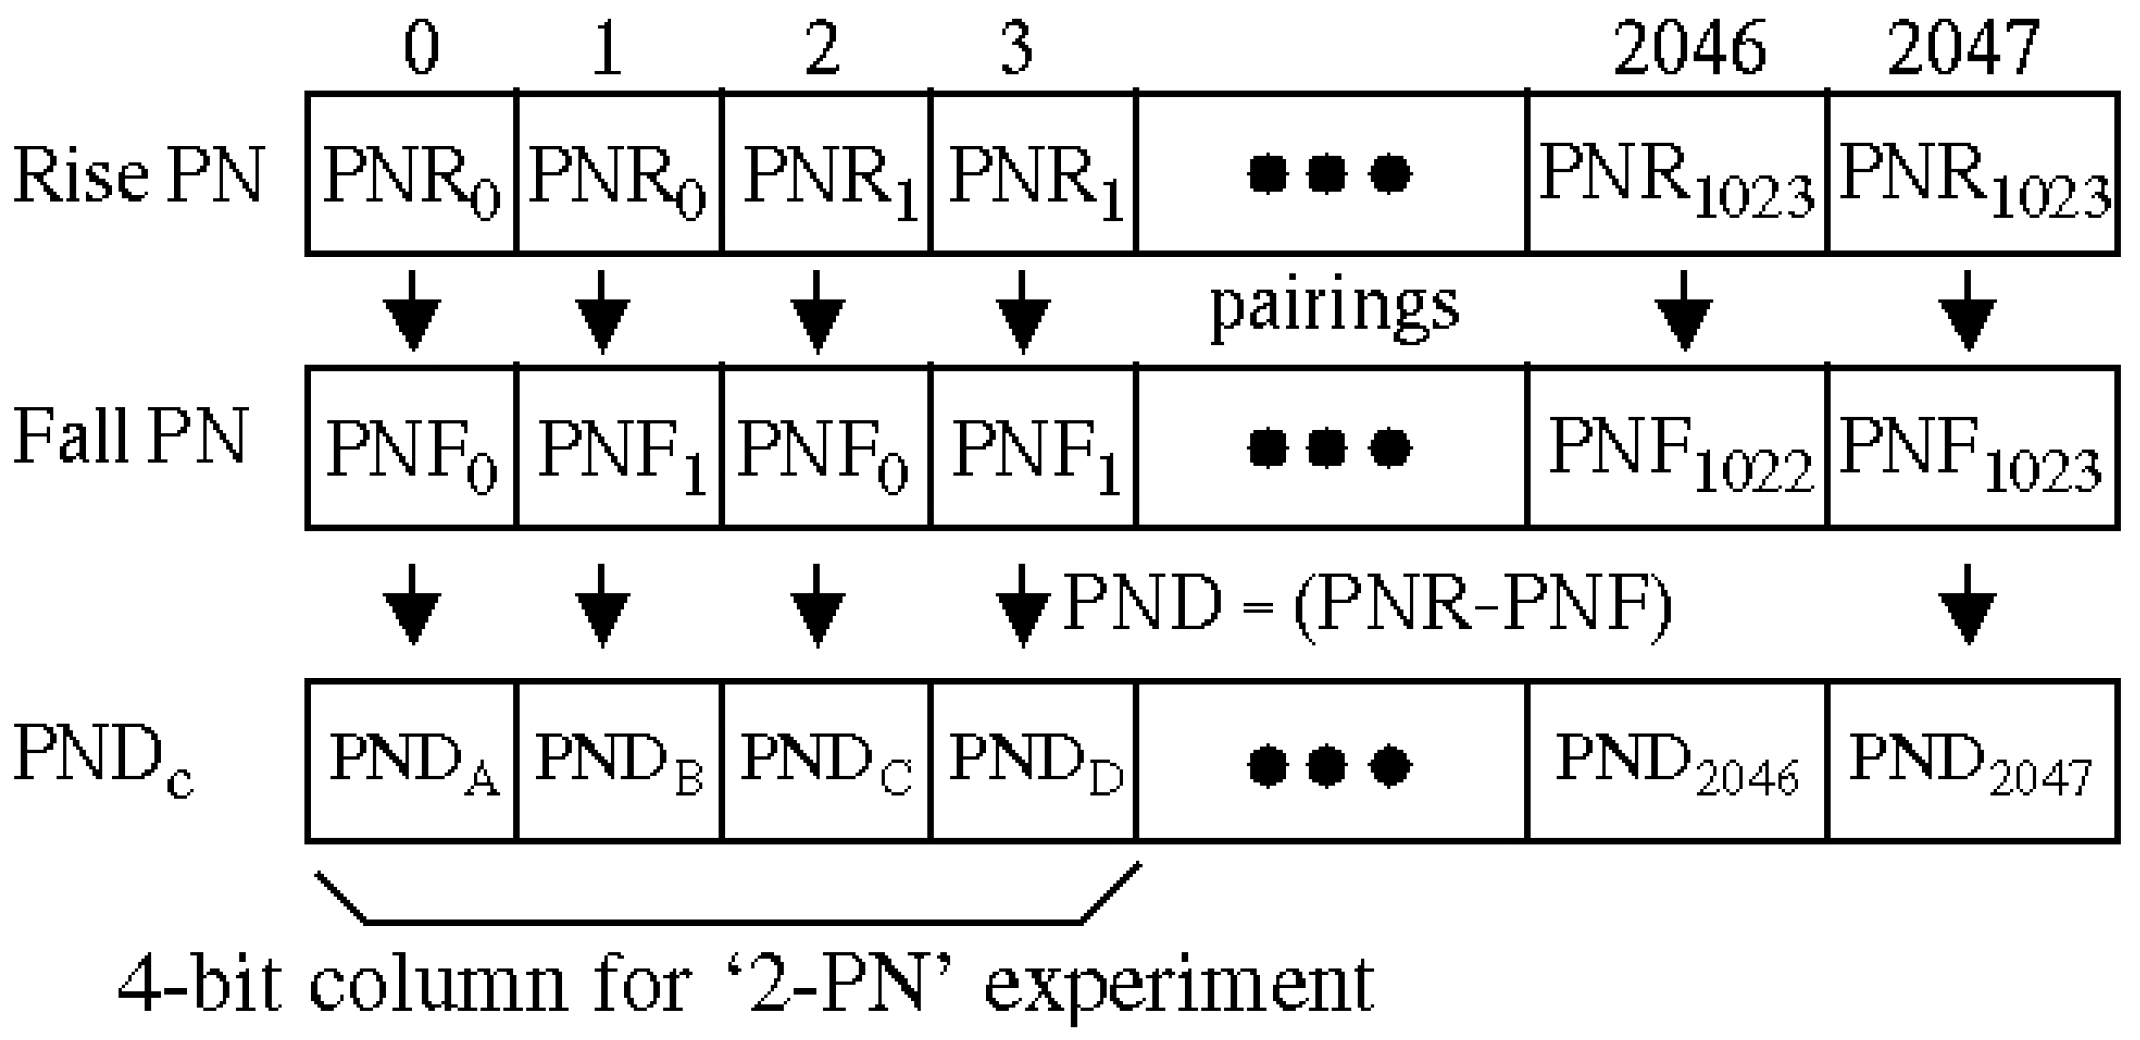
3.2. PN, PND and PNDc Processing Steps
3.3. Offset Method
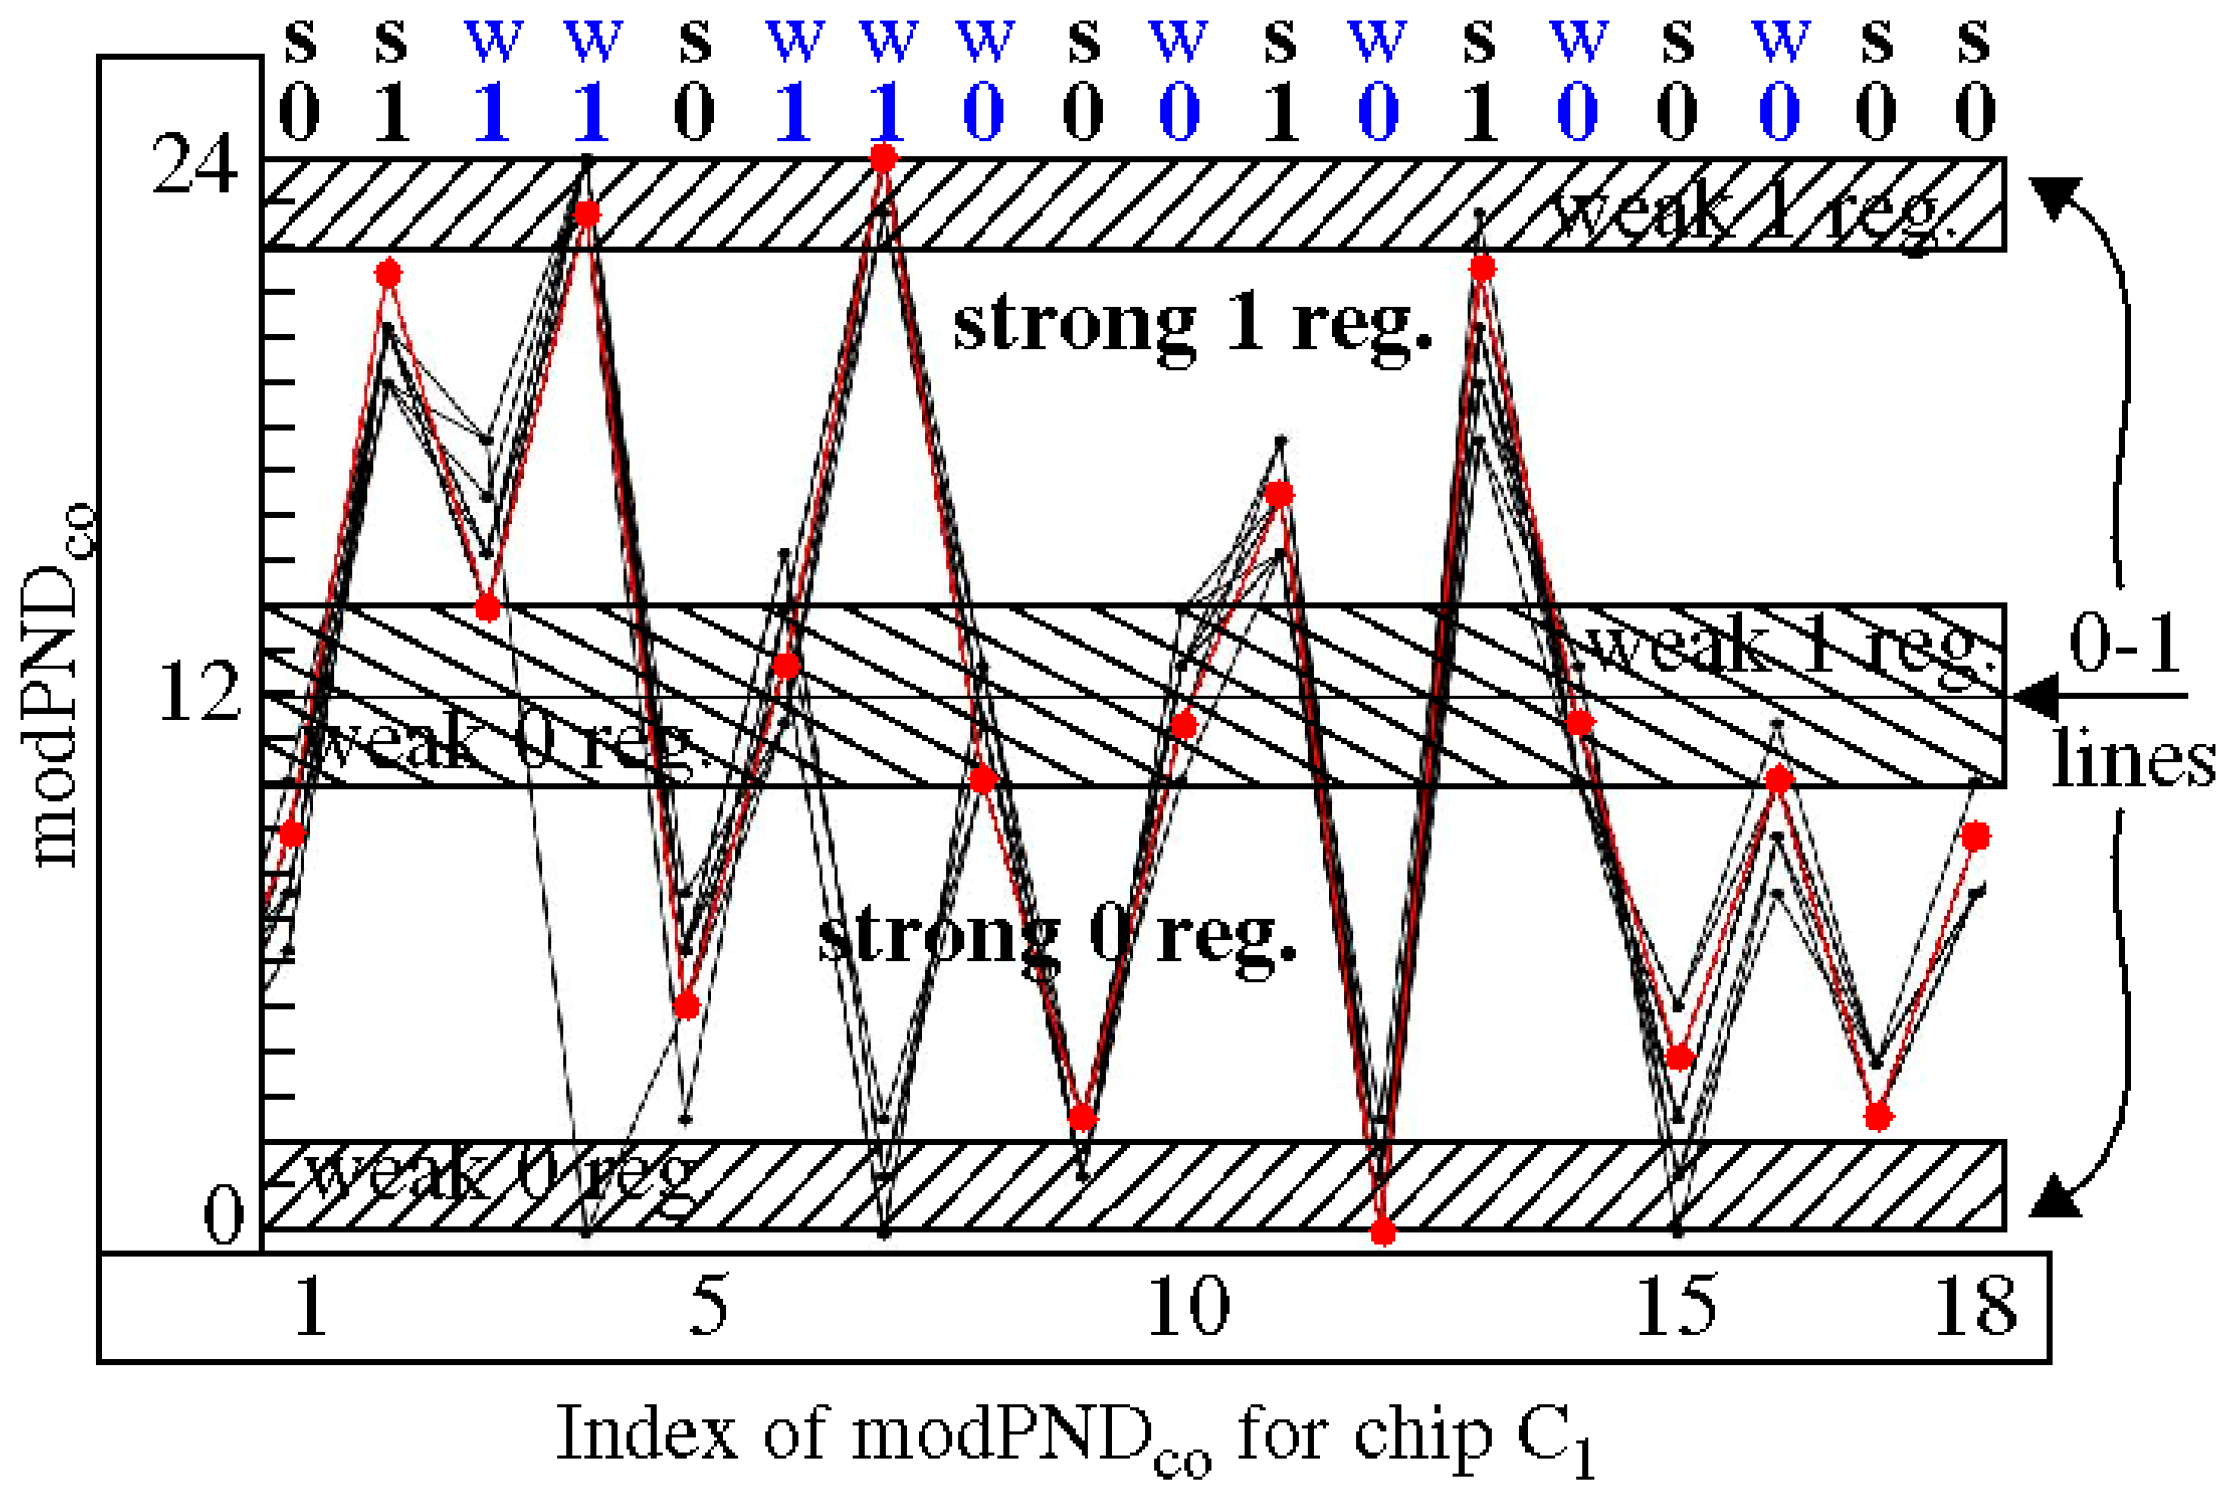
3.4. Margining
4. Statistical Results
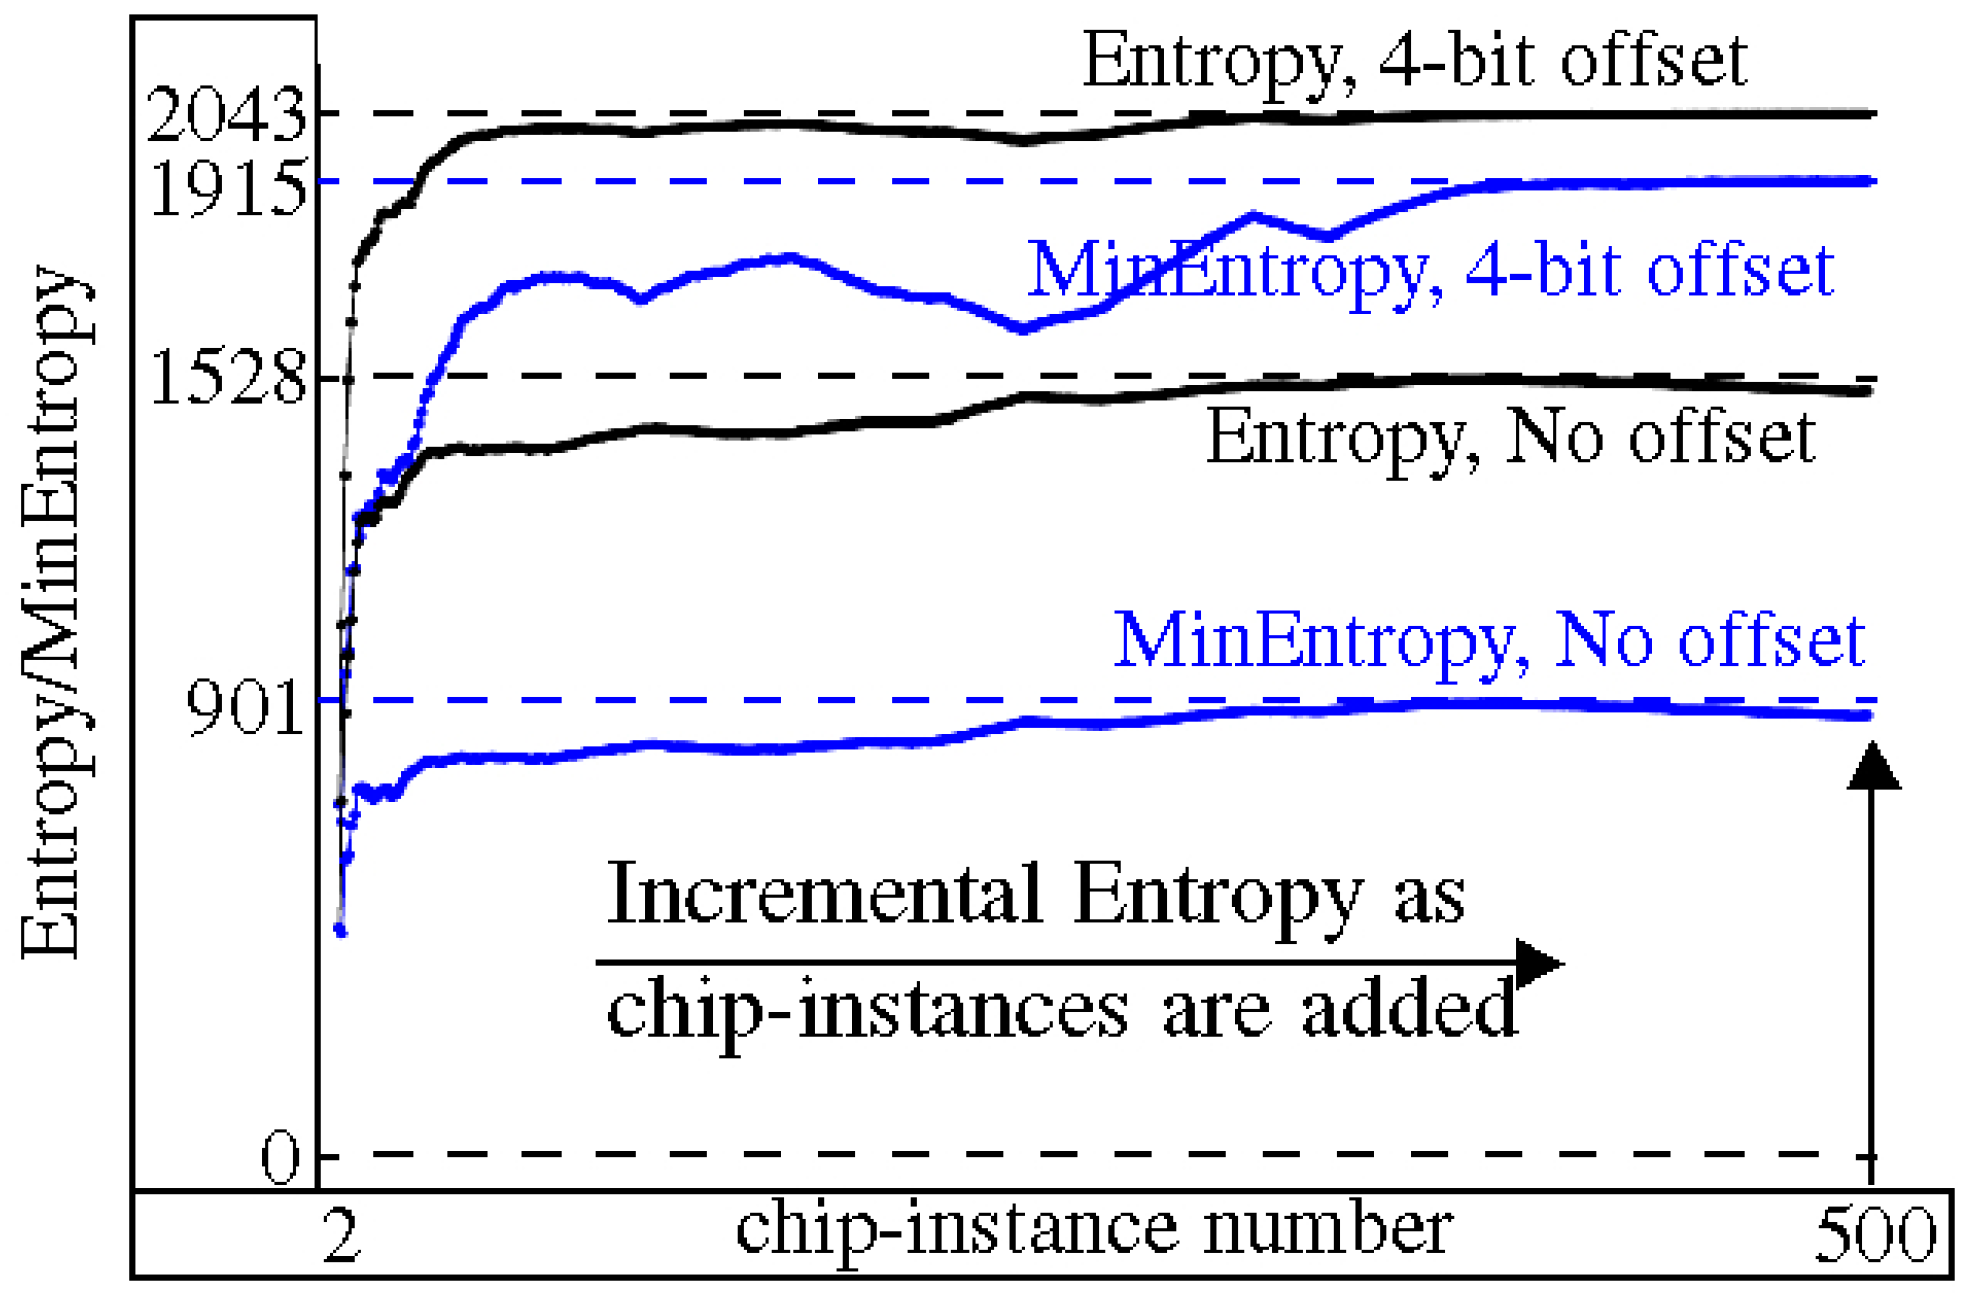
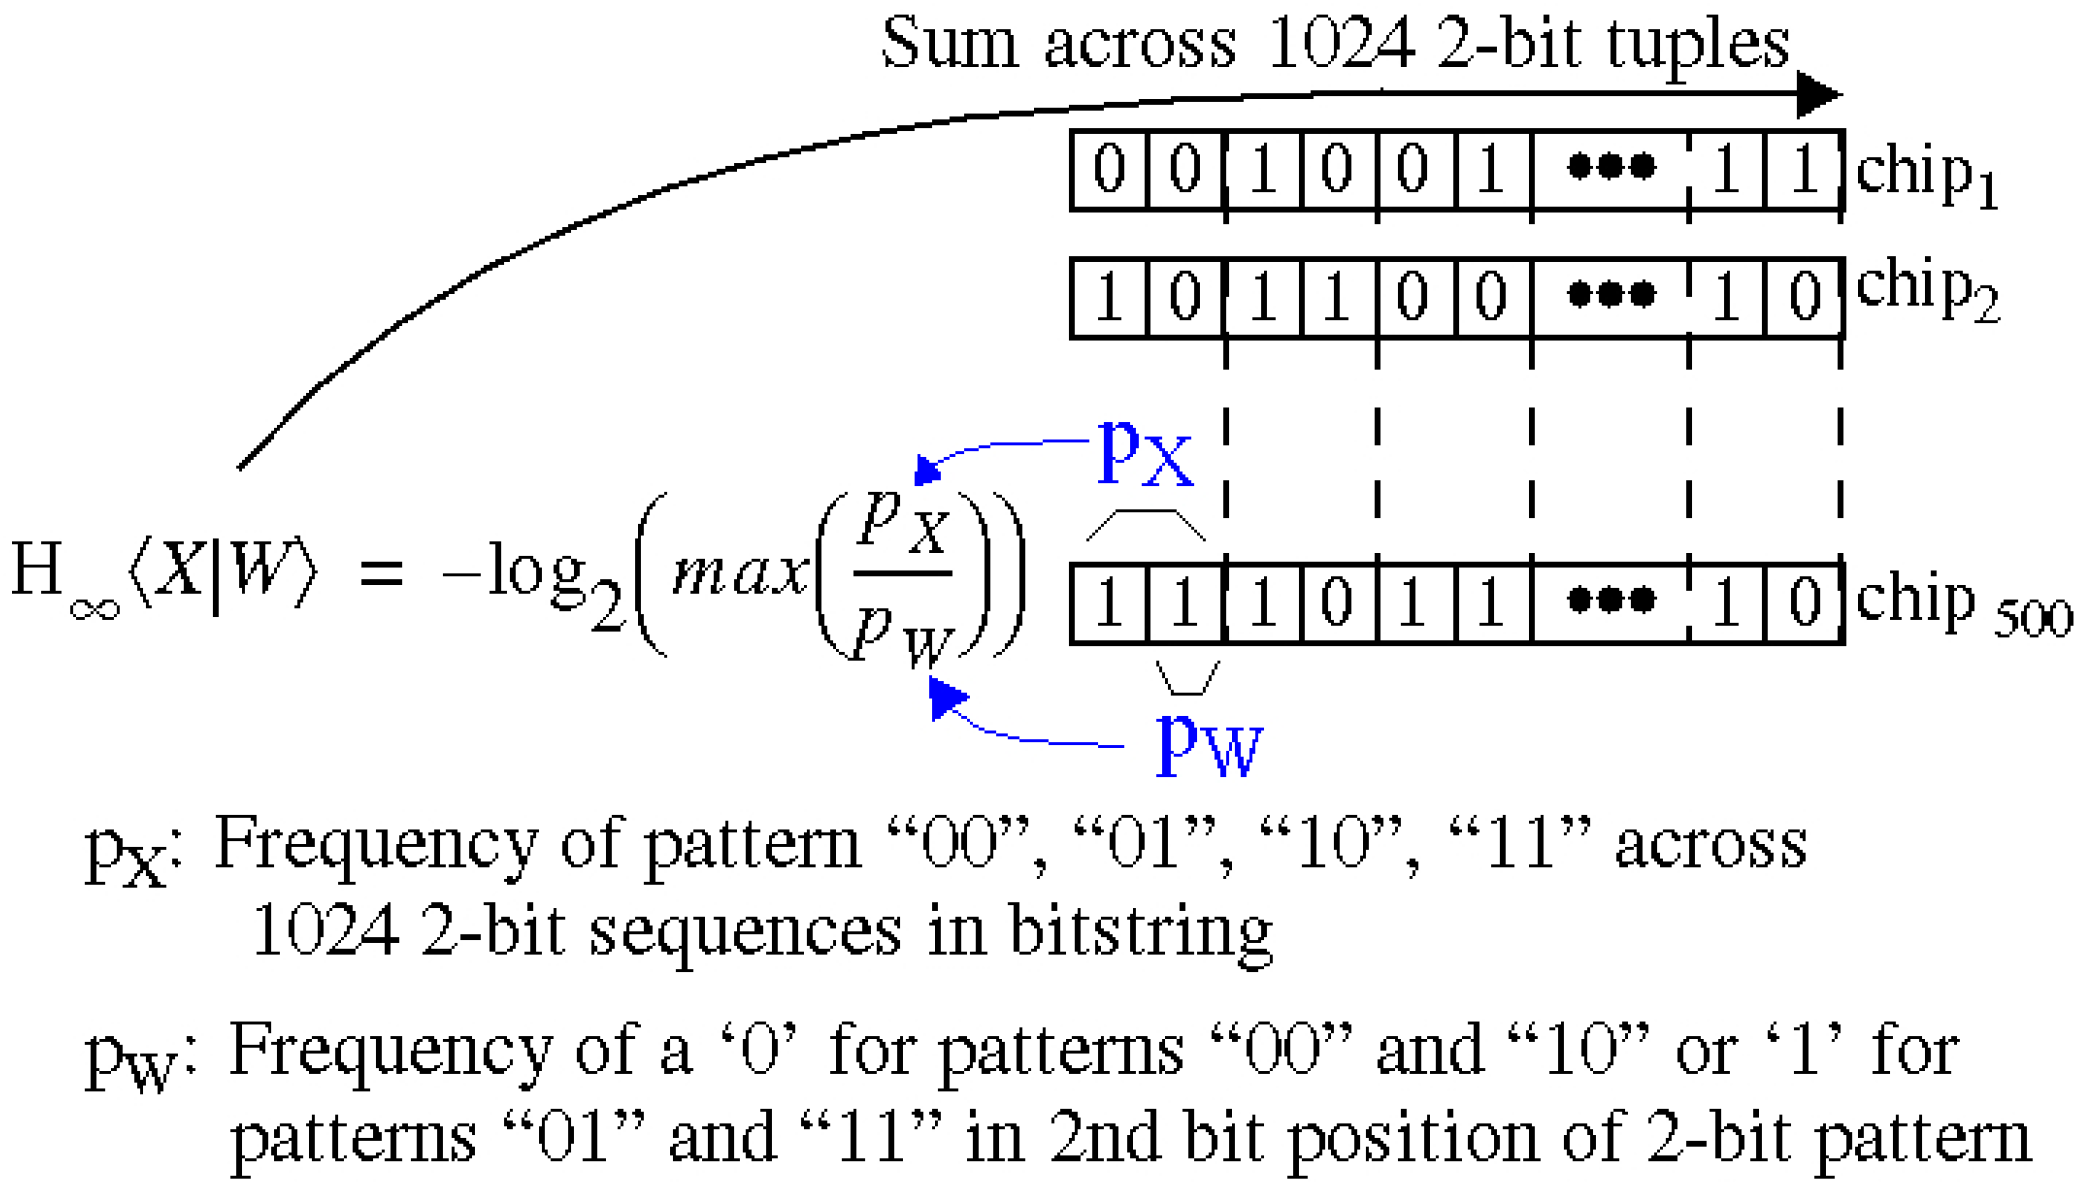
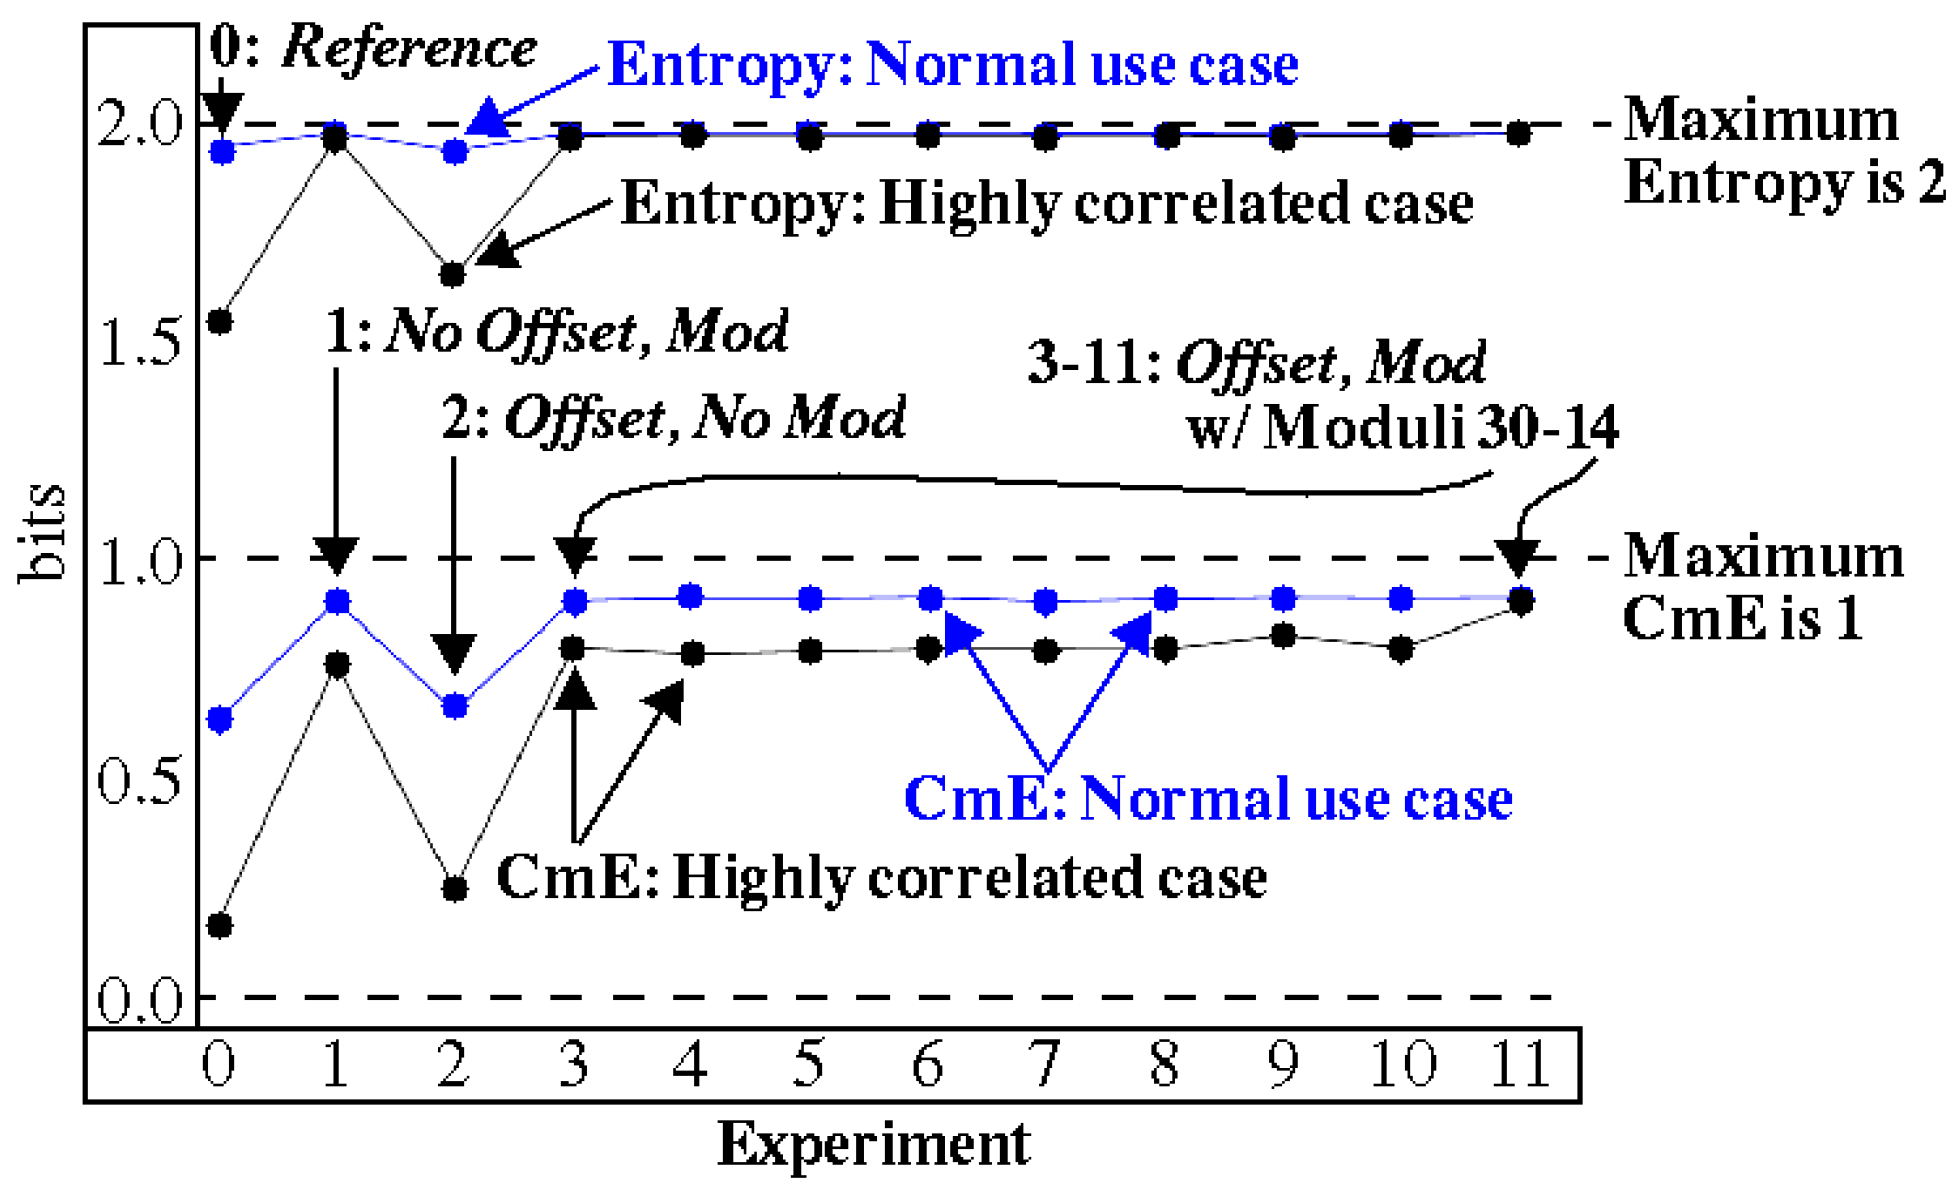
4.1. Entropy Analysis
4.2. Uniqueness
4.3. NIST Test Evaluation
5. Correlation Analysis
5.1. Preliminaries
5.2. Partial Reuse
5.3. Full Reuse
6. Conclusions
Author Contributions
Conflicts of Interest
References
- Che, W.; Martin, M.; Pocklassery, G.; Kajuluri, V.K.; Saqib, F.; Plusquellic, J. A Privacy-Preserving, Mutual PUF-Based Authentication Protocol. Cryptography 2017, 1, 3. [Google Scholar] [CrossRef]
- Gassend, B.; Clarke, D.; van Dijk, M.; Devadas, S. Controlled Physical Random Functions. In Proceedings of the Conference on Computer Security Applications, Washington, DC, USA, 9–13 December 2002. [Google Scholar]
- Gassend, B.; Clarke, D.E.; van Dijk, M.; Devadas, S. Silicon Physical Unknown Functions. In Proceedings of the Conference on Computer and Communications Security, Washington, DC, USA, 18–22 November 2002; pp. 148–160. [Google Scholar]
- Lofstrom, K.; Daasch, W.R.; Taylor, D. Identification Circuits using Device Mismatch. In Proceedings of the International Solid State Circuits Conference, Piscataway, NJ, USA, 31 May 2000; pp. 372–373. [Google Scholar]
- Maiti, A.; Schaumont, P. Improving the quality of a Physical Unclonable Function using Configurable Ring Oscillators. In Proceedings of the 2009 International Conference on Field Programmable Logic and Applications, Prague, Czech Republic, 31 August–2 September 2009. [Google Scholar]
- Meng-Day, Y.; Sowell, R.; Singh, A.; M’Raihi, D.; Devadas, S. Performance Metrics and Empirical Results of a PUF Cryptographic Key Generation ASIC. In Proceedings of the 2012 IEEE International Symposium on Hardware-Oriented Security and Trust (HOST), San Francisco, CA, USA, 3–4 June 2012. [Google Scholar]
- Simpson, E.; Schaumont, P. Offline Hardware/Software Authentication for Reconfigurable Platforms. Cryptogr. Hardw. Embed. Syst. 2006, 4249, 10–13. [Google Scholar]
- Habib, B.; Gaj, K.; Kaps, J.-P. FPGA PUF Based on Programmable LUT Delays. In Proceedings of the Euromicro Conference on Digital System Design, Santander, Spain, 4–6 September 2013; pp. 697–704. [Google Scholar]
- Guajardo, J.; Kumar, S.S.; Schrijen, G.; Tuyls, P. Brand and IP Protection with Physical Unclonable Functions. In Proceedings of the Symposium on Circuits and Systems, Seattle, WA, USA, 18–21 May 2008; pp. 3186–3189. [Google Scholar]
- Alkabani, Y.; Koushanfar, F.; Kiyavash, N.; Potkonjak, M. Trusted Integrated Circuits: A Nondestructive Hidden Characteristics Extraction Approach. In Proceedings of the 10th International WorkshopInformation Hiding, Santa Barbara, CA, USA, 19–21 May 2008. [Google Scholar]
- Helinski, R.; Acharyya, D.; Plusquellic, J. Physical Unclonable Function Defined Using Power Distribution System Equivalent Resistance Variations. In Proceedings of the Design Automation Conference, San Francisco, CA, USA, 26–31 July 2009; pp. 676–681. [Google Scholar]
- Chakraborty, R.; Lamech, C.; Acharyya, D.; Plusquellic, J. A Transmission Gate Physical Unclonable Function and On-Chip Voltage-to-Digital Conversion Technique. In Proceedings of the Design Automation Conference, Austin, TX, USA, 29 May–7 June 2013; pp. 1–10. [Google Scholar]
- Aarestad, J.; Plusquellic, J.; Acharyya, D. Error-Tolerant Bit Generation Techniques for Use with a Hardware-Embedded Path Delay PUF. In Proceedings of the Symposium on Hardware-Oriented Security and Trust (HOST), Austin, TX, USA, 2–3 June 2013; pp. 151–158. [Google Scholar]
- Saqib, F.; Areno, M.; Aarestad, J.; Plusquellic, J. An ASIC Implementation of a Hardware-Embedded Physical Unclonable Function. IET Comput. Digit. Tech. 2014, 8, 288–299. [Google Scholar] [CrossRef]
- Che, W.; Saqib, F.; Plusquellic, J. PUF-Based Authentication. In Proceedings of the 2015 IEEE/ACM International Conference on ICCAD, Austin, TX, USA, 2–6 November 2015. [Google Scholar]
- Rose, G.S.; McDonald, N.; Lok-Kwong, Y.; Wysocki, B.; Xu, K. Foundations of Memristor Based PUF Architectures. In Proceedings of the International Symposium on Nanoscale Architectures, Brooklyn, NY, USA, 15–17 July 2013; pp. 52–57. [Google Scholar]
- Yu, Z.; Krishna, A.R.; Bhunia, S. ScanPUF: Robust Ultralow-Overhead PUF using Scan Chain. In Proceedings of the Asia and South Pacific Design Automation Conference, Yokohama, Japan, 22–25 January 2013; pp. 626–631. [Google Scholar]
- Konigsmark, S.T.C.; Hwang, L.K.; Deming, C.; Wong, M.D.F. CNPUF: A Carbon Nanotubebased Physically Unclonable Function for Secure Low-Energy Hardware Design. In Proceedings of the Asia and South Pacific Design Automation Conference, Singapore, 20–23 January 2014; pp. 73–78. [Google Scholar]
- Majzoobi, M.; Koushanfar, F.; Devadas, S. FPGA PUF using Programmable Delay Lines. In Proceedings of the Workshop on Information Forensics and Security, Seattle, WA, USA, 12–15 December 2010; pp. 1–6. [Google Scholar]
- Hori, Y.; Yoshida, T.; Katashita, T. Satoh Quantitative and Statistical Performance Evaluation of Arbiter Physical Unclonable Functions on FPGAs. In Proceedings of the Conference on Reconfigurable Computing and FPGAs, Cancun, Mexico, 13–15 December 2010; pp. 298–303. [Google Scholar]
- Gassend, B.; Lim, D.; Clarke, D.; van Dijk, M.; Devadas, S. Identification and Authentication of Integrated Circuits. Concurr. Comput. Pract. Exp. 2014, 16, 1077–1098. [Google Scholar] [CrossRef]
- Xin, X.; Kaps, J.; Gaj, K. A Configurable Ring-Oscillator-Based PUF for Xilinx FPGAs. In Proceedings of the Conference on Digital System Design, Oulu, Finland, 31 August–2 September 2011; pp. 651–657. [Google Scholar]
- Suh, E.; Devadas, S. Physical Unclonable Functions for Device Authentication and Secret Key Generation. In Proceedings of the Design Automation Conference, San Diego, CA, USA, 4–8 June 2007; pp. 9–14. [Google Scholar]
- Maiti, A.; Inyoung, K.; Schaumont, P. A Robust Physical Unclonable Function with Enhanced Challenge-Response Set. Trans. Inf. Forensics Secur. 2012, 7, 333–345. [Google Scholar] [CrossRef]
- Chi, E.; Yin, D.; Qu, G. LISA: Maximizing RO PUF’s Secret Extraction. In Proceedings of the 2010 IEEE International Symposium on Hardware-Oriented Security and Trust (HOST), Anaheim, CA, USA, 13–14 June 2010. [Google Scholar]
- Chi, E.; Yin, D.; Qu, G. Improving PUF Security with Regression-based Distiller. In Proceedings of the Design Automation Conference, Austin, TX, USA, 29 May–7 June 2013. [Google Scholar]
- Delvaux, J.; Gu, D.; Schellekens, D.; Verbauwhede, I. Helper Data Algorithms for PUF-based key generation: Overview and analysis. Trans. Comput. Aided Des. Integr. Circuits Syst. 2015, 34, 889–902. [Google Scholar] [CrossRef]
- Bosch, C.; Guajardo, J.; Sadeghi, A.-R.; Shokrollahi, J.; Tuyls, P. Efficient Helper Data Key Extractor on FPGAs. Workshop Cryptogr. Hardw. Embed. Syst. 2008, 5154, 181–197. [Google Scholar]
- Koeberl, P.; Li, J.; Rajan, A.; Wu, W. Entropy Loss in PUF-based Key Generation Schemes: The Repetition Code Pitfall. In Proceedings of the Symposium on Hardware-Oriented Security and Trust, Arlington, VA, USA, 6–7 May 2014; pp. 44–49. [Google Scholar]
- Dodis, Y.; Ostrovsky, R.; Reyzin, L.; Smith, A. Fuzzy Extractors: How to Generate Strong Keys from Biometrics and Other Noisy Data. SIAM J. Comput. 2008, 38, 97–139. [Google Scholar] [CrossRef]
- Katzenbeisser, S.; Kocabas, Ü.; Rozic, V.; Sadeghi, A.-R.; Verbauwhede, I.; Wachsmann, C. PUFs: Myth, Fact or Busted? A Security Evaluation of Physically Unclonable Functions (PUFs) Cast in Silicon. In Proceedings of the 14th international conference on Cryptographic Hardware and Embedded System, Leuven, Belgium, 9–12 September 2012. [Google Scholar]
- Tiri, K.; Verbauwhede, I. A Logic Level Design Methodology for a Secure DPA Resistant ASIC or FPGA Implementation. In Proceedings of the Design, Automation and Test in Europe Conference and Exhibition, Paris, France, 16–20 February 2004; pp. 246–251. [Google Scholar]
- Claes, M.; van der Leest, V.; Braeken, A. Comparison of SRAM and FF PUF in 65 nm Technology. In Proceedings of the Nordic Conference on Secure IT Systems, Karlskrona, Sweden, 31 October–2 November 2011; pp. 47–64. [Google Scholar]
- National Institute of Standards and Technology. Available online: http://csrc.nist.gov/groups/ST/toolkit/rng/documentation_software.html (accessed on 1 January 2017).
- Pearson Correlation Coefficient, Wikipedia. Available online: https://en.wikipedia.org/wiki/Pearson_correlation_coefficient (accessed on 1 January 2017).


| Cases | Scenarios | |||
|---|---|---|---|---|
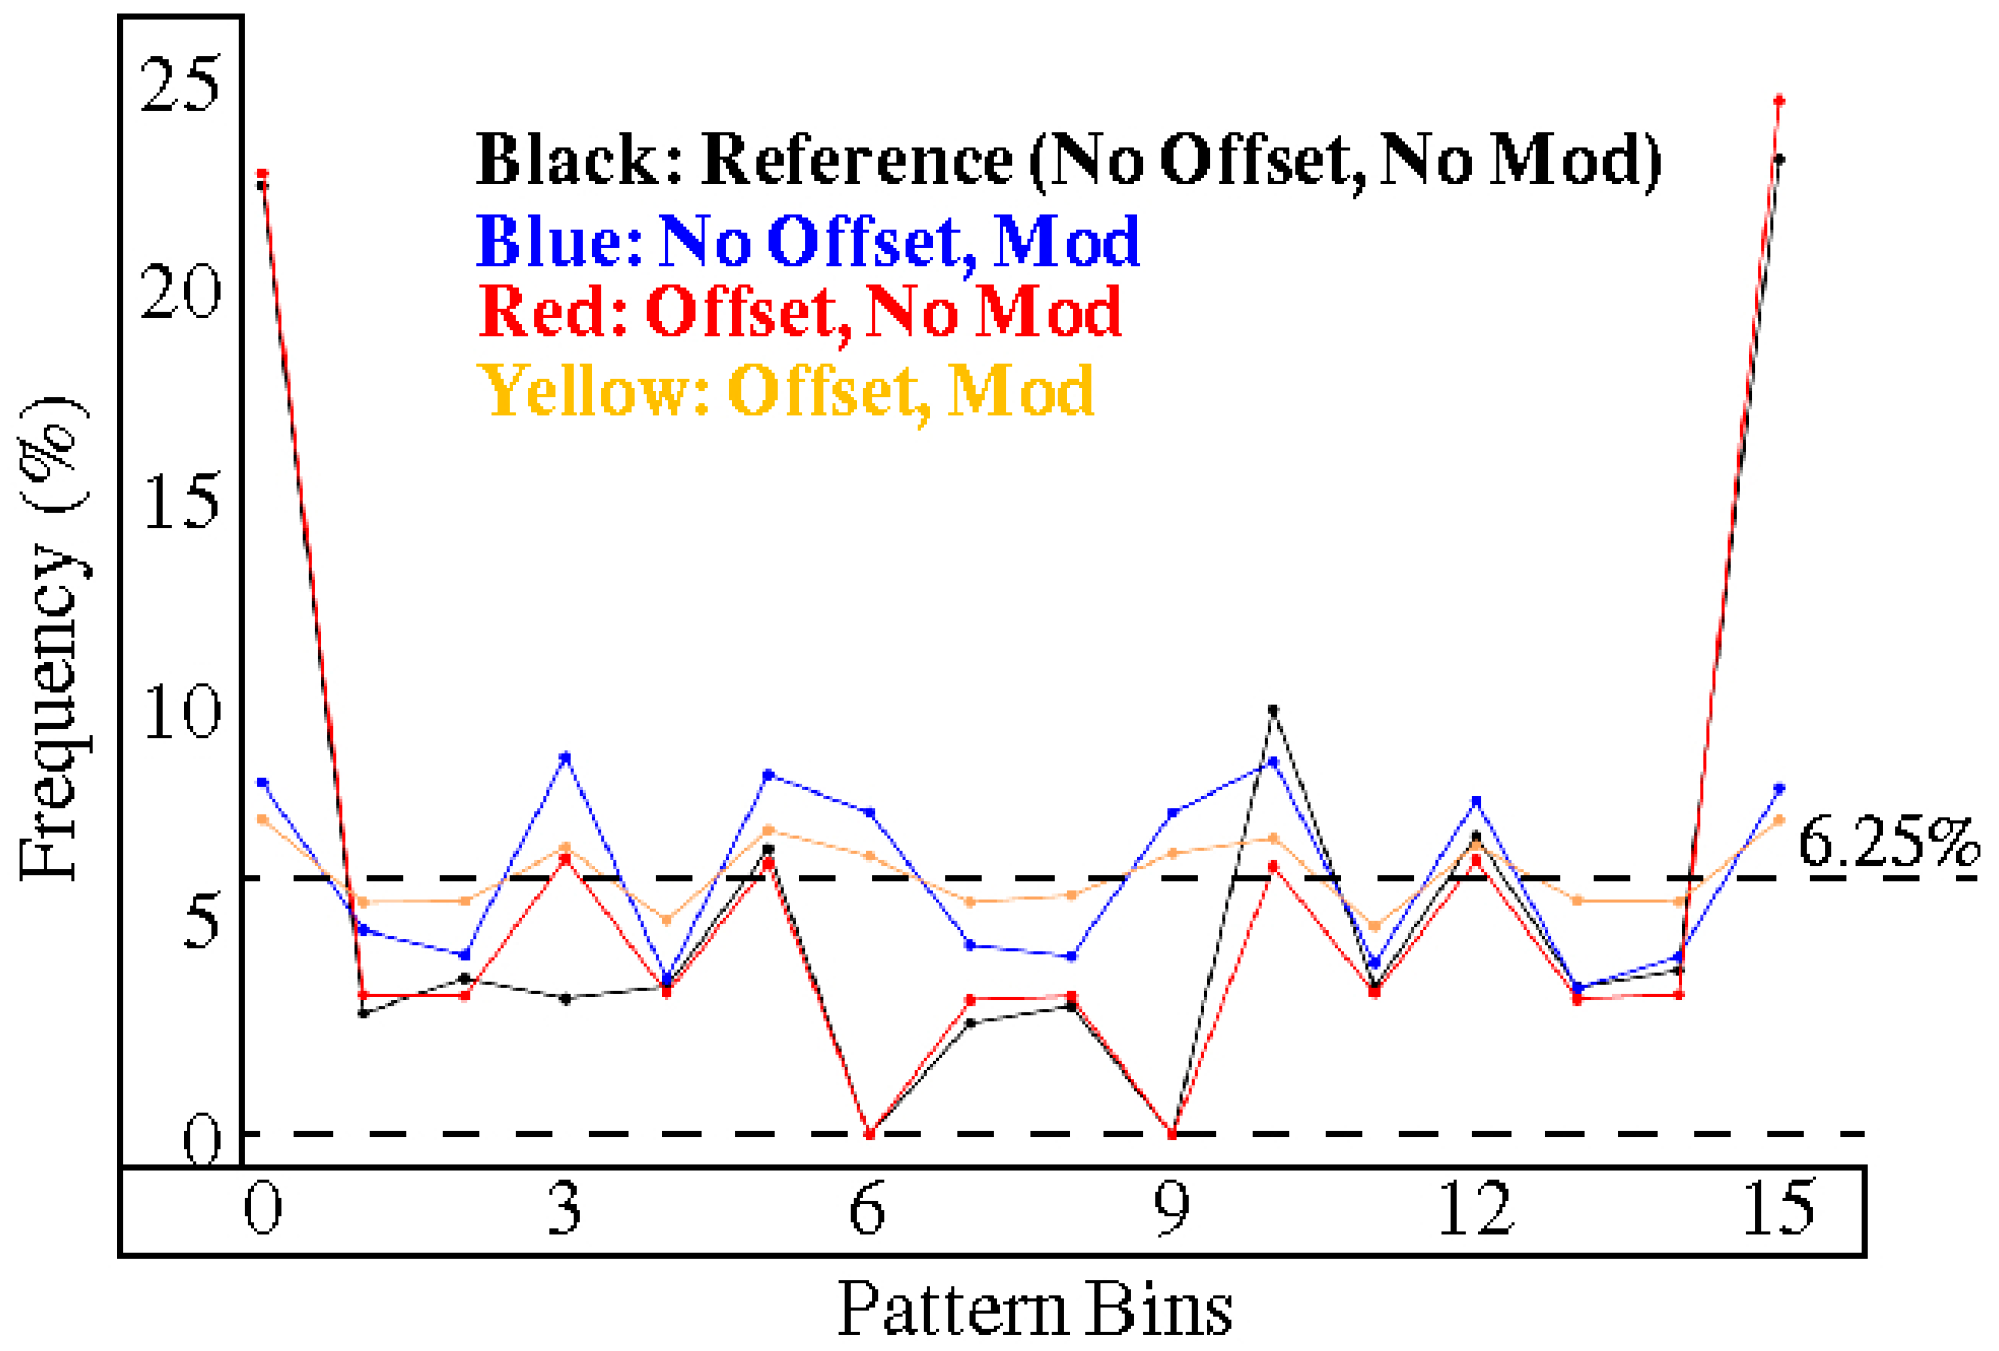
| Highly Correlated | No Offset No Modulus (Reference) | No Offset Modulus | Offset No Modulus | Offset Modulus (HELP) |
| Normal use | ||||
| Scenarios | 2-PN | Normal | 3-PN | Normal | 4-PN | Normal |
|---|---|---|---|---|---|---|
| No Offset, No Mod | 2.11 of 4 | 3.05 of 4 | 3.17 of 9 | 6.15 of 9 | 4.3 of 16 | 7.0 of 16 |
| No Offset, Mod | 3.92 of 4 | 3.81 of 4 | 6.10 of 9 | 7.89 of 9 | 8.3 of 16 | 10.2 of 16 |
| Offset, No Mod | 2.02 of 4 | 2.82 of 4 | 3.05 of 9 | 5.34 of 9 | 4.1 of 16 | 8.5 of 16 |
| Offset, Mod | 3.73 of 4 | 3.92 of 4 | 6.95 of 9 | 8.40 of 9 | 9.2 of 16 | 11.1 of 16 |
© 2017 by the authors. Licensee MDPI, Basel, Switzerland. This article is an open access article distributed under the terms and conditions of the Creative Commons Attribution (CC BY) license (http://creativecommons.org/licenses/by/4.0/).
Share and Cite
Che, W.; Kajuluri, V.K.; Martin, M.; Saqib, F.; Plusquellic, J. Analysis of Entropy in a Hardware-Embedded Delay PUF. Cryptography 2017, 1, 8. https://doi.org/10.3390/cryptography1010008
Che W, Kajuluri VK, Martin M, Saqib F, Plusquellic J. Analysis of Entropy in a Hardware-Embedded Delay PUF. Cryptography. 2017; 1(1):8. https://doi.org/10.3390/cryptography1010008
Chicago/Turabian StyleChe, Wenjie, Venkata K. Kajuluri, Mitchell Martin, Fareena Saqib, and Jim Plusquellic. 2017. "Analysis of Entropy in a Hardware-Embedded Delay PUF" Cryptography 1, no. 1: 8. https://doi.org/10.3390/cryptography1010008
APA StyleChe, W., Kajuluri, V. K., Martin, M., Saqib, F., & Plusquellic, J. (2017). Analysis of Entropy in a Hardware-Embedded Delay PUF. Cryptography, 1(1), 8. https://doi.org/10.3390/cryptography1010008