
Inhibitory Effect of Prickly Ash (Zanthoxylum bungeanum) Seed Kernel Oil on Lipid Metabolism of Grass Carp (Ctenopharyngodon idellus) in High-Fat Diet
Abstract
:1. Introduction
2. Materials and Methods
2.1. Experimental Diets
2.2. Fish and Feeding Management
2.3. Sample Collection
Specific growth rate (SGR, %/d) =100 × [ln final body weight (g) − ln initial body weight (g)]/days.
Feed conversion ratio (FCR, g/g) = feed provided (g)/body weight gain (g)].
Condition factor (CF, g/cm3) = 100 × [body weight (g)/body length (cm)3].
Hepatosomatic index (HSI, %) =100 × [hepatopancreas weight (g)/body weight (g)].
Viscerosomatic index (VSI, %) = 100 × [weight of viscera (g)/body weight (g)].
Intraperitoneal fat index (IPFI, %) = 100 × [intraperitoneal fat weight (g)/body weight (g)].
2.4. Proximate Composition Analysis
2.5. Fatty Acid Composition Analysis
2.6. Histological Observation
2.7. Gene Expression Analysis
2.8. Data Analysis
3. Results
3.1. Growth Performance and Biological Parameters
3.2. Proximate Composition of the Hepatopancreas and Muscle
3.3. Fatty Acid Composition
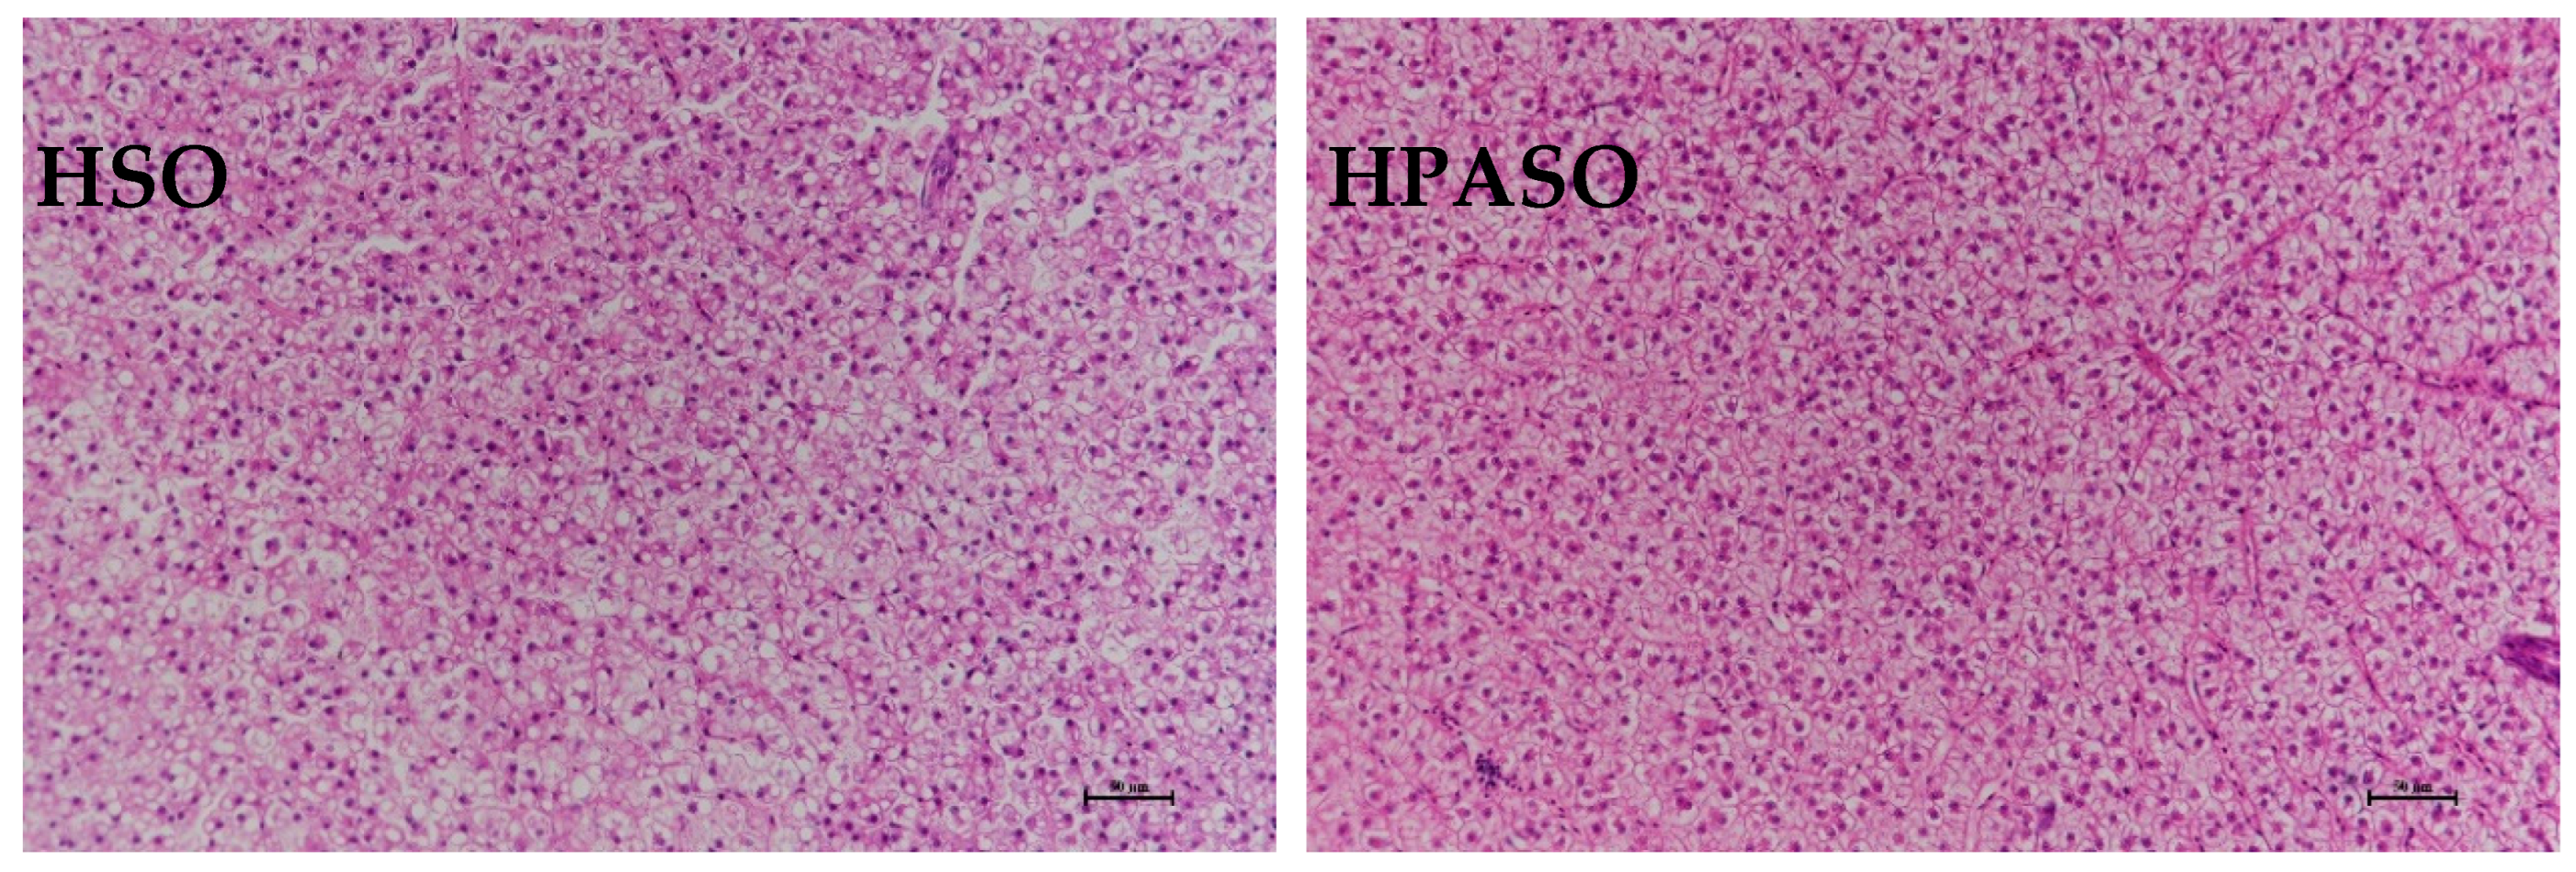
3.4. Histological Observation
3.5. Relative Expression of Genes Related to Lipid Metabolism
4. Discussion
5. Conclusions
Author Contributions
Funding
Institutional Review Board Statement
Data Availability Statement
Conflicts of Interest
References
- Sargent, J.; Bell, G.; McEvoy, L.; Tocher, D.; Estevez, A. Recent Developments in the Essential Fatty Acid Nutrition of Fish. Aquaculture 1999, 177, 191–199. [Google Scholar] [CrossRef]
- Wang, L.; Lu, Q.; Luo, S.; Zhan, W.; Chen, R.; Lou, B.; Xu, D. Effect of Dietary Lipid on Growth Performance, Body Composition, Plasma Biochemical Parameters and Liver Fatty Acids Content of Juvenile Yellow Drum Nibea albiflora. Aquac. Rep. 2016, 4, 10–16. [Google Scholar] [CrossRef]
- Sargent, J.R.; Tocher, D.R.; Bell, J.G. 4—The Lipids. In Fish Nutrition, 3rd ed.; Halver, J.E., Hardy, R.W., Eds.; Academic Press: San Diego, CA, USA, 2003; pp. 181–257. ISBN 978-0-12-319652-1. [Google Scholar]
- Naiel, M.A.E.; Negm, S.S.; Ghazanfar, S.; Shukry, M.; Abdelnour, S.A. The Risk Assessment of High-Fat Diet in Farmed Fish and Its Mitigation Approaches: A Review. J. Anim. Physiol. Anim. Nutr. 2023, 107, 948–969. [Google Scholar] [CrossRef] [PubMed]
- Gou, N.; Jin, T.; Yang, B.; Wang, K. Influences of Dietary Sodium Butyrate on Growth, Digestion, Antioxidant Capacity and Health in Juvenile Onychostoma Macrolepis Fed on High-Fat Diet. Aquacult. Rep. 2023, 33, 101808. [Google Scholar] [CrossRef]
- Pohlenz, C.; Gatlin, D.M. Interrelationships between Fish Nutrition and Health. Aquaculture 2014, 431, 111–117. [Google Scholar] [CrossRef]
- Boujard, T.; Gélineau, A.; Covès, D.; Corraze, G.; Dutto, G.; Gasset, E.; Kaushik, S. Regulation of Feed Intake, Growth, Nutrient and Energy Utilisation in European Sea Bass (Dicentrarchus labrax) Fed High Fat Diets. Aquaculture 2004, 231, 529–545. [Google Scholar] [CrossRef]
- Lu, K.; Xu, W.; Li, J.; Li, X.; Huang, G.; Liu, W. Alterations of Liver Histology and Blood Biochemistry in Blunt Snout Bream Megalobrama amblycephala Fed High-Fat Diets. Fish Sci. 2013, 79, 661–671. [Google Scholar] [CrossRef]
- Du, Z.-Y.; Liu, Y.J.; Tian, L.X.; Wang, J.T.; Wang, Y.; Liang, G.Y. Effect of Dietary Lipid Level on Growth, Feed Utilization and Body Composition by Juvenile Grass Carp (Ctenopharyngodon idella). Aquac. Nutr. 2005, 11, 139–146. [Google Scholar] [CrossRef]
- Wang, J.; Liu, T.; Zheng, P.; Xu, H.; Su, H.; Tao, H.; Yang, Y. Effect of Dietary Lipid Levels on Growth Performance, Body Composition, and Feed Utilization of Juvenile Spotted Knifejaw Oplegnathus punctatus. Aquac. Rep. 2021, 21, 100797. [Google Scholar] [CrossRef]
- Navarro-Barrón, E.; Hernández, C.; Llera-Herrera, R.; García-Gasca, A.; Gómez-Gil, B. Overfeeding a High-Fat Diet Promotes Sex-Specific Alterations on the Gut Microbiota of the Zebrafish (Danio rerio). Zebrafish 2019, 16, 268–279. [Google Scholar] [CrossRef]
- Zhao, W.; Yao, R.; Wei, H.-L.; Guo, Y.C.; Chen, A.Q.; Chen, B.Y.; Jin-Niu. Astaxanthin, Bile Acid and Chlorogenic Acid Attenuated the Negative Effects of High-Fat Diet on the Growth, Lipid Deposition, and Liver Health of Oncorhynchus mykiss. Aquaculture 2023, 567, 739255. [Google Scholar] [CrossRef]
- Liang, C.; Jiao, L.; Zhou, Q. Effects of Choline on the Growth Performance, Antioxidant Function and Lipid Metabolism in Juvenile Largemouth Bass Fed with High-Fat Diet. Aquac. Rep. 2023, 30, 101605. [Google Scholar] [CrossRef]
- Lu, K.L.; Xu, W.N.; Liu, W.B.; Wang, L.N.; Zhang, C.N.; Li, X.F. Association of Mitochondrial Dysfunction with Oxidative Stress and Immune Suppression in Blunt Snout Bream Megalobrama amblycephala Fed a High-Fat Diet. J. Aquat. Anim. Health 2014, 26, 100–112. [Google Scholar] [CrossRef]
- Li, J.M.; Zhang, Z.; Kong, A.; Lai, W.; Xu, W.; Cao, X.; Zhao, M.; Li, J.; Shentu, J.; Guo, X.; et al. Dietary L-Carnitine Regulates Liver Lipid Metabolism via Simultaneously Activating Fatty Acid β-Oxidation and Suppressing Endoplasmic Reticulum Stress in Large Yellow Croaker Fed with High-Fat Diets. Br. J. Nutr. 2023, 129, 29–40. [Google Scholar] [CrossRef] [PubMed]
- Li, C.; Liu, P.; Ji, H.; Huang, J.; Zhang, W. Dietary N-3 Highly Unsaturated Fatty Acids Affect the Biological and Serum Biochemical Parameters, Tissue Fatty Acid Profile, Antioxidation Status and Expression of Lipid-Metabolism-Related Genes in Grass Carp, Ctenopharyngodon idellus. Aquac. Nutr. 2015, 21, 373–383. [Google Scholar] [CrossRef]
- Lei, C.X.; Tian, J.J.; Ji, H.; Chen, L.Q.; Du, Z.Y. Dietary α-Linolenic Acid Affects Lipid Metabolism and Tissue Fatty Acid Profile and Induces Apoptosis in Intraperitoneal Adipose Tissue of Juvenile Grass Carp (Ctenopharyngodon idella). Aquac. Nutr. 2017, 23, 160–170. [Google Scholar] [CrossRef]
- Zou, Q.; Yang, Y.; Wei, B.H.; Yu, D.; Chen, L.; Zhou, T.; Huang, F.; Dong, G.F. Effects of Dietary Conjugated Linoleic Acid on Growth Performance, Tissue Adipocytokine Levels and Lipid Metabolism of Grass Carp. Aquac. Nutr. 2018, 24, 1752–1768. [Google Scholar] [CrossRef]
- Xie, D.; Chen, C.; Dong, Y.; You, C.; Wang, S.; Monroig, Ó.; Tocher, D.R.; Li, Y. Regulation of Long-Chain Polyunsaturated Fatty Acid Biosynthesis in Teleost Fish. Prog. Lipid Res. 2021, 82, 101095. [Google Scholar] [CrossRef] [PubMed]
- Harayama, T.; Shimizu, T. Roles of Polyunsaturated Fatty Acids, from Mediators to Membranes. J. Lipid Res. 2020, 61, 1150–1160. [Google Scholar] [CrossRef]
- Chen, L.; Yang, T.X.; Wei, A.Z.; Feng, S.J.; Liu, Y.H. Research Progress on Chinese Prickly Ash. China Condiment 2016, 41, 149–156. [Google Scholar]
- Tian, J.; Yang, K.; Chen, H.; Ji, H.; Li, J.; Nie, W.; Zhou, J. Effect of Dietary Prickly Ash (Zanthoxylum bungeanum) Seeds (PAS) on Growth, Body Composition, and Health of Juvenile Jian Carp (Cyprinus carpio Var. Jian). Aquacult. Int. 2017, 25, 107–120. [Google Scholar] [CrossRef]
- Xue, T.; Huang, J.R.; Li, H.L. Research Progress on Domestic and Foreign Pepper By-products. China Condiment 2013, 38, 106–110. [Google Scholar]
- Feng, S.; Yang, T.; Li, X.; Chen, L.; Liu, Z.; Wei, A. Genetic Relationships of Chinese Prickly Ash as Revealed by ISSR Markers. Biologia 2015, 70, 45–51. [Google Scholar] [CrossRef]
- Wei, Q.M.; Chen, C.; Tan, Y.H.; Mo, G.X.; Liang, X.J.; Lin, M.Y.; Huang, S.Y. Effect of the kernel of zanthoxylum seed oil on atherosclerosis in rats. Pract. Pharm. Clin. Remedies 2017, 20, 9–11. [Google Scholar] [CrossRef]
- Liu, Y.Y.; Wang, D.N.; Liu, Y.S.; Yang, Y.; Zhao, Y.W.; Wang, Z.L.; Yang, J.Q. Preventive and therapeutical effect of the kernel of zanthoxylum seed oil on experimental hyperlipidemia in rats. J. Air Force Med. Univ. 2007, 411–413. [Google Scholar]
- Xia, L.; You, J.; Li, G.; Sun, Z.; Suo, Y. Compositional and Antioxidant Activity Analysis of Zanthoxylum bungeanum Seed Oil Obtained by Supercritical CO2 Fluid Extraction. J. Am. Oil Chem. Soc. 2011, 88, 23–32. [Google Scholar] [CrossRef]
- Xie, C.; Jiale, L.J.; Li, D.; Shen, Y.; Gao, Y.; Zhang, Z. Grass Carp: The Fish That Feeds Half of China: Success Stories and Modern Trends. In Aquaculture in China: Success Stories and Modern Trends; Wiley-Blackwell: Hoboken, NJ, USA, 2018; pp. 93–115. ISBN 978-1-119-12074-2. [Google Scholar]
- Du, Z.Y.; Clouet, P.; Zheng, W.H.; Degrace, P.; Tian, L.X.; Liu, Y.J. Biochemical Hepatic Alterations and Body Lipid Composition in the Herbivorous Grass Carp (Ctenopharyngodon idella) Fed High-Fat Diets. Br. J. Nutr. 2006, 95, 905–915. [Google Scholar] [CrossRef]
- Du, Z.Y.; Clouet, P.; Degrace, P.; Zheng, W.H.; Frøyland, L.; Tian, L.X.; Liu, Y.J. Hypolipidaemic Effects of Fenofibrate and Fasting in the Herbivorous Grass Carp (Ctenopharyngodon idella) Fed a High-Fat Diet. Br. J. Nutr. 2008, 100, 1200–1212. [Google Scholar] [CrossRef]
- Wang, J.; Lu, R.; Sun, J.; Xie, D.; Yang, F.; Nie, G. Differential Expression of Lipid Metabolism-Related Genes and miRNAs in Ctenopharyngodon idella Liver in Relation to Fatty Liver Induced by High Non-Protein Energy Diets. Aquac. Res. 2017, 48, 4070–4085. [Google Scholar] [CrossRef]
- Xie, N.; Wen, H.; Xie, S.; Jiang, M.; Yu, L.; Wu, F.; Lu, X.; Meng, X.; Tian, J. Adaptations of Hepatic Lipid and Glucose Metabolism in Response to High-Macronutrient Diets in Juvenile Grass Carp. Aquac. Nutr. 2021, 27, 1738–1749. [Google Scholar] [CrossRef]
- Lei, C.; Ji, H.; Zhang, J.; Li, J. Effects of Dietary DHA/EPA Ratios on Fatty Acid Composition, Lipid Metabolism-Related Enzyme Activity, and Gene Expression of Juvenile Grass Carp, Ctenopharyngodon idellus. J. World Aquac. Soc. 2016, 47, 287–296. [Google Scholar] [CrossRef]
- Xing, J.; Xiao, F.; Luo, X.; Sun, J.; Li, H.; Yuan, X.; Ji, H. Effect of Dietary Schizochytrium Sp. Oil as an n-3 Long-Chain Polyunsaturated Fatty Acid Source on Growth Performance, Lipid Metabolism and Antioxidant Status in Juvenile Grass Carp (Ctenopharyngodon idellus): A Comparative Study with Fish Oil. Aquac. Res. 2020, 51, 4551–4564. [Google Scholar] [CrossRef]
- Association of Official Analytical Chemists (AOAC). Official Methods of Analysis of the Association of Official Analytical Chemists, 17th ed.; AOAC: Arlington, TX, USA, 2003. [Google Scholar]
- Tian, J.J.; Lei, C.X.; Ji, H. Influence of Dietary Linoleic Acid (18:2n-6) and α-Linolenic Acid (18:3n-3) Ratio on Fatty Acid Composition of Different Tissues in Freshwater Fish Songpu Mirror Carp, Cyprinus carpio. Aquac. Res. 2016, 47, 3811–3825. [Google Scholar] [CrossRef]
- Huang, C.; Sun, J.; Ji, H.; Oku, H.; Chang, Z.; Tian, J.; Yu, E.; Xie, J. Influence of Dietary Alpha-Lipoic Acid and Lipid Level on the Growth Performance, Food Intake and Gene Expression of Peripheral Appetite Regulating Factors in Juvenile Grass Carp (Ctenopharyngodon idellus). Aquaculture 2019, 505, 412–422. [Google Scholar] [CrossRef]
- Wang, J.T.; Liu, Y.J.; Tian, L.X.; Mai, K.S.; Du, Z.Y.; Wang, Y.; Yang, H.J. Effect of Dietary Lipid Level on Growth Performance, Lipid Deposition, Hepatic Lipogenesis in Juvenile Cobia (Rachycentron canadum). Aquaculture 2005, 249, 439–447. [Google Scholar] [CrossRef]
- Man, M.S.; Sui, Z.M.; Zhou, H.H.; Wang, X.; Xu, W.; Mai, K.S.; He, G. Effects of Dietary Lipid Level and Lipid Source on the Growth and Metabolism of Juvenile Turbot (Scophthalmus maximus L.). Period. Ocean Univ. China 2020, 50, 26–36. [Google Scholar] [CrossRef]
- Yang, L.; Liu, M.; Zhao, M.; Zhi, S.; Zhang, W.; Qu, L.; Xiong, J.; Yan, X.; Qin, C.; Nie, G.; et al. Dietary Bile Acid Supplementation Could Regulate the Glucose, Lipid Metabolism, and Microbiota of Common Carp (Cyprinus carpio L.) Fed with a High-Lipid Diet. Aquac. Nutr. 2023, 2023, e9953927. [Google Scholar] [CrossRef] [PubMed]
- Cao, X.F.; Dai, Y.J.; Liu, M.Y.; Yuan, X.Y.; Wang, C.C.; Huang, Y.Y.; Liu, W.B.; Jiang, G.Z. High-Fat Diet Induces Aberrant Hepatic Lipid Secretion in Blunt Snout Bream by Activating Endoplasmic Reticulum Stress-Associated IRE1/XBP1 Pathway. Biochim. Biophys. Acta Mol. Cell Biol. Lipids 2019, 1864, 213–223. [Google Scholar] [CrossRef]
- Lu, K.L.; Xu, W.N.; Li, X.F.; Liu, W.B.; Wang, L.N.; Zhang, C.N. Hepatic Triacylglycerol Secretion, Lipid Transport and Tissue Lipid Uptake in Blunt Snout Bream (Megalobrama amblycephala) Fed High-Fat Diet. Aquaculture 2013, 408–409, 160–168. [Google Scholar] [CrossRef]
- Tao, Y.F.; Qiang, J.; Bao, J.W.; Chen, D.J.; Yin, G.J.; Xu, P.; Zhu, H.J. Changes in Physiological Parameters, Lipid Metabolism, and Expression of MicroRNAs in Genetically Improved Farmed Tilapia (Oreochromis niloticus) with Fatty Liver Induced by a High-Fat Diet. Front. Physiol. 2018, 9, 1521. [Google Scholar] [CrossRef]
- Yang, L.; Zhao, M.; Liu, M.; Zhang, W.; Zhi, S.; Qu, L.; Xiong, J.; Wang, L.; Qin, C.; Nie, G. Effects of Genistein on Lipid Metabolism, Antioxidant Activity, and Immunity of Common Carp (Cyprinus carpio L.) Fed with High-Carbohydrate and High-Fat Diets. Aquac. Nutr. 2023, 2023, 9555855. [Google Scholar] [CrossRef] [PubMed]
- Xie, D.; Yang, L.; Yu, R.; Chen, F.; Lu, R.; Qin, C.; Nie, G. Effects of Dietary Carbohydrate and Lipid Levels on Growth and Hepatic Lipid Deposition of Juvenile Tilapia, Oreochromis niloticus. Aquaculture 2017, 479, 696–703. [Google Scholar] [CrossRef]
- Tang, T.; Hu, Y.; Peng, M.; Chu, W.; Hu, Y.; Zhong, L. Effects of High-Fat Diet on Growth Performance, Lipid Accumulation and Lipid Metabolism-Related MicroRNA/Gene Expression in the Liver of Grass Carp (Ctenopharyngodon idella). Comp. Biochem. Physiol. Part B Biochem. Mol. Biol. 2019, 234, 34–40. [Google Scholar] [CrossRef] [PubMed]
- Yuan, X.; Liang, X.F.; Liu, L.; Fang, J.; Li, J.; Li, A.; Cai, W.; Xue, M.; Wang, J.; Wang, Q. Fat Deposition Pattern and Mechanism in Response to Dietary Lipid Levels in Grass Carp, Ctenopharyngodon idellus. Fish Physiol. Biochem. 2016, 42, 1557–1569. [Google Scholar] [CrossRef] [PubMed]
- Wang, X.; Li, Q.; Wang, J.; Li, E.; Qin, J.G.; Chen, L. Effects of Dietary Alpha-Linolenic Acids on Growth Performance, Lipid Metabolism and Antioxidant Responses of Juvenile Russian Sturgeon Acipenser gueldenstaedtii. Aquac. Nutr. 2019, 25, 184–193. [Google Scholar] [CrossRef]
- Chen, C.; Sun, B.; Li, X.; Li, P.; Guan, W.; Bi, Y.; Pan, Q. N-3 Essential Fatty Acids in Nile Tilapia, Oreochromis niloticus: Quantification of Optimum Requirement of Dietary Linolenic Acid in Juvenile Fish. Aquaculture 2013, 416–417, 99–104. [Google Scholar] [CrossRef]
- Kloska, A.; Węsierska, M.; Malinowska, M.; Gabig-Cimińska, M.; Jakóbkiewicz-Banecka, J. Lipophagy and Lipolysis Status in Lipid Storage and Lipid Metabolism Diseases. Int. J. Mol. Sci. 2020, 21, 6113. [Google Scholar] [CrossRef] [PubMed]
- Shimano, H. Sterol Regulatory Element-Binding Proteins (SREBPs): Transcriptional Regulators of Lipid Synthetic Genes. Prog. Lipid Res. 2001, 40, 439–452. [Google Scholar] [CrossRef] [PubMed]
- Xu, Y.H.; Tan, X.Y.; Xu, Y.C.; Zhao, T.; Zhang, L.H.; Luo, Z. Novel Insights for SREBP-1 as a Key Transcription Factor in Regulating Lipogenesis in a Freshwater Teleost, Grass Carp Ctenopharyngodon idella. Br. J. Nutr. 2019, 122, 1201–1211. [Google Scholar] [CrossRef] [PubMed]
- Houten, S.M.; Violante, S.; Ventura, F.V.; Wanders, R.J.A. The Biochemistry and Physiology of Mitochondrial Fatty Acid β-Oxidation and Its Genetic Disorders. Annu. Rev. Physiol. 2016, 78, 23–44. [Google Scholar] [CrossRef]
- Yuan, Q.; Xie, F.; Huang, W.; Hu, M.; Yan, Q.; Chen, Z.; Zheng, Y.; Liu, L. The Review of Alpha-Linolenic Acid: Sources, Metabolism, and Pharmacology. Phytother. Res. 2022, 36, 164–188. [Google Scholar] [CrossRef] [PubMed]
- Urrutia, O.; Mendizabal, J.A.; Alfonso, L.; Soret, B.; Insausti, K.; Arana, A. Adipose Tissue Modification through Feeding Strategies and Their Implication on Adipogenesis and Adipose Tissue Metabolism in Ruminants. Int. J. Mol. Sci. 2020, 21, 3183. [Google Scholar] [CrossRef] [PubMed]
- Luo, N.; Ding, Z.L.; Kong, Y.Q.; Zhang, R.F.; Zhang, Y.X.; Wu, C.L.; Jiang, Z.Q.; Ye, J.Y. An Evaluation of Increasing Linolenic Acid Level in the Diet of Macrobrachium nipponense: Lipid Deposition, Fatty Acid Composition and Expression of Lipid Metabolism-Related Genes. Aquac. Nutr. 2018, 24, 758–767. [Google Scholar] [CrossRef]
- Ebrahimi, M.; Rajion, M.A.; Meng, G.Y.; Farjam, A.S.; Oskoueian, E.; Jafari, S. Diet High in α-Linolenic Acid Up-Regulate PPAR-α Gene Expression in the Liver of Goats. Electron. J. Biotechnol. 2015, 18, 210–214. [Google Scholar] [CrossRef]
- Xiao, F.; Xing, J.; Li, H.; Xu, X.; Hu, Z.; Ji, H. Effects of the Defatted Schizochytrium Sp. on Growth Performance, Fatty Acid Composition, Histomorphology and Antioxidant Status of Juvenile Mirror Carp (Cyprinus carpio Var. specularis). Aquac. Res. 2021, 52, 3062–3076. [Google Scholar] [CrossRef]
- Jiang, Y.; Hu, Y.; Xu, W.; Luo, H.; Chen, J.; Tao, B.; Luo, D.; Han, D.; Zhu, X.; Xie, S.; et al. Effects of Dietary Arachidonic Acid on Growth, Gonadal Development, and Tissue Fatty Acid Composition in the Hermaphroditic Swamp Eel (Monopterus albus). Aquac. Rep. 2023, 33, 101791. [Google Scholar] [CrossRef]
- Gou, N.; Chang, Z.; Deng, W.; Ji, H.; Zhou, J. Effects of Dietary Lipid Levels on Growth, Fatty Acid Composition, Antioxidant Status and Lipid Metabolism in Juvenile Onychostoma macrolepis. Aquac. Res. 2019, 50, 3369–3381. [Google Scholar] [CrossRef]
- Chilton, F.H.; Dutta, R.; Reynolds, L.M.; Sergeant, S.; Mathias, R.A.; Seeds, M.C. Precision Nutrition and Omega-3 Polyunsaturated Fatty Acids: A Case for Personalized Supplementation Approaches for the Prevention and Management of Human Diseases. Nutrients 2017, 9, 1165. [Google Scholar] [CrossRef] [PubMed]
- Marrero, M.; Monroig, Ó.; Navarro, J.C.; Ribes-Navarro, A.; Pérez, J.A.; Galindo, A.; Rodríguez, C. Metabolic and Molecular Evidence for Long-Chain PUFA Biosynthesis Capacity in the Grass Carp Ctenopharyngodon idella. Comp. Biochem. Physiol. Part A Mol. Integr. Physiol. 2022, 270, 111232. [Google Scholar] [CrossRef] [PubMed]
- Xie, D.; Ye, J.; Lu, M.; Wang, S.; You, C.; Li, Y. Comparsion of Activities of Fatty Acyl Desaturases and Elongases Among Six Teleosts with Different Feeding and Ecological Habits. Front. Mar. Sci. 2020, 7, 117. [Google Scholar] [CrossRef]


| Ingredients (g/kg) | SO | PASO | HSO | HPASO |
|---|---|---|---|---|
| Fish meal | 40 | 40 | 40 | 40 |
| Soybean meal | 198 | 198 | 198 | 198 |
| Rapeseed meal | 20 | 20 | 150 | 150 |
| Cottonseed meal | 297 | 297 | 252 | 252 |
| Whole wheat flour | 362 | 362 | 176 | 176 |
| Rice bran | 22 | 220 | 1020 | 1020 |
| Soybean oil | 210 | 00 | 420 | 00 |
| PASO | 0 | 210 | 0 | 420 |
| Bentonite | 100 | 100 | 100 | 100 |
| Ca(H2PO4) | 200 | 200 | 200 | 200 |
| Premix * | 100 | 100 | 100 | 100 |
| VC | 0.002 | 0.002 | 0.002 | 0.002 |
| Total | 1000 | 1000 | 1000 | 1000 |
| Proximate composition (%) ** | ||||
| Crude protein | 33.14 | 33.26 | 33.17 | 33.77 |
| Crude lipid | 4.11 | 3.80 | 8.28 | 8.07 |
| Ash | 7.66 | 7.67 | 8.77 | 8.64 |
| Moisture | 8.43 | 8.66 | 8.09 | 8.50 |
| Gross energy (MJ/kg) *** | 19.02 | 18.95 | 19.80 | 19.81 |
| Fatty Acids | SO | PASO | HSO | HPASO |
|---|---|---|---|---|
| 14:0 | 1.14 | 2.56 | 0.58 | 0.71 |
| 16:0 | 14.78 | 18.10 | 12.66 | 14.79 |
| 18:0 | 5.49 | 3.00 | 4.02 | 2.59 |
| Σ SFA | 21.42 | 23.66 | 17.26 | 18.09 |
| 16:1n-7 | 0.93 | 7.09 | 0.58 | 6.44 |
| 18:1n-9 | 21.66 | 25.87 | 27.77 | 34.63 |
| Σ MUFA | 22.60 | 32.96 | 28.36 | 41.07 |
| 18:2n-6 | 42.92 | 27.15 | 42.55 | 27.27 |
| 20:4n-6 | 1.94 | 2.30 | 2.48 | 2.58 |
| 22:4n-6 | 1.70 | 2.79 | 1.05 | 0.43 |
| Σ n-6PUFA | 46.56 | 32.24 | 46.08 | 30.29 |
| 18:3n-3 | 5.66 | 7.45 | 6.27 | 8.88 |
| 20:5n-3 | 2.55 | 2.68 | 1.43 | 1.05 |
| 22:6n-3 | 1.22 | 1.01 | 0.61 | 0.63 |
| Σ n-3PUFA | 9.43 | 11.14 | 8.31 | 10.56 |
| n-3/n-6 PUFA | 0.20 | 0.35 | 0.18 | 0.35 |
| LA/LNA | 0.13 | 0.27 | 0.15 | 0.33 |
| Genes | Sequences of Primers (5′~3′) | Accession Number | |
|---|---|---|---|
| Lipogenesis-related genes | ppar-γ | Forward: GATGGTTGGCATGTCACAC Reverse: TTCCTGACAGTATGGCTC | FJ849064 |
| cebp-α | Forward: ACCCACATACCACCACTCTCAACA Reverse: TTTCCCTCGATCGCCCATCTTCAT | NM199529 | |
| srebp-1c | Forward: GGATTGAGGTGAGCCGACAT Reverse: TGAGGAAAGCCATTGACTACATT | KJ162572 | |
| Lipolysis-related genes | ppar-α | Forward: AGTGATGGTGGTCTTCAGCTCCGA Reverse: AGTGTCGGACTTCAGCTCCAAAGA | FJ623265 |
| cpt-1 | Forward: CATGGCATTGACCGCCATCTCTTT Reverse: AGAGTTTCCAAGGCTCTGACAGCA | KJ816749 | |
| ucp-1 | Forward: CGTGGTTTGTGGAAAGG Reverse: GCTCCAAATGCAGATGTG | AY689125 | |
| Housekeeping gene | β-actin | Forward: CGTGACATCAAGGAGAAG Reverse: GAGTTGAAGGTGGTCTCAT | DQ211096 |
| Parameters | Diets | Two-Way ANOVA | |||||
|---|---|---|---|---|---|---|---|
| SO | PASO | HSO | HPASO | Oil Levels | Oil Sources | Interaction | |
| IBW (g) | 9.43 ± 0.82 | 9.43 ± 0.82 | 9.43 ± 0.82 | 9.43 ± 0.82 | ns | ns | ns |
| FBW (g) | 33.50 ± 2.32 | 33.33 ± 1.57 | 35.07 ± 2.74 | 35.45 ± 2.62 | ns | ns | ns |
| SR (%) | 100 ± 0.00 | 100 ± 0.00 | 100 ± 0.00 | 100 ± 0.00 | ns | ns | ns |
| SGR (%/d) | 2.43 ± 0.16 | 2.25 ± 0.10 | 2.35 ± 0.19 | 2.36 ± 0.16 | ns | ns | ns |
| FCR | 1.29 ± 0.04 | 1.28 ± 0.05 | 1.29 ± 0.08 | 1.23 ± 0.06 | ns | ns | ns |
| CF (g/cm3) | 1.87 ± 0.03 | 1.83 ± 0.02 | 1.92 ± 0.05 | 1.90 ± 0.02 | ns | ns | ns |
| HSI (%) | 2.29 ± 0.14 | 2.30 ± 0.14 | 2.17 ± 0.16 | 2.27 ± 0.15 | ns | ns | ns |
| VSI (%) | 12.39 ± 0.80 b | 13.30 ± 0.18 ab | 14.33 ± 0.96 a | 13.78 ± 0.40 a | * | ns | * |
| IPFI (%) | 1.85 ± 0.49 | 1.94 ± 0.17 | 2.05 ± 0.13 | 2.20 ± 0.62 | ns | ns | ns |
| Parameters | Diets | Two-Way ANOVA | |||||
|---|---|---|---|---|---|---|---|
| SO | PASO | HSO | HPASO | Oil Levels | Oil Sources | Interaction | |
| Hepatopancreas | |||||||
| Crude protein | 30.73 ± 2.02 | 27.36 ± 0.41 | 29.32 ± 2.14 | 30.92 ± 0.98 | ns | ns | * |
| Crude lipid | 40.81 ± 1.18 b | 40.28 ± 0.36 b | 48.53 ± 2.23 a | 47.12 ± 1.05 a | * | ns | ns |
| Moisture | 7.34 ± 0.15 | 7.54 ± 1.22 | 7.46 ± 1.06 | 7.90 ± 0.95 | ns | ns | ns |
| Ash | 3.07 ± 0.01 | 3.02 ± 0.01 | 2.65 ± 0.01 | 3.12 ± 0.01 | ns | ns | ns |
| Muscle | |||||||
| Crude protein | 74.20 ± 3.59 | 74.81 ± 3.12 | 76.83 ± 3.53 | 74.06 ± 2.52 | ns | ns | ns |
| Crude lipid | 8.11 ± 0.66 b | 7.75 ± 1.38 b | 10.81 ± 1.42 a | 10.50 ± 1.28 a | * | ns | ns |
| Moisture | 15.48 ± 0.64 | 15.31 ± 0.79 | 15.10 ± 1.16 | 14.90 ± 0.89 | ns | ns | ns |
| Ash | 6.04 ± 0.07 | 5.97 ± 0.12 | 6.05 ± 0.19 | 6.00 ± 0.10 | ns | ns | ns |
| Fatty Acid | Diets | Two-Way ANOVA | |||||
|---|---|---|---|---|---|---|---|
| SO | PASO | HSO | HPASO | Oil Levels | Oil Sources | Interaction | |
| 14:0 | 2.65 ± 0.22 a | 2.72 ± 0.26 a | 2.22 ± 0.30 b | 2.18 ± 0.21 b | * | ns | ns |
| 16:0 | 20.59 ± 0.36 a | 20.13 ± 0.30 a | 18.51 ± 0.30 b | 18.07 ± 1.12 b | * | ns | ns |
| 18:0 | 9.80 ± 0.64 a | 8.97 ± 0.44 ab | 8.83 ± 0.92 ab | 8.12 ± 1.00 b | * | ns | ns |
| Σ SFA | 33.03 ± 0.87 a | 31.82 ± 0.49 a | 29.56 ± 1.05 b | 28.37 ± 1.88 b | * | ns | ns |
| 16:1n-7 | 8.22 ± 0.72 b | 10.05 ± 0.55 a | 6.68 ± 1.11 c | 7.50 ± 1.16 bc | * | * | ns |
| 18:1n-9 | 47.33 ± 1.42 | 49.88 ± 0.94 | 48.09 ± 2.20 | 49.12 ± 2.93 | ns | ns | ns |
| 24:1 | 0.74 ± 0.27 | 0.54 ± 0.16 | 0.97 ± 0.16 | 0.78 ± 0.30 | ns | ns | ns |
| Σ MUFA | 56.29 ± 1.93 | 60.47 ± 1.28 | 55.75 ± 3.02 | 56.40 ± 3.58 | ns | ns | ns |
| 18:2n-6 | 5.98 ± 2.31 a | 3.32 ± 0.82 b | 8.43 ± 3.05 a | 8.31 ± 1.89 a | * | ns | ns |
| 20:4n-6 | 1.54 ± 0.49 b | 1.36 ± 0.49 b | 2.31 ± 0.45 a | 1.99 ± 0.68 ab | * | ns | ns |
| Σ n-6PUFA | 7.53 ± 1.95 b | 4.67 ± 0.78 c | 10.74 ± 3.31 a | 10.30 ± 2.36 a | * | ns | ns |
| 18:3n-3 | 1.74 ± 0.41 c | 1.85 ± 0.21 bc | 2.27 ± 0.37 ab | 2.61 ± 0.47 a | * | ns | ns |
| 20:5n-3 | 0.33 ± 0.12 | 0.23 ± 0.07 | 0.35 ± 0.11 | 0.31 ± 0.13 | ns | ns | ns |
| 22:6n-3 | 0.98 ± 0.29 | 1.06 ± 0.45 | 1.33 ± 0.16 | 1.23 ± 0.33 | ns | ns | ns |
| Σ n-3PUFA | 3.16 ± 0.16 b | 3.04 ± 0.53 b | 3.95 ± 0.38 a | 4.15 ± 0.72 a | * | ns | ns |
| n-3/n-6PUFA | 0.44 ± 0.11 b | 0.65 ± 0.08 a | 0.40 ± 0.13 b | 0.41 ± 0.08 b | * | ns | ns |
| PCCs | 0.36 ± 0.03 d | 0.66 ± 0.01 b | 0.51 ± 0.04 c | 0.82 ± 0.01 a | * | * | ns |
| Fatty Acid | Diets | Two-Way ANOVA | |||||
|---|---|---|---|---|---|---|---|
| SO | PASO | HSO | HPASO | Oil Levels | Oil Sources | Interaction | |
| 14:0 | 1.94 ± 0.08 a | 1.90 ± 0.06 a | 1.26 ± 0.10 b | 1.33 ± 0.02 b | * | ns | ns |
| 16:0 | 19.03 ± 0.08 a | 19.30 ± 0.44 a | 15.65 ± 0.97 b | 15.84 ± 0.24 b | * | ns | ns |
| 18:0 | 5.97 ± 0.18 a | 5.83 ± 0.25 a | 3.99 ± 0.23 b | 3.83 ± 0.25 b | * | ns | ns |
| Σ SFA | 26.95 ± 0.16 a | 26.24 ± 0.45 a | 20.90 ± 0.91 b | 21.00 ± 0.27 b | * | ns | ns |
| 16:1n-7 | 6.56 ± 0.45 ab | 9.03 ± 0.35 a | 5.37 ± 2.34 b | 6.86 ± 1.94 ab | ns | * | ns |
| 18:1n-9 | 38.62 ± 1.45 | 40.74 ± 0.61 | 39.10 ± 3.13 | 39.49 ± 2.38 | ns | ns | ns |
| 22:1n-9 | 0.78 ± 0.03 | 0.80 ± 0.03 | 0.84 ± 0.21 | 0.87 ± 0.16 | ns | ns | ns |
| Σ MUFA | 45.96 ± 1.71 | 50.37 ± 0.48 | 45.42 ± 5.24 | 47.22 ± 4.08 | ns | ns | ns |
| 18:2n-6 | 21.27 ± 1.12 ab | 17.07 ± 0.91 b | 26.63 ± 5.78 a | 24.02 ± 4.54 a | * | ns | ns |
| 20:4n-6 | 0.81 ± 0.12 | 0.67 ± 0.05 | 0.93 ± 0.33 | 0.92 ± 0.15 | ns | ns | ns |
| Σ n-6PUFA | 22.08 ± 1.22 ab | 17.74 ± 0.89 b | 27.56 ± 6.10 a | 24.93 ± 4.66 a | * | ns | ns |
| 18:3n-3 | 4.11 ± 0.51 c | 4.80 ± 0.17 b | 5.28 ± 0.39 ab | 5.92 ± 0.80 a | * | * | ns |
| 20:5n-3 | 0.50 ± 0.10 | 0.49 ± 0.08 | 0.44 ± 0.04 | 0.49 ± 0.05 | ns | ns | ns |
| 22:6n-3 | 0.40 ± 0.06 | 0.37 ± 0.04 | 0.39 ± 0.07 | 0.44 ± 0.09 | ns | ns | ns |
| Σ n-3PUFA | 5.01 ± 0.63 c | 5.66 ± 0.28 bc | 6.11 ± 0.39 ab | 6.85 ± 0.85 a | * | ns | ns |
| n-3/n-6PUFA | 0.23 ± 0.02 b | 0.32 ± 0.02 a | 0.23 ± 0.06 b | 0.28 ± 0.07 ab | ns | * | ns |
| PCCs | 0.68 ± 0.01 a | 0.86 ± 0.01 b | 0.84 ± 0.04 b | 0.98 ± 0.01 a | * | * | ns |
| Fatty Acid | Diets | Two-Way ANOVA | |||||
|---|---|---|---|---|---|---|---|
| SO | PASO | HSO | HPASO | Oil Levels | Oil Sources | Interaction | |
| 14:0 | 1.10 ± 0.07 a | 1.03 ± 0.16 ab | 0.93 ± 0.07 bc | 0.82 ± 0.12 c | * | ns | ns |
| 16:0 | 22.82 ± 0.72 a | 22.25 ± 0.25 a | 20.90 ± 1.00 b | 19.79 ± 1.62 b | * | ns | ns |
| 18:0 | 8.36 ± 0.67 | 7.89 ± 0.90 | 7.86 ± 0.56 | 7.08 ± 1.13 | ns | ns | ns |
| Σ SFA | 32.28 ± 1.31 a | 31.17 ± 0.97 ab | 29.57 ± 1.25 bc | 27.80 ± 2.63 c | * | ns | ns |
| 16:1n-7 | 5.62 ± 0.38 b | 6.95 ± 0.56 a | 3.77 ± 0.99 c | 4.60 ± 0.91 c | * | * | ns |
| 18:1n-9 | 21.50 ± 1.90 | 23.83 ± 1.91 | 22.56 ± 2.12 | 26.52 ± 5.40 | ns | ns | ns |
| 22:1n-9 | 2.08 ± 0.14 | 1.95 ± 0.18 | 2.44 ± 0.26 | 2.04 ± 0.53 | ns | ns | ns |
| 24:1 | 4.07 ± 0.46 | 3.33 ± 0.31 | 3.88 ± 0.74 | 3.30 ± 1.16 | ns | ns | ns |
| Σ MUFA | 33.28 ± 1.69 ab | 36.06 ± 1.90 ab | 32.65 ± 2.00 b | 36.45 ± 4.19 a | ns | * | ns |
| 18:2n-6 | 11.27 ± 0.74 b | 9.63 ± 0.90 b | 15.27 ± 2.42 a | 16.02 ± 4.01 a | * | ns | ns |
| 20:3n-6 | 1.43 ± 0.24 b | 2.00 ± 0.35 a | 0.94 ± 0.25 c | 0.71 ± 0.06 c | * | ns | * |
| 20:4n-6 | 7.26 ± 0.65 | 6.60 ± 0.34 | 7.62 ± 1.26 | 5.95 ± 1.82 | ns | ns | ns |
| Σ n-6PUFA | 19.95 ± 0.94 bc | 18.23 ± 0.67 c | 23.84 ± 3.11 a | 22.68 ± 3.34 ab | * | ns | ns |
| 18:3n-3 | 2.03 ± 0.34 b | 2.26 ± 0.31 b | 2.56 ± 0.41 b | 3.16 ± 0.64 a | * | ns | ns |
| 20:3n-3 | 2.85 ± 0.61 | 2.38 ± 0.73 | 2.08 ± 0.44 | 1.92 ± 0.65 | ns | ns | ns |
| 20:5n-3 | 1.63 ± 0.45 | 1.91 ± 0.29 | 1.75 ± 0.22 | 1.49 ± 0.57 | ns | ns | ns |
| 22:6n-3 | 7.98 ± 1.05 | 7.99 ± 1.06 | 7.54 ± 0.51 | 6.50 ± 2.55 | ns | ns | ns |
| Σ n-3PUFA | 14.49 ± 1.43 | 14.54 ± 1.67 | 13.94 ± 1.08 | 13.06 ± 3.28 | ns | ns | ns |
| n-3/n-6PUFA | 0.73 ± 0.10 ab | 0.80 ± 0.12 a | 0.60 ± 0.13 b | 0.60 ± 0.20 b | * | ns | ns |
| PCCs | 0.59 ± 0.00 | 0.82 ± 0.00 | 0.72 ± 0.03 | 0.91 ± 0.02 | * | * | * |
Disclaimer/Publisher’s Note: The statements, opinions and data contained in all publications are solely those of the individual author(s) and contributor(s) and not of MDPI and/or the editor(s). MDPI and/or the editor(s) disclaim responsibility for any injury to people or property resulting from any ideas, methods, instructions or products referred to in the content. |
© 2024 by the authors. Licensee MDPI, Basel, Switzerland. This article is an open access article distributed under the terms and conditions of the Creative Commons Attribution (CC BY) license (https://creativecommons.org/licenses/by/4.0/).
Share and Cite
Wang, P.; Zhu, Z.; Xu, Q.; Xing, Y.; Zhang, M.; Zhou, J. Inhibitory Effect of Prickly Ash (Zanthoxylum bungeanum) Seed Kernel Oil on Lipid Metabolism of Grass Carp (Ctenopharyngodon idellus) in High-Fat Diet. Fishes 2024, 9, 123. https://doi.org/10.3390/fishes9040123
Wang P, Zhu Z, Xu Q, Xing Y, Zhang M, Zhou J. Inhibitory Effect of Prickly Ash (Zanthoxylum bungeanum) Seed Kernel Oil on Lipid Metabolism of Grass Carp (Ctenopharyngodon idellus) in High-Fat Diet. Fishes. 2024; 9(4):123. https://doi.org/10.3390/fishes9040123
Chicago/Turabian StyleWang, Ping, Ziling Zhu, Qinglai Xu, Yangfen Xing, Mingyue Zhang, and Jishu Zhou. 2024. "Inhibitory Effect of Prickly Ash (Zanthoxylum bungeanum) Seed Kernel Oil on Lipid Metabolism of Grass Carp (Ctenopharyngodon idellus) in High-Fat Diet" Fishes 9, no. 4: 123. https://doi.org/10.3390/fishes9040123