
A Cross-Decadal Change in the Fish and Crustacean Community of Lower Yaquina Bay, Oregon, USA

Department of Fisheries, Wildlife, and Conservation Sciences, Oregon State University, Corvallis, OR 97330, USA
*
Author to whom correspondence should be addressed.
Fishes 2024, 9(4), 125; https://doi.org/10.3390/fishes9040125
Submission received: 27 February 2024
/
Revised: 26 March 2024
/
Accepted: 28 March 2024
/
Published: 30 March 2024
(This article belongs to the Special Issue Biomonitoring and Conservation of Freshwater & Marine Fishes)
Abstract
:Natural environmental change, anthropogenic development, and inter-annual variability can affect the ecology of estuarine fish and invertebrates. Yaquina Bay, Oregon, a well-studied estuary, has undergone intense development, as well as deep-draft dredging during the latter half of the 20th century, resulting in the alteration of ~45% of the lower estuary’s natural shoreline. In 1967, the United States Environmental Protection Agency (USEPA) conducted a 21-month survey of Yaquina Bay to characterize the demersal fishes and epibenthic crustaceans that occupy the bay. From 2003 to 2005, we conducted a 25-month survey to replicate that work and provide a comparative snapshot of the demersal fish and epibenthic crustacean community in the bay. A comparison of the trawl survey datasets reveals a 91% decline in total catch per unit effort (CPUE) between surveys, as well as a decline in multiple measures of biodiversity. Furthermore, the fishes and crustaceans of Yaquina Bay have experienced a shift in species dominance from demersal fishes in the late 1960s to epibenthic crustaceans in the 2000s, marked most notably by a nine-fold increase in the Dungeness crab CPUE. While this work does not establish a causal relationship between changes in the demersal communities of this West Coast estuary and human or natural events, it does document substantial changes in both the diversity and total abundance of animals in that community over a three-plus decade period of development and environmental variability. Hence, this forms a second baseline for continued long-term monitoring.
Keywords:
long-term monitoring; community change; habitat alteration; diversity; abundance; natural variability; estuariesKey Contribution: Our work documents a multi-decadal change in faunal abundance, diversity, and dominance in a highly developed northeast Pacific estuary. While causal mechanisms are not identified, estuarine development and a changing climate likely contribute to these changes.
1. Introduction
Shoreline development and watershed urbanization are well-demonstrated drivers of coastal ecosystem change. Physical development, including shoreline armoring and construction of hardened structures, disrupts benthic communities, thereby reducing prey resources for nearshore fish and wildlife [1] and habitat available for epibenthic crustaceans [2]. It is possible that even small, human-built structures influence habitat structure, fish distribution, migration, feeding behavior, and availability of prey resources [3]. Chemical alterations, in the form of nutrient and pollutant inputs, have effects ranging from altering primary productivity and microbial community composition to changing community structure [4,5,6,7]. Other activities associated with the urbanization of estuaries, such as channel dredging for ship operations, alter available habitat and tidal flow, with subsequent biotic impacts [8]. These types of impacts are widespread and long occurring [9], and it is likely that ecosystem change continues to occur in estuaries throughout the United States and elsewhere. Long-term monitoring of these types of changes, or even contemporary point comparisons with historical data, however, are rare [10], but see [7], so it is often difficult to understand the long-term effect of urbanization on estuarine biotic communities.
Yaquina Bay, a 15.8 km2 drowned river mouth estuary on the central Oregon coast, is the fourth largest estuary in Oregon and is classified as “developed, deep draft” by the Oregon Department of Land Conservation and Development [11]. The bay experiences mixed-semidiurnal tides that influence the Yaquina River as far as 42 km upstream [12]. Local river flow is highest during the rainy winter months when discharge reaches nearly 70 m3s−1 [13]. Yaquina Bay is also a well-recognized juvenile nursery ground for commercially important species on the central coast, including the Dungeness crab, flatfish and rockfish [14,15,16,17].
The port and town of Newport and adjacent South Beach, located in the lower part of the bay, have undergone intense shoreline development since the 1940s. In addition to supporting logging ships and a commercial fishing fleet, the last half of the past century has brought an extended armored inlet, a deeper channel, a public marina, an expanded marine laboratory, waterfront shopping, shoreline condominiums, a liquid natural gas storage plant, and, most recently, a fully revamped, international terminal and facility to support a fleet of scientific research vessels at Oregon State University’s Hatfield Marine Science Center [18,19,20]. These installations in the lower estuary of Yaquina Bay have resulted in the alteration of at least 45% of the natural shoreline (as calculated directly from the Oregon Coastal Management Plan’s Coastal Atlas [21] and may have changed river and tidal hydrology, salinity, dissolved oxygen, and temperatures as well [22]. Each of these installations required shoreline development, environmental mitigation, and continued maintenance that may have sustained impacts on the quality of the habitat in Yaquina Bay for both resident and seasonal inhabitants of the estuary. Newport, as a deep-draft estuary, has a main channel regularly dredged to a depth of 13.2 m, deepened from 8.5 m in 1969 [20], with dredge spoil deposited in USACE/USEPA designated locations in the nearshore area adjacent to the mouth of the bay.
In 1967–1968, the United States Environmental Protection Agency (USEPA) conducted a 21-month trawl survey of Yaquina Bay to investigate the spatio-temporal fluctuations in the distribution and abundance of demersal fishes and epibenthic crustaceans [23]. This survey included 42 bi-weekly otter trawls across 10 stations in Yaquina Bay, spanning five previously identified salinity and temperature ranges [24,25]. Yaquina Bay has since been the subject of consistent monitoring, experimentation, and evaluation, with over 1400 theses, dissertations, white papers, and peer-reviewed documents referencing Yaquina Bay being published since 1968 (bibliographic database maintained by the Oregon State University Hatfield Marine Science Center Guin Library [26]). Throughout the 1970s, fish research in the bay focused on fish ecology, with an emphasis on the effect of local upwelling conditions and the bay’s role in recruitment and capacity as a nursery ground [14,15,17,27,28,29,30,31,32]. However, no long-term repeated assessments of the demersal community at the scale of De Ben et al. [23] have been conducted since that original study. In 2003, we began a 25-month trawl survey intended to replicate that work for the first three of the five salinity and temperature ranges previously identified in Yaquina Bay. Our goal was to provide an updated snapshot following multiple decades of shoreline development and environmental change and to determine what, if any, impacts those changes may have had on community structure and diversity.
2. Materials and Methods
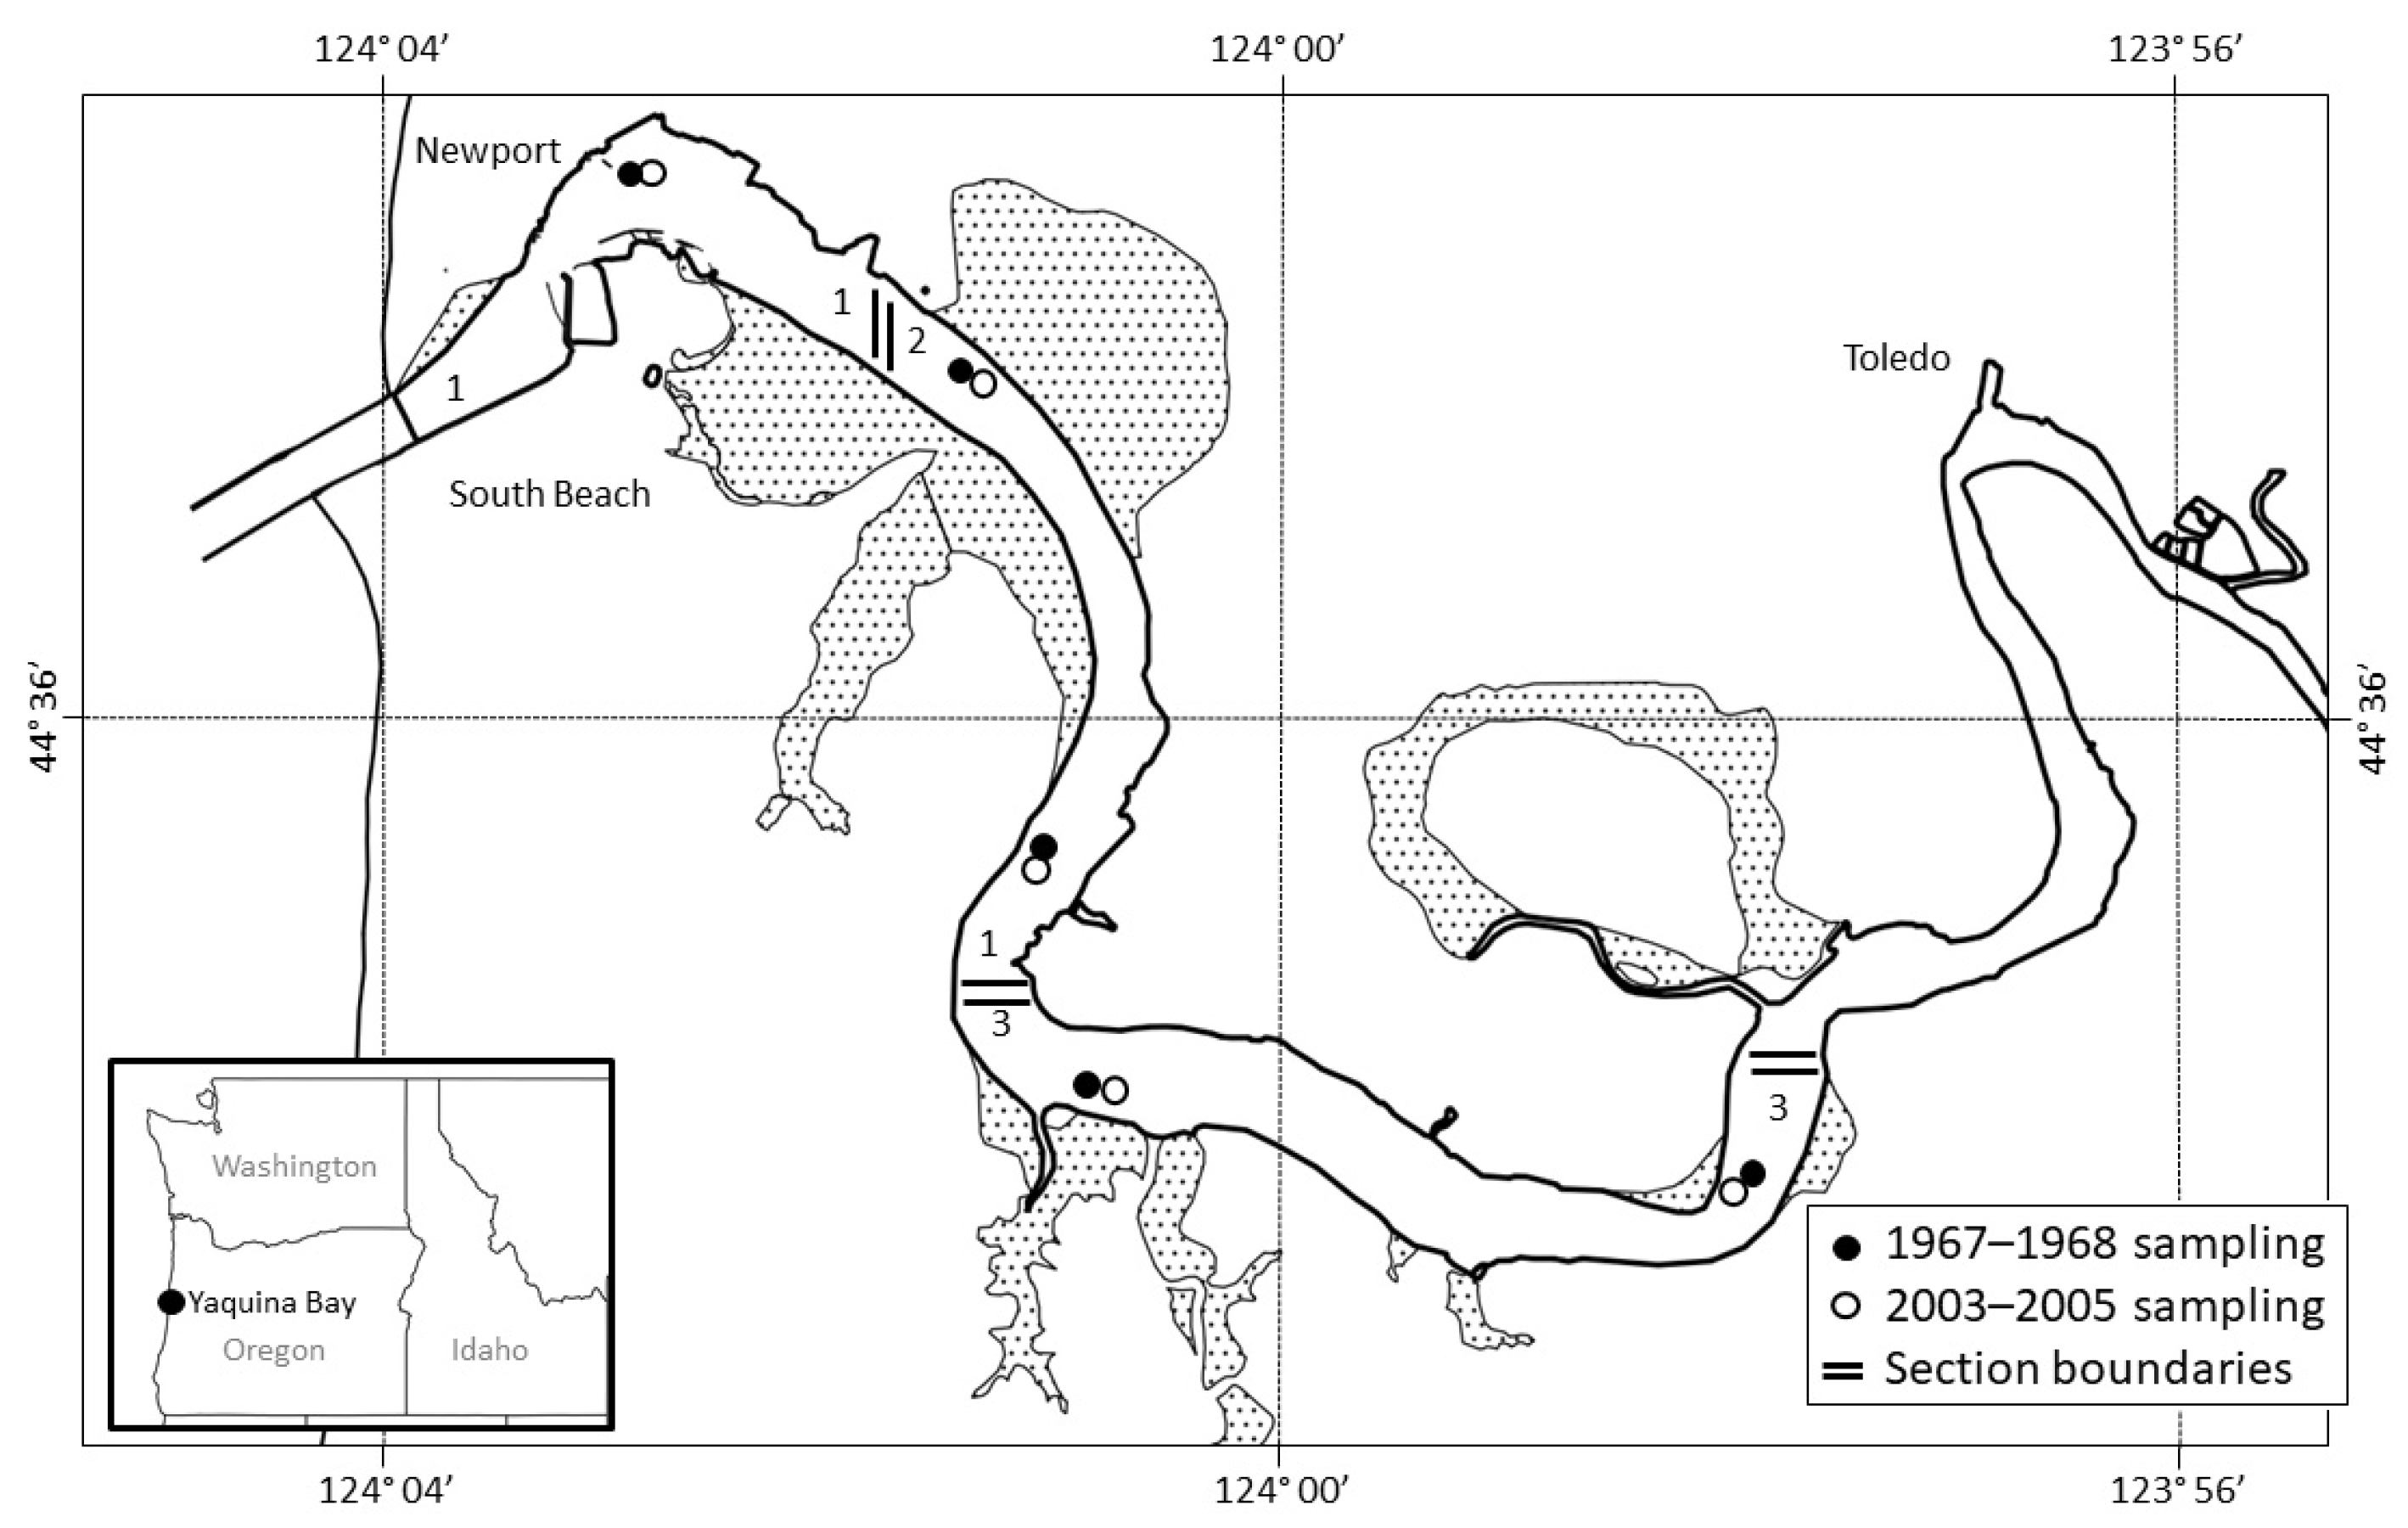
We conducted bi-weekly otter trawls at five sampling locations in Yaquina Bay from January 2003 to October 2005 (Figure 1), resulting in a total of 139 net sets, compared with the 126 net sets during the 1967–1968 survey. Estuary sections sampled based on salinity and temperature regimes followed the original survey [23]; however, the 2003–2005 trawl sampling was confined to sections 1–3 of Yaquina Bay. All sampling of demersal fish and epibenthic crustaceans occurred during daylight hours, following slack high tide in water depths ranging from 2 to 10 m, with a mean of 3.7 m. Trawl samples were collected using a two-seam, 3.5 m treated nylon shrimp trawl with 3.4 cm body netting and 1.3 cm cod end netting, the same style net used by De Ben and co-workers in the original study [23]. To retain smaller organisms, a 9.5-mm cod end liner was sewn into the net. All trawling was conducted against the prevailing current, and trawl duration was standardized to ten minutes, which facilitated catch per unit effort (CPUE) comparisons with the 1967–1968 survey data published by [23].
All captured organisms were identified to the lowest possible taxonomic level, measured, and released at the point of capture. Fish and shrimp were measured to the nearest millimeter total length, and crabs were measured across the widest point of the carapace in millimeters. Bottom water temperature and salinity were measured before each trawl using a YSI model 85 handheld multi-meter. Environmental and CPUE data for sections 1–3 of Yaquina Bay were compared between the 2003–2005 survey and the 1967–1968 survey [23].
Catch per unit effort (CPUE) was calculated by dividing the catch of species X by the number of trawls Y from each survey. Additionally, measures of biodiversity were compared between the two time periods using species richness, Simpson’s index [33], the Shannon–Wiener index of diversity [34], Margalef’s species richness index [35], and Shannon’s evenness index [36]. As the original data analyzed by De Ben et al. [23] were unavailable, the comparisons presented herein were made using the data from their manuscript alone. All work was conducted under an approved Animal Care and Use Protocol issued by the Oregon State University Institutional Animal Care and Use Committee.
3. Results
Most environmental data were similar across the two time periods, with the exception that 1968 was a wetter year than 2003–2005 for Yaquina Bay, and summer (June–September) bottom water temperatures were higher in the 1967–1968 survey (Table 1).
Thirty species of fish and invertebrates from 19 families were captured in sections 1–3 of Yaquina Bay during the 2003–2005 trawl survey. This is a sharp decline from the catch reported in the 1967–1968 survey, where 60 species from 30 families were captured in the same sections (Table 2). The CPUE of all individuals in the top 95% of the catch declined by 91% between surveys, with demersal fish CPUE declining by 96% and epibenthic crustacean CPUE (excluding Dungeness crab; see below) declining by ~67% (Table 3). Section 2 of Yaquina Bay contained the largest percentage of the total catch in the 2003–2005 survey, followed closely by sections 3 and 1. This pattern was identical to the 1967–1968 survey. These sections also showed the smallest change in diversity indices between the two sampling periods.
The families Embiotocidae and Cottidae were the most represented families in the 2003–2005 trawl survey; Embiotocidae was the most represented family in 1967–1968. English sole (Parophrys vetulus; #1 in abundance in 1967–1968) and Dungeness crab (Metacarcinus magister; #4 in abundance in 1967–1968) were the dominant species in the 2003–2005 survey; however, the relative abundance of these two species to each other changed from 7.39:1 (P. vetulus:C. magister) during 1967–1968 to 1:2.25 in 2003–2005, a proportional change of approximately 1600%. Dungeness crab was the only one of the top 20 species to see an increase in total catch and CPUE between the two time periods. When the Dungeness crab is included in the epibenthic crustacean CPUE calculations, epibenthic crustacean CPUE between the sampling periods increases by ~9%. Males dominated the Dungeness crab catch in 2003–2005, and 93% of the Dungeness crabs captured were sublegal in size [37] with a mean carapace width of 74 mm. Male Dungeness crabs were also dominant during the 1967–1968 survey, where 100% of the Dungeness crabs caught at that time were reported as sublegal in size [23], although actual sizes were not reported for that survey. The minimum legal size for Dungeness crab in Oregon, established in 1964 (Oregon Department of Fish and Wildlife), is 146 mm (5.25″) and 159 mm (6.25″) for recreational and commercial harvest, respectively.
Measures of biodiversity were calculated for both the 2003–2005 trawl survey and the 1967–1968 survey (Table 4). With the exception of Simpson’s index and Shannon’s evenness index, estimates of biodiversity decreased in all bay sections between surveys. This decline in biodiversity, when paired with a ~10% increase in total epibenthic crustacean catch in the 2003–2005 survey, provides evidence of a shift in community dominance. This shift was driven principally by the Dungeness crab in the 2003–2005 survey, which comprised 86% of the epibenthic crustacean catch and 48% of the total catch.
4. Discussion
Our re-visitation of De Ben and co-worker’s [23] comprehensive trawl survey provides an updated assessment of the benthic community in a northeast Pacific coastal estuary during the latter half of the past century. While we cannot establish direct causal mechanisms for any differences observed in presence/absence, diversity, or abundance, several compelling trends of change are evident between the two time periods covered by this work.
Most significantly, total CPUE dropped by 91% between the two survey periods. This highlights a tremendous decline in estuarine species abundance and richness in the section of Yaquina Bay that has been most altered by development in the last four decades (Figure 2). Similar declines in abundance have been observed following waterfront development in the southeast United States, where demersal fish and epibenthic crustaceans were less abundant in stretches of shoreline altered by rubble or bulkheads [38], while a broader synthesis aimed at evaluating the ecological impacts of overwater structures (OWSs) in the U.S. Pacific Northwest [3] found that OWSs reduce natural habitat (seagrassess) and prey (abundance and diversity of invertebrate species), and affect the movement, migration, and feeding behaviors of salmonids. Changes to Yaquina Bay have also affected community composition, as most measures of biodiversity declined between surveys. Bilkovic and Roggero [39] found analogous results in Virginia’s James River, a tidal tributary of the Chesapeake Bay, where estuarine communities populating natural shoreline habitat tended to be more diverse than highly developed sites where a few generalist species dominated. Kimball and co-workers [40] worked over a similar decadal time span but evaluated different metrics. They saw a decrease in ichthyofaunal abundance and a shift from pelagic to benthic finfish dominance. Recent work in Yaquina Bay indicates, too, that natural seagrass habitat supports a richer and more abundant fish community than anthropogenic structures [41].
English sole and Dungeness crab were the most abundant fish and invertebrate species in both surveys, but the relative dominance of finfish to crustaceans changed dramatically between the two time periods. Although the total catch proportion by section represented by these two species was similar in both surveys, the ratio of finfish to crustaceans was drastically lower in 2003–2005 (0.8:1) than in 1967–1968 (5.5:1). Dungeness crab comprised over 48% of the total catch in 2003–2005 but only 5% of the catch in 1967–1968. Despite the potential for minor variations between studies in exact sampling technique (distance towed, tow speed, sampling gear type) to inflate the 2003–2005 crab catch, we used the same gear type and attempted to replicate the sampling effort as closely as possible to that of De Ben and co-workers [23], so any sampling approach differences likely cannot explain the magnitude of change in finfish and Dungeness crab catch.
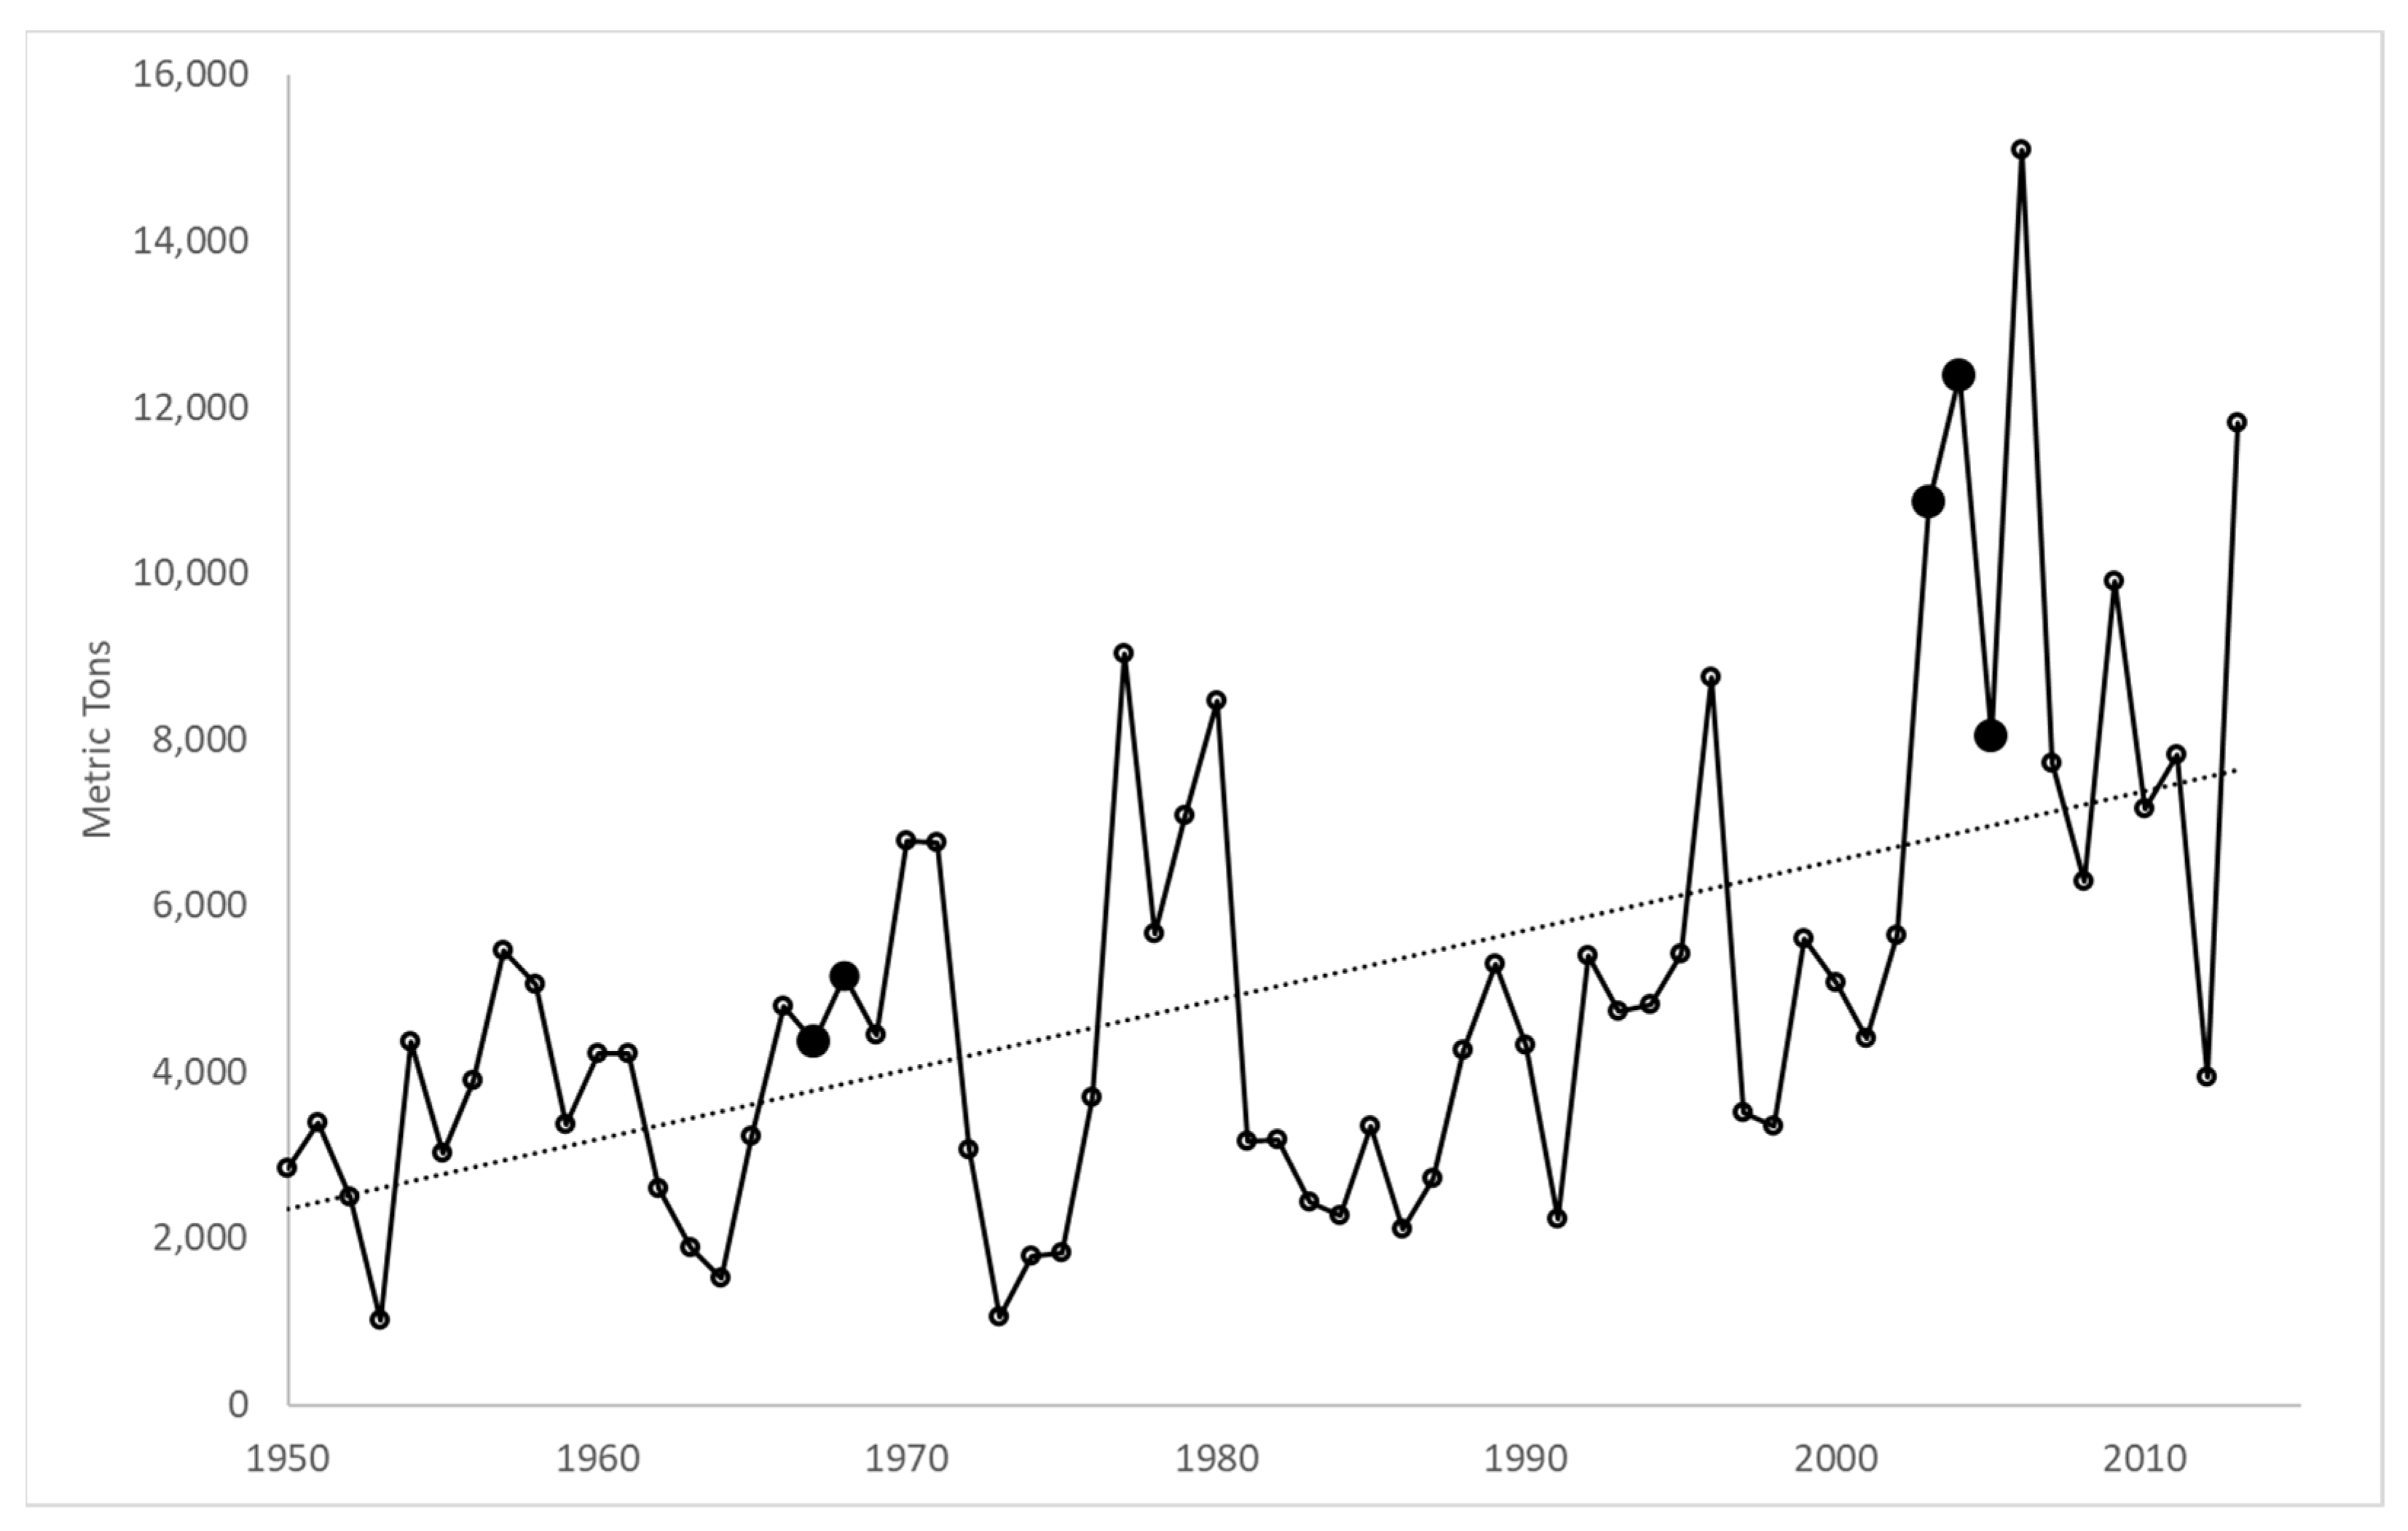
Commercial Dungeness crab catch has increased over the last several decades [43], which indicates a potential overall abundance increase in the ocean region surrounding Yaquina Bay (Figure 3). Oregon’s annual Dungeness crab landings during 1967–1968 averaged 4756 ± 555 metric tons (mean ± SD), whereas in 2003–2005, catch rose significantly to 10,423 ± 2196 metric tons (two-tailed t-test p = 0.0507), with 2004 having the highest catch of any year in the intervening period. Unfortunately, there are no estimates of biomass or CPUE for the Oregon Dungeness crab population, nor are there any effort controls (or measures of effort) on the fishery; therefore, increased harvest could also be explained by increased exploitation rate. In contrast, this does not satisfactorily explain the decline in finfish catch, for which we have no explicit explanation.
Whereas other studies have identified shoreline development as a driver of community change in estuarine systems [38,39], we acknowledge that our study is only indirectly indicative of these changes. Further evaluation of whether development is the driver of community change in Oregon estuaries like Yaquina Bay would require a different approach, either through tracking changes in community composition during experimental restoration efforts or a multi-estuary study across estuaries experiencing different levels of development. Scientific research in the bay has proliferated since our 2003–2005 survey. Questions about the patterns of dissolved oxygen, nutrient transport, and coastal water mass coupling have addressed the physical ecology of the bay [44,45]. Invertebrate research has centered on the cultivation of the Pacific oyster (Crassostrea gigas) and the ecology of mud shrimp [46,47,48], whereas submerged aquatic vegetation research has monitored the interaction of eelgrass and macroalgae relative to shoreline erosion and tracked the production of the invasive eelgrass, Zostera japonica [49,50,51]. Marine fish research has investigated the habitat preferences of juvenile lingcod and rockfishes, as well as concerns about the effects of upland contaminants on out-migrating salmon smolts [17,32,41,52,53,54]. Spencer et al. [54] conducted a camera sled survey of Yaquina Bay to estimate the abundance of juvenile flatfishes, but that is the only other research (besides ours) to catalog the benthic marine fish community of the bay on a broad scale since the 1967–1968 survey [23].
5. Conclusions
This work is a meaningful contribution to our understanding of how the animal community in estuaries changes. Long-term monitoring of any system is difficult, but this work can be viewed as a more recent baseline for the benthic marine community structure of Yaquina Bay. It is also valuable to the field of coastal and estuarine science as an endpoint study of community change in a developing port. As shoreline development continues around the world, this work is one example of the potential changes that may result over several decades’ time.
Our work measures fish and epibenthic crustacean community structure in Yaquina Bay, Oregon, USA, as a snapshot survey of the change that is possible following an approximately four-decade period. Our work is a partial replicate of De Ben et al.’s [23] survey design, and we use our results to show ecological changes in the benthic marine community of Yaquina Bay following prolonged and intense development of adjacent natural shoreline, dredging of the main channel, and across a time course of environmental change. Overall, our results suggest that Yaquina Bay has experienced both a substantial decline in the total abundance of demersal species and a shift in benthic community dominance in the last half of the 20th century. The largely similar abiotic conditions during both surveys (excluding 1968 rainfall), the similar patterns of catch rank, and the shift to a dominant crustacean allude to a persistent and local driver of community change. Shoreline development and channelization of Yaquina Bay accelerated during the time that elapsed between the two surveys, and habitat degradation and anthropogenic nutrient input resulting from shoreline development seem likely catalysts of community reorganization. The development of well-designed, multi-metric indicators for estuaries like Yaquina Bay may help track the ecosystem-level impacts of these changes, allowing us to better understand the broader impacts of human development and environmental change on these systems.
Author Contributions
Conceptualization, S.A.H. and S.S.H.; methodology, S.A.H., S.S.H. and M.B.G.; fieldwork, S.A.H., S.S.H., M.B.G. and N.S.A.; formal analysis, S.A.H., S.S.H. and N.S.A.; resources, S.A.H. and S.S.H.; data curation, N.S.A. and M.B.G.; writing—original draft preparation, S.A.H. and N.S.A.; writing, S.A.H., S.S.H. and N.S.A.; visualization, S.A.H. and N.S.A.; supervision, S.A.H., S.S.H., N.S.A. and M.B.G.; project administration, S.A.H. and S.S.H.; funding acquisition, S.A.H. and S.S.H. All authors have read and agreed to the published version of the manuscript.
Funding
This work was funded in part by recurring funding from the Oregon State University Cooperative Institute for Marine Resources Studies (CIMRS) and by Oregon Sea Grant project #NA16RG1039 from the National Oceanic and Atmospheric Administration’s National Sea Grant College Program.
Institutional Review Board Statement
The animal study protocol (Title: Monitoring fish and invertebrates in the Yaquina River and Yaquina Bay from Toledo, Oregon to the Pacific Ocean) was approved by the Institutional Animal Care and Use Committee of Oregon State University Project, ACUP Number: 4402 (Original approval 5 January 2003).
Informed Consent Statement
Not applicable.
Data Availability Statement
The raw data supporting the conclusions of this article will be made available by the authors upon reasonable request.
Acknowledgments
The authors would like to thank Oregon State University’s Marine Team student research group of undergraduate and graduate student volunteers for the collection of much of the trawl data and measurement of physical parameters. Marissa Litz and Andrew Claiborne assisted with edits on an earlier version of this manuscript. Ted Dewitt of the USEPA provided excellent discussions early on in the project’s formation. We would also like to acknowledge Dewitt’s attempts to track down the original De Ben data, only to find a pile of water-damaged, worm-eaten computer punch cards. Finally, thanks to two anonymous reviewers whose efforts have helped improve this manuscript.
Conflicts of Interest
The authors declare no conflicts of interest.
References
- Sobocinski, K.L.; Cordell, J.R.; Simenstad, C.A. Effects of shoreline modifications on supratidal macroinvertebrate fauna on Puget Sound, Washington beaches. Estuaries Coasts 2010, 33, 699–711. [Google Scholar] [CrossRef]
- Long, C.W.; Grow, J.N.; Majoris, J.E.; Hines, A.H. Effects of anthropogenic shoreline hardening and invasion by Phragmites australis on habitat quality for juvenile blue crabs (Callinectes sapidus). J. Exp. Mar. Biol. Ecol. 2011, 409, 215–220. [Google Scholar] [CrossRef]
- Lambert, M.; Ojala-Barbour, R.; Vadas, R., Jr.; McIntyre, A.A.; Quinn, T. Do small overwater structures impact marine habitats and biota? Pac. Con. Biol. 2024, 30, PC22037. Available online: https://www.publish.csiro.au/PC/PC22037. [CrossRef]
- Engle, V.D.; Summers, J.K.; Gaston, G.R. A benthic index of environmental condition of Gulf of Mexico estuaries. Estuaries 1994, 17, 372–384. [Google Scholar] [CrossRef]
- Cao, Y.; Cherr, G.N.; Córdova-Kreylos, A.L.; Fan, T.W.-M.; Green, P.G.; Higashi, R.M.; LaMontagne, M.G.; Scow, K.M.; Vines, C.A.; Yuan, J.; et al. Relationships between sediment microbial communities and pollutants in two California salt marshes. Microb. Ecol. 2006, 52, 619–633. [Google Scholar] [CrossRef]
- Carpenter, S.R.; Caraco, N.F.; Correll, D.L.; Howarth, R.W.; Sharpley, A.N.; Smith, V.H. Non-point pollution of surface waters with phosphorus and nitrogen. Ecol. Appl. 1998, 8, 559–568. [Google Scholar] [CrossRef]
- Rothenberger, M.B.; Swaffield, T.; Calomeni, A.J.; Cabrey, C.D. Multivariate analysis of water quality and plankton assemblages in an urban estuary. Estuaries Coasts 2014, 37, 695–711. [Google Scholar] [CrossRef]
- Van Dolah, R.F.; Calder, D.R.; Knott, D.M. Effects of dredging and open-water disposal on benthic macroinvertebrates in a South Carolina estuary. Estuaries 1984, 7, 28–37. [Google Scholar] [CrossRef]
- Lotze, H.K.; Lenihan, H.S.; Bourque, B.J.; Bradbury, R.H.; Cooke, R.G.; Kay, M.C.; Kidwell, S.M.; Kirby, M.X.; Peterson, C.H.; Jackson, J.B.C. Depletion, degradation, and recovery potential of estuaries and coastal seas. Science 2006, 312, 1806–1809. [Google Scholar] [CrossRef]
- Wolfe, D.A.; Champ, M.A.; Flemer, D.A.; Mearns, A.J. Long-term biological data sets: Their role in research, monitoring, and management of estuarine and coastal marine systems. Estuaries 1987, 10, 181–193. [Google Scholar] [CrossRef]
- DLCD (Oregon Department of Land Conservation and Development). The Oregon Estuary Plan Book. 1987. Available online: www.inforain.org/oregonestuary/ (accessed on 30 June 2015).
- Pearcy, W.G.; Myers, S.S. Larval fishes of Yaquina Bay, Oregon: A nursery ground for marine fishes? Fish Bull. 1974, 72, 201–213. [Google Scholar]
- Emmett, R.L.; Llanso, R.; Newton, J.; Thom, R.; Hornberger, M.; Morgan, C.; Levings, C.; Copping, A.; Fishman, P. Geographic signatures of North American West Coast estuaries. Estuaries 2000, 23, 765–792. [Google Scholar] [CrossRef]
- Krygier, E.E.; Pearcy, W.G. The role of estuarine and offshore nursery areas for young English sole, Paraphrys vetulus Girard, of Oregon. Fish Bull. 1986, 84, 119–132. [Google Scholar]
- Boehlert, G.W.; Mundy, B.C. Recruitment dynamics of metamorphosing English sole, Parophorys vetulus, to Yaquina Bay, Oregon. Estuar. Est. Coast. Shelf Sci. 1987, 25, 261–281. [Google Scholar] [CrossRef]
- Armstrong, D.A.; Rooper, C.; Gunderson, D.R. Estuarine production of juvenile Dungeness crab (Cancer magister) and contribution to the Oregon-Washington coastal fishery. Estuaries 2003, 26, 1174–1189. [Google Scholar] [CrossRef]
- Dauble, A.D.; Heppell, S.A.; Johansson, M.L. Settlement patterns of young-of-the-year rockfish among six Oregon estuaries experiencing different levels of human development. Mar. Ecol. Prog. Ser. 2012, 448, 143–154. [Google Scholar] [CrossRef]
- Bottin, R.R.; Briggs, M.J. Newport North Marina, Yaquina Bay, Oregon, Design for Wave Protection: Coastal Model Investigation; United States Army Corps of Engineers Technical Report CERC-96-2; 1996. [Google Scholar]
- Good, J.W. Estuary development with implications for management: A case study of Northwest Natural Gas Company’s liquified natural gas (LNG) project at Yaquina Bay, Oregon. Department of Oceanography, Oregon State University; 1975 Corvallis, OR. Port of Newport. History of the Port of Newport. 2012. Available online: www.portofnewport.com (accessed on 3 July 2012).
- USACE. U.S. Army Corps of Engineers: Yaquina Bay. U.S. Army Corps of Engineers. 2012. Available online: www.nwp.usace.army.mil/locations/yaquinabay.asp (accessed on 3 July 2012).
- Oregon Coast Management Program (OCMP) (2016) Estuary Planning. Available online: https://www.oregon.gov/lcd/OCMP/Pages/Estuary-Planning.aspx (accessed on 28 March 2024).
- Brown, C.A.; Power, J.H. Historic and recent patterns of dissolved oxygen in the Yaquina Estuary (Oregon, USA): Importance of anthropogenic activities and oceanic conditions. Estuar. Coast Shelf Sci. 2011, 92, 446–455. [Google Scholar] [CrossRef]
- De Ben, W.A.; Clothier, W.D.; Ditsworth, G.R.; Baumgartner, D.J. Spatio-temporal fluctuations in the distribution and abundance of demersal fish and epibenthic crustaceans in Yaquina Bay, Oregon. Estuaries 1990, 13, 469–478. [Google Scholar] [CrossRef]
- Frolander, H.F. Biological and chemical features of tidal estuaries. J. Water Pollut. Control Fed. 1964, 36, 1037–1048. [Google Scholar]
- Wares, P.G. Biology of the Pile Perch, Rhacochilus vacca, in Yaquina Bay, Oregon; United States Bureau of Sports Fisheries and Wildlife Technical Paper 57; U.S. Fish and Wildlife Service: Washington, DC, USA, 1971.
- Oregon State University Hatfield Marine Science Center Guin Library. Available online: https://yaquina.library.oregonstate.edu/ (accessed on 28 March 2024).
- Frolander, H.F.; Miller, C.B.; Flynn, M.J. Seasonal cycles of abundance in zooplankton populations of Yaquina Bay Oregon. Mar. Biol. 1973, 21, 277–288. [Google Scholar] [CrossRef]
- Krygier, E.E.; Johnson, W.C.; Bond, C.E. Records of California tonguefish, threadfin shad and smooth alligatorfish from Yaquina Bay, Oregon. Cal. Fish Game. 1973, 59, 140–142. [Google Scholar]
- Richardson, S.L.; Pearcy, W.G. Coastal and oceanic fish larvae in an area of upwelling off Yaquina Bay, Oregon. Fish Bull. 1977, 75, 125–145. [Google Scholar]
- Barton, M. Comparative distribution and habitat preferences of 2 species of stichaeoid fishes in Yaquina Bay, Oregon. J. Exp. Mar. Biol. Ecol. 1982, 59, 77–87. [Google Scholar] [CrossRef]
- Bond, C.E.; Kan, T.T.; Myers, K.W. Notes on the marine life of the river lamprey, Lampetra ayresi in Yaquina Bay, Oregon, and the Columbia River estuary. Fish Bull. 1983, 81, 165–167. [Google Scholar]
- Gallagher, M.B.; Heppell, S.S. Essential habitat identification for age-0 rockfish along the central Oregon coast. Mar. Coastal. Fish 2010, 2, 60–72. [Google Scholar] [CrossRef]
- Simpson, E.H. Measurement of diversity. Nature 1949, 163, 688. [Google Scholar] [CrossRef]
- Shannon, C.E.; Weaver, W. The Mathematical Theory of Communication; University of Illinois Press: Champaign, IL, USA, 1949. [Google Scholar]
- Margalef, R. Perspectives in Ecological Theory; University of Chicago Press: Chicago, IL, USA, 1968. [Google Scholar]
- Pielou, E.C. An Introduction to Mathematical Ecology; Wiley: New York, NY, USA, 1969. [Google Scholar]
- Pauley, G.B.; Armstrong, D.A.; Van Citter, R.; Thomas, G.L. Species profiles: Life histories and environmental requirements of coastal fishes and invertebrates (Pacific Southwest)—Dungeness Crab. USFWS Biol. Rep. 1989, 82, TR EL-82-4. [Google Scholar]
- Peterson, M.S.; Comyns, B.H.; Hendon, J.R.; Bond, P.J.; Duff, G.A. Habitat use by early life-history stages of fishes and crustaceans along a changing estuarine landscape: Differences between natural and altered shoreline sites. Wetl. Ecol. Manag. 2000, 8, 209–219. [Google Scholar] [CrossRef]
- Bilkovic, D.M.; Roggero, M.M. Effects of coastal development on nearshore estuarine nekton communities. Mar. Ecol. Prog. Ser. 2008, 358, 27–39. [Google Scholar] [CrossRef]
- Kimball, M.E.; Pfirrmann, B.W.; Allen, D.M.; Ogburn-Matthews, V.; Kenny, P.D. Intertidal creek pool nekton assemblages: Long-term patterns in diversity and abundance in a warm-temperate estuary. Estuaries Coasts 2023, 46, 860–877. [Google Scholar] [CrossRef]
- Schwartzkopf, B.D.; Dauble, A.D.; Lindsley, A.J.; Heppell, S.A. Temporal and habitat differences in the juvenile demersal fish community at a marine-dominated northeast Pacific estuary. Fish Res. 2020, 227, 105557. [Google Scholar] [CrossRef]
- NOAA. Fisheries Statistics: Commercial landings, Dungeness crab in Oregon from 1967–2010, NOAA Fisheries OST. 2012. Available online: www.st.nmfs.noaa.gov/st1/commercial/landings/annual_landings.html (accessed on 3 July 2012).
- Sigleo, A.C.; Frick, W.E. Seasonal variations in river discharge and nutrient export to a Northeastern Pacific estuary. Coast. Shelf Sci. 2007, 73, 368–378. [Google Scholar] [CrossRef]
- Brown, C.A.; Ozretich¸, R.J. Coupling between the coastal ocean and Yaquina Bay, Oregon: Importance of oceanic inputs relative to other nitrogen sources. Estuaries Coasts 2009, 32, 219–237. [Google Scholar] [CrossRef]
- Camara, M.D.; Evans, S.; Langdon, C.J. Parental relatedness and survival of Pacific oysters from a naturalized population. J. Shellfish Res. 2008, 27, 323–336. [Google Scholar] [CrossRef]
- D’Andrea, A.F.; DeWitt, T.H. Geochemical ecosystem engineering by the mud shrimp Upogebia pugettensis (Crustacea: Thalassinidae) in Yaquina Bay, Oregon: Density-dependent effects on organic matter remineralization and nutrient cycling. Limnol. Oceanogr. 2009, 54, 1911–1932. [Google Scholar] [CrossRef]
- Repetto, M.; Griffen, B.D. Physiological consequences of parasite infection in the burrowing mud shrimp, Upogebia pugettensis, a widespread ecosystem engineer. Mar. Fresh Res. 2012, 63, 60–67. [Google Scholar] [CrossRef]
- Kaldy, J.E. Production ecology of the non-indigenous seagrass, dwarf eelgrass (Zostera japonica Ascher & Graeb), in a Pacific Northwest estuary, USA. Hydrobiologia 2006, 553, 201–217. [Google Scholar]
- Boese, B.L.; Robbins, B.D. Effects of erosion and macroalgae on intertidal eelgrass (Zostera marina) in a northeastern Pacific estuary (USA). Bot. Mar. 2008, 51, 247–257. [Google Scholar] [CrossRef]
- Hessing-Lewis, M.L.; Hacker, S.D.; Menge, B.A. Context-dependent eelgrass-macroalgae interactions along an estuarine gradient in the Pacific Northwest, USA. Estuaries Coasts 2011, 34, 1169–1181. [Google Scholar] [CrossRef]
- Petrie, M.E.; Ryer, C.H. Laboratory and field evidence for structural habitat affinity of young-of-the-year lingcod. Trans. Am. Fish Soc. 2006, 135, 1622–1630. [Google Scholar] [CrossRef]
- Johnson, L.L.; Ylitalo, G.M.; Arkoosh, M.R. Contaminant exposure in outmigrant juvenile salmon from Pacific Northwest estuaries of the United States. Environ. Monit. Assess 2007, 124, 167–194. [Google Scholar] [CrossRef] [PubMed]
- Schwartzkopf, B.D.; Heppell, S.A. A feeding ecology-based approach to evaluating nursery potential of estuaries for Black Rockfish. Mar. Coast. Fish 2020, 12, 124–141. [Google Scholar] [CrossRef]
- Spencer, M.L.; Stoner, A.W.; Ryer, C.H.; Munk, J.E. A towed camera sled for estimating abundance of juvenile flatfishes and habitat characteristics: Comparison with beam trawls and divers. Est. Coast. Shelf. Sci. 2005, 64, 497–503. [Google Scholar] [CrossRef]
Figure 1.
Map of Yaquina Bay, Oregon, with sampling locations for both the 1967–1968 (closed circles) and 2003–2005 (open circles) surveys. Sampling sections 1, 2, and 3, as designated by [23] and replicated for this study, are indicated by solid lines separating sections of the estuary. The present study collected comparative data for the three lower bay sections, chosen to facilitate direct comparison with historical data.

Figure 2.
Aerial images of lower Yaquina Bay from (A) 1939 and (B) 2015. Numbered blocks indicate major changes in bay structure and dredging since 1967–1968 as follows: (1) 1969: Channel depth change from 26′ to 40′ deep, (2) 1970s–1990s: Expansion of Oregon State University’s Hatfield Marine Science Center to contemporary footprint, (3) 1972: South Jetty 1800′ extension, (4) 1978: Oregon Aqua Foods facility, (5) 1978–1979: South Beach Marina construction, (6) 1976: Liquid natural gas storage facility, (7) 1974–1977: Embarcadero condominiums, (8) 1992: Oregon Coast Aquarium, and (9) 2011–2012: NOAA Marine Operations Center Pacific (MOC-P), which was built at the site of Oregon Aqua Foods and included the dredging, filling, and construction of a ship pier. Note that the NOAA MOC-P site was not in place at the time of our survey. Image A courtesy of Hatfield Marine Science Center. Image B from [42].

Figure 3.
Annual commercial landings (metric tons) of Dungeness crab in Oregon from 1950 to 2013. Emphasized (solid) symbols indicate catch during 1967–1968 and 2003–2005. Data from the NOAA Fisheries Commercial Fisheries Statistics online database are accessible online at http://www.st.nmfs.noaa.gov/commercial-fisheries/commercial-landings/ (accessed on 17 August 2023).


Table 1.
Environmental data during the 1967–1968 and 2003–2005 survey periods. Summer is defined here as 1 June to 30 September. Precipitation data for 1967–1968 from U.S. National Weather Service Applied Climate Information System. Precipitation data for 2003–2005 from the OSU Hatfield Marine Science Center weather station archives.
| Environmental Data | 1967, 1968 | 2003, 2004, 2005 |
|---|---|---|
| Mean Monthly Salinity Range | 8–28 | 14–36 |
| Maximum Salinity | 34 | 36.4 |
| Summer Monthly Salinity Range | 16–34 | 24–36.4 |
| Annual Rainfall (cm) | 158, 282 | 176, 150, 158 |
| Summer Bottom Temperature Range (°C) | 21–23 | 12–17 |
| Coldest Bottom Temperature (°C) | 6 | 9 |
Table 2.
Summary table of total number of fish and epibenthic crustaceans caught by species in each of three sections of lower Yaquina Bay in 1967–1968 and 2003–2005. Species are listed in the 1967–1968 rank order of total catch. DeBen et al. (1990) conducted 126 net sets in sections 1–3. A total of 139 net sets were conducted for this study.
| Common Name | Scientific Name | 1967–1968 | 2003–2005 | ||||
|---|---|---|---|---|---|---|---|
| Section | Section | ||||||
| 1 | 2 | 3 | 1 | 2 | 3 | ||
| English sole | Parophrys vetulus | 379 | 8349 | 2267 | 76 | 996 | 714 |
| Snake prickleback | Lumpenus sagitta | 37 | 2547 | 445 | 0 | 10 | 13 |
| Shiner surfperch | Cymatogaster aggregata | 105 | 1116 | 1119 | 30 | 66 | 300 |
| Dungeness crab | Cancer magister | 323 | 867 | 298 | 130 | 1780 | 2189 |
| Blacktail bay shrimp | Crangon nigricauda | 155 | 1326 | 3 | 27 | 297 | 265 |
| Pile surfperch | Rhacochilus vacca | 58 | 829 | 394 | 4 | 218 | 139 |
| Buffalo sculpin | Enophrys bison | 1170 | 85 | 1 | 0 | 8 | 6 |
| Starry flounder | Platichthys stellatus | 211 | 692 | 317 | 2 | 72 | 42 |
| White seaperch | Phanerodon furcatus | 53 | 587 | 121 | 11 | 1 | 0 |
| California bay shrimp | Crangon franciscorum | 11 | 87 | 603 | 0 | 0 | 0 |
| Opossum shrimp | Neomysis mercedis | 4 | 42 | 590 | 0 | 0 | 0 |
| Pacific staghorn sculpin | Leptocottus armatus | 30 | 395 | 96 | 0 | 57 | 156 |
| Surf smelt | Hypomesus pretiosus | 4 | 28 | 333 | 16 | 161 | 36 |
| Sand sole | Psettichthys melanosticus | 189 | 114 | 36 | 0 | 0 | 0 |
| Speckled sanddab | Citharichthys stigmaeus | 239 | 96 | 1 | 1 | 252 | 30 |
| Striped seaperch | Embiotoca lateralis | 202 | 120 | 1 | 0 | 0 | 0 |
| Walleye surfperch | Hyperprosopon argenteum | 1 | 53 | 226 | 0 | 0 | 0 |
| Kelp greenling | Hexagrammos decagrammus | 154 | 20 | 1 | 0 | 6 | 1 |
| Saddleback gunnel | Pholis ornata | 2 | 85 | 9 | 1 | 6 | 4 |
| Pacific tomcod | Microgadus proximus | 43 | 40 | 4 | 0 | 57 | 9 |
| Northern anchovy | Engraulis mordax | 0 | 2 | 80 | 0 | 0 | 0 |
| Longfin smelt | Spirinchus thaleichthys | 2 | 1 | 76 | 0 | 0 | 0 |
| Red rock crab | Cancer productus | 41 | 3 | 0 | 1 | 28 | 26 |
| Pacific herring | Clupea pallasi | 0 | 8 | 35 | 0 | 19 | 102 |
| Black rockfish | Sebastes melanops | 22 | 14 | 5 | 2 | 27 | 1 |
| American shad | Alosa sapidissima | 1 | 0 | 36 | 0 | 0 | 27 |
| Bay pipefish | Syngnathus leptorhynchus | 3 | 10 | 21 | 0 | 10 | 3 |
| Lingcod | Ophiodon elongatus | 13 | 9 | 2 | 0 | 5 | 3 |
| California coastal shrimp | Heptacarpus paludicola | 8 | 9 | 0 | 0 | 0 | 0 |
| Tube snout | Aulorhynchus flavidus | 1 | 14 | 0 | 10 | 1 | 0 |
| Cabezon | Scorpaenichthys marmoratus | 11 | 4 | 0 | 0 | 1 | 0 |
| Rock greenling | Hexagrammos lagocephalus | 7 | 1 | 1 | 0 | 0 | 0 |
| Redtail surfperch | Amphistichus rhodoterus | 2 | 6 | 1 | 0 | 0 | 0 |
| C-O sole | Pleuronichthys coenosus | 6 | 0 | 0 | 0 | 0 | 0 |
| Three-spined stickleback | Gasterosteus aculeatus | 0 | 0 | 6 | 0 | 0 | 0 |
| Shortspine shrimp | Heptacarpus brevirostris | 1 | 5 | 0 | 0 | 0 | 0 |
| Whitebait smelt | Allosmerus elongatus | 3 | 1 | 0 | 0 | 0 | 0 |
| Tubenose poacher | Pallasina barbata | 3 | 1 | 0 | 0 | 0 | 0 |
| Big skate | Raja binoculata | 1 | 2 | 0 | 0 | 0 | 0 |
| Penpoint gunnel | Apodichthys flavidus | 3 | 0 | 0 | 0 | 0 | 0 |
| California spot prawn | Pandalus platyceros | 1 | 0 | 1 | 0 | 0 | 0 |
| Bay shrimp | Lissocrangon stylirostris | 2 | 0 | 0 | 0 | 0 | 0 |
| Bay goby | Lepidogobius lepidus | 0 | 2 | 0 | 0 | 0 | 0 |
| Pacific sand lance | Ammodytes hexapterus | 1 | 0 | 1 | 0 | 0 | 0 |
| Longnose skate | Raja rhina | 1 | 1 | 0 | 0 | 0 | 0 |
| Copper rockfish | Sebastes caurinus | 1 | 0 | 0 | 0 | 1 | 1 |
| Arrow goby | Clevlandia ios | 0 | 1 | 0 | 0 | 0 | 0 |
| Scalyhead sculpin | Artedius harringtoni | 1 | 0 | 0 | 0 | 0 | 0 |
| Whitespotted greenling | Hexagrammos stelleri | 1 | 0 | 0 | 0 | 0 | 0 |
| Tidepool snailfish | Liparis florae | 1 | 0 | 0 | 0 | 0 | 0 |
| Green sturgeon | Acipenser medirostris | 0 | 0 | 1 | 0 | 0 | 0 |
| Pacific hake | Merluccius productus | 0 | 1 | 0 | 0 | 0 | 0 |
| Wolf eel | Anarrhichthys ocellatus | 1 | 0 | 0 | 0 | 0 | 0 |
| Brown Irish lord | Hemilepidotus spinosus | 1 | 0 | 0 | 0 | 0 | 0 |
| Silver surfperch | Hyperprosopon elliptiicum | 1 | 0 | 0 | 0 | 0 | 0 |
| Vermilion rockfish | Sebastes miniatus | 1 | 0 | 0 | 0 | 0 | 0 |
| Chinook salmon | Oncorhynchus tshawytscha | 0 | 0 | 1 | 0 | 0 | 0 |
| Coho salmon | Oncorhynchus kisutch | 0 | 0 | 1 | 0 | 0 | 0 |
| Prickly sculpin | Cottus asper | 0 | 0 | 1 | 0 | 0 | 0 |
| Dock shrimp | Pandalus danae | 1 | 0 | 0 | 0 | 0 | 0 |
| Porcelain crab | Petrolisthes cinctipes | 0 | 0 | 0 | 0 | 2 | 12 |
| Hermit crab | Pagurus sp. | 0 | 0 | 0 | 0 | 0 | 2 |
| Kelp crab | Pugettia producta | 0 | 0 | 0 | 0 | 6 | 1 |
| Red Irish lord | Hemilepidotus hemilepidotus | 0 | 0 | 0 | 0 | 2 | 0 |
| Pacific sanddab | Citharichthys sordidus | 0 | 0 | 0 | 0 | 1 | 0 |
| Eulachon | Thaleichthys pacificus | 0 | 0 | 0 | 0 | 1 | 0 |
| Totals | 3512 | 17,573 | 7134 | 311 | 4091 | 4082 | |
Table 3.
Catch per unit effort (CPUE) of species comprising the top 95% of the total catch from 1967–1968 and 2003–2005.
Table 3.
Catch per unit effort (CPUE) of species comprising the top 95% of the total catch from 1967–1968 and 2003–2005.
| CPUE of Species in Top 95% of Catch | 1967–1968 | 2003–2005 |
|---|---|---|
| All Individuals | 644.64 | 57.99 |
| Epibenthic Crustaceans (all) | 134.6 | 146.5 |
| Epibenthic Crustaceans (minus Dungeness crab) | 102.6 | 33.73 |
| Demersal Fishes | 542.05 | 24.27 |
Table 4.
Biodiversity indices for all fish and epibenthic crustaceans in three sections of lower Yaquina Bay from 1967–1968 and 2003–2005.
Table 4.
Biodiversity indices for all fish and epibenthic crustaceans in three sections of lower Yaquina Bay from 1967–1968 and 2003–2005.
| 1967–1968 | 2003–2005 | |||||
|---|---|---|---|---|---|---|
| Bay Section | 1 | 2 | 3 | 1 | 2 | 3 |
| Species Richness | 50 | 40 | 36 | 13 | 28 | 24 |
| Simpson’s Index | 0.15 | 0.26 | 0.15 | 0.26 | 0.26 | 0.33 |
| Shannon’s Index | 2.43 | 1.90 | 2.29 | 1.70 | 1.80 | 1.62 |
| Margalef’s Index | 6.00 | 3.99 | 3.94 | 2.09 | 3.25 | 2.77 |
| Shannon’s Evenness | 0.62 | 0.52 | 0.64 | 0.66 | 0.54 | 0.51 |
Disclaimer/Publisher’s Note: The statements, opinions and data contained in all publications are solely those of the individual author(s) and contributor(s) and not of MDPI and/or the editor(s). MDPI and/or the editor(s) disclaim responsibility for any injury to people or property resulting from any ideas, methods, instructions or products referred to in the content. |
© 2024 by the authors. Licensee MDPI, Basel, Switzerland. This article is an open access article distributed under the terms and conditions of the Creative Commons Attribution (CC BY) license (https://creativecommons.org/licenses/by/4.0/).
Share and Cite
MDPI and ACS Style
Heppell, S.A.; Heppell, S.S.; Arbuckle, N.S.; Gallagher, M.B. A Cross-Decadal Change in the Fish and Crustacean Community of Lower Yaquina Bay, Oregon, USA. Fishes 2024, 9, 125. https://doi.org/10.3390/fishes9040125
AMA Style
Heppell SA, Heppell SS, Arbuckle NS, Gallagher MB. A Cross-Decadal Change in the Fish and Crustacean Community of Lower Yaquina Bay, Oregon, USA. Fishes. 2024; 9(4):125. https://doi.org/10.3390/fishes9040125
Chicago/Turabian StyleHeppell, Scott A., Selina S. Heppell, N. Scarlett Arbuckle, and M. Brett Gallagher. 2024. "A Cross-Decadal Change in the Fish and Crustacean Community of Lower Yaquina Bay, Oregon, USA" Fishes 9, no. 4: 125. https://doi.org/10.3390/fishes9040125