
Sustainable Power Generation Expansion in Island Systems with Extensive RES and Energy Storage


1
Electrical and Computer Engineering Department, Hellenic Mediterranean University, GR-71410 Heraklion, Greece
2
Institute of Energy Environment and Climate Change, GR-71410 Heraklion, Greece
*
Author to whom correspondence should be addressed.
Inventions 2023, 8(5), 127; https://doi.org/10.3390/inventions8050127
Submission received: 11 September 2023
/
Revised: 1 October 2023
/
Accepted: 4 October 2023
/
Published: 11 October 2023
(This article belongs to the Special Issue The Development and Optimization of Innovative Systems, Processes, and Materials for the Production, Conversion, and Storage of Energy (Volume 2))
Abstract
:Insular networks constitute ideal fields for investment in renewables and storage due to their excellent wind and solar potential, as well the high generation cost of thermal generators in such networks. Nevertheless, in order to ensure the stability of insular networks, network operators impose strict restrictions on the expansion of renewables. Storage systems render ideal solutions for overcoming the aforementioned restrictions, unlocking additional renewable capacity. Among storage technologies, hybrid battery-hydrogen demonstrates beneficial characteristics thanks to the complementary features that battery and hydrogen exhibit regarding efficiency, self-discharge, cost, etc. This paper investigates the economic feasibility of a private investment in renewables and hybrid hydrogen-battery storage, realized on the interconnected island of Crete, Greece. Specifically, an optimization formulation is proposed to optimize the capacity of renewables and hybrid battery-hydrogen storage in order to maximize the profit of investment, while simultaneously reaching a minimum renewable penetration of 80%, in accordance with Greek decarbonization goals. The numerical results presented in this study demonstrate that hybrid hydrogen-battery storage can significantly reduce electricity production costs in Crete, potentially reaching as low as 64 EUR/MWh. From an investor’s perspective, even with moderate compensation tariffs, the energy transition remains profitable due to Crete’s abundant wind and solar resources. For instance, with a 40% subsidy and an 80 EUR/MWh compensation tariff, the net present value can reach EUR 400 million. Furthermore, the projected cost reductions for electrolyzers and fuel cells by 2030 are expected to enhance the profitability of hybrid renewable-battery-hydrogen projects. In summary, this research underscores the sustainable and economically favorable prospects of hybrid hydrogen-battery storage systems in facilitating Crete’s energy transition, with promising implications for investors and the wider renewable energy sector.
Keywords:
interconnected islands; energy transition; renewables; hybrid storage; hydrogen; batteries1. Introduction
The energy supply of insular networks is characterized by an increased generation cost, mainly due to the use of thermal generators operating with imported fossil fuels [1]. The importation of exhaustible energy resources, with fluctuating fuel prices, eliminates any sense of self-sufficiency and security supply in the islands [2]. Nevertheless, islands exhibit an excellent wind and solar potential, which is rarely realized in the mainland [2,3]. For instance, in Greece, there are more than 100 inhabited islands with average annual wind velocities of around 9.5 m/s, and a solar irradiance of around 1800 kWh/m2 [3]. For comparison, the North Sea, with an excellent wind potential, exhibits an average wind velocity of around 10.5 m/s [4]; while Germany, with the large installed PV capacity, has an annual average solar irradiance of around 1100 kWh/m2 [5]. The excellent renewable potential favors the self-sustainability of the island.
Due to their rapid cost reduction, renewable energy sources (RESs) can be used in insular systems to reduce the electricity generation cost, the dependency on imported fossil fuels, and carbon dioxide emissions [6]. However, the intermittent nature of RESs cannot ensure the uninterruptible energy supply of insular loads during the year. To overcome the drawbacks arising from the variability of RES power, several solutions have been proposed in the literature such as (a) the power curtailment of oversized renewables [7], (b) the interconnection of islands with the mainland [8], and (c) the incorporation of energy storage systems (ESSs) [1,2,3,6]. The first solution entails the oversize of RESs, operating them in a sub-optimal operating point (power curtailment), in order to have available power to deliver after a load rise [7]. This solution is not cost-effective since it requires the installation of a much higher RES capacity than the system needs, resulting in a huge RES power curtailment. The second solution can unlock additional RES penetration on the island and reduce curtailments by balancing the renewable deficit (or surplus) using the power of an interconnection link [8,9]. Currently, several countries such as Greece [8] are planning the interconnection of their islands with the mainland intending to establish an effective energy transition toward their decarbonization. However, insular networks supplied exclusively by interconnection cables suffer from reduced security; for example, several interconnection cable failures have been reported in previous years, causing total power outages for periods ranging from 1 day up to a number of weeks [10]. The third solution entails the integration of ESSs, by storing the renewables’ surplus and releasing it during renewables’ shortfalls [1,2,3]. The cost reduction in ESSs over the last several years has rendered the storage of renewable power competitive [11,12], enabling, in a sustainable way, a total annual RES penetration as high as 90% [2,3,6]. ESSs could also be used in combination with the interconnection link to increase the economic feasibility of RESs and supply security of the island [13].
Based on their operational timescale, ESSs are classified into short-duration, long-duration, and hybrid storage [14]. Short-duration ESSs have a short discharge period and are used for primary and secondary response reserves, black-start, and power quality services [11]. Reference [11] estimates that after 2030, the lithium-ion battery will constitute the most cost-effective short-duration ESS. The long-duration ESSs can provide full power for days or weeks and contribute to energy arbitrage, load shift, tertiary response reserves, and the coverage of long RES shortfalls [15]. Hunter et al. [12] state that for a 12 h storage duration, pumped hydro storage (PHS) and compressed air energy storage (CAES) systems have the lowest levelized cost of energy. However, PHS requires favorable geographical locations for hosting the water reservoir, while CAES requires the existence of deep underground structures, e.g., salt dome. References [12,16] estimate that in the near future hydrogen will constitute the most competitive long-duration storage, especially for discharge times longer than 24 h. Colbertaldo et al. [17] demonstrated that hydrogen storage results in essentially a lower system cost than battery storage, for a totally renewable Californian power system. Similar conclusions are drawn in [18], where the authors concluded that hydrogen could become the fuel of the future as it is inexhaustible, environmentally friendly, and independent from foreign factors.
The hybridization (combined short- and long-duration) of storage is the most cost-effective solution, according to several studies [19,20,21,22,23,24,25,26,27,28], since it combines the benefits of both technologies. References [26,28,29,30] demonstrate that hybrid hydrogen-battery storage is beneficial for insular networks and remote communities thanks to the complementary characteristics of hydrogen and the battery with respect to their efficiency, self-discharge, and cost of storage. Dawood et al. [20] investigated different hybrid storages for remote communities and concluded that battery and hydrogen is the most cost-effective. Puraven et al. [31] and Marocco et al. [24] proved that hydrogen can be utilized to reduce the size of the battery in off-grid applications, thus reducing the cost of electricity significantly. Kharel et al. [25] further proposes that the cost of electricity could be further reduced if the excess hydrogen is utilized in the transportation sector, as well as if the lost heat of fuel cells is recovered for heating purposes. Marocco et al. [23] studied four remote standalone systems with different climate conditions and concluded that hybrid hydrogen and battery storage can significantly reduce or even eliminate fossil fuel consumption in a cost-effective way. In [22], the authors examined different battery and hydrogen technologies, e.g., alkaline and PEM electrolysis, lead acid, and Li-ON battery, and drew the conclusion that hybrid alkaline electrolysis and Li-ON battery storage exhibit the lowest LCOE.
Other studies focus on hybrid hydrogen-battery storage in small- or medium-size commercial/industrial installations, e.g., households, universities, offices, mines, etc. For instance, Kalantari et al. [27] highlights the economic advantages of hybrid hydrogen-battery storage in remote mining systems. Nguyen et al. [32] performed a case study of a fuel cell with a heat recovery system, in the context of an isolated hybrid hydrogen-battery system, for a remote telecommunication application. Dursun et al. [33] deduced that supplying a university campus through solar power and hybrid hydrogen-battery storage can result in important environmental benefits. Peppas et al. [34] showed that a self-sustained trigeneration (power + heat + cooling) system based on renewable hydrogen, for an office building in Greece, results in a considerable reduction in environmental pollution. Lokar et al. [35] studied a pilot Slovenian household and concluded that hybrid hydrogen-battery storage can be a solution for complete self-sufficiency, and that from an economic point of view, such systems are accessible for commercial use. Jafari et al. [36] performed a thermos-economic analysis in a residence supplied by photovoltaics and hybrid hydrogen-battery storage. They deduced that 8 days of autonomy is the most desirable option from an economical point of view, yielding a levelized cost of electricity of 0.286 €/kWh.
This paper investigates hybrid hydrogen-battery storage from a different point of view than that usually approached in the literature, by examining it from the investor’s perspective. It attempts to clarify under what conditions and to what extent the energy transition of Crete toward 80% renewable penetration (Greece intends an energy transition toward 80% renewable penetration until 2030 [37]) is profitable for the investor and citizens of the island, using hybrid hydrogen and battery storage. In our analysis, the current costs of the RES, hydrogen, and battery were applied, while sensitivity analysis was performed to account for the uncertainties of the price of hydrogen. Moreover, different funding schemes, e.g., with or without subsidy, are examined to make the study as realistic as possible. The island of Crete is used as a case study (650 MW peak demand) since it favors the incorporation of new renewable power due to its excellent wind and solar potential, [10] as well as the newly installed interconnection link with the mainland that has unlocked additional renewable capacity. Finally, in order to make the study as realistic and as detailed as possible, real wind, solar, and load data are used for the island of Crete, with an hourly analysis for a whole year. The rest of the paper is structured as follows: Section 2 introduces information about Crete. Section 3 describes the operation of Crete’s power system. Section 4 optimizes the installation of new RES and hybrid hydrogen-battery storage to maximize the profit of the investor. Section 5 presents the results of this study and the sensitivity analysis, while Section 6 concludes the paper.
2. Current Status of Crete’s Economy and Power System
2.1. Economic Situation of Crete’s Island
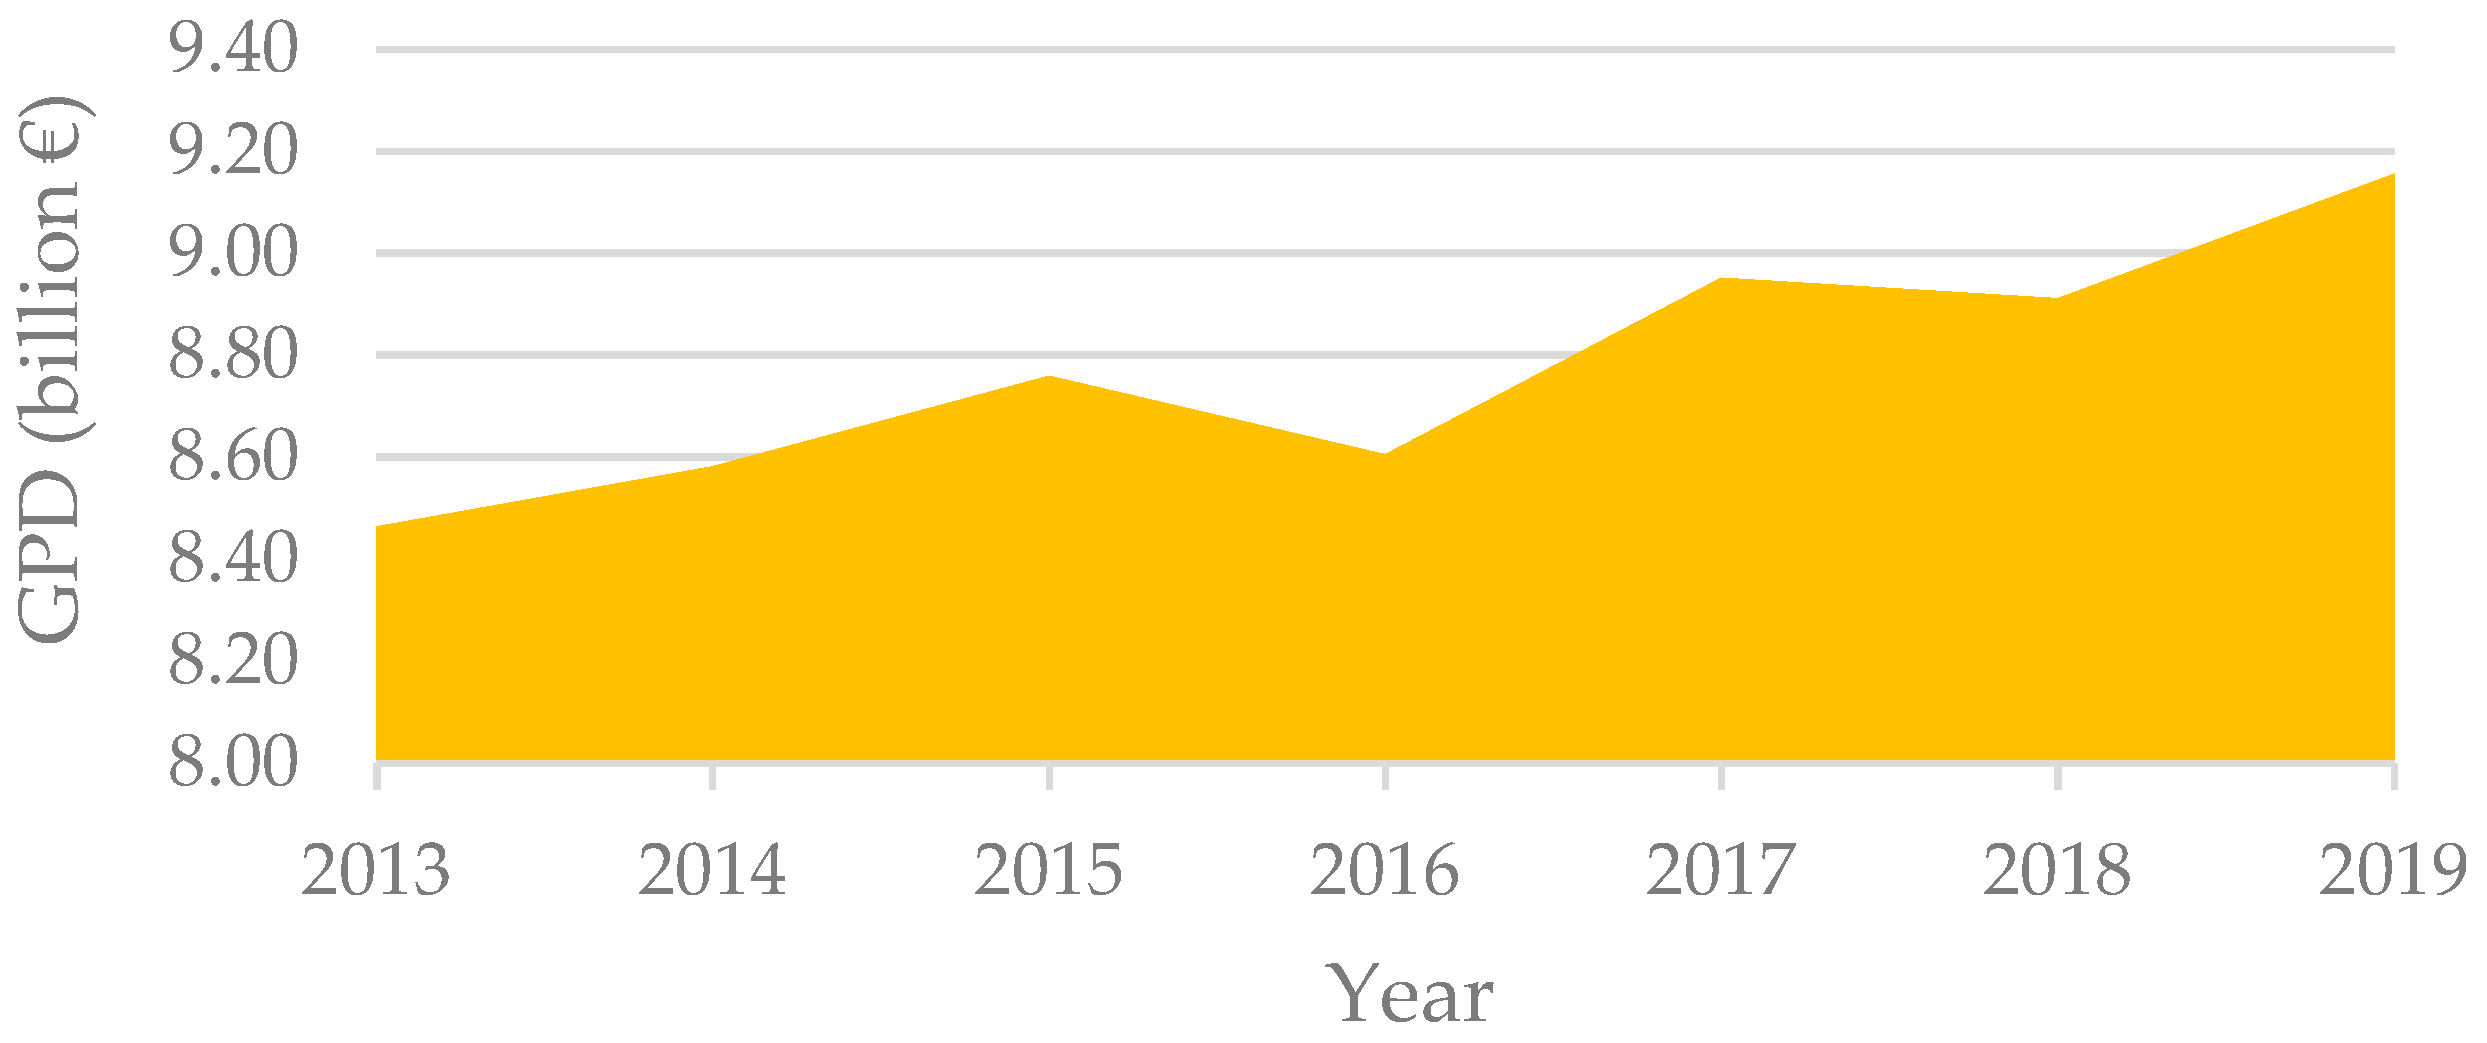
The island of Crete is the largest and most populated island of Greece and the fifth largest in the Mediterranean Sea. According to the 2021 census, Crete’s population is 623,065; while in the summer period, this number can be tripled due to the arrival of tourists [38]. Crete is located in the southeast part of Europe and occupies an area of approximately 8500 m2. Crete’s gross domestic product (GDP), between 2013 and 2019, is depicted in Figure 1, where a growth of economic activities is clearly shown.
2.2. Power System of Crete
Three thermal power stations are installed in the power system of Crete with a total installed capacity of around 844 MW [39,40]. In addition, 38 wind parks (WPs) are installed on the mountains of Crete, with a total nominal power of 209.45 MW [39,40]. Their geographical location and nominal power are presented in Table 1. The WPs are connected in the regional high-voltage (HV) network through substations 20/150 kV. In addition, small photovoltaic (PV) parks with a total nominal power of 107 MW have already been installed on the island [39,40]. Finally, a small hydroelectric power station, with a nominal power of 0.3 MW is currently installed in the Regional Unit of Chania [39,40].
The thermal stations consist of gas turbines, steam units, and diesel units. Steam and diesel units supply the base daily load, while gas turbines are used to cover the peak load. It is worth mentioning that the cost of these units is quite high, resulting in a dramatic rise in the overall cost of electricity [41]. The installed power of each power plant per fuel is shown in Table 2, Table 3 and Table 4.
2.3. Electrical Interconnection of Crete
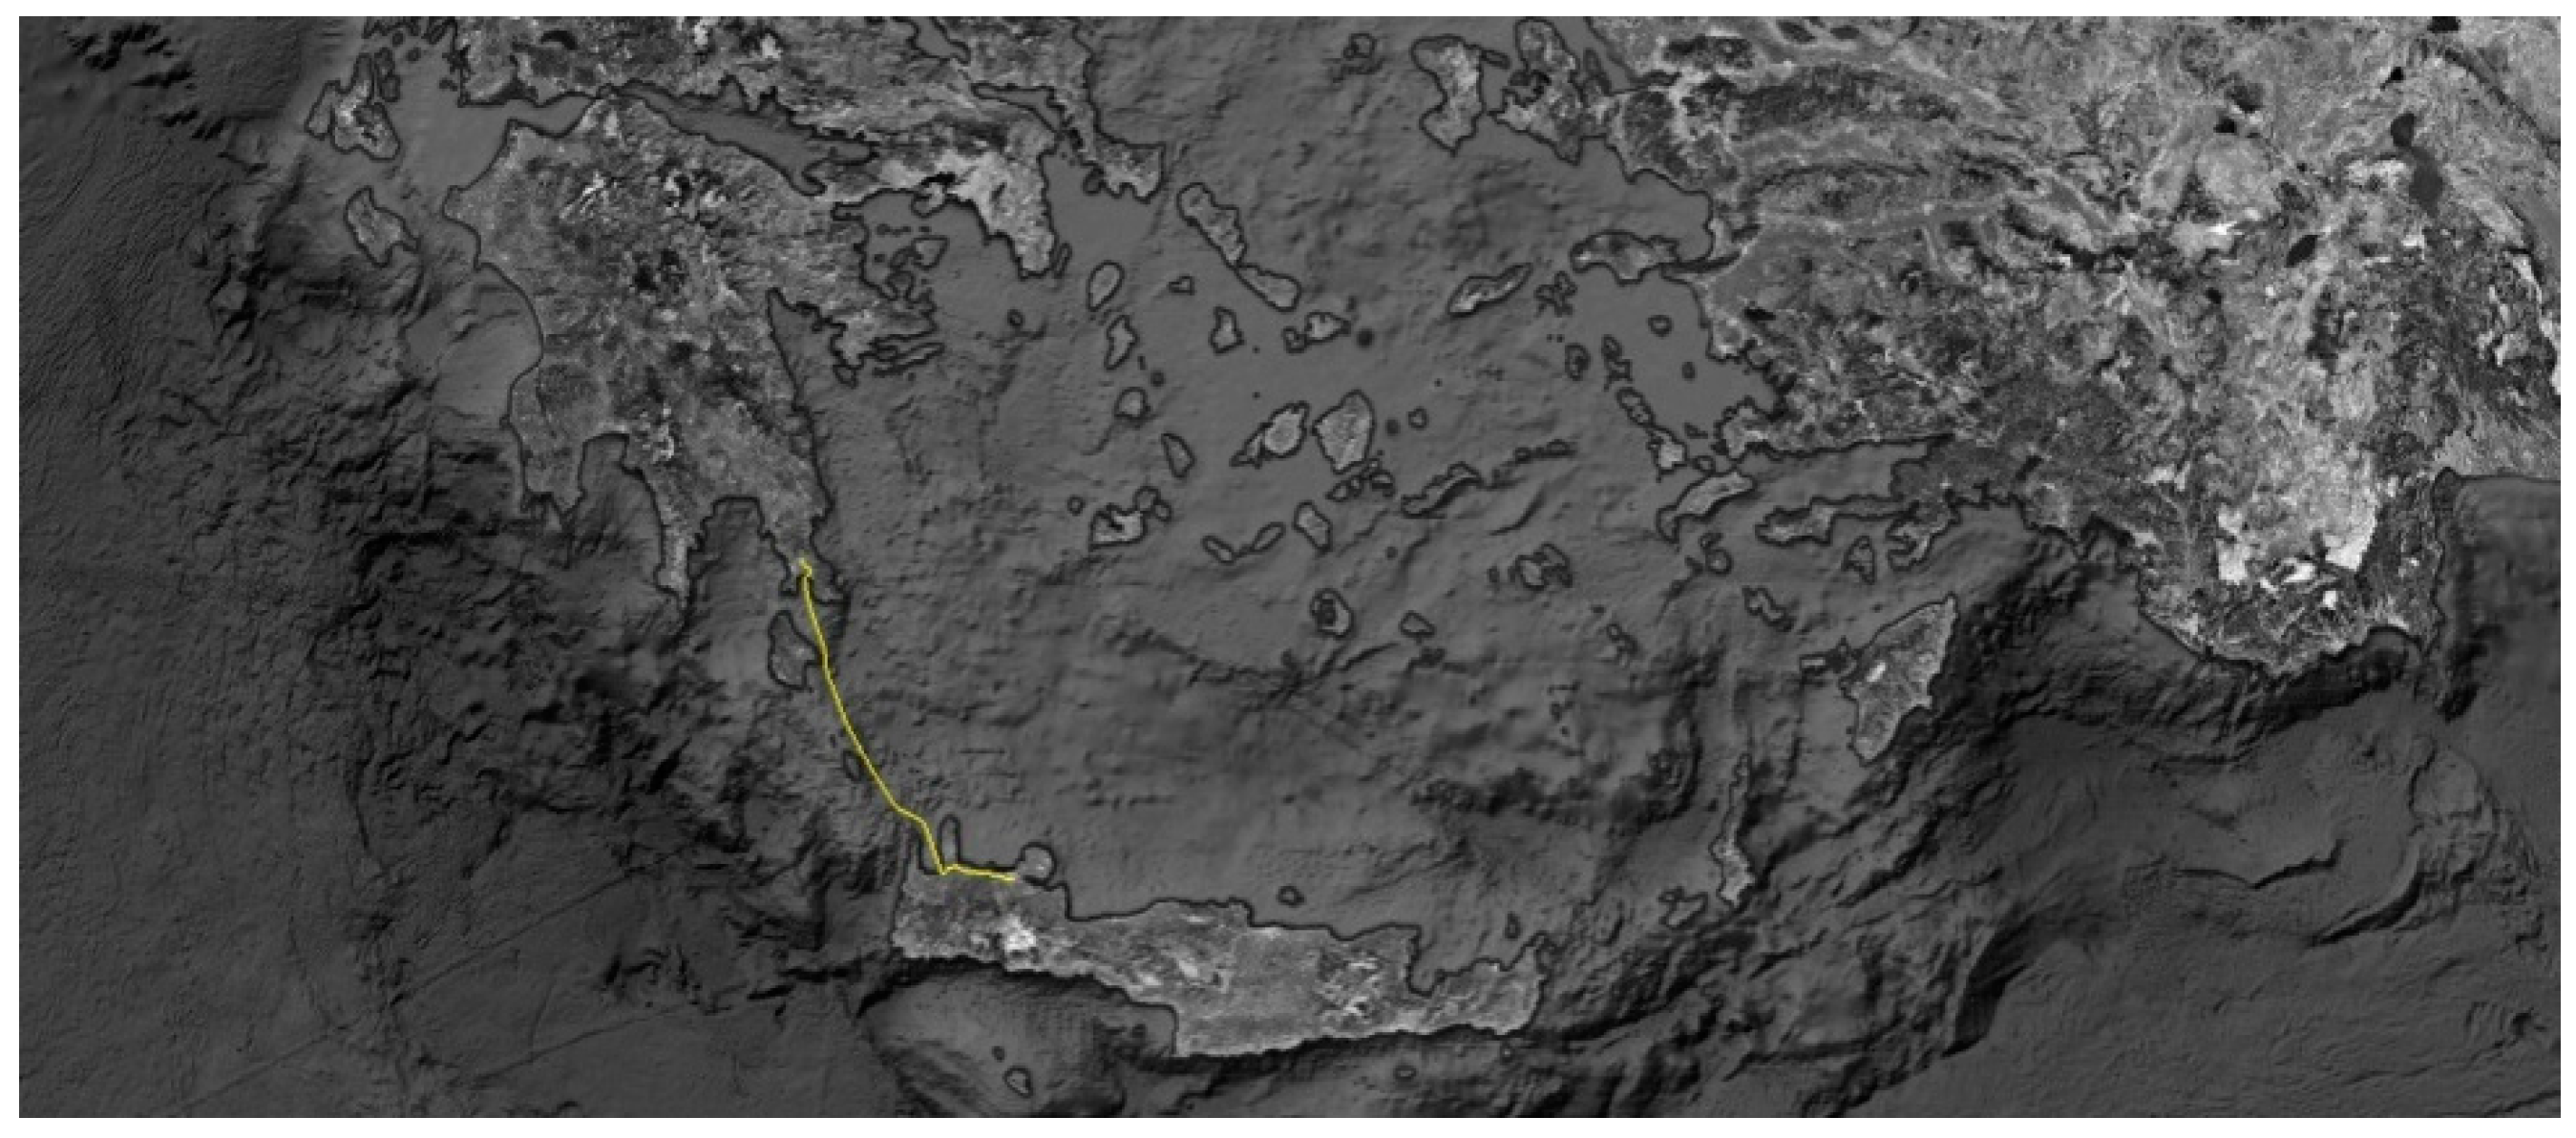
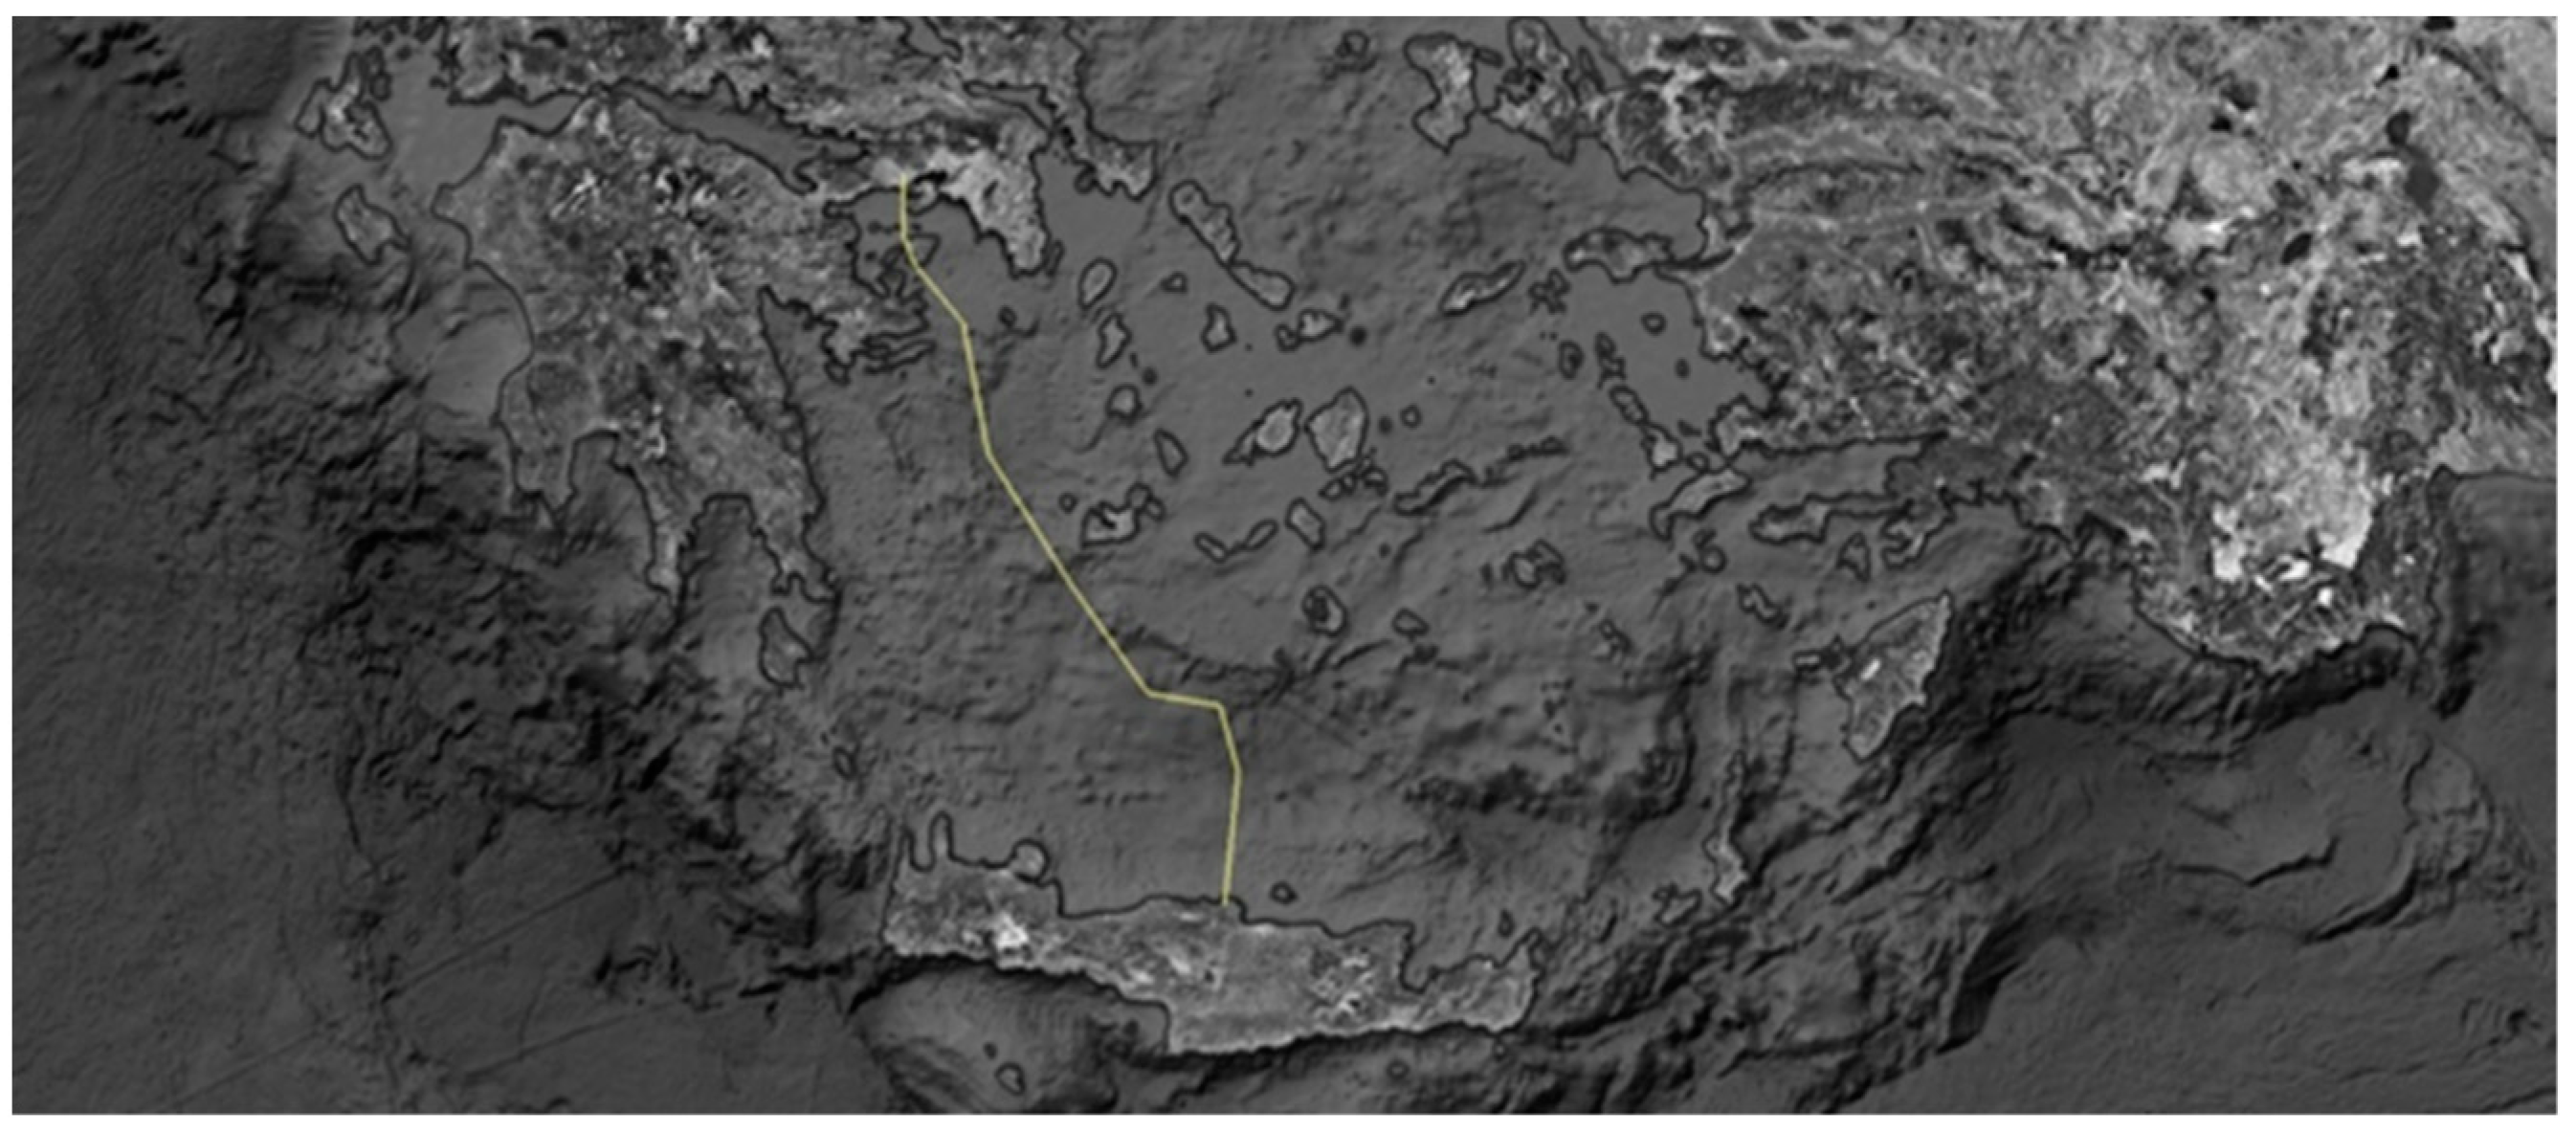
The interconnection of the Cretan power system with the mainland will be implemented using two different interconnection links. The first has been in operation since 2021 and connects Crete with the Peloponnese, with a 174 km cable, as shown in Figure 2. The maximum depth of the cable is around 1000 m and its voltage is 150 kV (AC), while the rated power is 200 MVA. The second connection will be commissioned in 2024 and is going to connect Crete with Attica (Athens), as shown in Figure 3, through a DC submarine cable. The length of this cable is 330 km, its operating voltage is 500 kV (DC), while its rated power is 350 MW. Note that since the second cable (Figure 3) has not yet been installed, it does not feature in our study.
2.4. Share of Existing Renewables in Crete
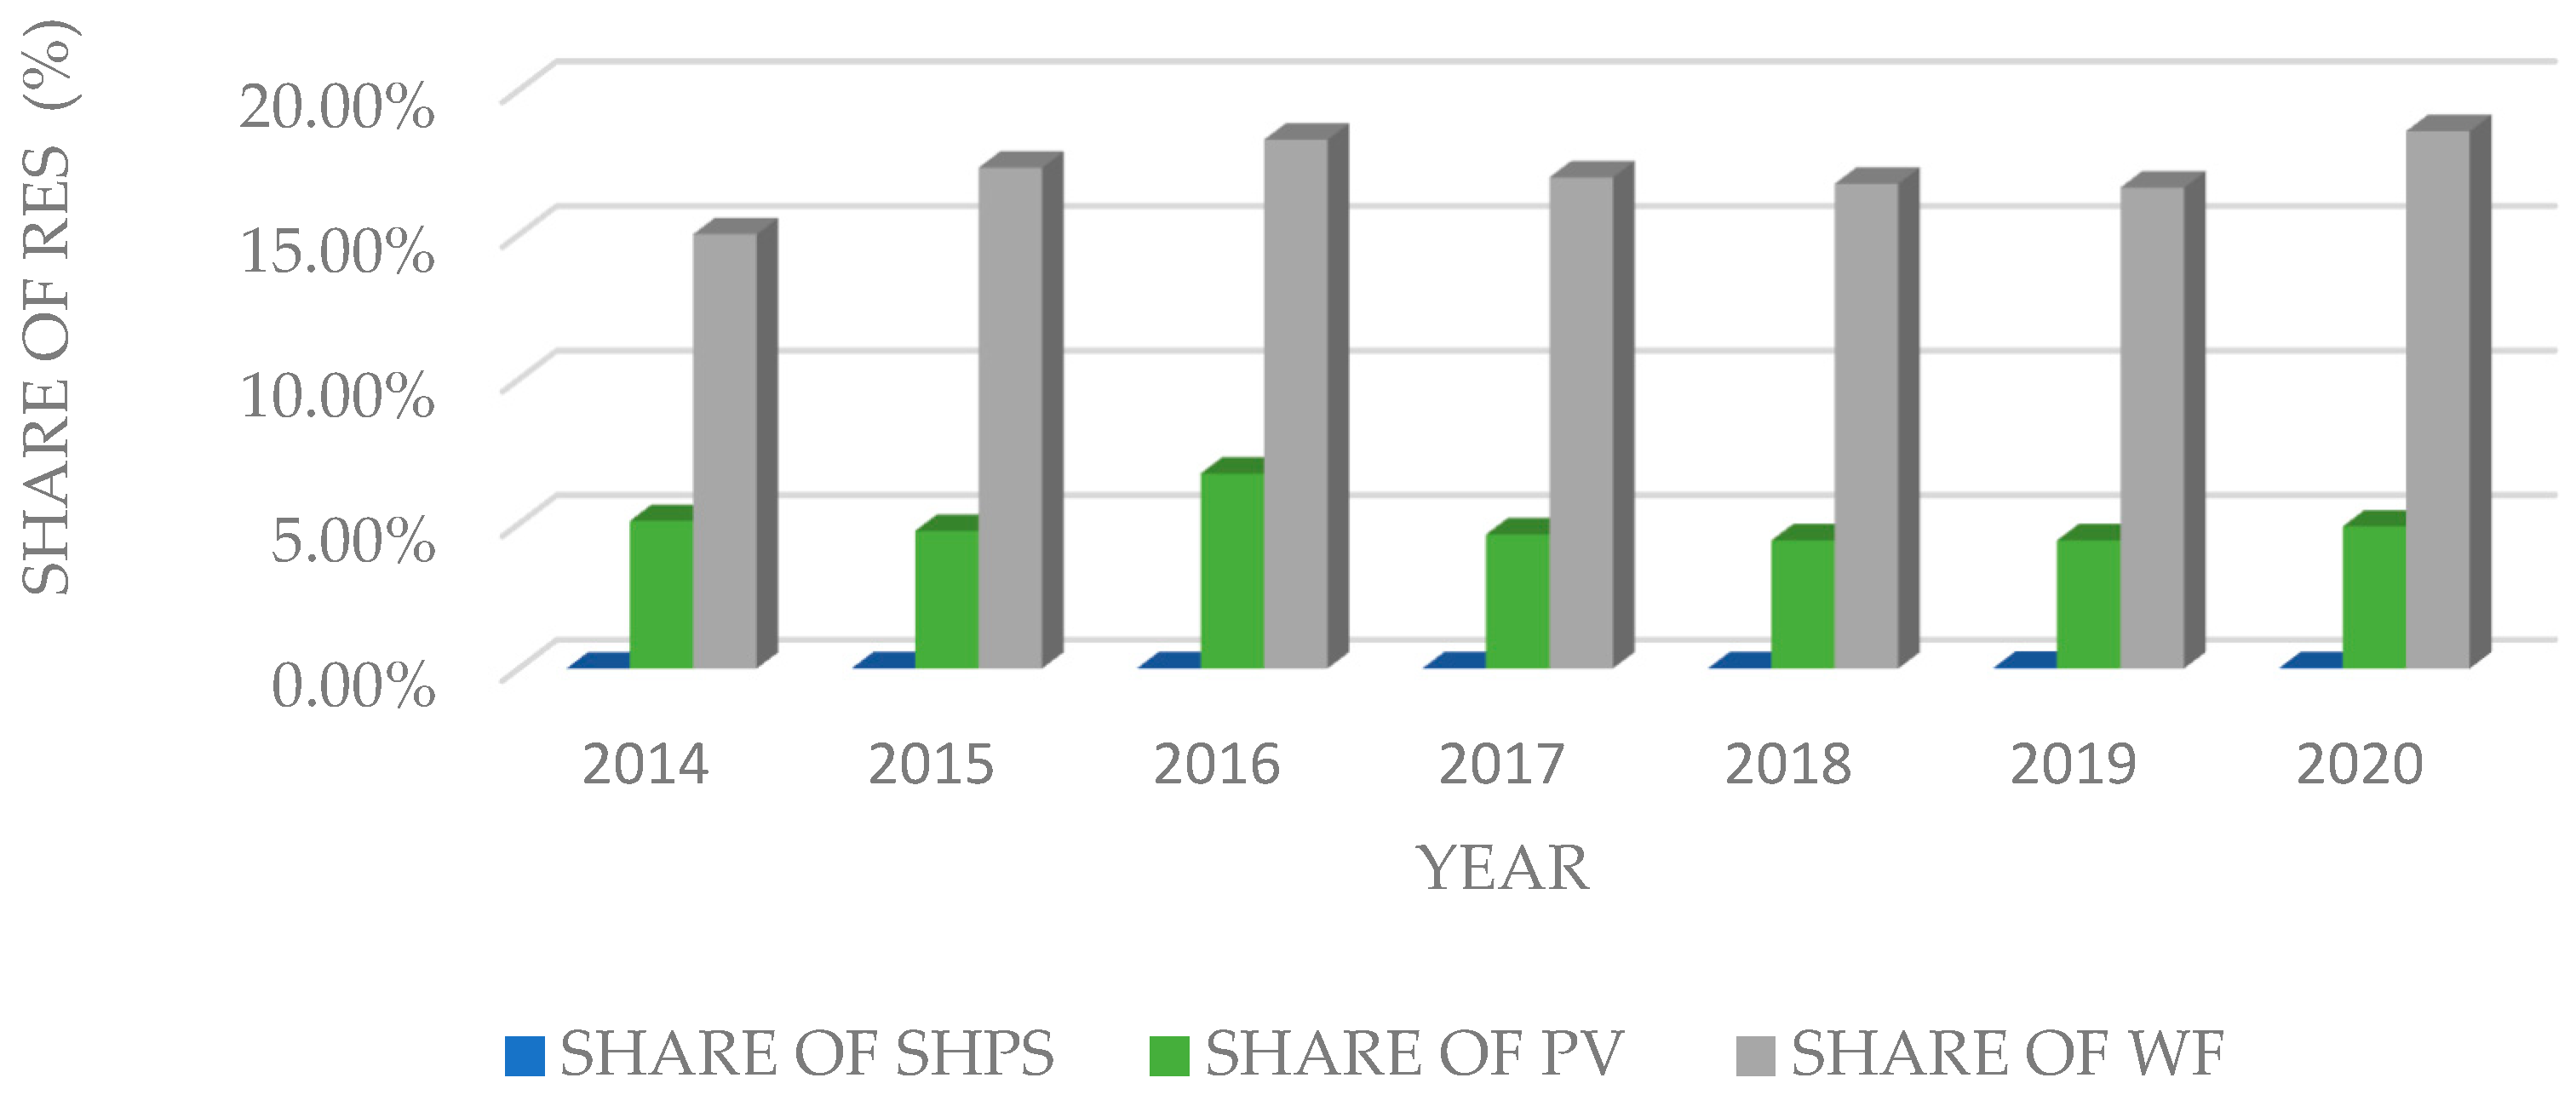
Figure 4 illustrates the share of RES throughout the years 2014–2020, defined as the ratio of RES energy to the total energy production. As shown, wind generators produce by far the highest amount of renewable energy, with a share of nearly 20% in 2020. The production of PVs is around 5% of the total energy production. Finally, the share of the small hydroelectric power station (SHPS) is negligible in Crete. Its power system is mainly based on the imports of fossil fuels in order to supply its thermal units. Therefore, the island’s electrification is dependent on external factors to a great extent. For instance, the rise of fossil fuel prices over the last several years has resulted in a large rise in the cost of electricity, with important consequences on the local and regional population.
3. Operation of Crete’s Power System
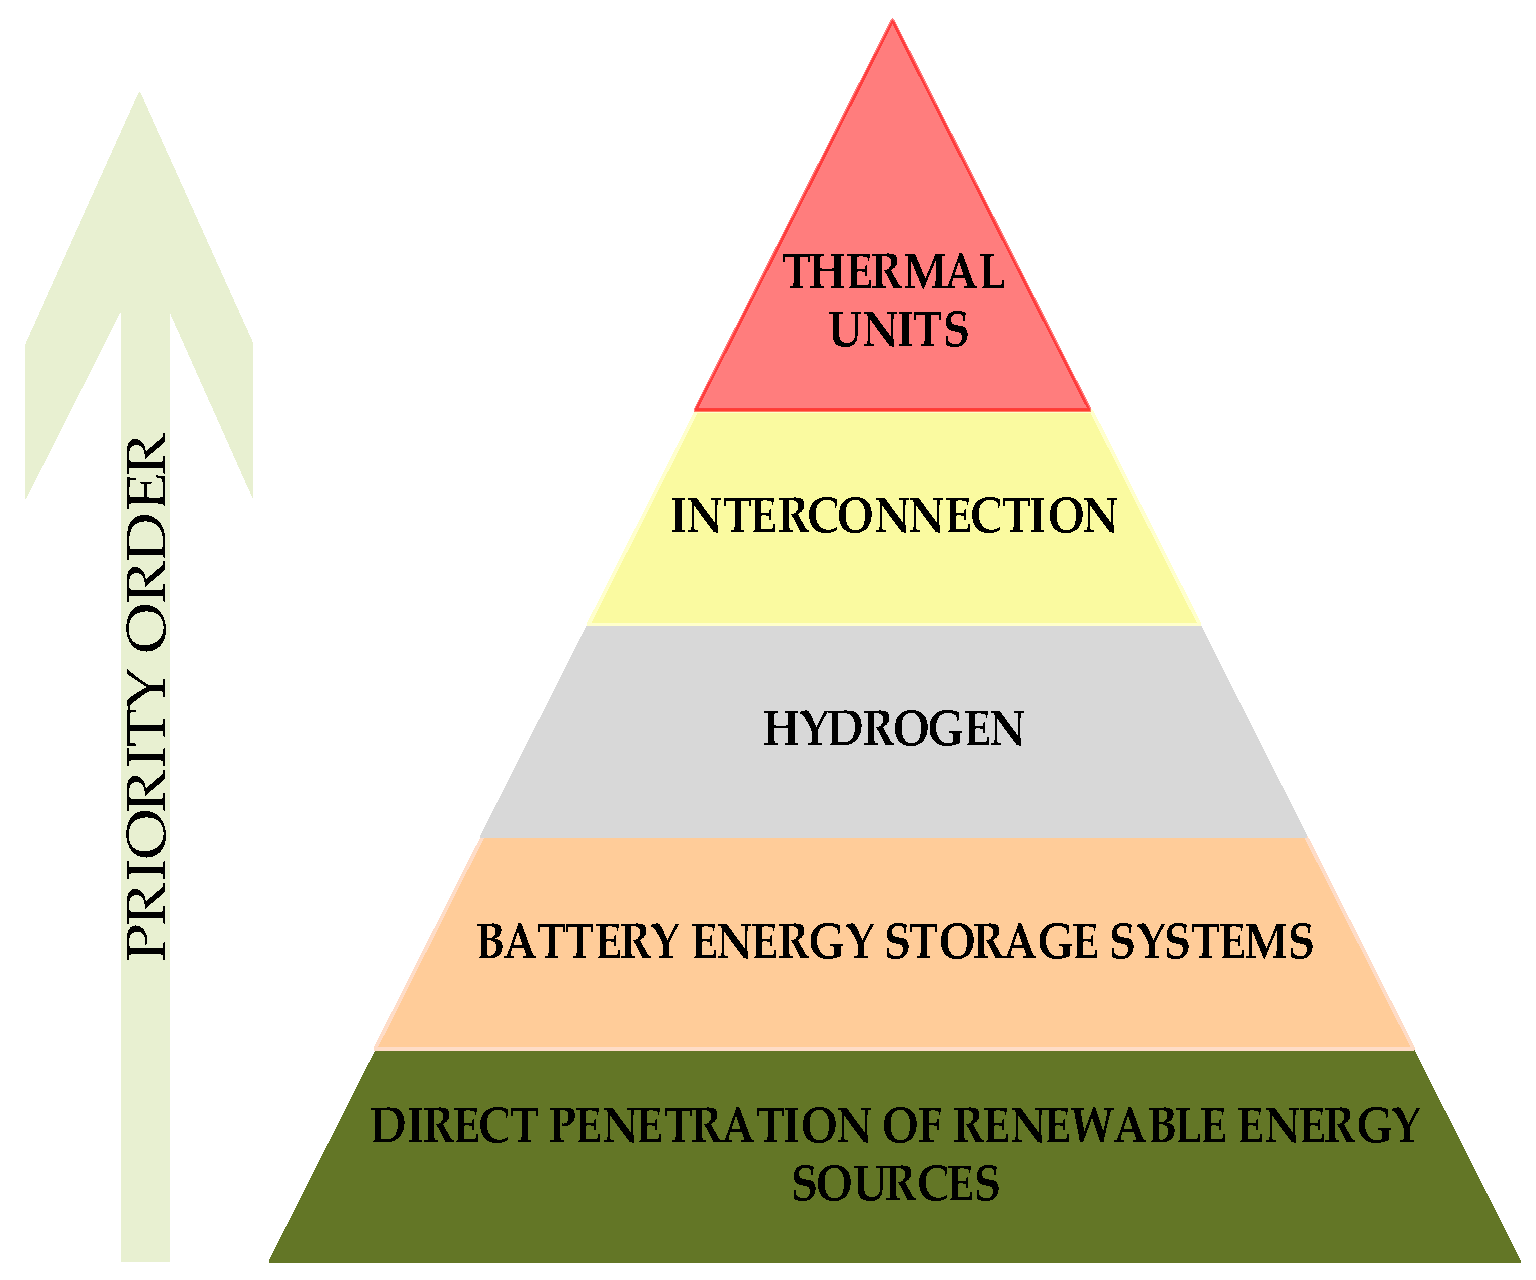
The scope of this section is to analyze, on an hourly basis, the operation of the Cretan power system. As already explained, Crete’s power system consists of PVs, wind generators, thermal power plants, and a submarine cable connecting Crete with the mainland (the Peloponnese). Figure 5 describes the operation priority of the power units. Priority is given to RESs, where they always inject their maximum power throughout the year. In the case that the load is higher (lower) than RES power, batteries are discharged (charged) to cover the power deficit. If a power deficit still exists, it is covered by the electrolyzers or fuel cells, producing or consuming green hydrogen, respectively. The submarine cables import or export energy only if a power balance between the load, RES, and storage cannot be achieved. Finally, in the case that the imported/exported power is still not adequate, thermal power plants are used to ensure the power balance of the Cretan power system. The primary objective of the power system is to achieve a high degree of self-sufficiency by effectively harnessing renewable energy sources (RESs) and storage systems, relying exclusively on clean, green energy sources to meet its operational requirements. Consequently, both the interconnection infrastructure and thermal units play dual roles, acting as supplementary components that not only address energy demand but also facilitate the efficient utilization of surplus energy generated by RESs.
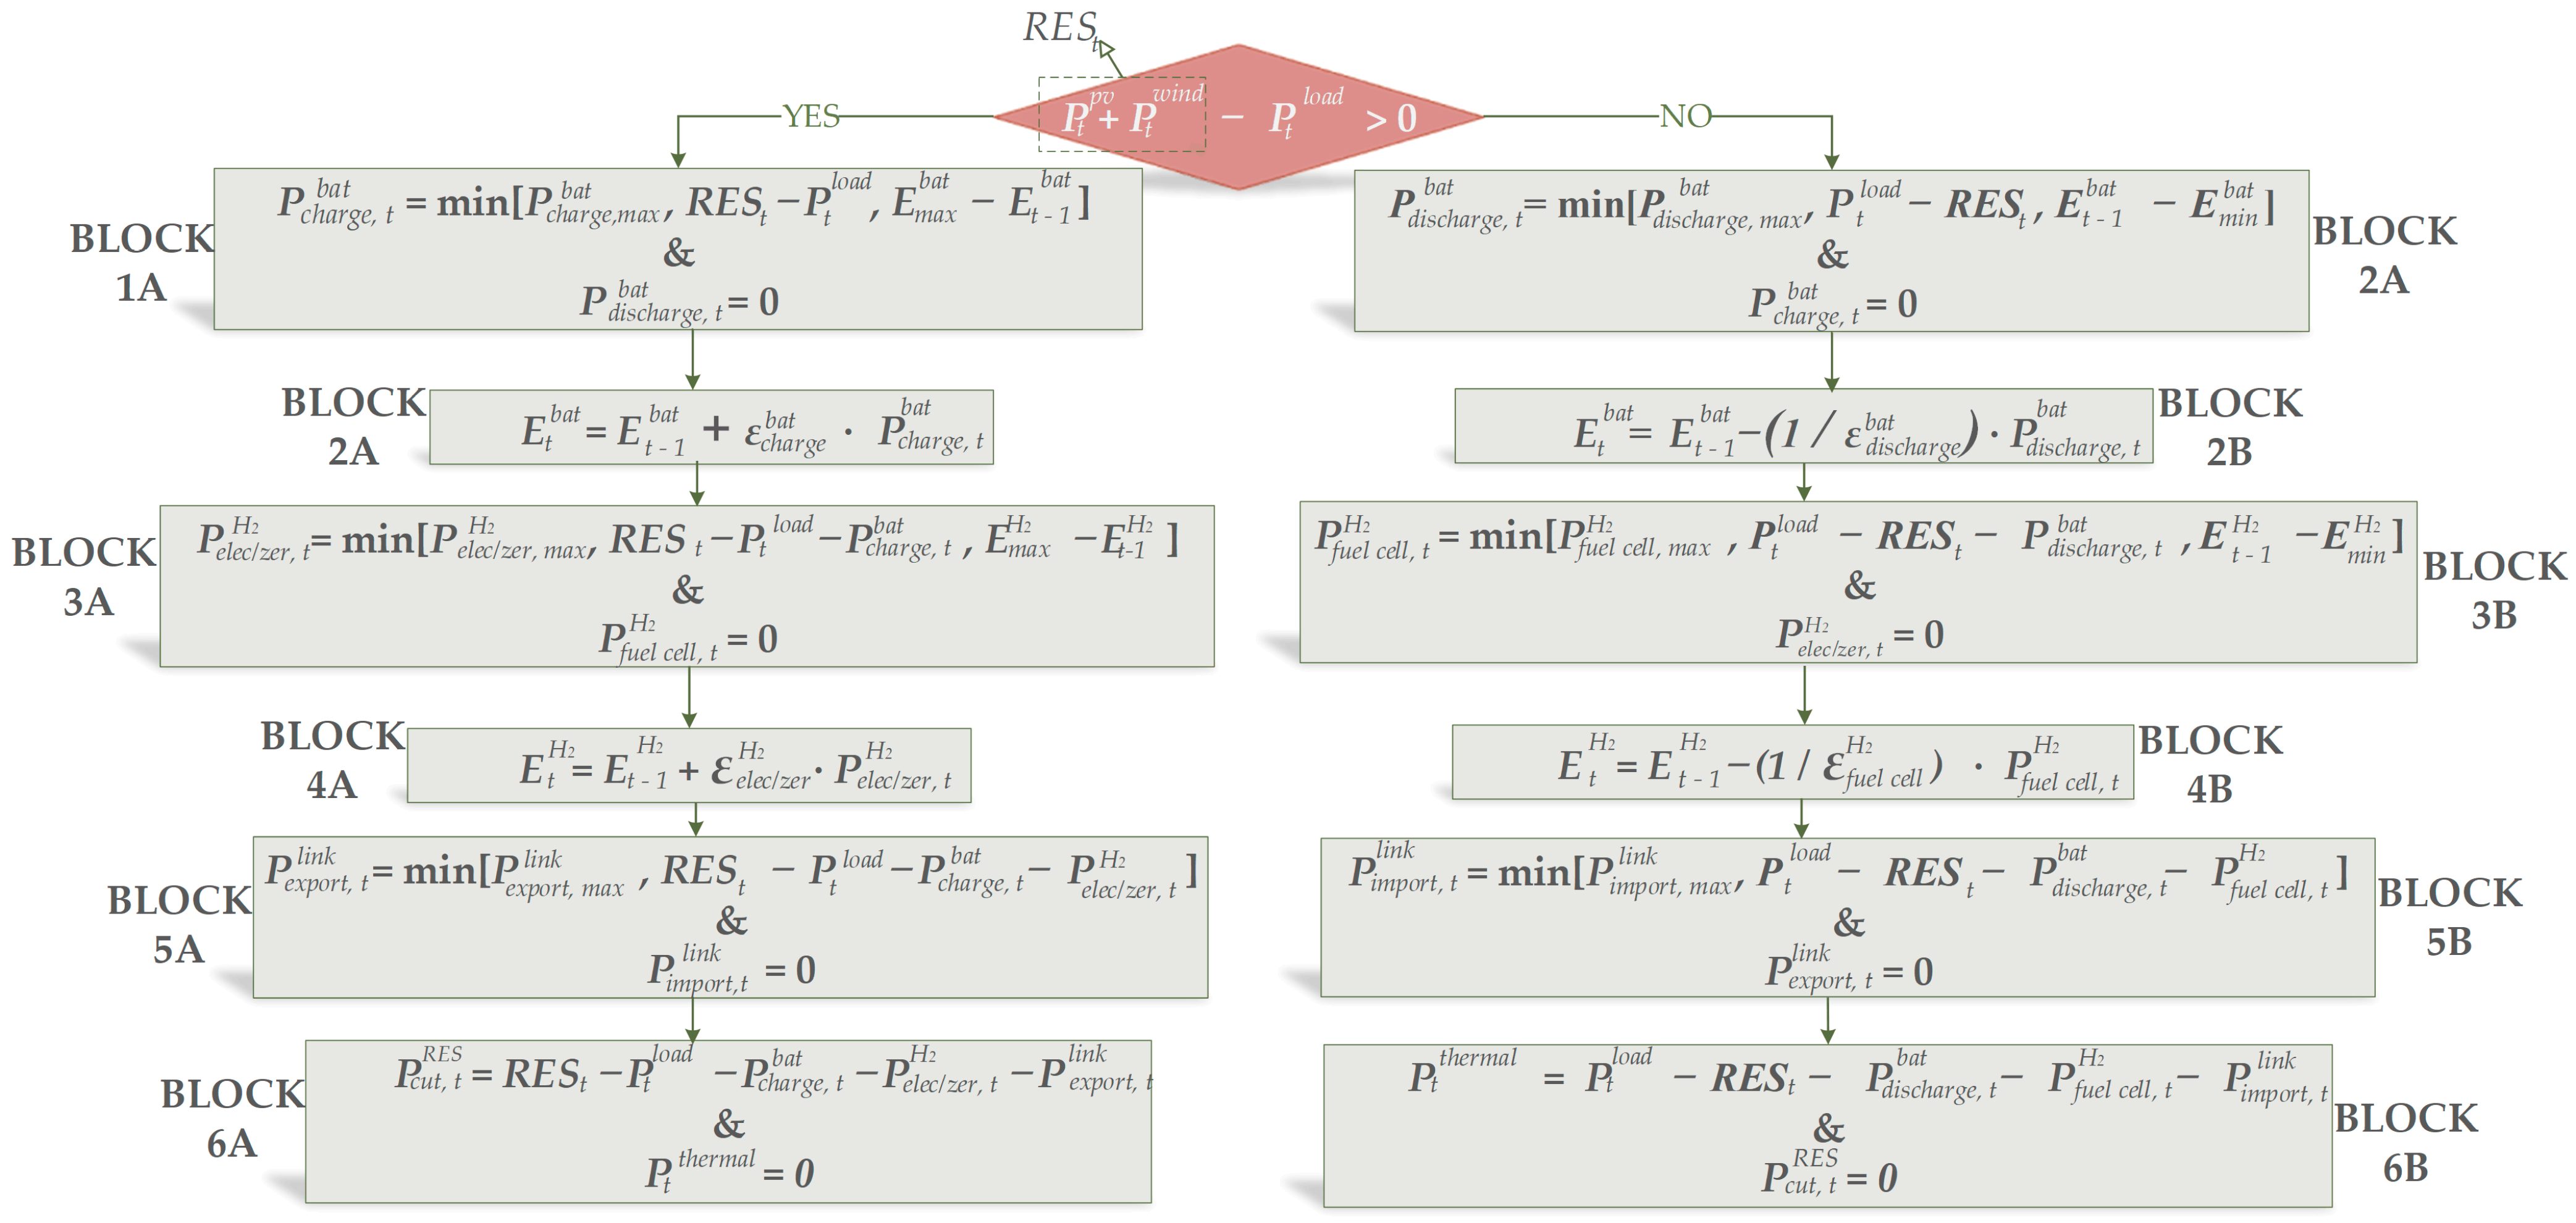
Battery energy storage systems (BESS) outperform electrolyzers when it comes to generating electrical power efficiently. Furthermore, batteries exhibit rapid response capabilities, making them well-suited for ensuring grid stability and effectively managing short-term fluctuations in renewable energy sources. Conversely, hydrogen production and storage processes tend to operate at a slower pace, potentially hampering their ability to swiftly adapt to sudden shifts in demand or supply. It is worth noting that BESSs may experience self-discharge, resulting in losses of renewable electricity. For these reasons, prioritizing the utilization of batteries into the system over hydrogen seems to be more efficient. Batteries offer the advantage of immediate response and can help mitigate power fluctuations. In contrast, hydrogen, while capable of long-term electrical energy storage with relatively fewer losses, is better suited for applications where a time-sensitive response is not critical [1,20]. The operation of the Cretan power system is comprehensively described as a flowchart in Figure 6. Every block of the flowchart is shortly described in the next paragraphs, while all the variables have been defined in the Nomenclature section.
- Block 1a: If the RES power is higher than the load, batteries are charged provided that the maximum charge power () and the maximum stored energy are not exceeded. The function min(x, y, z) outputs the minimum value between x, y, z. For instance, assuming that the RES surplus () is higher than the maximum charge power (), then the battery is not able to store the whole RES surplus and the charge power is set equal to its maximum value. Similarly, assuming that the stored energy is already near to its maximum value, e.g., , then the charge power will be set accordingly to ensure that the maximum state-of-charge (SOC) will not be exceeded.
- Block 2a: This block ensures power and energy balance during the charging of the battery. Specifically, the BESS stored energy of the current hour () is equal to the energy already stored in the previous hour (), plus the charge power () multiplied by the charge efficiency ().
- Block 3a: After the BESS charging, if there is still a surplus of renewable energy, it is utilized to produce and store green hydrogen. This block is similar to Block 1a.
- Block 4a: This block is similar to Block 2a.
- Block 5a: If the battery and hydrogen storage is not sufficient to store the RES surplus, submarine cables are used to export renewable power to the mainland (). Similarly, the min function is used to ensure that the maximum rate of the cable () is not exceeded.
- Block 6a: If a surplus of RES power still exists, it is finally rejected by .
- Block 1b: If there is a deficit of renewable energy, batteries are discharged first to cover it. The discharge power at any time t () should be lower than the maximum discharge power () and the available stored energy .
- Block 2b: Similar to Block 2a, this block ensures the power and energy balance during the discharging mode of the battery.
- Block 3b: If the battery discharge is not adequate to cover the deficit, fuel cells are utilized.
- Block 4b: This block is similar to Block 2b.
- Block 5b: If RESs and storage cannot totally cover the load, power is imported from the interconnection cable ().
- Block 6b: Finally, if a power deficit still exists, the thermal units are used (), as a last power source.
- All the variables of the flowchart have been defined in the Nomenclature section.
4. Mathematical Formulation of the Optimization Problem
The proposed formulation for optimizing the installation of new RESs and ESSs is described in this section. Its distinct feature is that it has generalized implementation on all islands connected through interconnection links with the mainland. As more and more islands all over the world are currently being connected to the mainland, additional RES capacity is unlocked with favorable investment opportunities. The proposed formulation can constitute an important tool for optimizing the installation of RESs and ESSs toward the decarbonization of islands, maximizing the profit of investors. Actually, the scope of the proposed optimization is to maximize the economic profitability for the candidate investors, providing incentives for new investments on RES and ESS, while satisfying necessary constraints such as an annual renewable penetration higher than 80% and a penetration of local thermal power plants below 10%.
4.1. Objective function
The objective function of the proposed optimization problem is quoted in Equation (1).
The IRR is the internal rate of return calculated in Equation (2). The internal rate of return (IRR) is a metric used in financial analysis to estimate the profitability of a potential investment. The higher its value, the more likely the investment is considered to be profitable. For instance, if the IRR is greater than 10%, the investment can be considered successful. Therefore, the scope is to maximize the value of IRR by changing the objective function parameters. However, it is important to note that this value depends on many external factors such as market conditions, and thus, the IRR that an investment can achieve is volatile [42].
4.2. Decision Variables
The decision variables of the optimization problem are the capacities of the newly installed energy and power units. Specifically, the decision variables are the installed power of the new solar and wind generators (), the nominal power of the battery’s inverter (), the nominal powers of electrolyzer and fuel cell (), and the capacity of the battery and hydrogen tank (). The scope is to optimize all of the aforementioned decision variables in order to maximize the IRR, while satisfying the constraints quoted in the next sub-section.
4.3. Constraints
The constraints of the proposed formulation are described in Equations (2)–(11). All variables of this sub-section have been described in the Nomenclature section. Equation (2) combines the initial cost () of the investment that is the total cost of the installation stage (defined in (3)), the ratio of equity () that is the percentage of the initial cost funded by personal capital, the annual incomes () per year (defined in (4)), and the IRR. denotes the time horizon (project lifecycle) of the investment ( years in this paper).
The initial cost is mathematically expressed by (3) and composed by the individual initial costs (capital expenses, CAPEX, are the necessary expenses for the purchase, construction or improvement of long-term assets of an investment, such as electromechanical equipment, facilities etc.) of solar and wind generators, the inverter (power conversion system) of the battery, the battery device, the electrolyzer, the fuel cell and the hydrogen tank. Regarding the power conversion system (PCS), they are the components and the equipment which are responsible for connecting the B.E.S.S. with the electrical grid. It consists of bidirectional inverters (inverters, which are capable of charging and discharging the B.E.S.S.), the LV/MV transformer, and the MV field.
The annual cash flow is mathematically described by (4), where and have been defined in (5) and (6), denotes the operation expenses (land use rents, employee salaries, etc.), denotes the operation and maintenance cost of year y, denotes unpredicted expenses and expenses that have arisen after a settlement between the suppliers of the equipment and the investors, denotes the replacement costs (e.g., the replacement cost of battery after say 10 years) of year y, and INFL is the inflation of the economy.
The annual incomes of each year y from the sale of the direct RES penetration are calculated by (5). In addition, the annual incomes of each year y from the discharge power of the installed ESSs are calculated by (6). The total incomes are calculated by (7).
The expenses of the loan, for each year y, are mathematically described in (8), where denotes the percentage of the initial cost funded by loans, is the repayment period of loans, is the bank debt interest rate, is the Heaviside function. Actually, the Heaviside function is used to ensure that after the repayment period (e.g., ), becomes zero.
Constraint (9) ensures that the contribution of the thermal power plants to the coverage of load is lower than 10% of the annual load. Equations (10) and (11) illustrate the annual supply of energy from direct RES energy and ESSs, respectively. Constraint (12) ensures that renewables and storage should supply more than 80% of the annual load. These constraints are considered in order to achieve the maximum and minimum penetration of RESs and thermal units, respectively, facilitating the country’s target for 80% renewable penetration by 2030 [37].
Equation (13) constrains the storage capacity of the battery to be quadruple its maximum discharge power. Thus, the battery can operate with a full power for 4h. Equation (14) constrains the maximum charge and discharge power of the battery to be equal. Equation (15) constrains the storage capacity of hydrogen to be 24 times the maximum power of fuel cell to let fuel cells operate on full power for 24 h. Finally, Equation (16) constrains the installed power of electrolyzer and fuel cell to be equal. Equalizing the power of the electrolyzer with that of the fuel cell ensures energy balance, the efficient utilization of resources, and optimal performance in electrolysis-fuel cell systems.
5. Optimization Results
5.1. Input Data
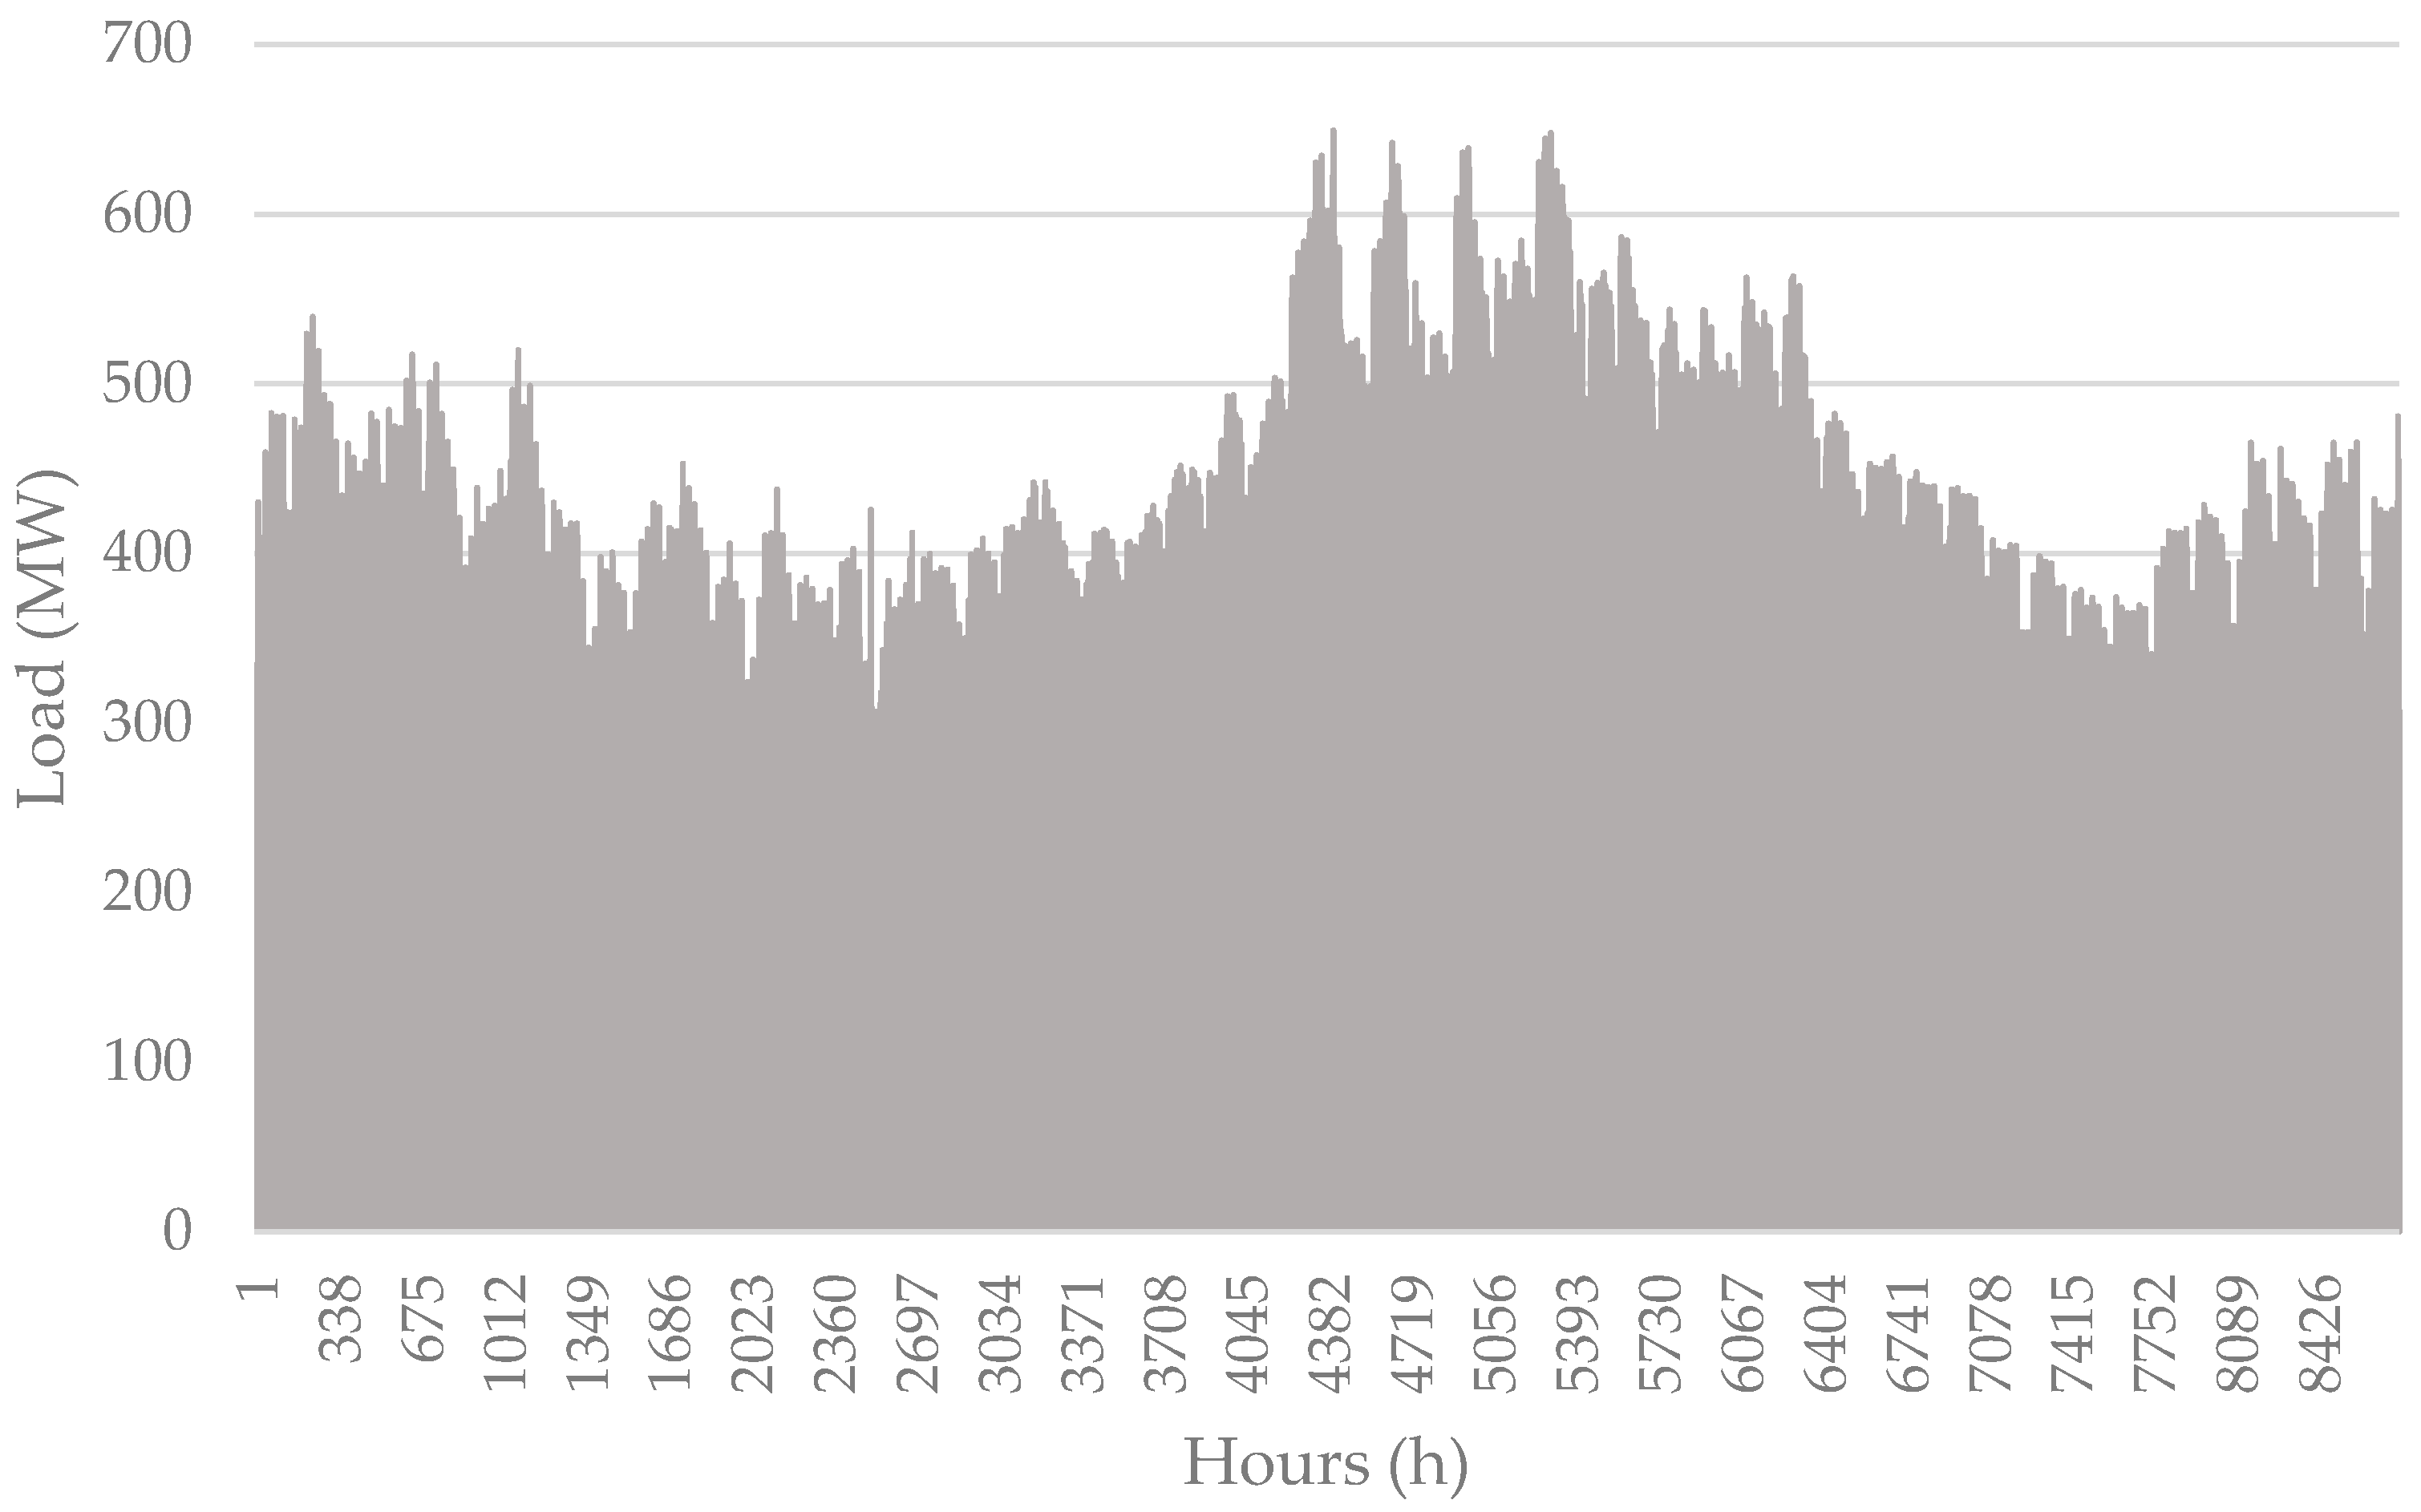
For the implementation of the proposed optimization approach, hourly WF, PV, and load data were used for a whole year. Regarding the WF and PV data, these metrics are sourced from actual operational parks located on the island of Crete. The load data are published every year by HEDNO and IPTO [39,40]. Regarding the WF and PV data, Figure 7 depicts the total load of the island throughout the year. The total annual demand is equal to 3.14 TWh. The economic parameters of all RES and ESS technologies are shown in Table 5 and Table 6. Note that in Table 6, the cost of each technology is obtained from the average values analyzed in [43,44,45]. OPEX and O&M are considered 2% of CAPEX. In Table 7, the replacement and the O&M costs of each technology are quoted, where batteries, electrolyzers, and fuel cells need to be replaced every 10 years [46,47,48], while the rest (PVs, WPs, inverter, hydrogen tank) are not replaced throughout the projects’ lifetime.
The efficiencies and the DOD of the examined ESSs are quoted in Table 7. As shown, the battery exhibits a much higher efficiency than hydrogen. Moreover, based on Table 5, Table 6 and Table 7, the assessed storage technologies demonstrate distinct characteristics. For instance, the inverter of the lithium–ion battery is characterized by a low cost and high efficiency, while lithium–ion battery itself is associated with a significant economic expense. This factor contributes to their selection for short-term storage purposes, where the low-cost inverter is fully exploited without needing a large storage capacity. In contrast, the electrolyzer and fuel cell incur a high cost and low efficiency, while the hydrogen tank has an extremely low cost. This property renders hydrogen storage well suited for storing large amounts of energy over extended periods, utilizing the low cost of the hydrogen tank.
Table 8 presents the financing structure of the investments assumed in our study. As shown, 30% of the initial cost is covered by own funds (Requity), 30% by a bank loan (R_loan), and 40% is subsidized. This financial structure represents a common (average) financing scheme, based on our working experience, in several renewable energy projects. Table 9 displays the economic indicators pertaining to the bank’s debt, shareholder burden, tariff of renewable and storage, and other relevant factors.
Regarding H2 Tank (EUR/kWh) in Table 5, it should be mentioned that the price of the hydrogen tank is approximately 512 (EUR/kg) [46] and 1 kg of compressed H2 yields approximately 33.3 kWh [49]. Furthermore, the point of connection of the storage systems, where the efficiencies of Table 7 are calculated, is considered to be located at HV level and specifically at the HV bay of an HV/MV substation [50].
5.2. Optimization Results
The optimization results of the examined RES and hybrid storage investment, for the interconnected island of Crete, are presented here. Table 10 presents the optimal power and energy capacity of each technology, which optimize the IRR of the new investment, while satisfying constraints (7)–(11). As shown, the power system of Crete can optimally incorporate 620 MW, and 393 MW of newly installed WPs and PV generators, respectively. The optimal power and energy capacity of batteries is 72 MW and 288 MWh, respectively. The optimal power and energy capacity of hydrogen storage is 55 MW and 1320 MWh, respectively. The energy-to-power ratio (E/P) of hydrogen storage is much higher than the battery, due to the low cost of the hydrogen tank compared with the battery device, as well as the high cost of the electrolyzer/fuel cell compared with the battery inverter.
Table 11 provides an overview of the CAPEX, OPEX, and O&M costs associated with the installation and operation of the new RES and ESS. This table presents the detailed financial information of constructing and operating the new facilities. The presented information aids in making informed decisions regarding budgeting, resource allocation, and long-term financial sustainability of the renewable energy project. The total installation cost of the new investments is EUR 1,381,855,680 and the OPEX is EUR 28,214,504.96 a year, while the O&M is EUR 28,213,113.60 per year. The financial structure of the investment is presented in Table 12, based on the participation rates of Table 8.
Table 13 provides a comprehensive overview of the energy generation and corresponding incomes attributed to each technology. The tariffs of energy for RES (SPRES) and ESSS (SPEES) were considered equal to 80 in this paper (see Table 9). Nevertheless, it is clarified that in some networks, the selling price of the stored power may be greater than the direct RES power in order to compensate for the roundtrip losses of ESS [51].
The financial indicators related to the sustainability of the corresponding investment are depicted in Table 14. Specifically, the W.A.C.C. (weighted average cost of capital) is an index used to evaluate the profitability of an investment. It represents the average cost of capital that a company uses to finance its economic activities. It is mathematically described by (13), where is the share capital, is the total amount of bank debt, and is described in (3), while , are all given in Table 9.
Table 14 summarizes the financial indicators of the new investment. Based on the results, the investment can be considered successful, because the IRR is significantly higher than the WACC. In addition, the net present value (NPV) is much higher than zero. The validity of the results is also substantiated by the fact that the selling price of energy surpasses the LCOE (71.71 against 80 ), thus demonstrating a clear profitability for the candidate investor. It is noted that this large profit is justified to a great extent from the large portion of subsidy (40%), which is common in renewable energy projects. The sensitivity analysis of the next section studies the economic feasibility of the investment in cases of lower or zero subsidies.
5.3. Energy Mixture after the Proposed Investment
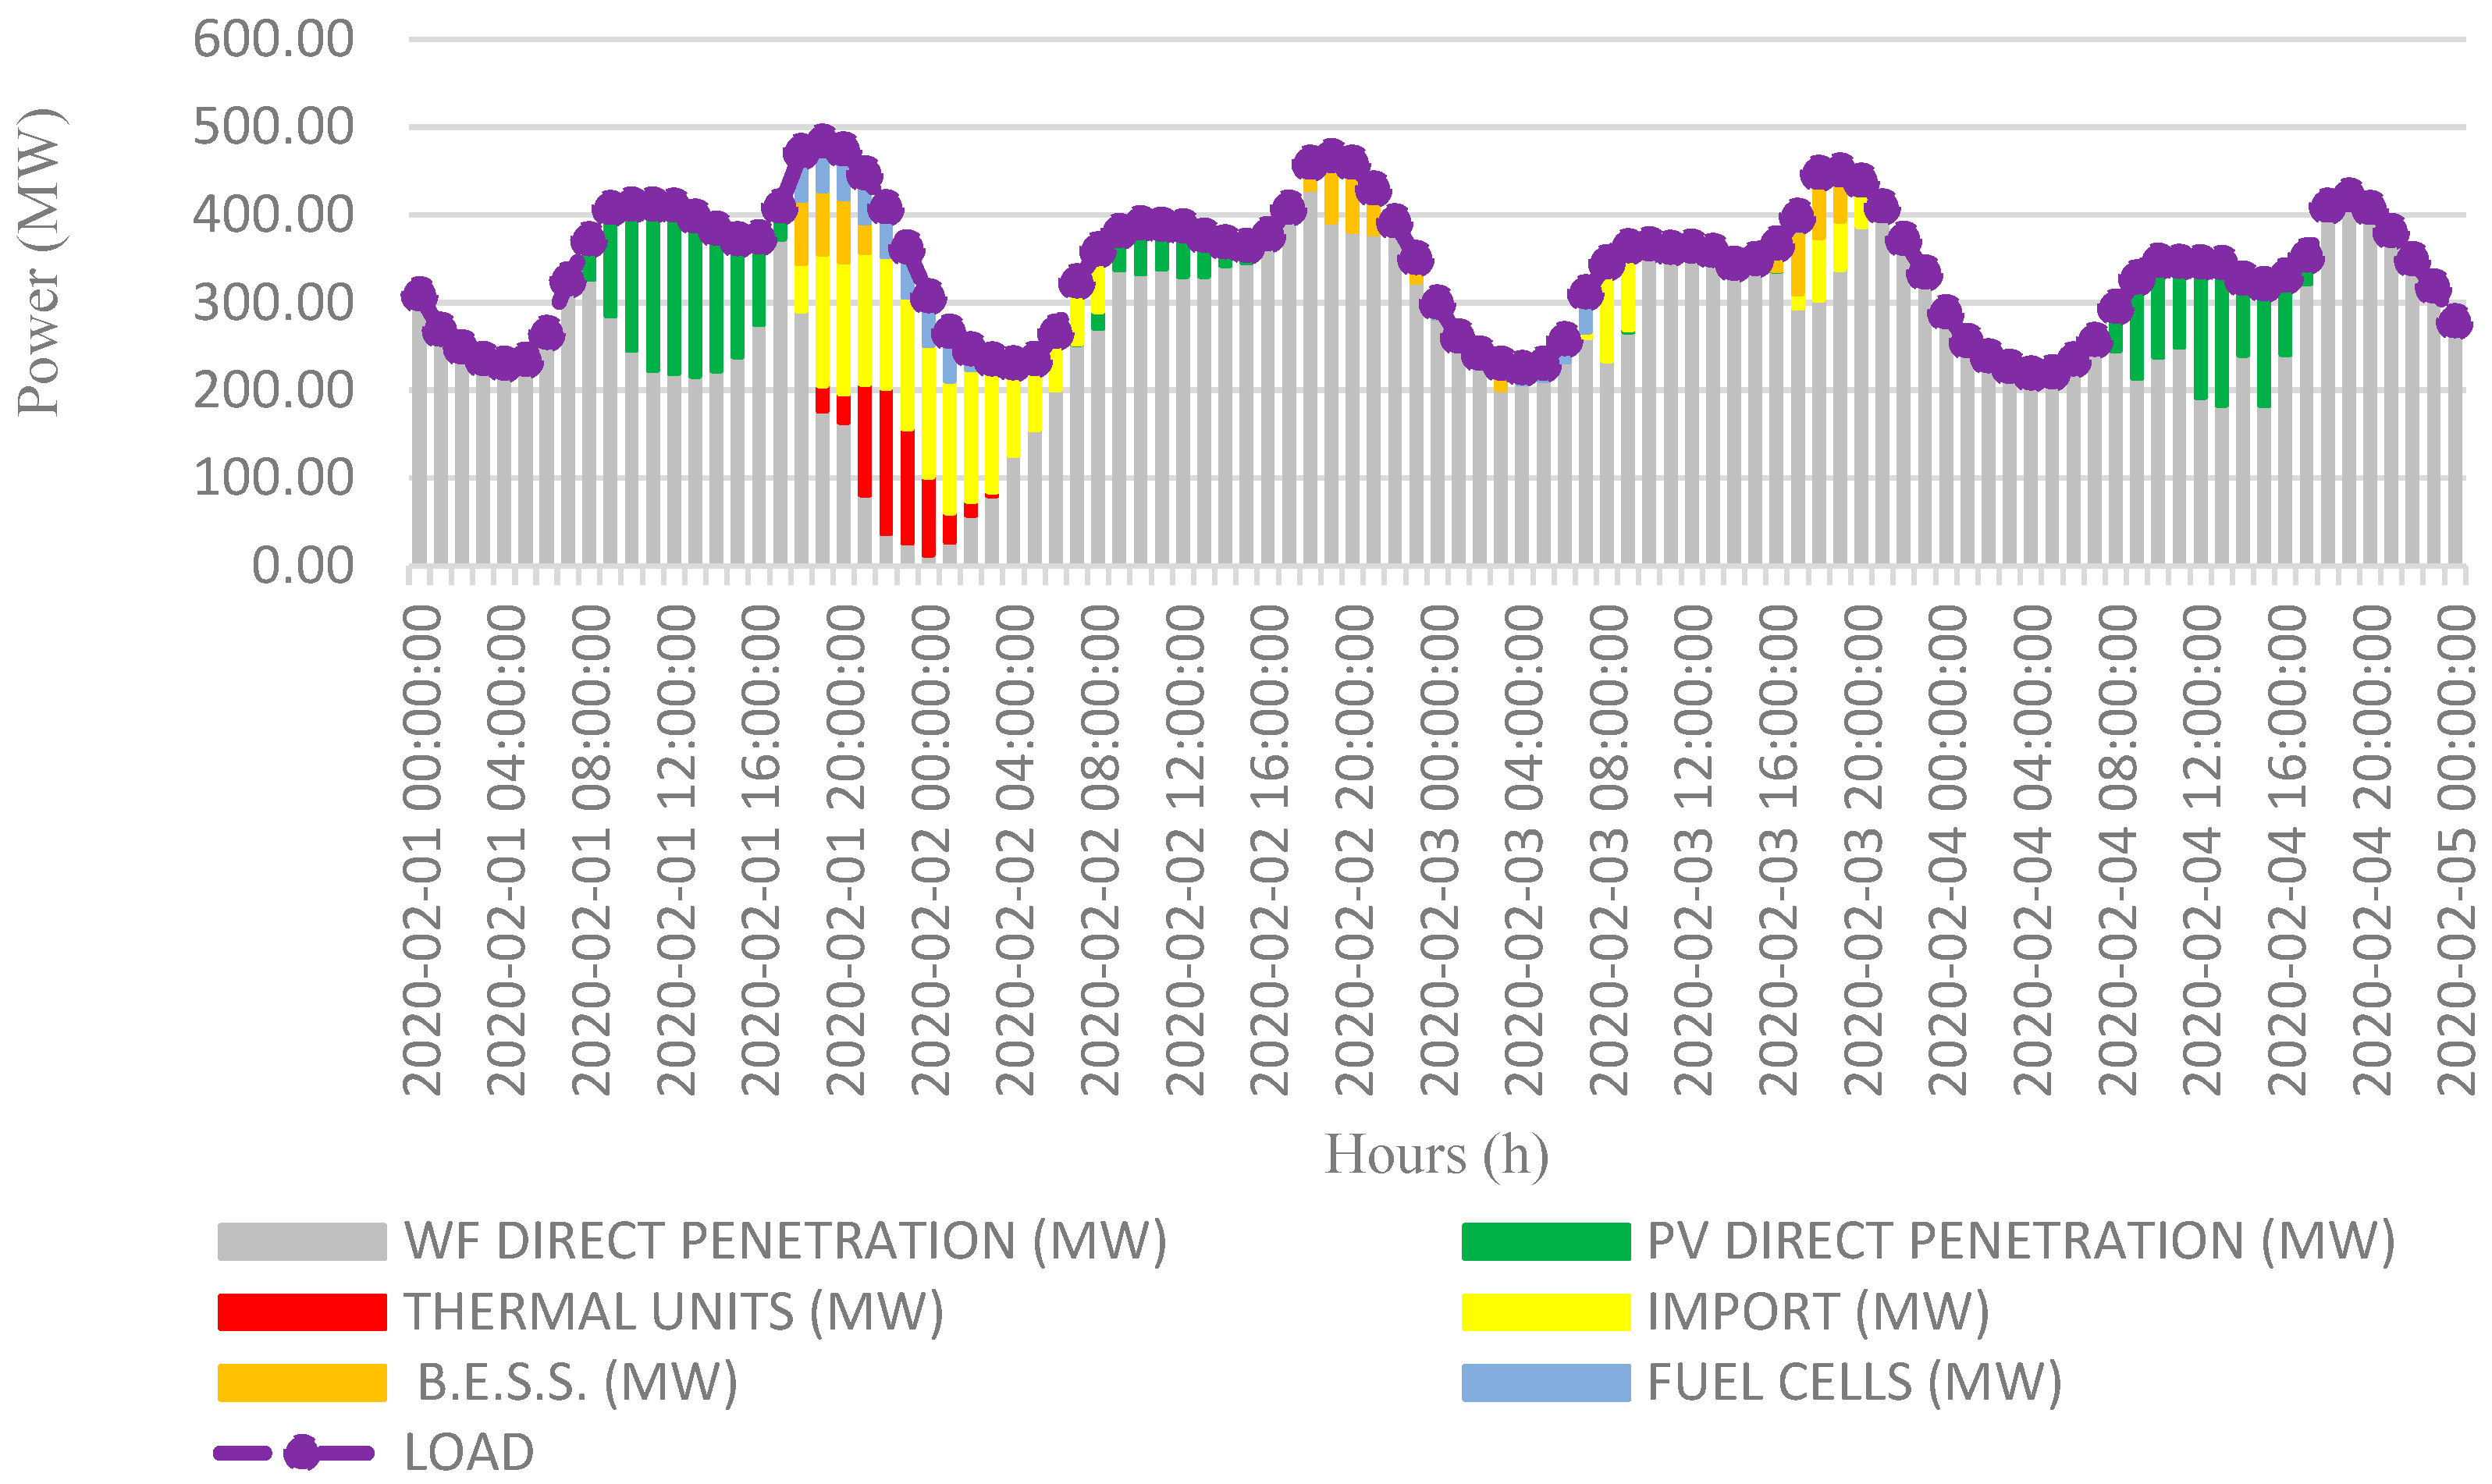
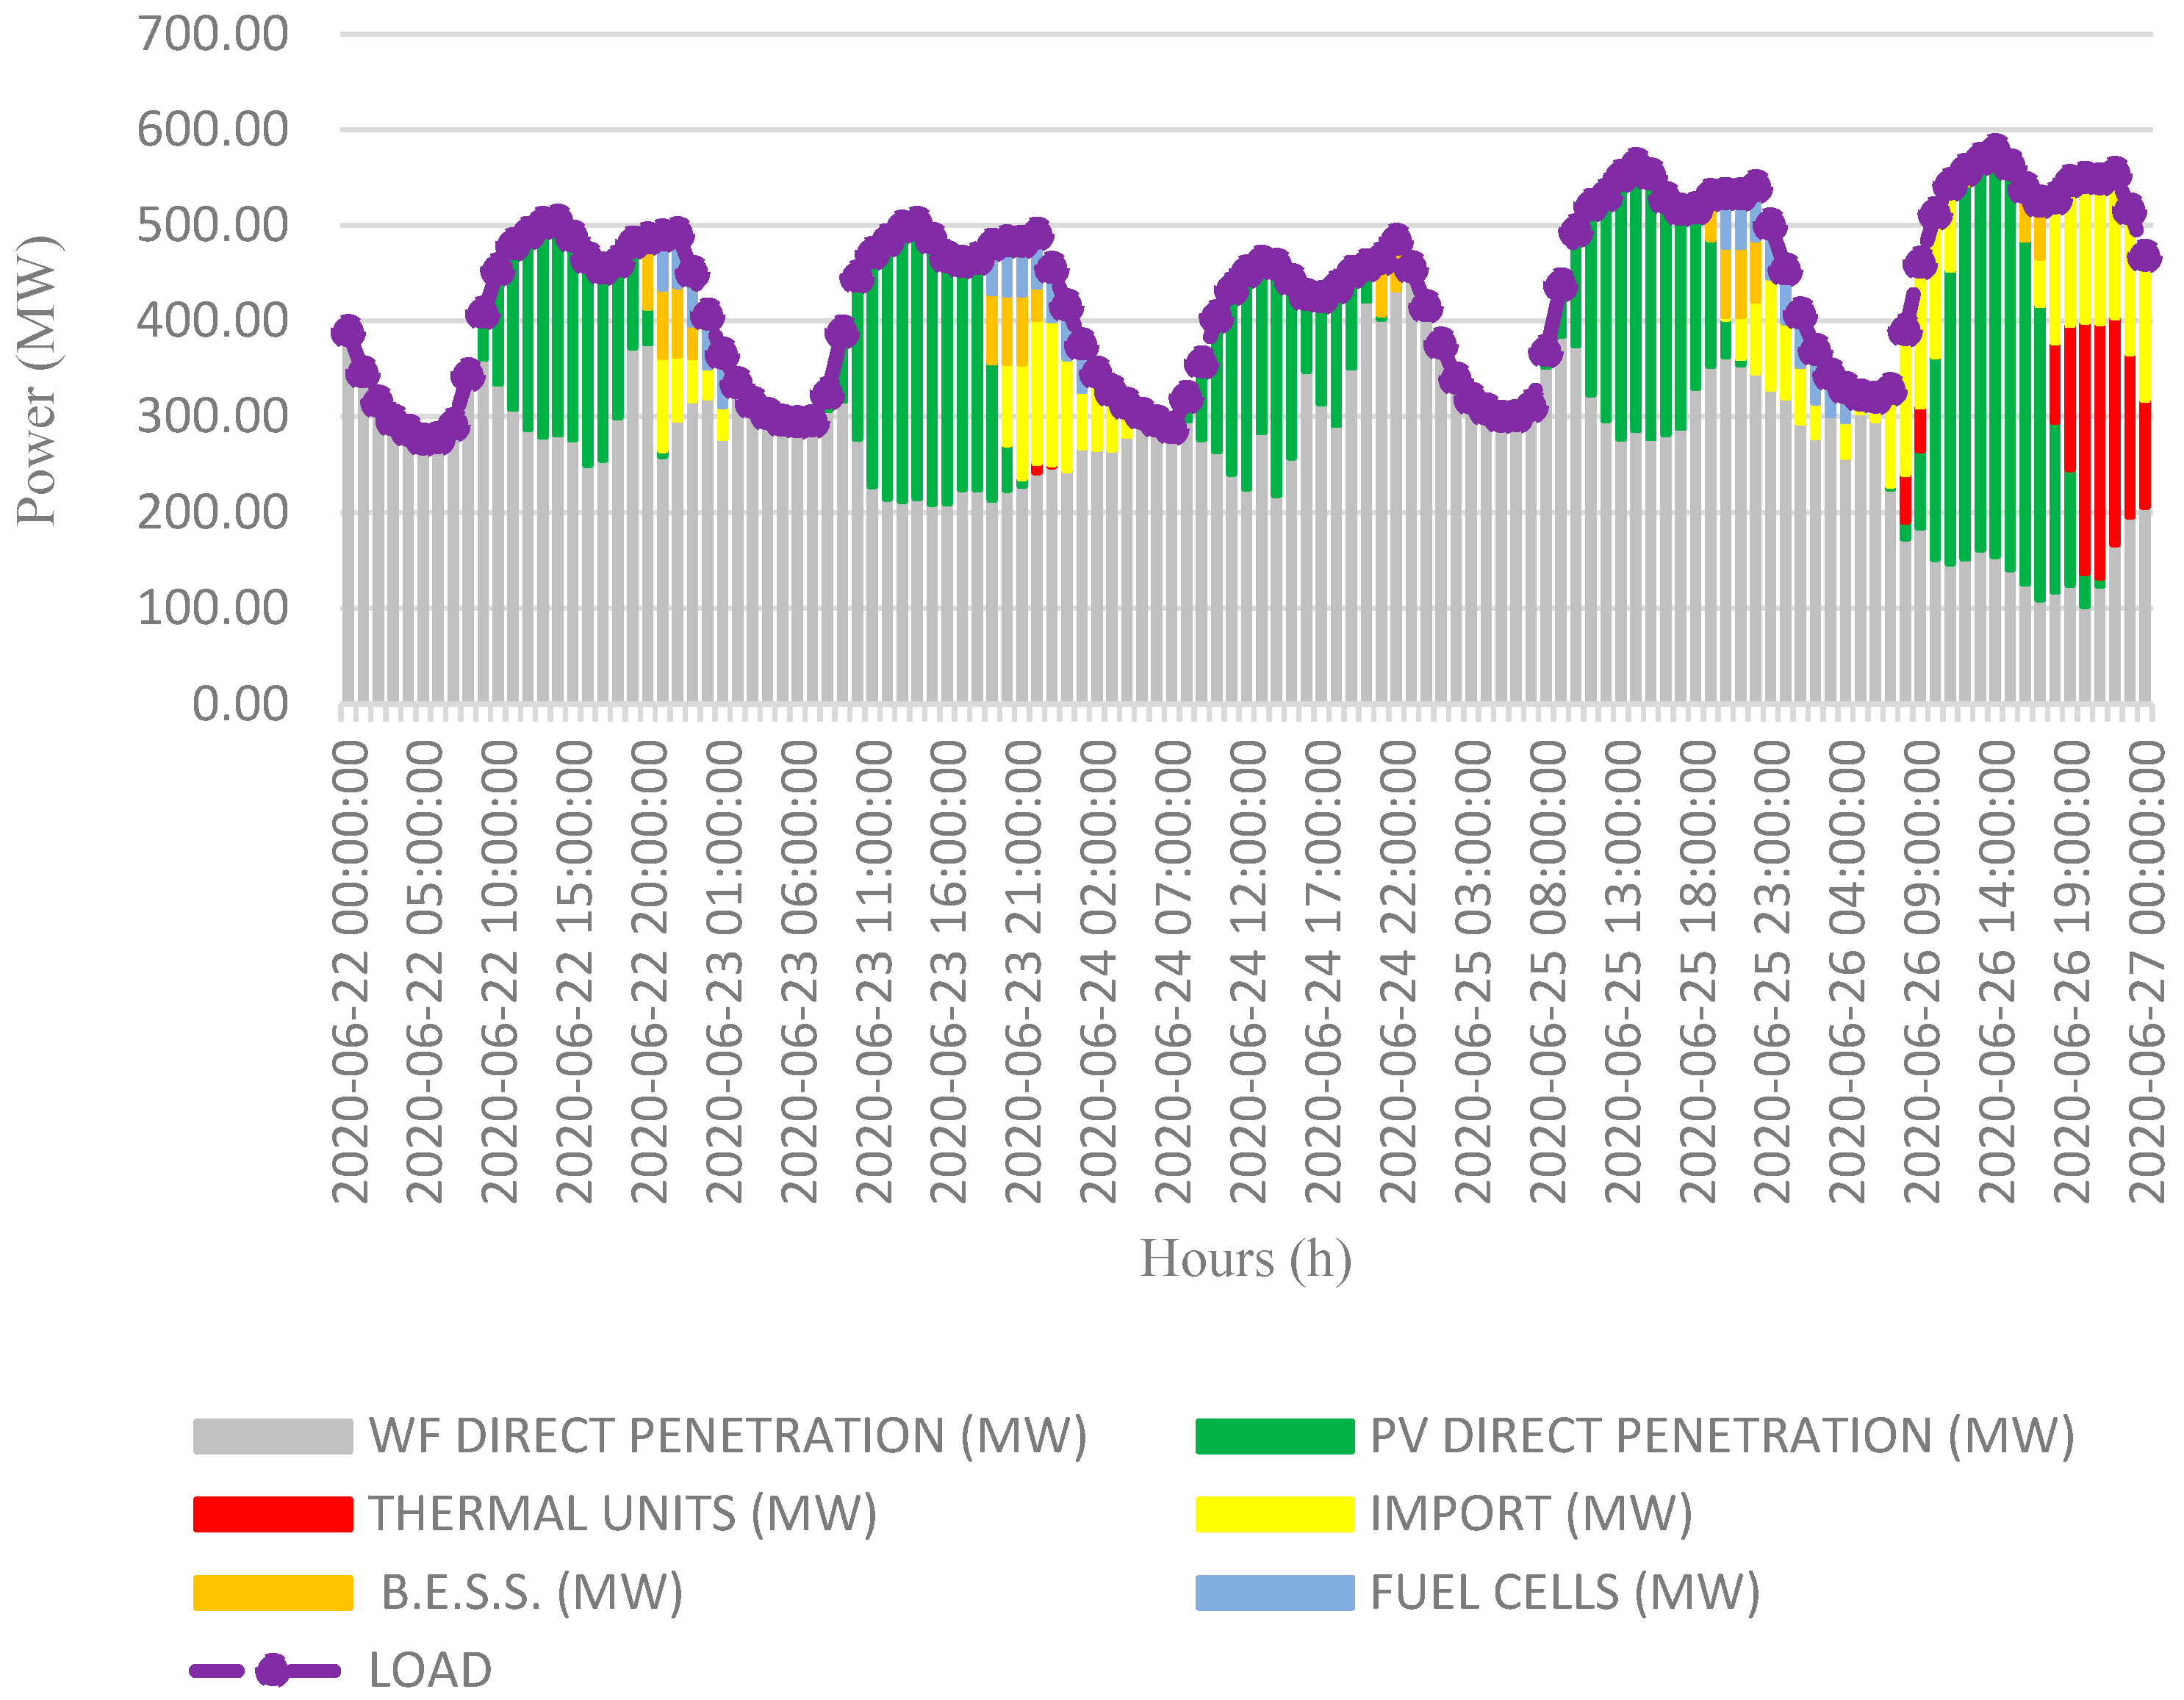
The power demand of the island is covered by the direct injection of the RESs, the discharging power of the B.E.S.S. and fuel cells, the imported power through the interconnection link, and the power of thermal units. The operation results for five indicative winter and summer days are illustrated in Figure 8 and Figure 9, respectively. The highest percentage of load is supplied from direct power of WPs thanks to the high installed power and capacity factor of WPs. It is important to note that a high wind potential is demonstrated not only during the winter, but also in the summer period, because of the famous wind “meltemia” that blows during the summer months above the Aegean Sea [10]. The unceasing wind potential throughout the whole year, including the peak touristic summer period, has created a favorable field for profitable investment in wind power on all Aegean islands [10]. In contrast, solar power presents considerable seasonal variations; for instance, as shown in Figure 8, on some winter days, the solar power is negligible. The storage and interconnection link are utilized only when demand surpasses RES power, usually during the night when the solar power is zero, e.g., on 22/6 at 22.00. Finally, local thermal power plants have an auxiliary role, when storage and link cannot cover the power deficit of renewables, e.g., on 26/6 at 22.00.
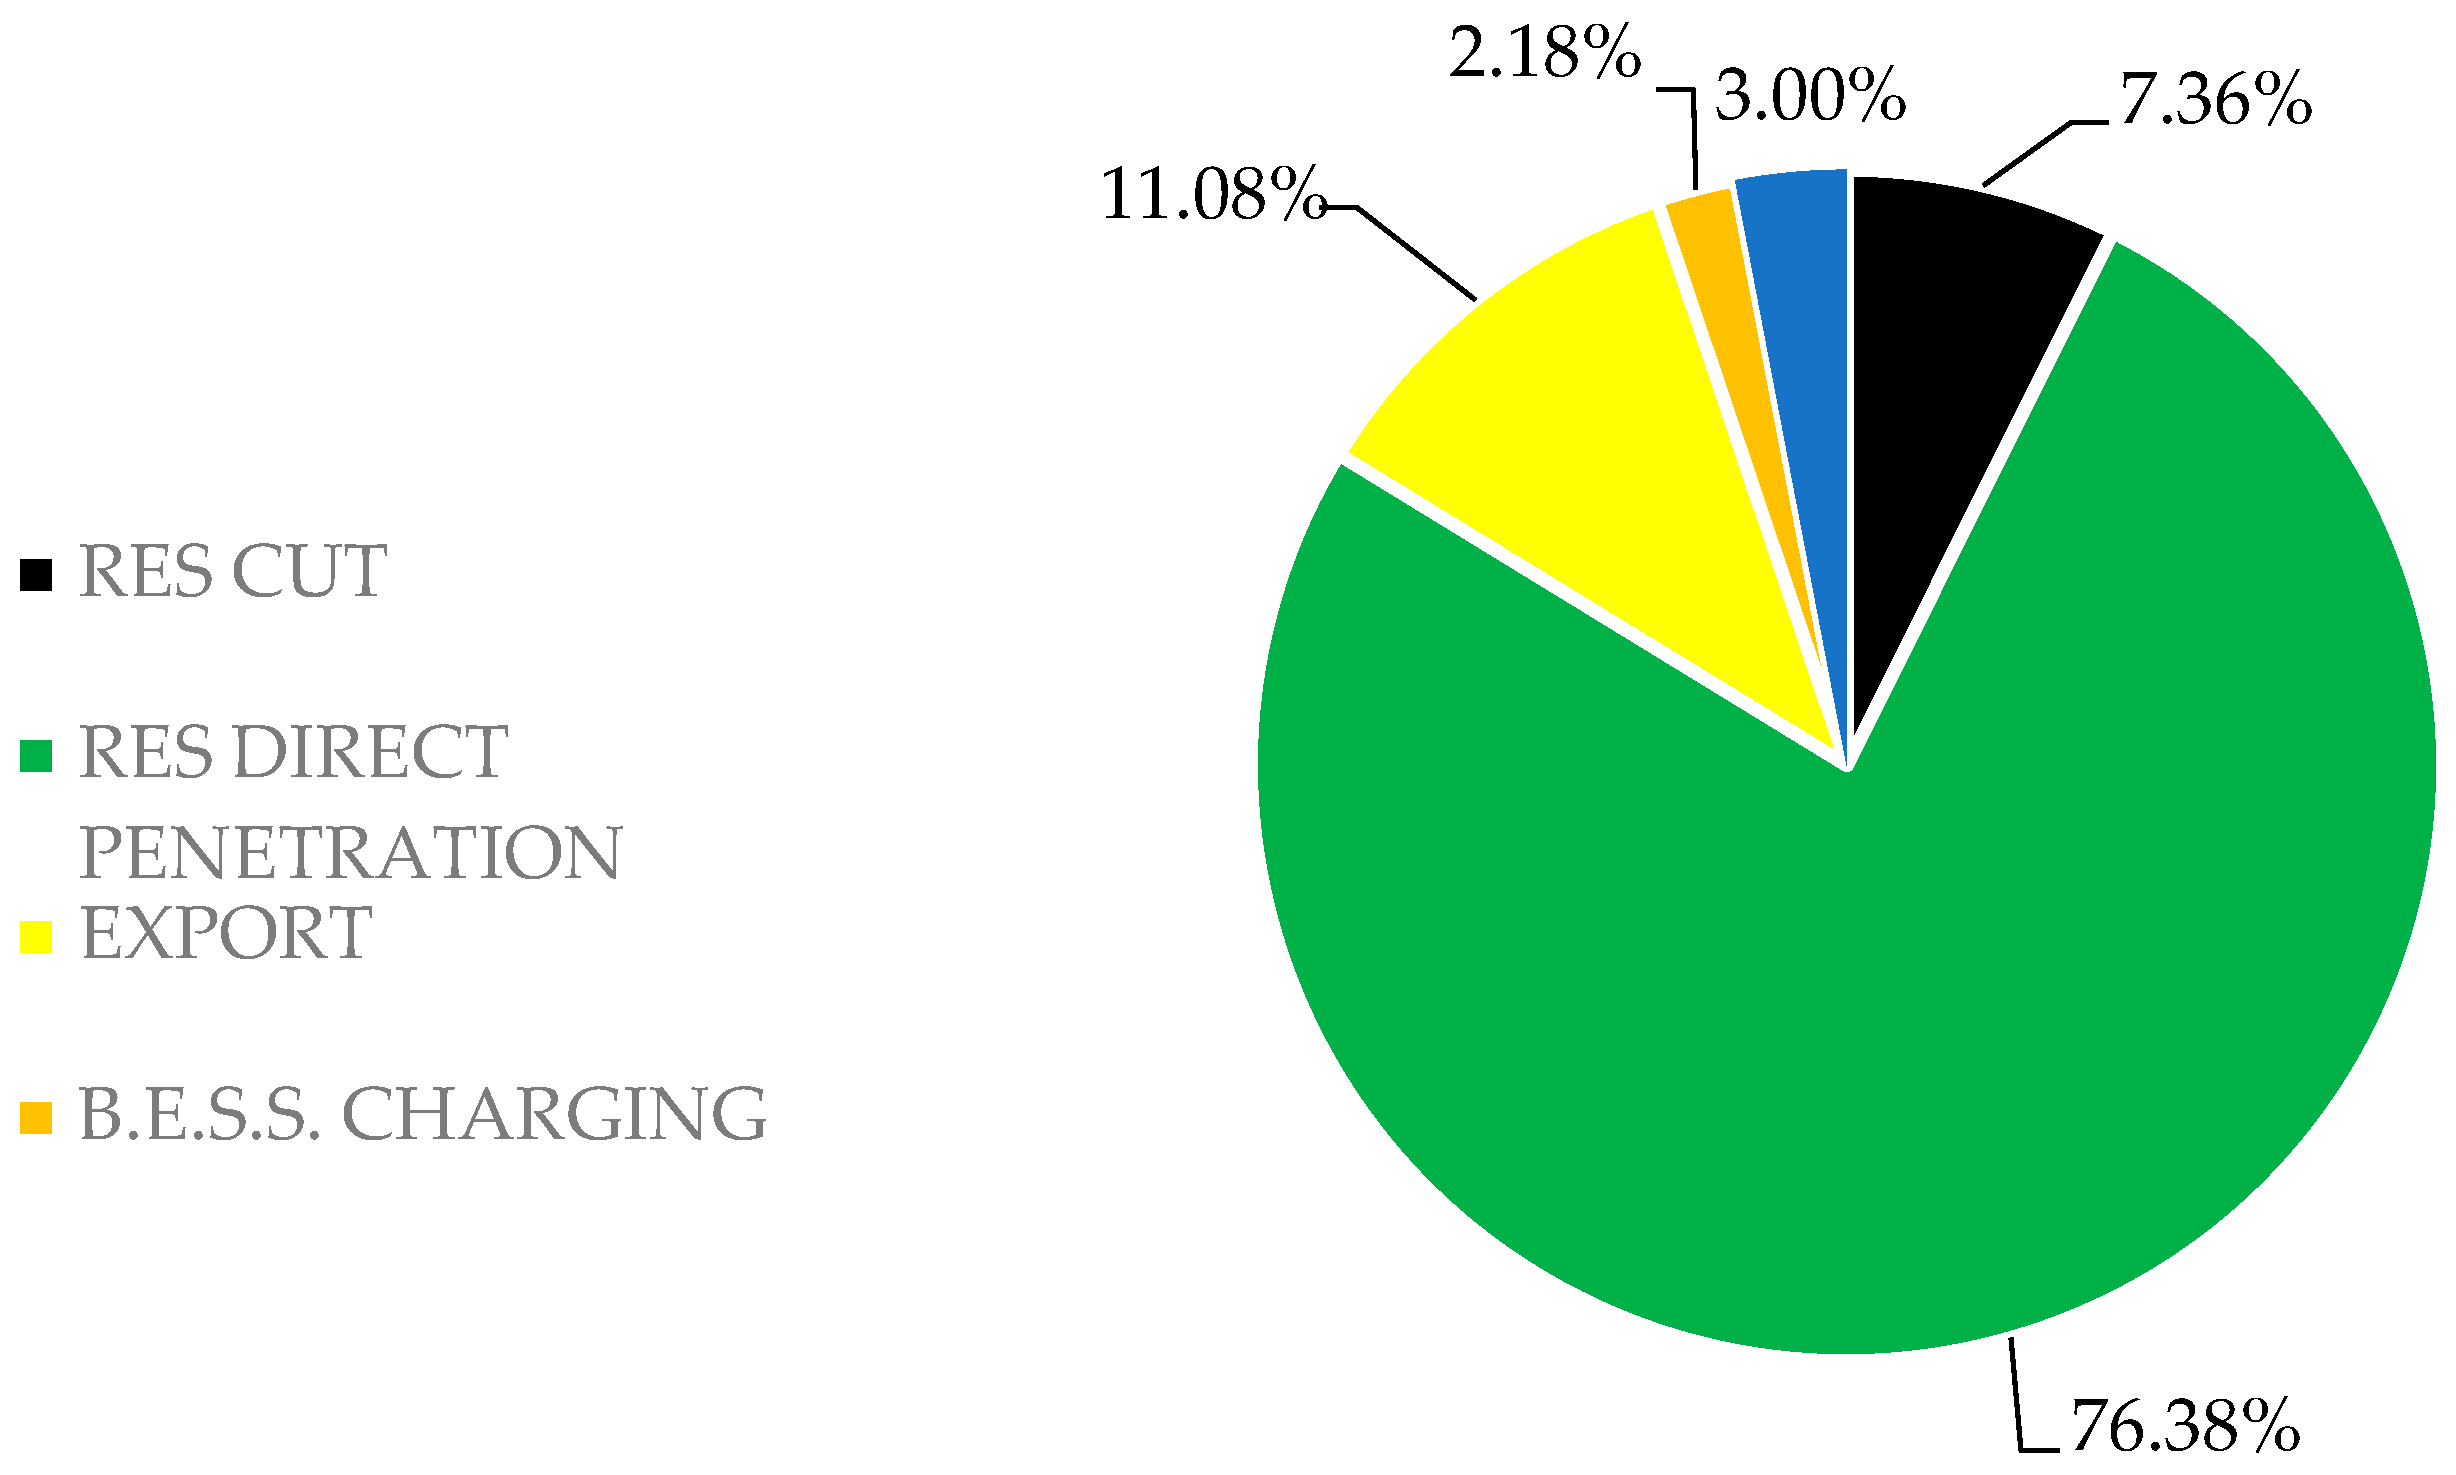
The annual energy mixture of every technology for the Cretan power system after the proposed investment is presented in Table 15. The superiority of wind and solar power is clearly shown, generating more than 70% and 25% of the annual load, respectively. Nevertheless, due to the heterochronism between RES production and load consumption, a part of RES power should be either stored, exported, or curtailed. A graph depicting the allocation of RES power is shown in Figure 10. The largest part of RES power (76.38%) is injected directly into the grid. A smaller part (11.08%) is exported to the mainland, while 5.18% feeds the electrolyzer and battery in order to be stored, and 7.36% is finally rejected.
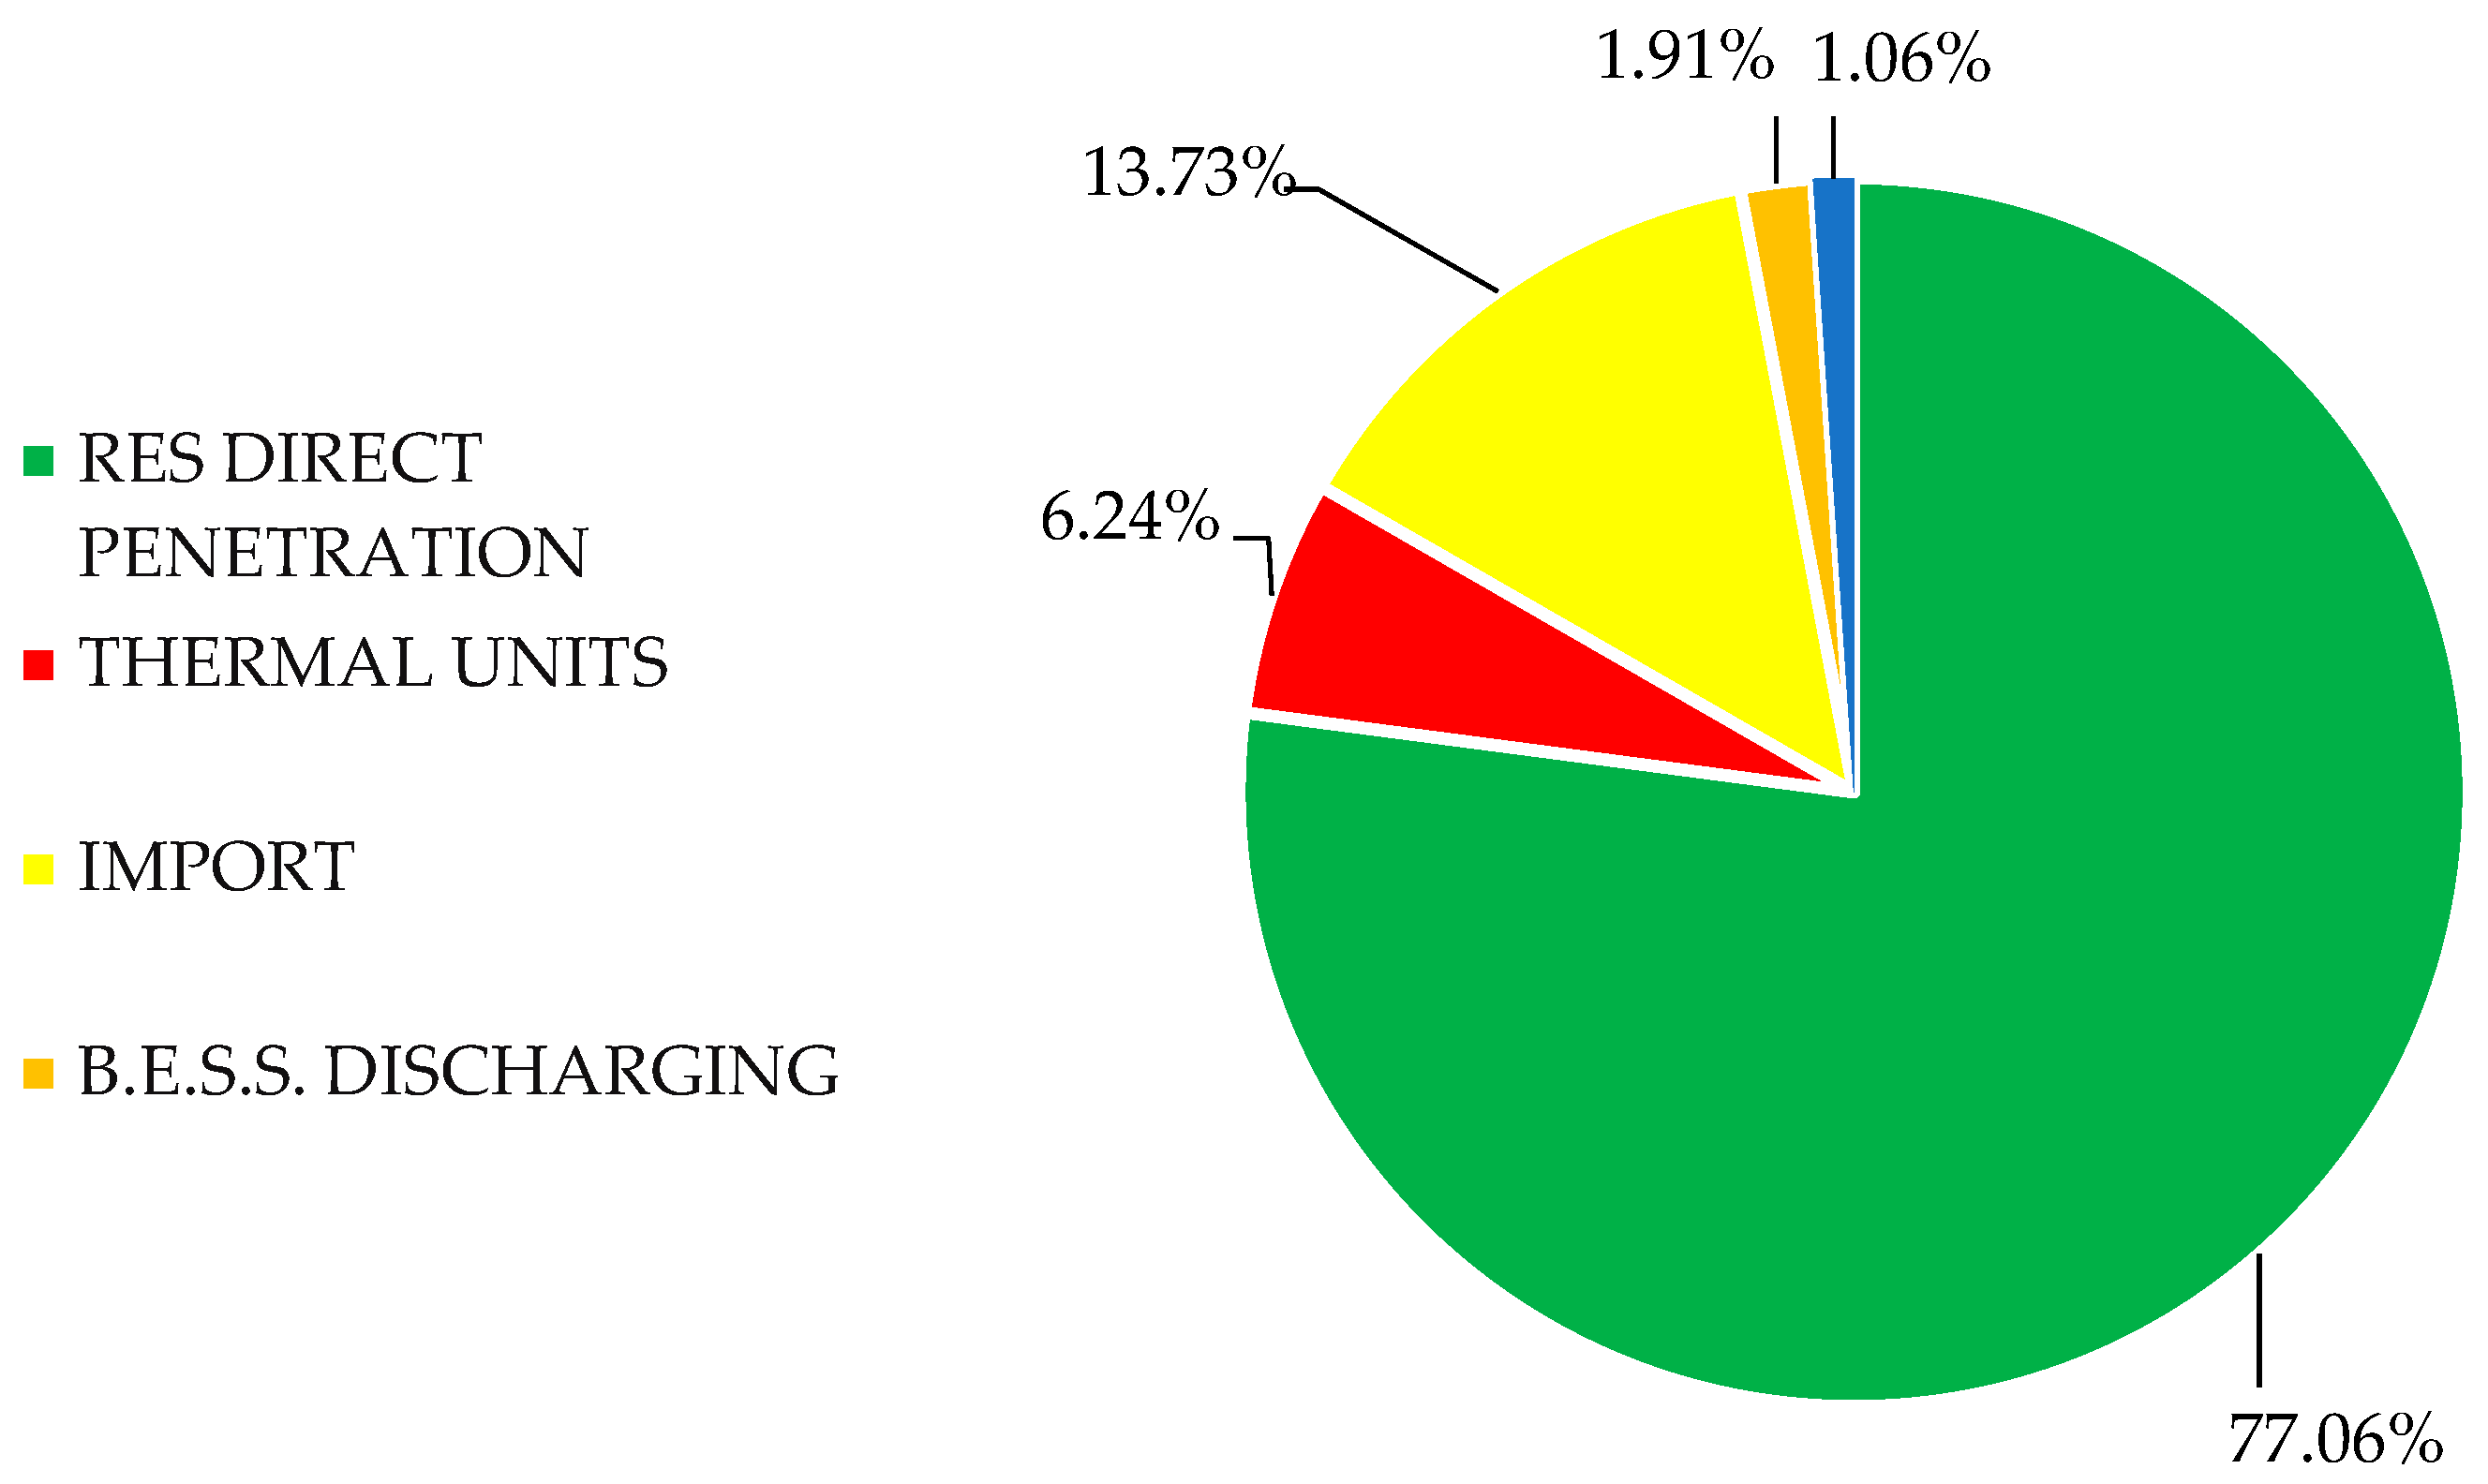
Figure 11 illustrates the extent to which the different sources contribute to the coverage of load. Specifically, 77.06% of annual load is covered by the direct RES penetration. Storage systems cover only a small portion (2.97%) of the total annual load. Moreover, the low efficiency of hydrogen, compared with the battery, is clearly shown in Figure 10 and Figure 11, as the charging of the electrolyzer has a much higher portion than the discharging of the fuel cell. The imported power contributes 13.73% to the annual load, while local oil-fired units contribute 6.24%. According to Figure 11, the constraints (7) and (8) are successfully satisfied since the thermal power plants contribute less than 10% to the annual coverage of load, as well as the sum of direct RES power and storage contributing by 80.03% (e.g., 77.06% + 1.91% + 1.06%).
5.4. Sensitivity Analysis
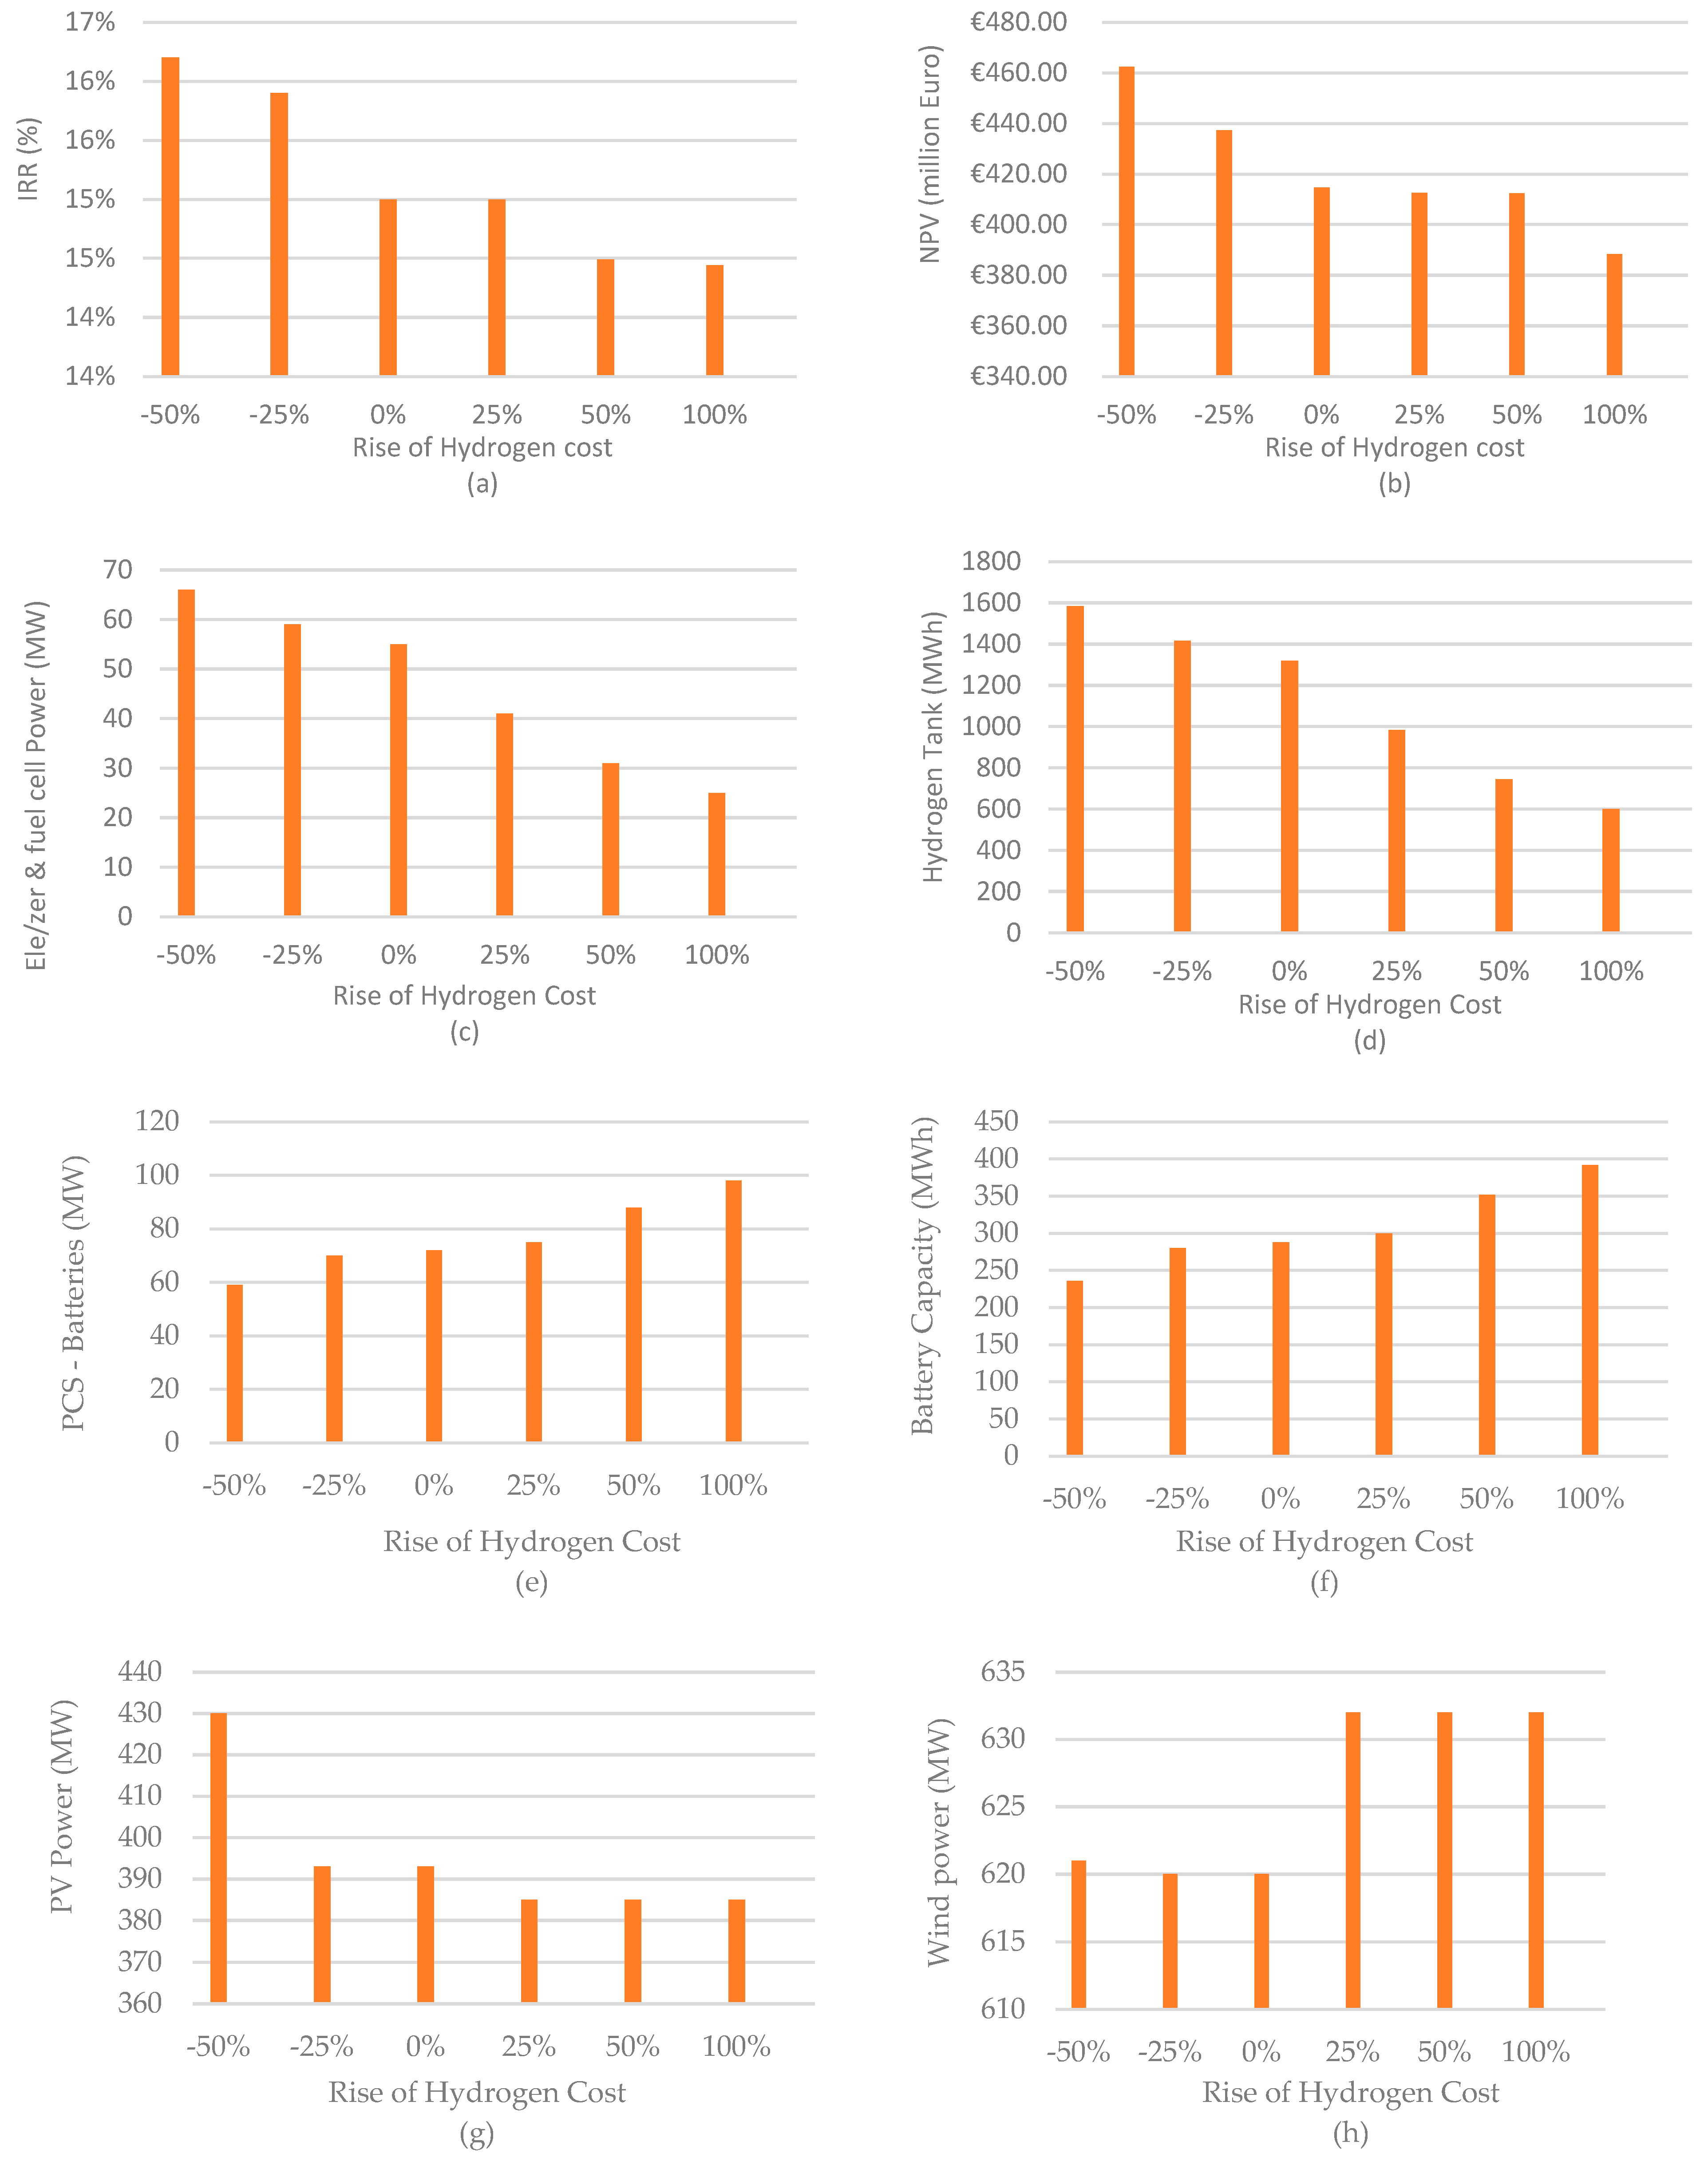
Sensitivity analysis is performed in this section to account for the uncertainty of the initial cost of the electrolyzer and fuel cells, as well as their influence on the profitability of the new investment. Specifically, six scenarios are examined assuming a different cost of hydrogen with respect to the base cost of Table 5, e.g., 1000 EUR/kW for the electrolyzer and 1500 EUR/kW for the fuel cell; for example, a rise of hydrogen cost by 100% denotes a duplication of electrolyzer and fuel cell costs. The results of the sensitivity analysis are depicted in Figure 12, including several economic indicators such as IRR and NPV, as well as the power and energy capacities of RES and ESSs. As shown, a reduction in electrolyzer and fuel cell cost by 50% (according to [16], electrolyzer cost is expected to be reduced to 570 EUR/kW by 2030) results in a rise of IRR and NPV by 1% and EUR 50 million, respectively. The reason is that the drop in the cost of hydrogen favors the rise of electrolyzer/fuel cell power by 11 MW (Figure 12c) and the hydrogen tank by 260 MWh (Figure 12d), creating storage space for hosting 40 MW of additional PV power (Figure 12g). Moreover, due to the rise of hydrogen tank capacity, the expensive battery is reduced by 50 MWh (Figure 12f), further contributing to the rise in NPV. In this way, the decrement of electrolyzer and fuel cell costs contributes to the rise in the NPV of the investment in two ways: both through the rise of RES capacity and the reduction in the size of the expensive battery.
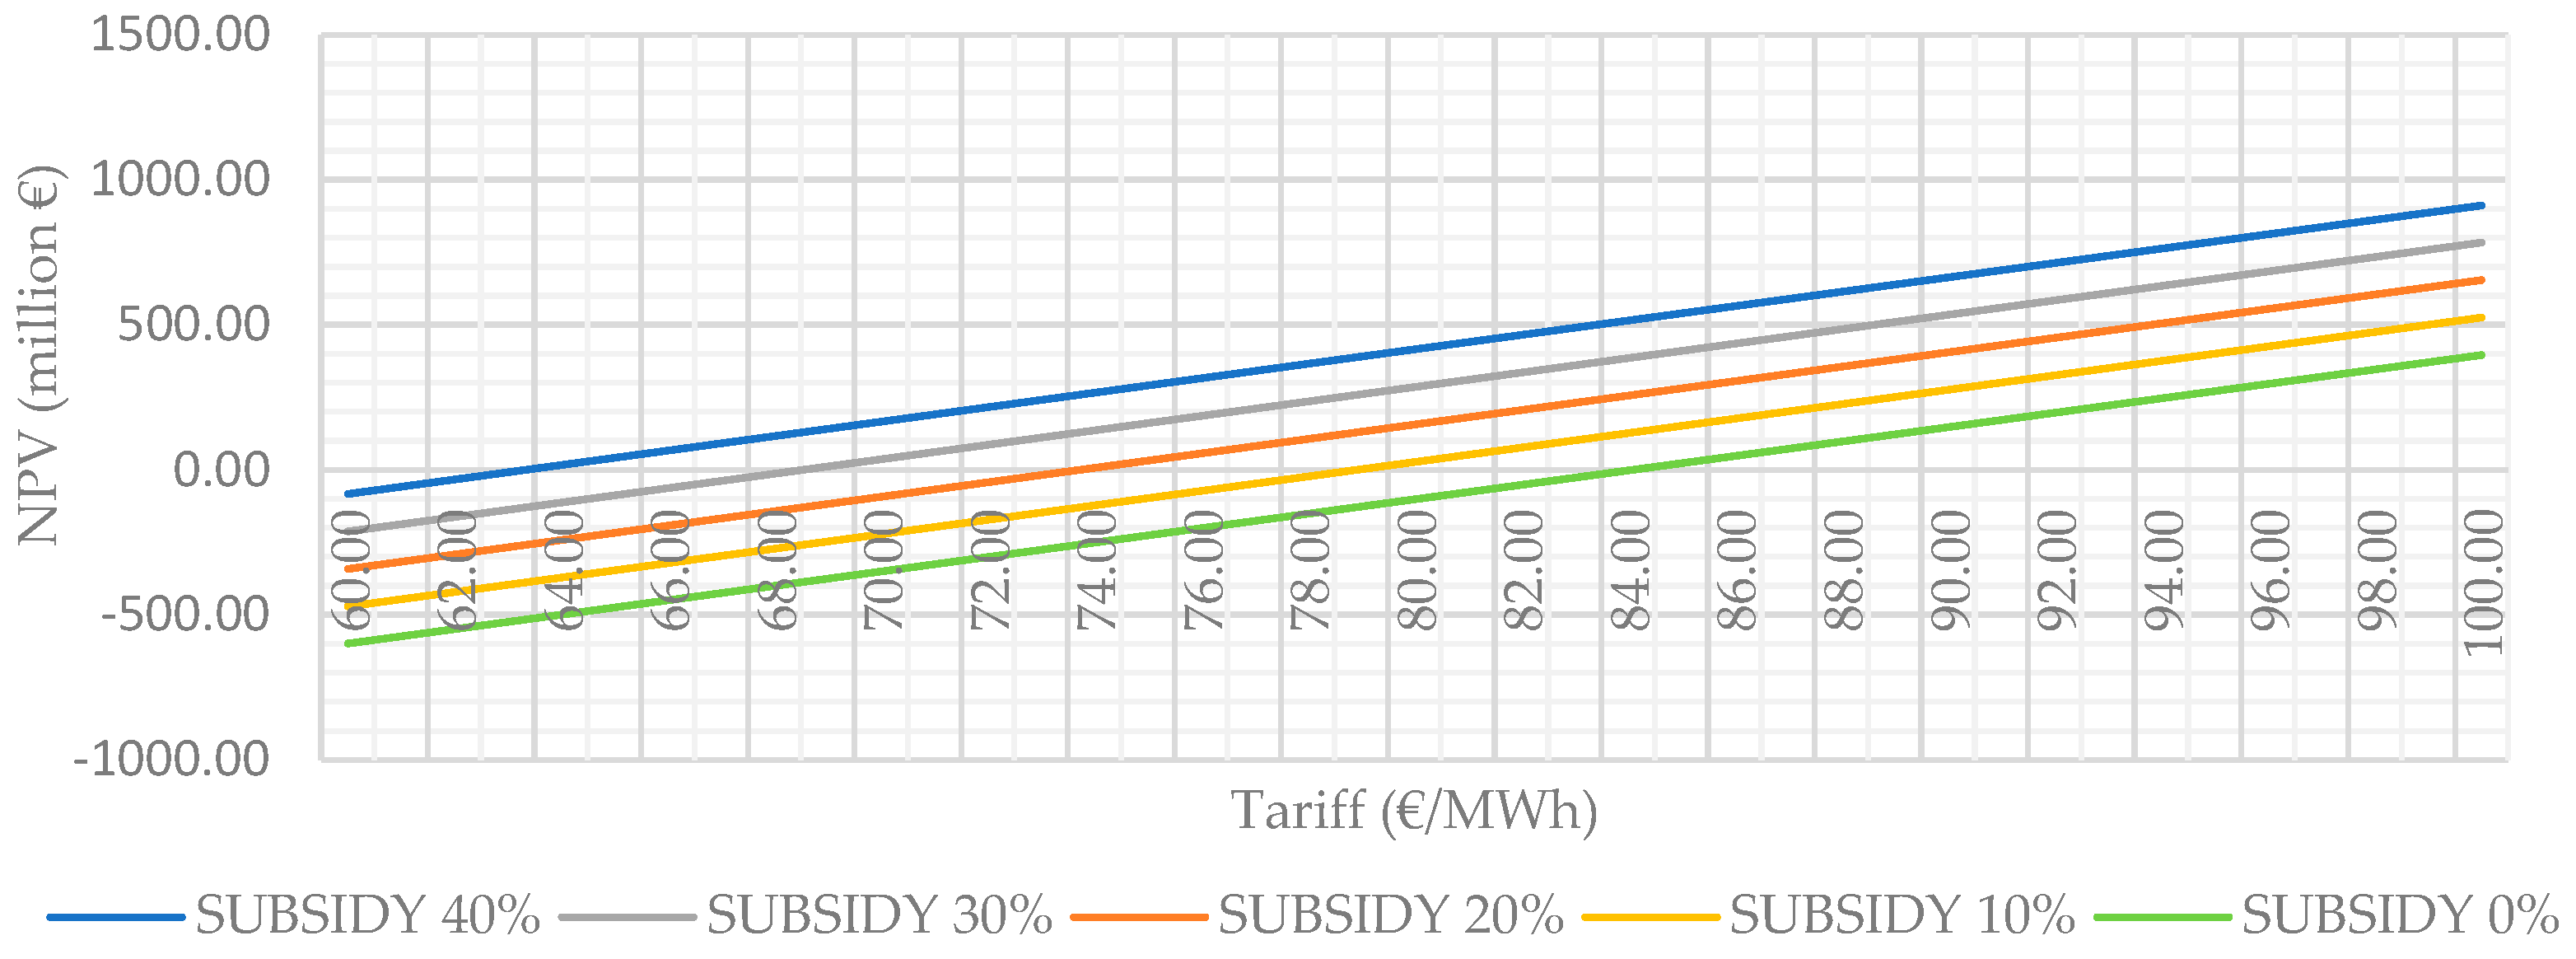
Figure 13 examines the economic profitability of the investment (NPV) for different subsidies and tariffs of renewables and storage. As expected, profitability is strongly dependent on the compensation tariff and subsidy of the investment, as the higher the subsidy and tariff, the higher the NPV. Specifically, the following basic conclusions are drawn from Figure 13:
- ✓
- In the case of a 40% subsidy, the investment becomes profitable (e.g., NPV > 0) even with a compensation tariff as low as 64 EUR/MWh. Given that most energy projects are subsidized around 40%, the new investment enables a huge reduction in the cost of electricity production in Crete. Specifically, the cost of electricity production in Crete is currently higher than 200 EUR/MWh [10] (due to the expensive thermal generators), namely much higher than 64 EUR/MWh. If we also consider the environmental benefits resulting from the decarbonization of the island, the energy transition presents multiple benefits.
- ✓
- In the case that the investment is not subsidized (0%), it becomes profitable only if the compensation tariff is higher than 85 EUR/MWh. As shown, even in that case, the electricity production cost after the energy transition is much lower than the current production cost of 200 EUR/MWh [10].
- ✓
- From the investor point of view, in the extreme case that the compensation tariff is 100 EUR/MWh and the investment is subsidized by 40%, the NPV raises up to EUR 900 million, confirming the huge investment opportunities that the decarbonization of Greek islands can offer, thanks to their extraordinary wind and solar potential.
6. Conclusions
This paper investigates the economic feasibility of a private investment in renewables and hybrid hydrogen-battery storage, in order to reach the national target of 80% renewable penetration in the interconnected island of Crete, Greece. Specifically, an optimization formulation is proposed to optimize the capacity of renewables and hybrid battery-hydrogen storage to maximize the profit of the investment, while simultaneously ensuring a minimum renewable penetration of 80%. The results indicate that hybrid hydrogen-battery storage can sustainably enable the energy transition of Crete, reducing the electricity production cost of the island to as low as 64 EUR/MWh, with obvious benefits for the prosperity of the island. For comparison, the electricity production cost of Crete is currently higher than 200 EUR/MWh. From the investor point of view, simulation results confirmed that the energy transition is profitable, even with low compensation tariffs, owing to the extraordinary wind and solar potential of Crete. For example, if the investment is subsidized by 40% (common rate in renewable energy projects) and the compensation tariff is 80 EUR/MWh, it presents a net present value as high as EUR 400 million, demonstrating a clear profit for the candidate investor. Finally, it is shown that the estimated reduction in the electrolyzer and fuel cell cost by 2030 will further increase the profitability of hybrid renewable-battery-hydrogen projects; indicatively, a reduction in the hydrogen cost by 50% results in a rise of NPV of the examined investment by EUR 50 million. The probable future mitigation of hydrogen production cost can contribute to the rise of NPV in a twofold way: both through the unlocking of additional RES capacity and the reduction in the size of the expensive battery. In this study, we focused solely on the energy transition of Crete’s electricity sector. Other energy domains like transportation and heating will be addressed in future research. Biofuels can complement renewables in decarbonizing these sectors as well, given the significant biomass potential of many islands including Crete [10,52,53,54,55,56].
Author Contributions
Conceptualization, E.K.; methodology, E.K. and C.K.; validation, E.P.; formal analysis, C.K.; writing—original draft preparation, C.K.; writing—review and editing, E.P.; supervision, E.K. All authors have read and agreed to the published version of the manuscript.
Funding
This research received no external funding.
Informed Consent Statement
Not applicable.
Data Availability Statement
The used data can be found at Hellenic Energy Exchange Market, https://www.enexgroup.gr/ (accessed on 1 September 2023).
Conflicts of Interest
The authors declare no conflict of interest.
Nomenclature
| GDP | Gross Domestic Product | - |
| WF | Wind Farms | - |
| HV | High AC Voltage | - |
| MV | Medium AC Voltage | |
| LV | Low AC Voltage | |
| PV | Photovoltaics | - |
| AC | Alternative Current | - |
| DC | Direct Current | - |
| DOD | Depth of Discharge | - |
| RESs | Renewable Energy Sources | - |
| ESSs | Energy Storage Systems | |
| SHPS | Small Hydroelectric Power Station | - |
| CF | Capacity Factor | - |
| PCS | Power Conversion System | - |
| Cap.Ex | Capital Expenses | - |
| Op.Ex | Operation Expenses | - |
| B.E.S.S | Battery Energy Storage Systems | - |
| PEM | Proton Exchange Membrane | - |
| O&M | Operation and Maintenance | - |
| H2 | Hydrogen | - |
| SOC | State of Charge | - |
| Symbol | Variables | Units |
| Power of photovoltaics at time t | MW | |
| Power of wind farms at time t | MW | |
| Power demand at time t | MW | |
| Charging power of B.E.S.S. at time t | MW | |
| Maximum charging power of B.E.S.S. at time t | MW | |
| at time t | MW | |
| Maximum capacity of B.E.S.S. | MWh | |
| Stored energy of B.E.S.S. at time t | MWh | |
| B.E.S.S. charging efficiency | - | |
| Electrolyzer’s power at time t | MW | |
| Maximum electrolyzer’s power | MW | |
| Maximum capacity of H2 tank | MWh | |
| Stored energy in the H2 tank at time t | MWh | |
| Efficiency of electrolyzer | - | |
| Power exported through the interconnection link at time t | MW | |
| Maximum exported power of the interconnection link at time t | MW | |
| Rejected renewable power at time t | MW | |
| Discharging power of B.E.S.S. at time t | MW | |
| Maximum discharging power of B.E.S.S. | MW | |
| B.E.S.S. discharging efficiency | - | |
| Fuel cell’s power at time t | MW | |
| Maximum fuel cell’s power | MW | |
| Fuel cell’s efficiency | - | |
| Power imported through the interconnection link at time t | MW | |
| Maximum imported power of the interconnection link | MW | |
| Power of thermal units at time t | MW | |
| Initial_Cost | Sum of Cap.Ex of the newly installed RESs and ESSs | € |
| Cash_flowsy | Total incomes (income-expenses) of the newly installed RESs and ESSs for year y | € |
| IRR | Internal rate of return | - |
| Capital expenses of the newly installed PV | € | |
| Capital expenses of the newly installed WF | € | |
| Capital expenses of the newly installed PCS | € | |
| Capital expenses of the newly installed battery devices | € | |
| Capital expenses of the newly installed electrolyzers | € | |
| Capital expenses of the newly installed fuel cells | € | |
| Capital expenses of the newly installed hydrogen tanks | € | |
| Incomes of the newly installed RESs and ESSs for year y | € | |
| The expenses of the loan (interest payment + initial loan repayment) for year y | € | |
| INFL | Ιnflation | % |
| Operation expenses for year y | € | |
| Operation and maintenance expenses for year y | € | |
| Unpredicted expenses for the year y | € | |
| Tariff (selling price) of direct penetration of RESs | ||
| Tariff (selling price) of stored energy | ||
| The percentage of investment costs financed by share capital | % | |
| The percentage of investment costs financed by loans | % | |
| Loan interest rate | % | |
| RPM | Loan’s repayment period | years |
| SH | Share capital of the investments | € |
| DIR | Interest rate on deposits | % |
| CRT | Corporate tax rate | % |
| Total amount of energy sold from RESs and ESSs | ||
| N.P.V | Net present value | € |
| W.A.C.C | Weighted average cost of capital | % |
| L.C.O.E | Levelized cost of energy | |
| Horizon | Lifetime of the project | years |
References
- Kavadias, K.; Apostolou, D.; Kaldellis, J. Modelling and optimisation of a hydrogen-based energy storage system in an autonomous electrical network. Appl. Energy 2018, 227, 574–586. [Google Scholar] [CrossRef]
- Bouzounierakis, N.; Katsigiannis, Y.; Fiorentzis, K.; Karapidakis, E. Effect of Hybrid Power Station Installation in the Operation of Insular Power Systems. Inventions 2019, 4, 38. [Google Scholar] [CrossRef]
- Fiorentzis, K.; Katsigiannis, Y.; Karapidakis, E. Full-Scale Implementation of RES and Storage in an Island Energy System. Inventions 2020, 5, 52. [Google Scholar] [CrossRef]
- Global Wind Atlas [Computer Software]. 2022. Available online: https://globalwindatlas.info/en/ (accessed on 3 October 2023).
- Photovoltaic Geographical Information System [Computer Software]. 2022. Available online: https://re.jrc.ec.europa.eu/pvg_tools/en/ (accessed on 3 October 2023).
- Pompodakis, E.E.; Kryonidis, G.C.; Karapidakis, E.S. Volt/Var control and energy management in non-interconnected insular networks with multiple hybrid power plants. Appl. Energy 2023, 331, 120427. [Google Scholar] [CrossRef]
- Cheng, Y.; Azizipanah-Abarghooee, R.; Azizi, S.; Ding, L.; Terzija, V. Smart frequency control in low inertia energy systems based on frequency response techniques: A review. Appl. Energy 2020, 279, 115798. [Google Scholar] [CrossRef]
- Zafeiratou, E.; Spataru, C.; Spataru, C. Potential economic and environmental benefits from the interconnection of the Greek islands. Int. J. Glob. Warm. 2017, 13, 426. [Google Scholar] [CrossRef]
- Karystianos, M.E.; Pitas, C.N.; Efstathiou, S.P.; Tsili, M.A.; Mantzaris, J.C.; Leonidaki, E.A.; Voumvoulakis, E.M.; Sakellaridis, N.G. Planning of Aegean Archipelago Interconnections to the Continental Power System of Greece. Energies 2021, 14, 3818. [Google Scholar] [CrossRef]
- Katsaprakakis, D.A.; Michopoulos, A.; Skoulou, V.; Dakanali, E.; Maragkaki, A.; Pappa, S.; Antonakakis, I.; Christakis, D.; Condaxakis, C. A Multidisciplinary Approach for an Effective and Rational Energy Transition in Crete Island, Greece. Energies 2022, 15, 3010. [Google Scholar] [CrossRef]
- Schmidt, O.; Melchior, S.; Hawkes, A.; Staffell, I. Projecting the Future Levelized Cost of Electricity Storage Technologies. Joule 2019, 3, 81–100. [Google Scholar] [CrossRef]
- Hunter, C.A.; Penev, M.M.; Reznicek, E.P.; Eichman, J.; Rustagi, N.; Baldwin, S.F. Techno-economic analysis of long-duration energy storage and flexible power generation technologies to support high-variable renewable energy grids. Joule 2021, 5, 2077–2101. [Google Scholar] [CrossRef]
- Kapsali, M.; Anagnostopoulos, J. Investigating the role of local pumped-hydro energy storage in interconnected island grids with high wind power generation. Renew. Energy 2017, 114, 614–628. [Google Scholar] [CrossRef]
- Liu, T.; Yang, Z.; Duan, Y. Short- and long-duration cooperative energy storage system: Optimizing sizing and comparing rule-based strategies. Energy 2023, 281, 128273. [Google Scholar] [CrossRef]
- Twitchell, J.; DeSomber, K.; Bhatnagar, D. Defining long duration energy storage. J. Energy Storage 2023, 60, 105787. [Google Scholar] [CrossRef]
- Dong, W.; Li, Y.; Xiang, J. Optimal Sizing of a Stand-Alone Hybrid Power System Based on Battery/Hydrogen with an Improved Ant Colony Optimization. Energies 2016, 9, 785. [Google Scholar] [CrossRef]
- Dawood, F.; Shafiullah, G.; Anda, M. Stand-Alone Microgrid with 100% Renewable Energy: A Case Study with Hybrid Solar PV-Battery-Hydrogen. Sustainability 2020, 12, 2047. [Google Scholar] [CrossRef]
- Li, C.-H.; Zhu, X.-J.; Cao, G.-Y.; Sui, S.; Hu, M.-R. Dynamic modeling and sizing optimization of stand-alone photovoltaic power systems using hybrid energy storage technology. Renew. Energy 2009, 34, 815–826. [Google Scholar] [CrossRef]
- Marocco, P.; Ferrero, D.; Lanzini, A.; Santarelli, M. Optimal design of stand-alone solutions based on RES + hydrogen storage feeding off-grid communities. Energy Convers. Manag. 2021, 238, 114147. [Google Scholar] [CrossRef]
- Marocco, P.; Ferrero, D.; Gandiglio, M.; Ortiz, M.; Sundseth, K.; Lanzini, A.; Santarelli, M. A study of the techno-economic feasibility of H2-based energy storage systems in remote areas. Energy Convers. Manag. 2020, 211, 112768. [Google Scholar] [CrossRef]
- Marocco, P.; Ferrero, D.; Lanzini, A.; Santarelli, M. The role of hydrogen in the optimal design of off-grid hybrid renewable energy systems. J. Energy Storage 2022, 46, 103893. [Google Scholar] [CrossRef]
- Kharel, S.; Shabani, B. Hydrogen as a Long-Term Large-Scale Energy Storage Solution to Support Renewables. Energies 2018, 11, 2825. [Google Scholar] [CrossRef]
- Marchenko, O.; Solomin, S. Modeling of hydrogen and electrical energy storages in wind/PV energy system on the Lake Baikal coast. Int. J. Hydrogen Energy 2017, 42, 9361–9370. [Google Scholar] [CrossRef]
- Kalantari, H.; Ghoreishi-Madiseh, S.A.; Sasmito, A.P. Hybrid Renewable Hydrogen Energy Solution for Application in Remote Mines. Energies 2020, 13, 6365. [Google Scholar] [CrossRef]
- Ahadi, A.; Liang, X. A stand-alone hybrid renewable energy system assessment using cost optimization method. In Proceedings of the 2017 IEEE International Conference on Industrial Technology (ICIT), Toronto, ON, Canada, 22–25 March 2017; pp. 376–381. [Google Scholar]
- Puranen, P.; Kosonen, A.; Ahola, J. Technical feasibility evaluation of a solar PV based off-grid domestic energy system with battery and hydrogen energy storage in northern climates. Sol. Energy 2020, 213, 246–259. [Google Scholar] [CrossRef]
- Abdin, Z.; Al Khafaf, N.; McGrath, B.; Catchpole, K.; Gray, E. A review of renewable hydrogen hybrid energy systems towards a sustainable energy value chain. Sustain. Energy Fuels 2023, 7, 2042–2062. [Google Scholar] [CrossRef]
- Pompodakis, E.; Kryonidis, G.C.; Karapidakis, E. Optimizing the Installation of Hybrid Power Plants in Non-Interconnected Islands. TechRxiv 2023. preprint. [Google Scholar] [CrossRef]
- Hosseini, S.E. Hydrogen has found its way to become the fuel of the future. Future Energy 2022, 1, 11–12. [Google Scholar] [CrossRef]
- Nguyen, H.Q.; Aris, A.M.; Shabani, B. PEM fuel cell heat recovery for preheating inlet air in standalone solar-hydrogen systems for telecommunication applications: An exergy analysis. Int. J. Hydrogen Energy 2016, 41, 2987–3003. [Google Scholar] [CrossRef]
- Dursun, B. Determination of the optimum hybrid renewable power generating systems for Kavakli campus of Kirklareli University, Turkey. Renew. Sustain. Energy Rev. 2012, 16, 6183–6190. [Google Scholar] [CrossRef]
- Colbertaldo, P.; Agustin, S.B.; Campanari, S.; Brouwer, J. Impact of hydrogen energy storage on California electric power system: Towards 100% renewable electricity. Int. J. Hydrogen Energy 2019, 44, 9558–9576. [Google Scholar] [CrossRef]
- Peppas, A.; Kollias, K.; Politis, A.; Karalis, L.; Taxiarchou, M.; Paspaliaris, I. Performance evaluation and life cycle analysis of RES-hydrogen hybrid energy system for office building. Int. J. Hydrogen Energy 2020, 46, 6286–6298. [Google Scholar] [CrossRef]
- Lokar, J.; Virtič, P. The potential for integration of hydrogen for complete energy self-sufficiency in residential buildings with photovoltaic and battery storage systems. Int. J. Hydrogen Energy 2020, 45, 34566–34578. [Google Scholar] [CrossRef]
- Jafari, M.; Armaghan, D.; Mahmoudi, S.S.; Chitsaz, A. Thermoeconomic analysis of a standalone solar hydrogen system with hybrid energy storage. Int. J. Hydrogen Energy 2019, 44, 19614–19627. [Google Scholar] [CrossRef]
- Ntomaris, V.; Bakirtzis, A.G. Stochastic scheduling of hybrid power stations in insular power systems with high wind penetration. IEEE Trans. Power Syst. 2016, 31, 3424–3436. [Google Scholar] [CrossRef]
- Hellenic Statistical Authority. Available online: https://www.statistics.gr/el/home (accessed on 3 October 2023).
- Hellenic Electricity Distribution Network Operator SA (HEDNO). Annual report for the power system of Crete, 2014–2021.
- Independent Power Transmission Operator (IPTO). Annual report for the power system of Crete, 2021.
- Poullikkas, A. An overview of current and future sustainable gas turbine technologies. Renew. Sustain. Energy Rev. 2005, 9, 409–443. [Google Scholar] [CrossRef]
- Mishkin, F.S. The Economics of Money, Banking, and Financial Markets; Pearson Education: Toronto, ON, Canada, 2011. [Google Scholar]
- Castillo, A.; Gayme, D.F. Grid-scale energy storage applications in renewable energy integration: A survey. Energy Convers. Manag. 2014, 87, 885–894. [Google Scholar] [CrossRef]
- Zakeri, B.; Syri, S. Electrical energy storage systems: A comparative life cycle cost analysis. Renew. Sustain. Energy Rev. 2015, 42, 569–596. [Google Scholar] [CrossRef]
- Behabtu, H.A.; Messagie, M.; Coosemans, T.; Berecibar, M.; Anlay Fante, K.; Kebede, A.A.; Mierlo, J.V. A Review of Energy Storage Technologies’ Application Potentials in Renewable Energy Sources Grid Integration. Sustainability 2020, 12, 10511. [Google Scholar] [CrossRef]
- Nasser, M.; Megahed, T.F.; Ookawara, S.; Hassan, H. Techno-economic assessment of clean hydrogen production and storage using hybrid renewable energy system of PV/Wind under different climatic conditions. Sustain. Energy Technol. Assessments 2022, 52, 102195. [Google Scholar] [CrossRef]
- Bhandari, R.; Ronak, R.S. Hydrogen as energy carrier: Techno-economic assessment of de-centralized hydrogen production in Germany. Renew. Energy 2021, 177, 915–931. [Google Scholar] [CrossRef]
- Becherif, M.; Ramadan, H.; Cabaret, K.; Picard, F.; Simoncini, N.; Bethoux, O. Hydrogen Energy Storage: New Techno-Economic Emergence Solution Analysis. Energy Procedia 2015, 74, 371–380. [Google Scholar] [CrossRef]
- Atilhan, S.; Park, S.; El-Halwagi, M.M.; Atilhan, M.; Moore, M.; Nielsen, R.B. Green hydrogen as an alternative fuel for the shipping industry. Curr. Opin. Chem. Eng. 2021, 31, 100668. [Google Scholar] [CrossRef]
- Hellenic Regulatory Authority of Energy. Performance and Safety Specifications of Battery Energy Storage Systems (BESS). Available online: https://www.rae.gr/wp-content/uploads/2023/06/H1_BESS-Installation-Safety-and-Performance-Specifications.pdf/ (accessed on 3 October 2023).
- Stori, V. Offshore Wind to Green Hydrogen: Insights from Europe; Clean Energy States Alliance: Montpelier, VT, USA, 2021. [Google Scholar]
- Balkan Green Energy News. July 2023. Available online: https://balkangreenenergynews.com/greece-targets-80-from-renewables-by-2030-with-28-gw-plus-7-gw-storage/ (accessed on 3 October 2023).
- Mridha, B.; Ramana, G.; Pareek, S.; Sarkar, B. An efficient sustainable smart approach to biofuel production with emphasizing the environmental and energy aspects. Fuel 2023, 336, 126896. [Google Scholar] [CrossRef]
- Mishra, U.; Wu, J.-Z.; Sarkar, B. A sustainable production-inventory model for a controllable carbon emissions rate under shortages. J. Clean. Prod. 2020, 256, 120268. [Google Scholar] [CrossRef]
- Mittal, M.; Sarkar, B. Stochastic behavior of exchange rate on an international supply chain under random energy price. Math. Comput. Simul. 2023, 205, 232–250. [Google Scholar] [CrossRef]
- Sarkar, B.; Mridha, B.; Pareek, S. A sustainable smart multi-type biofuel manufacturing with the optimum energy utilization under flexible production. J. Clean. Prod. 2021, 332, 129869. [Google Scholar] [CrossRef]
- Sarkar, B.; Mridha, B.; Pareek, S.; Sarkar, M.; Thangavelu, L. A flexible biofuel and bioenergy production system with transportation disruption under a sustainable supply chain network. J. Clean. Prod. 2021, 317, 128079. [Google Scholar] [CrossRef]
Figure 1.
Crete’s GDP during the period 2013–2019.

Figure 2.
Interconnection of Crete’s power system with Peloponnese.

Figure 3.
Interconnection of Crete’s power system with Attica.

Figure 4.
Share of renewable production between 2014 and 2020.

Figure 5.
Priority order of power sources: green (RES) as 1st priority, orange (BESS) as 2nd, gray (green hydrogen) as 3rd, yellow (interconnection) as 4th, and red as the final priority (thermal units).
Figure 5.
Priority order of power sources: green (RES) as 1st priority, orange (BESS) as 2nd, gray (green hydrogen) as 3rd, yellow (interconnection) as 4th, and red as the final priority (thermal units).

Figure 6.
Methodology algorithm flowchart.

Figure 7.
Total load of the island of Crete, throughout one year.

Figure 8.
Hourly profile from the different sources for five representative winter days.

Figure 9.
Hourly profile from the different sources for five representative summer days.

Figure 10.
Allocation of annual RES energy in Crete.

Figure 11.
Coverage of annual load from the different sources.

Figure 12.
From top to bottom and left to right: Influence of the percentage rise of electrolyzer/fuel cell capital cost on the (a) IRR, (b) NPV, (c) electrolyzer and fuel cell power, (d) hydrogen tank, (e) battery inverter power, (f) battery capacity, (g) newly installed PV power, (h) newly installed wind power. 0% corresponds to the baseline case.

Figure 13.
NPVs with respect to different compensation tariffs (selling prices).


Table 1.
Wind parks in each regional unit of Crete.
| Number of WPs | Nominal Power (MW) | Regional Unit |
|---|---|---|
| 5 | 29 | Chania |
| 7 | 47.70 | Heraklion |
| 22 | 108.15 | Lasithi |
| 4 | 24.60 | Rethymno |
Table 2.
Installed power per fuel for the first power plant.
| Nominal Power (MW) | Thermal Unit | |
|---|---|---|
| 49.20 | Diesel units | Mazut (crude oil) |
| 118.40 | Gas turbines | Mazut (crude oil) |
| 111.20 | Steam units | Diesel |
Table 3.
Installed power per fuel for the second power plant.
| Nominal Power (MW) | Thermal Unit | |
|---|---|---|
| 296.40 | Gas turbines | Diesel |
| 42.40 | Steam units | Mazut (crude oil) |
Table 4.
Installed power per fuel for the third power plant.
| Nominal Power (MW) | Thermal Unit | |
|---|---|---|
| 136.70 | Diesel units | Mazut (crude oil) |
| 93.00 | Steam units | Mazut (crude oil) |
Table 5.
CAPEX and OPEX of each technology.
| Technology | CAPEX | OPEX (%) |
|---|---|---|
| Photovoltaics (€/kW) | 1020 | 2 |
| Wind Parks (€/kW) | 1200 | 2 |
| Lithium—Ion B.E.S.S (€/kWh) | 250 | 2 |
| PCS—B.E.S.S (€/kW) | 100 | 2 |
| Electrolyzer (€/kW) | 1000 | 2 |
| M Fuel Cell (€/kW) | 1500 | 2 |
| H2 Tank (€/kWh) | 15.4 | 2 |
Table 6.
O&M and replacement cost of each technology.
| Technology | O&M (%) | Replacement Cost |
|---|---|---|
| Photovoltaics (€/kW) | 2 | Replaced at the end of the project |
| Wind Parks (€/kW) | 2 | Replaced at the end of the project |
| Lithium—Ion B.E.S.S. (€/kWh) | 2 | EUR 180 at 10th year |
| PCS—B.E.S.S. (€/kW) | 2 | Replaced at the end of the project |
| H2 PEM Electrolyzer (€/kW) | 2 | EUR 430 at 10th year |
| H2 PEM Fuel Cell (€/kW) | 2 | EUR 610 at 10th year |
| H2 Tank (€/kWh) | 2 | Replaced at the end of the project |
Table 7.
Efficiencies and dept of discharge of B.E.S.S. and hydrogen.
| Technology—State | Efficiency—DOD (%) |
|---|---|
| 93–95 | |
| 91–93 | |
| 70 | |
| 50 | |
| Battery depth of discharge (DOD) | 100 |
| H2 Tank depth of discharge (DOD) | 100 |
Table 8.
Financial structure of the investment.
| Sources of Capital | Participation Rate (%) |
|---|---|
| 30 | |
| 30 | |
| Subsidy | 40 |
Table 9.
Economic indicators.
| Inflation (INFL) (%) | 7 |
| Loan interest rate (LIR) (%) | 5 |
| Loan’s repayment period (RPM) (years) | 7 |
| Ιnterest rate on deposits (%) (DIR) | 2 |
| Corporate tax rate (%) (CRT) | 26 |
| SPRES (€/MWh) | 80 |
| SPESS (€/MWh) | 80 |
Table 10.
Optimized RES and ESS power/capacity per technology.
| RES/Storage Unit | Nominal Power/Capacity |
|---|---|
| Existing WPs (MW) | 209.45 |
| Newly (optimal) installed WPs (MW) | 620 |
| Existing PVs (MW) | 107 |
| Newly (optimal) installed PVs (MW) | 393 |
| Optimal B.E.S.S. power (MW) | 72 |
| Optimal B.E.S.S. capacity (MWh) | 288 |
| Optimal electrolyzer power (MW) | 55 |
| Optimal fuel cell power (MW) | 55 |
| Optimal H2 tank capacity (MWh) | 1320 |
Table 11.
Financial analysis of the proposed investment.
| Power Unit | CAPEX (€) | OPEX (€/yr) | O&M (€/yr) |
|---|---|---|---|
| New PV Power Stations | 400,860,000 | 8,017,200 | 8,017,200 |
| New WF | 744,000,000 | 14,880,000 | 14,880,000 |
| B.E.S.S.—Batteries | 72,000,000 | 1,440,000 | 1,440,000 |
| B.E.S.S.—PCS | 7,200,000 | 720,000 | 720,000 |
| H2–PEM Electrolyzer | 55,000,000 | 1,100,000 | 1,100,000 |
| H2–Tank | 20,295,680 | 405,913 | 405,913 |
| H2–Fuel Cell | 82,500,000 | 1,650,000 | 1,650,000 |
| H2–Water | - | 1391 | - |
| Total | 1,381,855,680 | 28,214,504 | 28,213,113 |
Table 12.
Financial structure of the investment.
| Sources of Capital | Participation Rate (€) |
|---|---|
| 414,556,704 | |
| Loan | 414,556,704 |
| Subsidy | 552,742,272 |
Table 13.
Annual generated energy and incomes of each technology.
| Technology | Generated Energy (MWh) | Gross Incomes (€/Year) |
|---|---|---|
| PV direct injection | 623,837.19 | 49,906,974.92 |
| WF direct injection | 1,795,270.79 | 143,621,663.48 |
| B.E.S.S. discharging | 59,872.08 | 4,789,766.76 |
| H2 fuel cells | 33,209.81 | 2,656,784.78 |
Table 14.
Financial indicators.
| Indexes | Value |
|---|---|
| WACC (%) | 2 |
| IRR (%) | 15 |
| NPV (€) | 414,889,899.61 |
| LCOE (€/MWh) | 71.71 |
Table 15.
Annual energy mix of Crete after the new investment.
| Unit | Energy (MWh) |
|---|---|
| Total Annual Load | 3,139,183.89 |
| Total Wind Generation | 2,315,009.75 |
| Total Solar Generation | 851,841.07 |
| Total RES Generation | 3,166,850.82 |
| RES Direct Penetration | 2,419,107.98 |
| RES Cut | 233,069.97 |
| Thermal Units | 195,849.88 |
| Link Export | 350,896.93 |
| Link Import | 431,144.14 |
| B.E.S.S. Discharging | 59,872.08 |
| B.E.S.S. Charging | 68,890.78 |
| Fuel Cells | 33,209.81 |
| Electrolyzers | 94,885.17 |
Disclaimer/Publisher’s Note: The statements, opinions and data contained in all publications are solely those of the individual author(s) and contributor(s) and not of MDPI and/or the editor(s). MDPI and/or the editor(s) disclaim responsibility for any injury to people or property resulting from any ideas, methods, instructions or products referred to in the content. |
© 2023 by the authors. Licensee MDPI, Basel, Switzerland. This article is an open access article distributed under the terms and conditions of the Creative Commons Attribution (CC BY) license (https://creativecommons.org/licenses/by/4.0/).
Share and Cite
MDPI and ACS Style
Karapidakis, E.; Kalogerakis, C.; Pompodakis, E. Sustainable Power Generation Expansion in Island Systems with Extensive RES and Energy Storage. Inventions 2023, 8, 127. https://doi.org/10.3390/inventions8050127
AMA Style
Karapidakis E, Kalogerakis C, Pompodakis E. Sustainable Power Generation Expansion in Island Systems with Extensive RES and Energy Storage. Inventions. 2023; 8(5):127. https://doi.org/10.3390/inventions8050127
Chicago/Turabian StyleKarapidakis, Emmanuel, Christos Kalogerakis, and Evangelos Pompodakis. 2023. "Sustainable Power Generation Expansion in Island Systems with Extensive RES and Energy Storage" Inventions 8, no. 5: 127. https://doi.org/10.3390/inventions8050127