

Numerical Study of the Gas–Solid Separation Performance of Axial Flow Cyclone Separators

1
SYSTEC, ARISE, Faculty of Engineering, University of Porto, 4200-465 Porto, Portugal
2
School of Energy and Environment, Southeast University, Nanjing 211102, China
*
Author to whom correspondence should be addressed.
Inventions 2024, 9(2), 34; https://doi.org/10.3390/inventions9020034
Submission received: 16 February 2024
/
Revised: 18 March 2024
/
Accepted: 20 March 2024
/
Published: 22 March 2024
(This article belongs to the Special Issue Innovative Research and Applications in Hydrodynamics and Flow Control, 2nd Edition)
Abstract
:Cyclone separators, which have a high separation performance, play a crucial role in mitigating the occurrence of dust explosion incidents. This study aims to improve the performance of an axial cyclone separator using the results of simulations employing the model together with a user-defined function to simulate the wall collision process. The effectiveness of various structural modifications to the vortex tube has been addressed. Specifically, we found that increasing the number of blades, reducing the blade exit angle, and adopting L-shaped blades increase separation efficiency. Additionally, enlarging the guide vane and exhaust pipe diameters, as well as increasing the exhaust pipe inclination angle, contribute to an improved separation performance due to the developed tangential velocity and vortex cores. However, it also increases the pressure drop losses due to the increase in the turbulence pulsation entropy and the wall entropy, while the time-averaged entropy is found to be less significant. As a result, our study sheds light on the flow characteristics, the gas–solid separation process, and the energy loss mechanism in the cyclone separator.
1. Introduction
Dust explosions pose a significant, persistent risk in various industries where flammable particulates are processed [1,2,3]. Such incidents can cause severe harm to people and substantial property damage. For instance, an explosion in an aluminum powder plant in Kunshan, Jiangsu, China, in August 2014, initiated by an open flame, resulted in 75 deaths. More recently, a starch dust explosion in Qinhuangdao, Hebei, in 2021, led to 21 deaths and 47 injured persons, and a dust explosion in a Changzhou, Jiangsu, metalworking facility in January 2024 caused 8 deaths and as many injuries. These events highlight the critical importance of effective dust management strategies in industrial environments. Minimizing airborne combustible dust concentrations is essential for preventing such catastrophic events. This necessitates a concerted effort toward implementing stringent dust control measures, enhancing safety protocols, and fostering a culture of safety awareness across sectors susceptible to dust explosion hazards.
Dust removal technologies are pivotal in mitigating the risks associated with combustible dust in industrial settings [4]. Many dust removal technologies can be used to improve air quality, such as mechanical dedusting, filtering technology, electrostatic precipitation, ultrasonic dedusting, pulse injection technology [5], corona dust removal technology [6], and Fischer–Tropsch synthesis [7]. Among these, mechanical dedusting stands out for its widespread application, offering advantages such as minimal spatial requirements, low construction costs, simplicity in operation, and the absence of moving parts. Specifically, cyclone separators, a subset of mechanical dedusting methods, play a crucial role in industries ranging from petrochemicals to agriculture. These devices leverage centrifugal force, generated through a rotating airflow, to segregate particles from air streams. Predominantly, cyclone separators are differentiated into two main types: conventional reverse flow cyclones and straight flow (axial) cyclones. Reverse flow cyclones utilize a tangential inlet to generate centrifugal forces [8], with purified air exiting upwards through the outlet [9]. Conversely, axial cyclone separators, employing a swirl generator, maintain the air flow’s initial direction, resulting in a lower pressure drop [10]. This characteristic, alongside a higher throughput and enhanced flexibility in the separation process, makes axial cyclones particularly effective in controlling combustible dust accumulation and reducing explosion risks.
The evaluation of axial cyclone separators predominantly hinges on two critical metrics—separation efficiency and pressure drop—that serve as benchmarks for assessing technological performance. The genesis of axial cyclone design traces back to 1948 with Umney’s pioneering model [11]. Initially, the axial cyclone’s lower separation efficiency restricted its application range compared to its reverse-flow counterparts. Nevertheless, ensuing research endeavors have substantially focused on augmenting the efficacy of axial separators. It has been established that the geometrical dimensions of an axial separator profoundly influence its filtration capabilities. Notably, the design of swirl vanes emerges as a pivotal factor, accounting for a significant portion of total pressure loss while crucially impacting centrifugal force generation and, consequently, separation efficiency. Innovations aimed at enhancing axial cyclone performance have been noteworthy [12,13,14]. Andreussi’s [15] introduction of an adjustable guide vane, tailored to inlet velocity, dust concentration, and particle characteristics, marks a significant advancement. Similarly, Trow’s exploration [16] into the impact of tube diameter on separator efficiency identified optimal long-length ratios, highlighting the nuanced relationship between structural dimensions and performance. Dirkzwager’s research [17] further elucidated that a heightened centrifugal force field could be achieved through reduced diameter designs, offering insights into optimizing the balance between efficiency and pressure management.
Experimental investigations stand as a cornerstone in the advancement of cyclone separator technology, offering unparalleled precision and reliability in outcomes. Hsiao and Chen’s exploration into multi-stage cyclones underscored the critical role of Reynolds and Stokes numbers on particle separation efficiency, pinpointing the fluid dynamics and particle behavior as fundamental to optimizing cyclone design [18]. Similarly, Koffman’s study on the parallel use of 14 cyclone separators revealed a decline in collective efficiency from 96% to 92.2%, with this reduction being attributed to variations in inlet velocity, thereby highlighting the importance of uniform airflow for maximal performance [19]. Further, Akiyama’s research on the impact of outlet structural variations on particle separation illuminated the intricate relationship between design elements and functional efficacy. These studies not only deepen our understanding of cyclone separator mechanics, but also guide the development of more efficient, reliable systems through focused modifications in design parameters [20].
Many scientists have carried out studies aiming to improve the performance of vortex tube separators. However, the existing methods can lead to an increase in pressure loss and reduce the aerodynamic performance and the energy efficiency. Therefore, analyzing the separation efficiency and pressure loss of the cyclone separator through numerical simulation methods can help the design process. To deepen the understanding of internal gas–solid flow, the complex dynamics in the cyclone tubes, as well as the influence of various structural and operational variables on the performance, need further exploration. This study uses Computational Fluid Dynamics (CFD), enriched by particle–wall collision and entropy generation models, to dissect the impact of modifications in blade count, morphology, outlet angles, guide cone, and exhaust pipe dimensions, as well as exhaust pipe configuration, on the vortex tube’s energy dissipation, separation efficiency, and entropy generation. Our findings offer some insights into the internal gas–solid two-phase flow structure, which can contribute to a better understanding of the energy loss mechanism and influence the performance of the separator.
2. Materials and Methods
2.1. Grid Generation Methods
The cyclone separator in Figure 1 mainly includes the blade, guide vane, straight pipe, and exhaust tube. The parameters are given in Table 1, with a 50 mm outer diameter and 35° blade outlet angle.
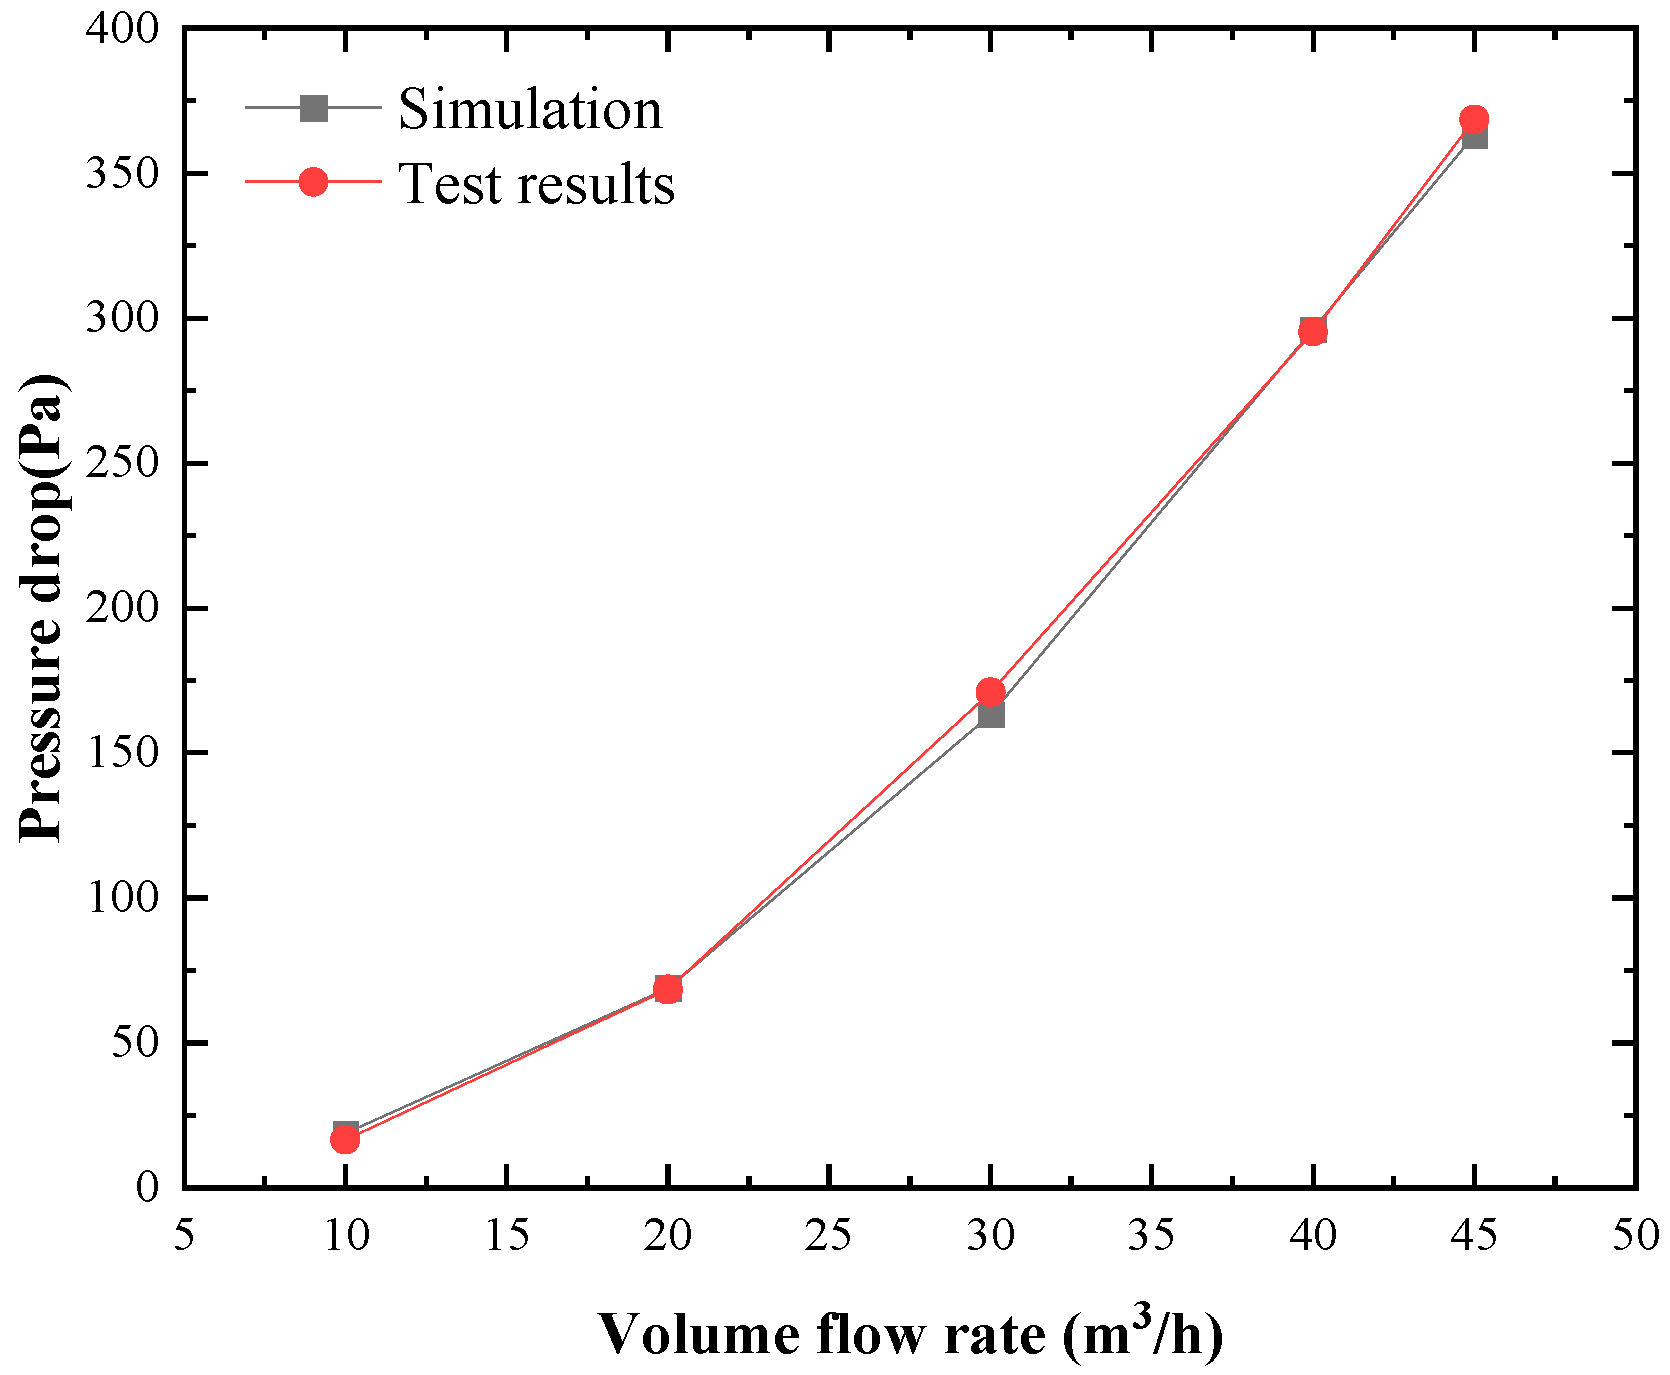
Figure 2 shows the mesh distribution generated by the ICEM 2020 R2 software with 2,991,661 grid cells. The inlet air is regarded as having incompressible turbulent flow and the model is used as the turbulence model since it has been proved useful in simulations of rotation flows [21,22]. The discrete phase model (DPM) is used to track the particle separation efficiency coupling with the continuous phase in ANSYS FLUENT. The results in Figure 3 shows that the simulation of the pressure drop corresponds to the experiment data, ensuring the calculation accuracy of the continuous phase. For the discrete phase model, the simulated 167 μm and 296 μm particles are found to be 91.64% and 82.17%, respectively; these values are close to the experimental ones: 87.00% and 79.13% (see [23]). Overall, the maximum error of 5.3%, and the efficiency and pressure drop, in our view, let us conclude that the simulations were performed with satisfactory computational accuracy.
2.2. Governing Equations
The flow field in an axial cyclone separator is simulated using the following governing equations [24]:
The continuity equation of a fluid flow:
The equation of momentum balance:
where and are the velocity components, is the air density, is the air pressure, is the dynamic viscosity, and is time.
The equations of the turbulence model are [25]:
where k is the turbulence kinetic energy, is the turbulence dissipation rate, is the turbulence kinetic energy generation rate, is the effective reverse Prandtl number, is the effective viscosity coefficient, and C is a constant.
The equation of the DPM force balance model can be written as [26]:
where is the particle velocity, is the air velocity, is the mass of the particle, is the fluid mass, is the gravity acceleration, is the particle radius, is the particle density, is the Saffman lift coefficient, is the directional cosine, is the relative velocity magnitude, and is the drag force computed as:
where is the particle diameter, is the air dynamic viscosity, is the drag coefficient, and Re is the relative Reynolds number:
To investigate the energy loss in a cyclone separator, in our study we employed the entropy production theory to analyze the energy dissipation, i.e., considering the direct viscous entropy production, turbulent entropy production, and wall entropy production based on the Reynolds-averaged method. Herwig et al. provided the function for obtaining the rate of entropy production per unit volume [27]:
- (1)
- Rate of the time-averaged entropy production caused by viscous dissipations in the average flow field:
- (2)
- Since the Reynolds-averaged approach cannot explicitly provide the turbulent velocity, Herwig et al. correlated the ‘’ variable in the RANS simulation model with the entropy production rate. This correlation yields the turbulent dissipation entropy production rate resulting from the flow field fluctuations:
The entropy production induced by the time-averaged velocity and fluctuating velocity can be obtained by integration, i.e.,
In these expressions, is the direct dissipation entropy production caused by time-averaged velocity, W/K, is the turbulent dissipation entropy production induced by fluctuating velocity, W/K, and ‘V’ represents the volume of the computational domain, m3.
- (3)
- The entropy production generated at the wall due to velocity gradients is calculated by the following expression [28]:
Here, is the wall shear stress, Pa, is the velocity at the center of the first layer of the grid near the wall, m/s, and ‘A’ is the area, m2. The total entropy production ‘S’ within the computational domain is:
2.3. Boundary Condition and Solver Settings
The inlet boundary condition is velocity inlet, and the DEFINE_PROFILE macro was used to calculate the fully developed turbulent flow as:
where represents the radial position, is the radius of the cyclone, is the average velocity, and is the maximum velocity:
The discrete phase boundary condition for particles is trap with 0.9 flow rate weighting, and, for cleaned air, it is defined as escape with 0.1 flow rate weighting. The separation efficiency is calculated by the ratio of the escaped particles and the released particles:
where is the separation efficiency, is the number of trapped particles at the outlet, and is the number of tracked particles.
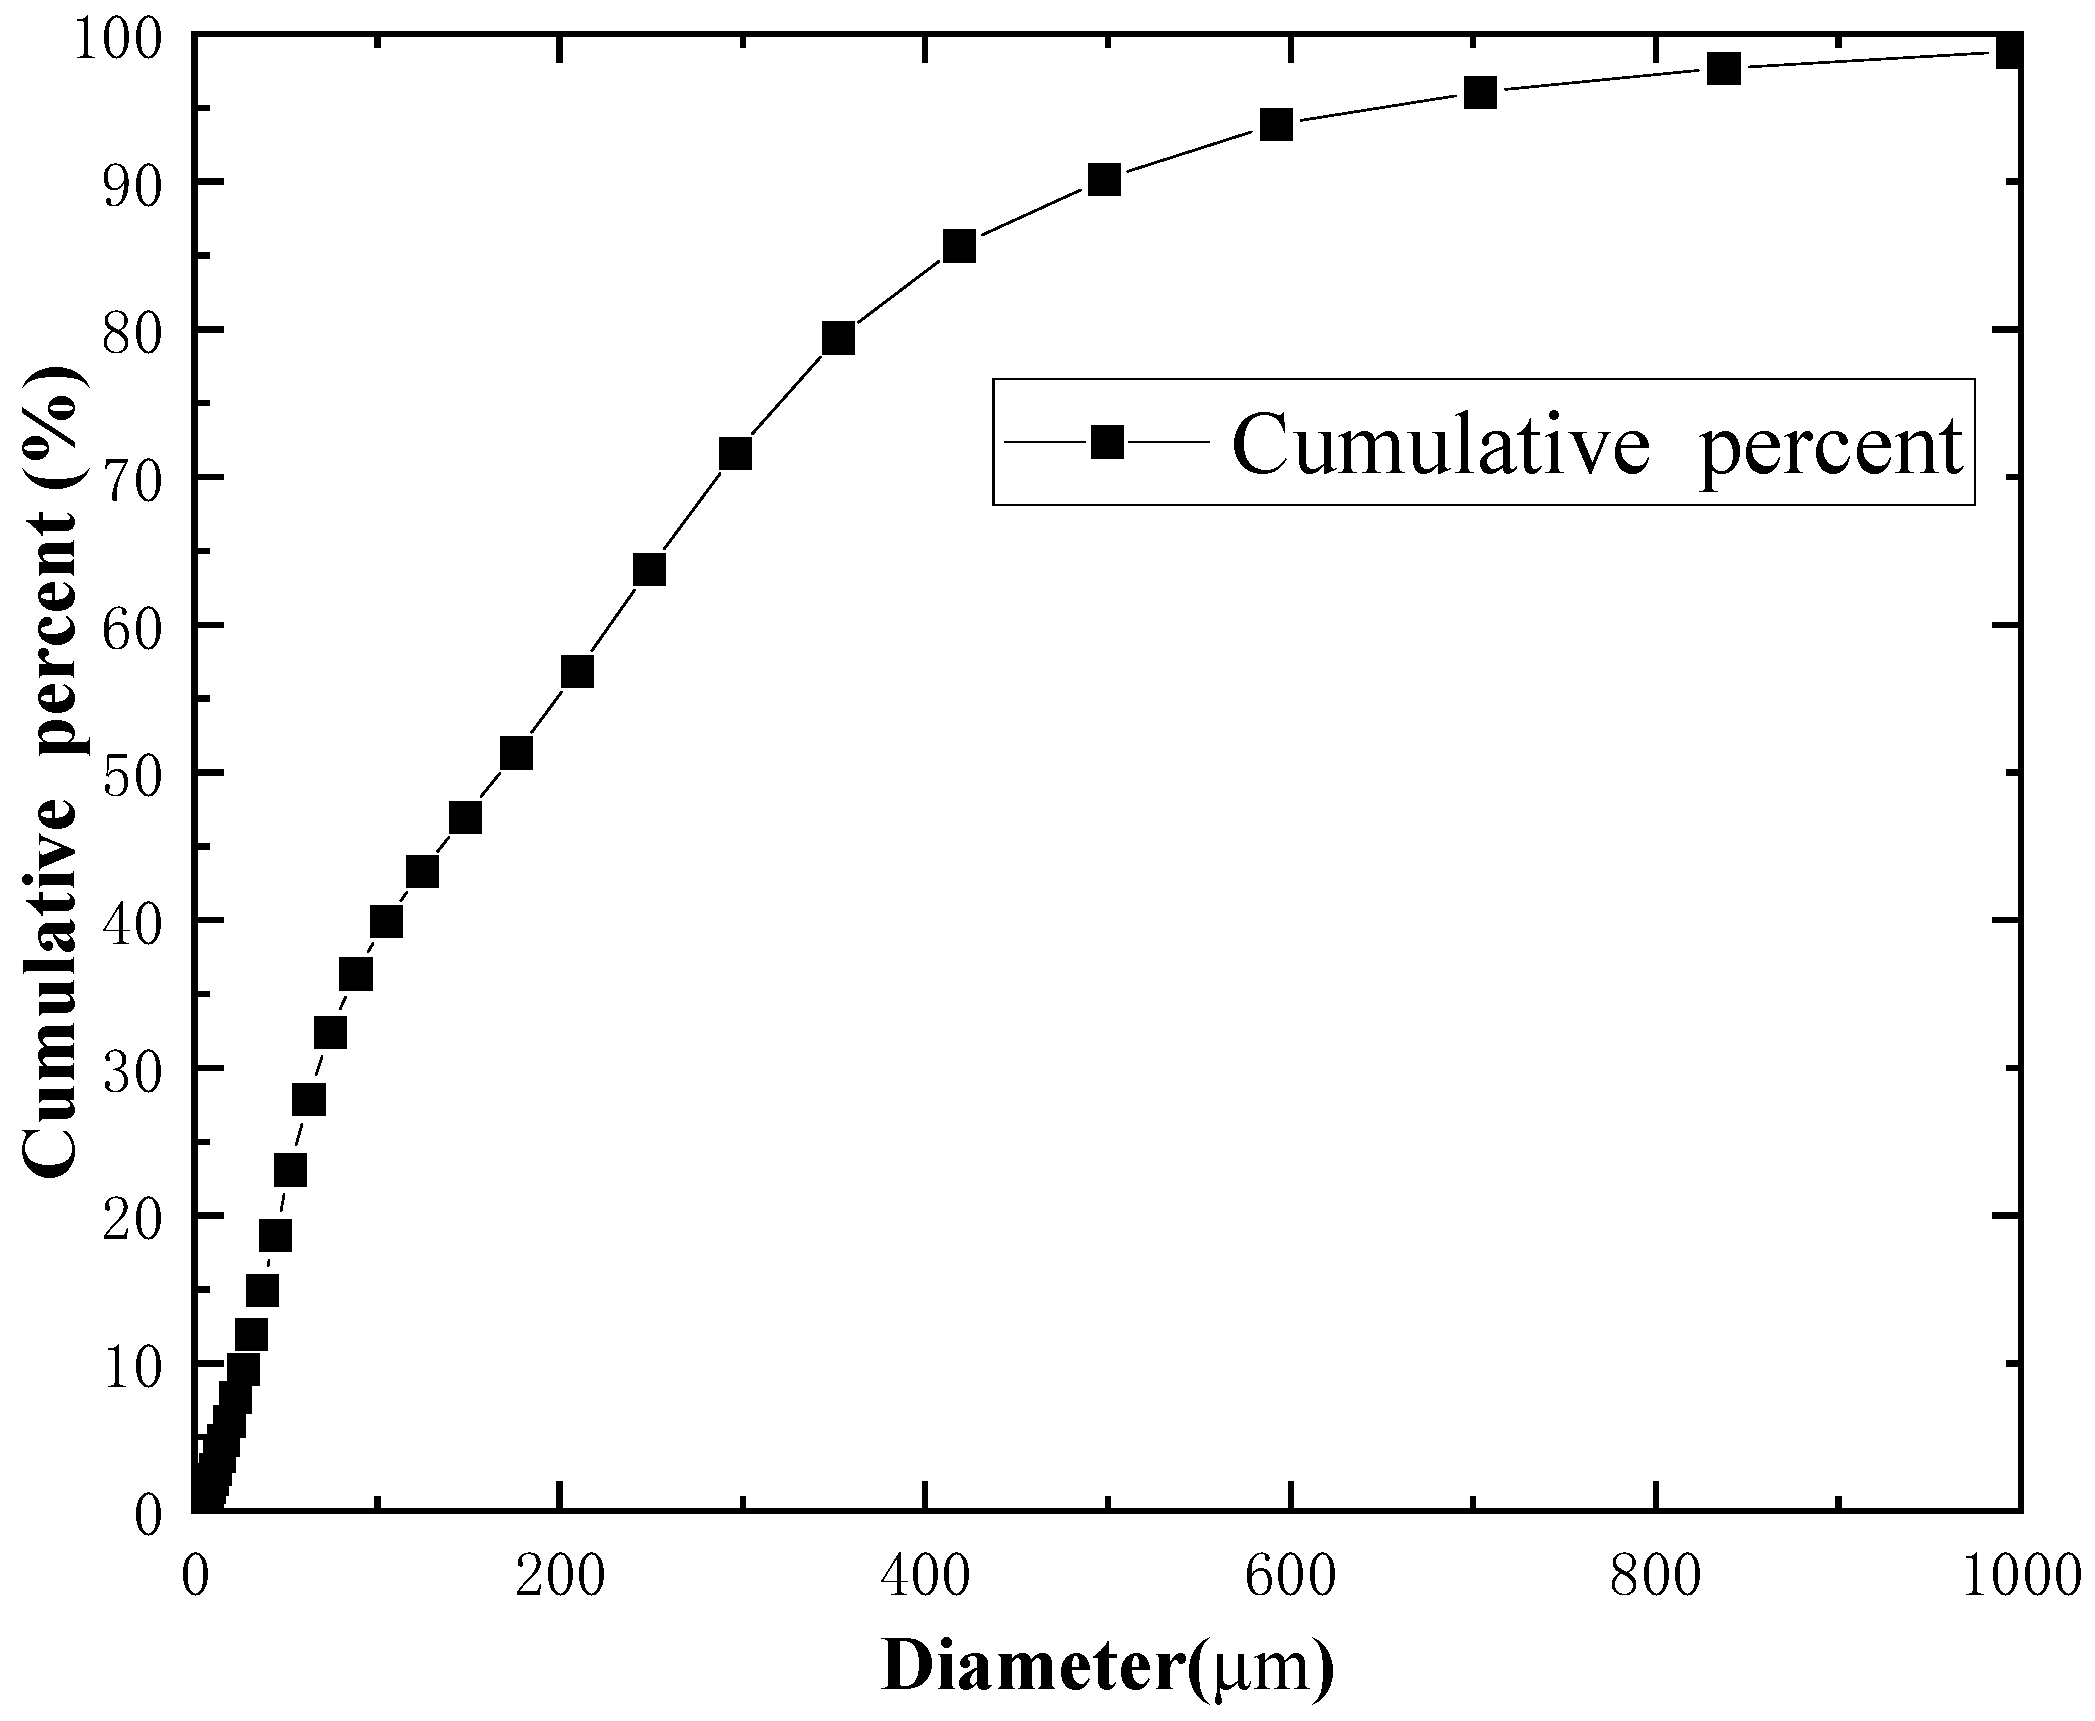
Figure 4 shows the particle size distribution measured by the Microtrac S3500 particle size distribution analyzer [23]. The median diameter is 167 μm, the maximum diameter is 296 μm, and the particle concentration is 20 g/min. To simplify the calculation, the efficiencies of 167 μm and 296 μm particles are considered with 2650 kg/m3 particle density.
The solution method for the cyclone separator is pressure-based with a steady state using the turbulence model. The standard wall function is adopted for the near-wall, which is assumed to be a no slip wall. The Navier–Stokes equation is solved by the SIMPLE method, and approximations for the gradients are computed by the least squares cell-based method. The governing equations for the turbulent kinetic energy and turbulent dissipation rate are solved by the second order upwind method.
2.4. Particle–Wall Collision Model
In order to improve accuracy of the separation efficiency, the 410 stainless steel collision model is adopted to characterize the particle–wall collision effects considering the particle velocity after impact to the particle velocity before impact. The DEFINE_DPM_BC macro is used to simulate the particle–wall interaction process considering the tangential velocity restitution ratio and the normal velocity restitution ratio component. The 410 stainless steel collision model is [29]:
where represents the normal velocity restitution ratio, is the tangential velocity restitution ratio, is the normal particles’ velocity before collision, is the normal particles’ velocity after collision, is the tangential particles’ velocity before collision, and is the tangential particles’ velocity after collision.
2.5. Calculation Steps
Step 1. The single-phase gas flow is simulated.
Step 2. For the flow computed at the previous step, the particle separation efficiency is calculated using the DPM model based on the particle wall collision process governed by the user-defined function.
Step 3. The energy loss process is analyzed by the entropy production model and using the CFD-Post 2020 R2 software. The direct viscous and turbulent entropy production, as well as the wall entropy production, are computed from the simulation results obtained at the previous step.
3. Results and Discussion
3.1. Effect of Blade Number
The blade structure has a significant impact on the separation efficiency and pressure drop. Figure 5 shows the separation performance in the axial cyclone separator at 5 m/s inlet average velocity as a function of the blade number. These results indicate that more blades can result in the increase in energy loss, and improve the separation efficiency of the 167 μm particle. The 296 μm particle has a higher efficiency when the blade number is 4. With the blade number changing from 2 to 8, the pressure drop is gradually increased from 75.83 Pa to 244.62 Pa. For 167 μm for 296 μm particles, the separation efficiencies are increased from 78.32%, and 62.96% to 94.85%, and 79.53%, respectively. This indicates that the reasonable blade number is 4, and, although increasing the number of blades also contributes to efficiency, this causes more energy loss.
Figure 6 shows the flow field and pressure distribution in the cyclone separator, and the X velocity represents the tangential velocity which is related to the separation process. The units for pressure and velocity are Pa and m/s, correspondingly. The flow field has visible differences—the seven-blade cyclone has a negative pressure region at the rear of guide vanes, with a more uniform and fully developed tangential velocity. The 167 μm particles have more spiral rotation in the seven-blade cyclone separator. This indicates that a stronger rotating field is generated in the cyclone with a greater number of blades.
Figure 7 shows the vortex core region in the cyclone at the condition of 0.06 swirling strength. When the blade number is 2, the vortex core region is unstable. By increasing the blade number, the rotation flow is gradually developed; the vortex core is close to a steady state when the blade number is 4.
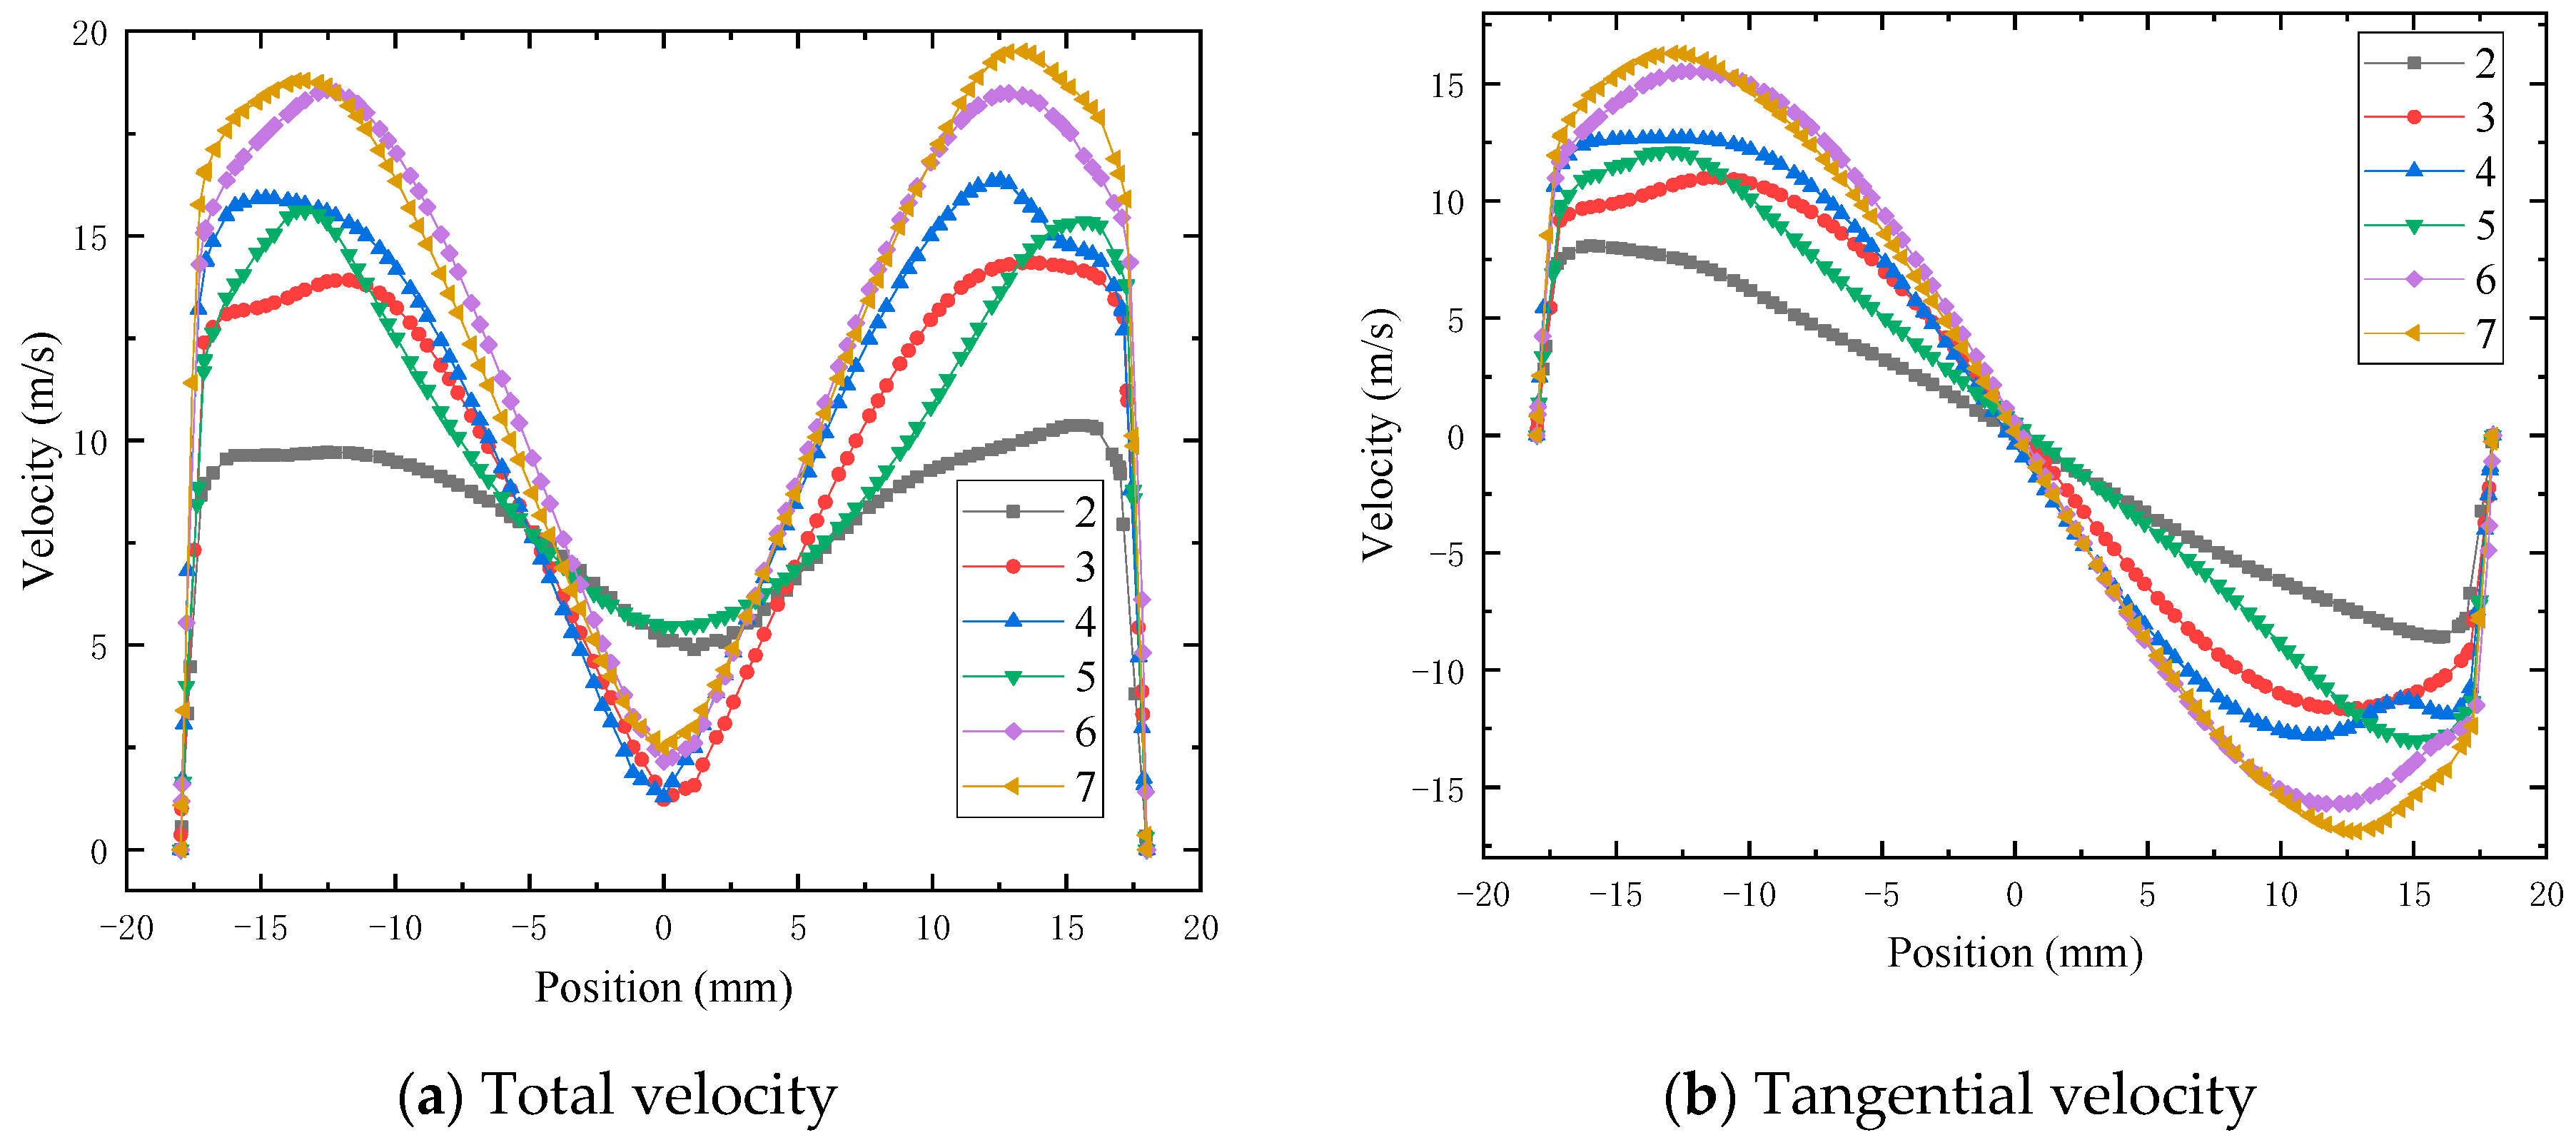
Figure 8 compares the velocity distributions at the center of the discharge pipe at the monitoring line (in Figure 1). The flow velocity is zero at the discharge wall because of the non-slip condition. Due to the presence of the centrifugal force, the velocity at the center of the tube is relatively low. Total and tangential velocity decrease significantly at the distance of 0.1 D–0.2 D from the out wall. When the number of blades increases, the maximum total velocity increases from 9.7 m/s to 19.5 m/s, and the maximum tangential velocity increases from 8.6 to 16.9 m/s, reflecting the improvement in the separation efficiency for a higher number of blades.
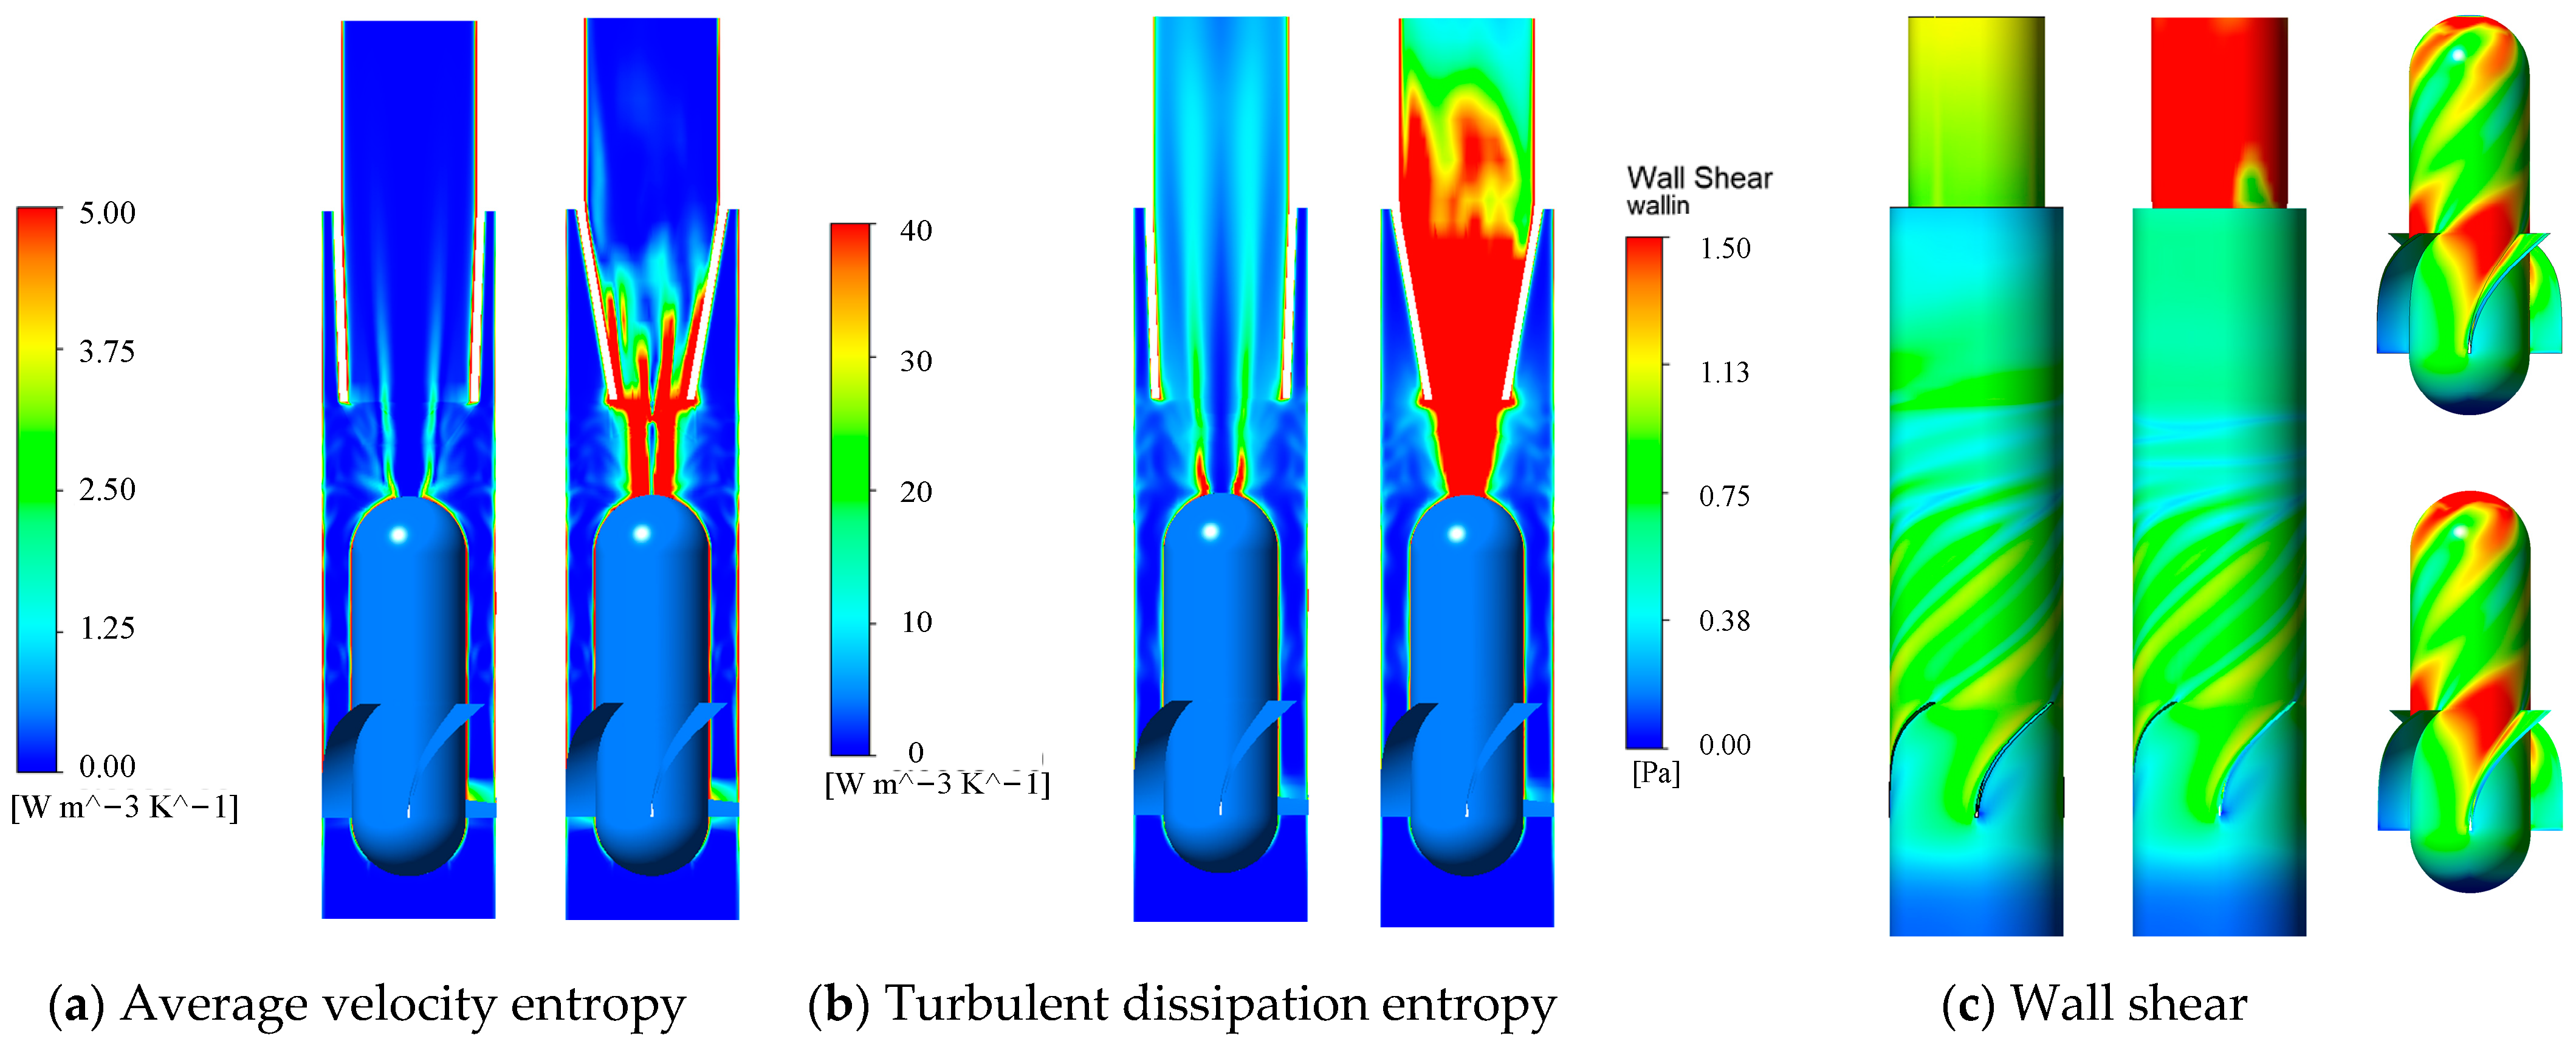
Figure 9 depicts the entropy production and wall shear stress distributions through cloud diagrams, focusing on viscous, turbulent entropy production, and wall shear stress across the system. The analysis reveals a concentration of both average and fluctuating entropy production near the guide vanes, at the draft tube cone’s wall surface, and within the exhaust pipe. Notably, wall shear stress predominantly occurs at the guide vanes’ exit and along the exhaust pipe’s walls. With an increase in blade count from 2 to 7, there is a marked enhancement in the mixing dynamics between the high-velocity airflow at the draft cone’s tail and the slower-moving flow within the recirculation zone. This interaction boosts the time-averaged and turbulent entropy production values. The acceleration of airflow at the guide vanes’ exit further amplifies, intensifying the vortex tube wall shear stress. As a result, the measurements of time-averaged entropy production, turbulent entropy production, and wall entropy production escalate significantly from 8.0 × 10⁻⁵ W/K, 6.9 × 10⁻⁴ W/K, and 6.5 × 10⁻⁴ W/K to 2.1 × 10⁻⁴ W/K, 1.9 × 10⁻³ W/K, and 1.6 × 10⁻³ W/K, respectively, indicating an increase in energy dissipation. Extended analysis reveals that the time-averaged entropy production constitutes around 5.7% of the total, significantly less than the contributions from the turbulent (50.3%) and wall entropy production (44.0%). This delineates the latter two as the primary mechanisms driving energy losses within the vortex tube, highlighting the importance of optimizing design and operational parameters to mitigate these losses.
3.2. Effect of Blade Outlet Angle
The effect of the blade outlet angle on the separation capacity is shown in Figure 10. When the blade outlet angle changes from 20°to 50°, the separation efficiency of the 167 μm particle decreases from 97.27% to 87.50%, the efficiency of the 296 μm particle decreases from 88.70% to 73.65%, and the pressure drop decreases from 297.35 Pa to 82.57 Pa. This shows that a smaller blade outlet angle has a higher efficiency and pressure dissipation.
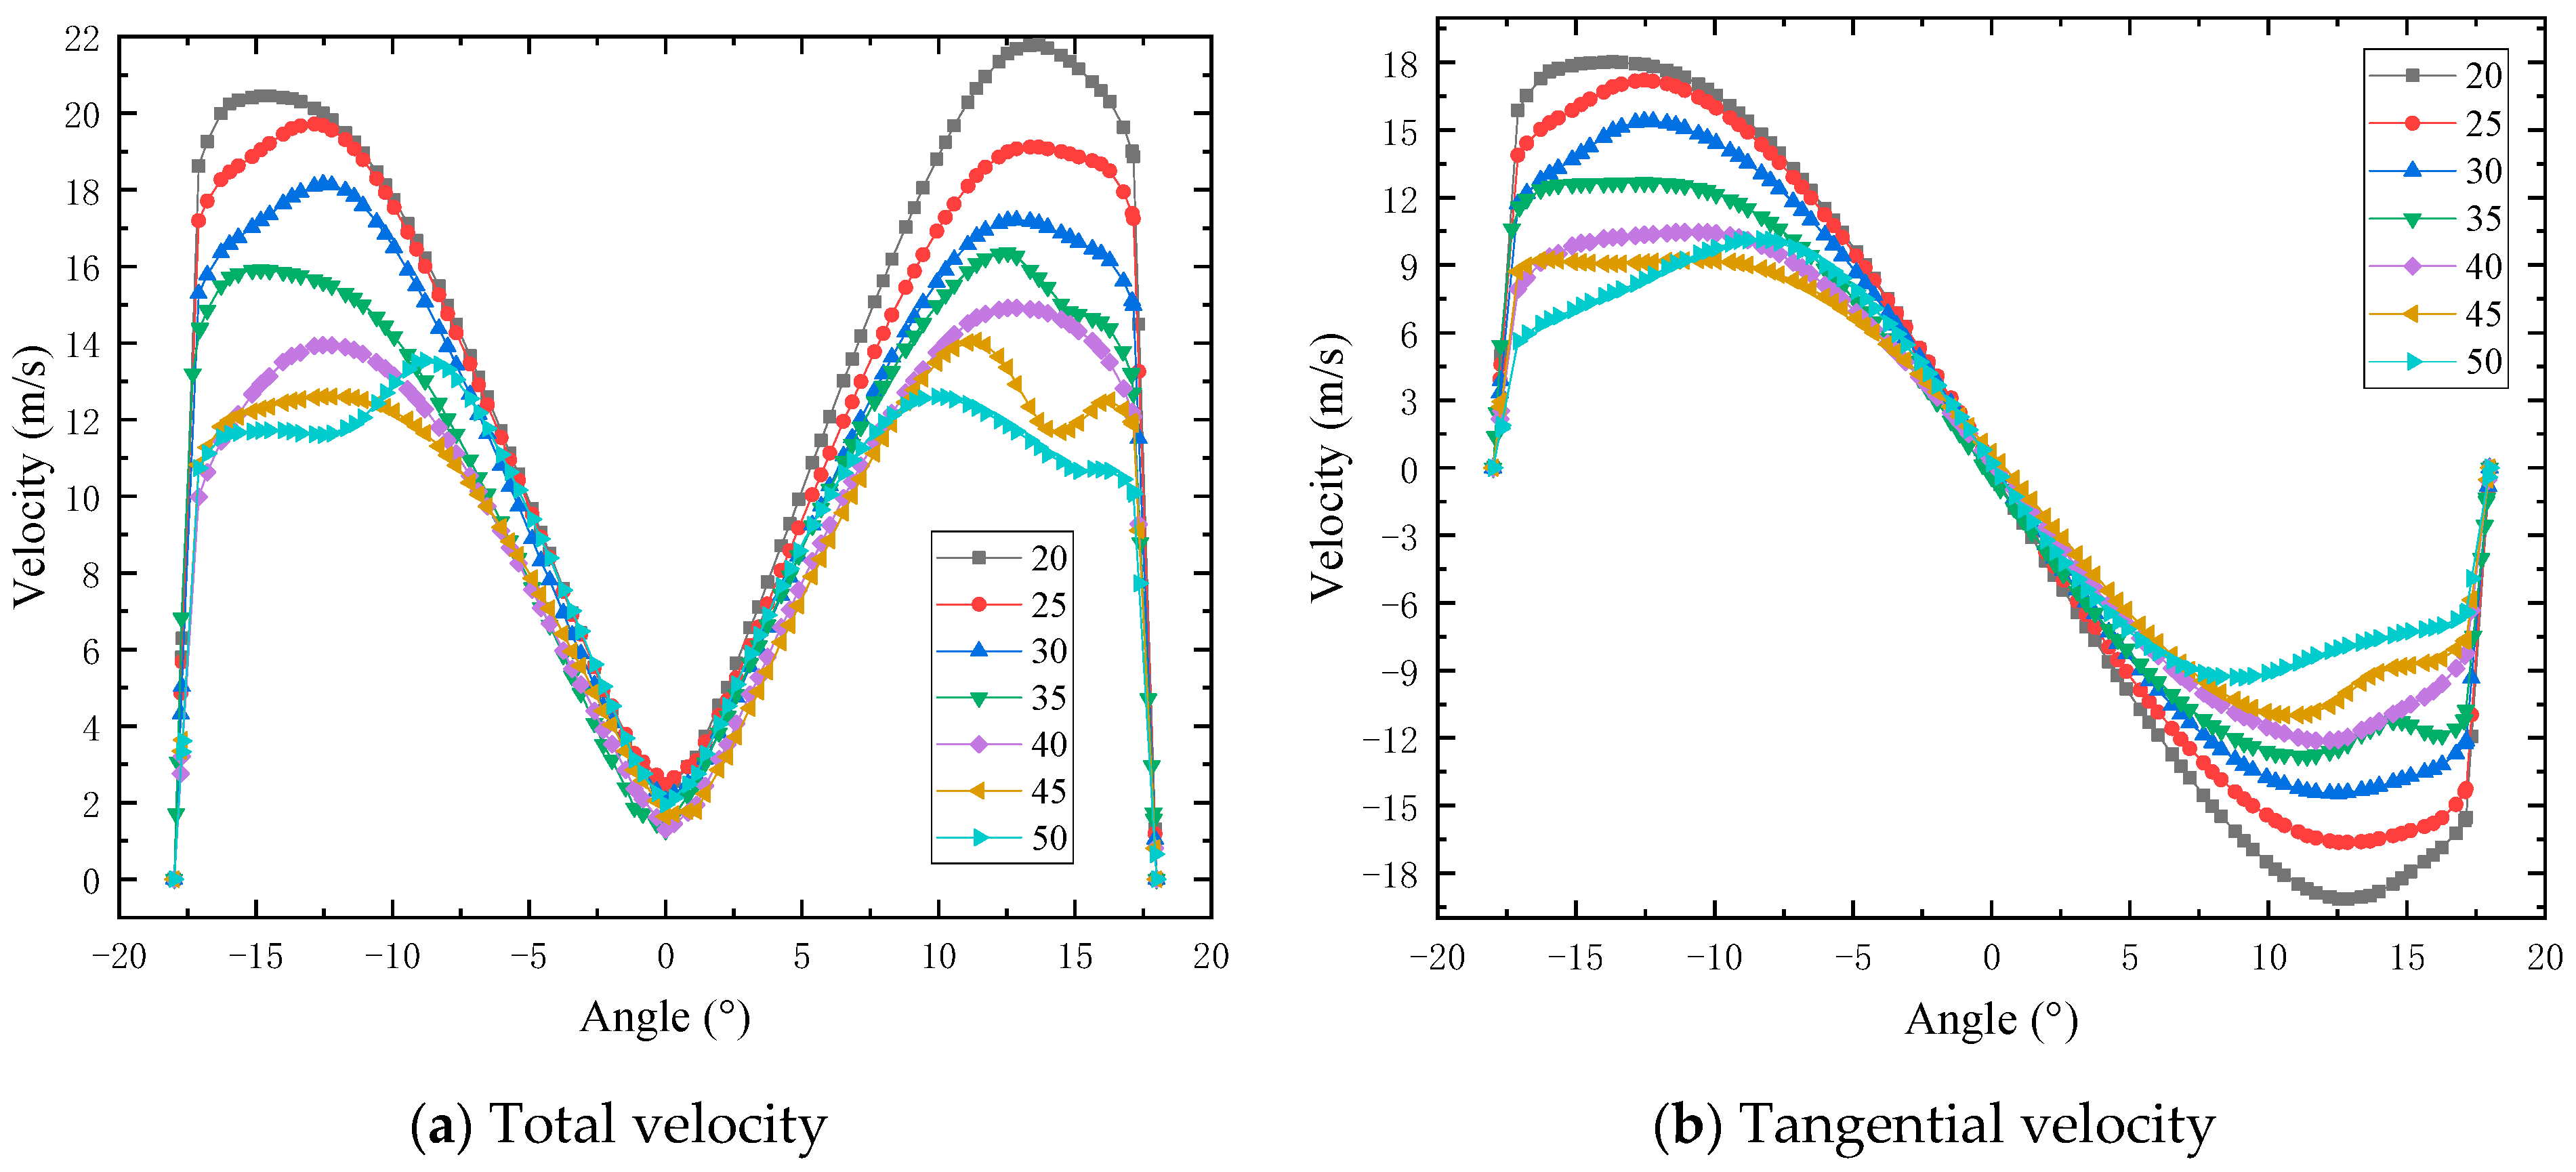
Figure 11 shows the velocity variation with the blade outlet angle along the monitoring line (see Figure 1). There is no large difference between the flow distribution characteristics for the total and tangential velocity. The only visible difference is that the total velocity decreases from 21.78 m/s to 12.60 m/s and the tangential velocity decreases from 19.16 m/s to 10.13 m/s when the blade outlet angle changed from 20° to 50°. This reveals that a smaller angle creates a stronger centrifugal field, which helps to increase the efficiency.
Figure 12 demonstrates the entropy production at different blade outlet angles. When it changes from 20° to 50°, the production of time-averaged entropy, turbulent entropy, and wall entropy decrease from 2.8 × 10⁻⁴ W/K, 3.0 × 10⁻³ W/K, and 2.4 × 10⁻³ W/K to 1.4 × 10⁻⁴ W/K, 8.5 × 10⁻⁴ W/K, and 5.8 × 10⁻⁴ W/K, respectively. This is due to a decrease in the total velocity, leading to a decrease in the mixing effect at the rear end of the guide vane and the exhaust pipe. Furthermore, the decreasing relative speed between the rotating air and the wall may also cause a smaller energy loss.
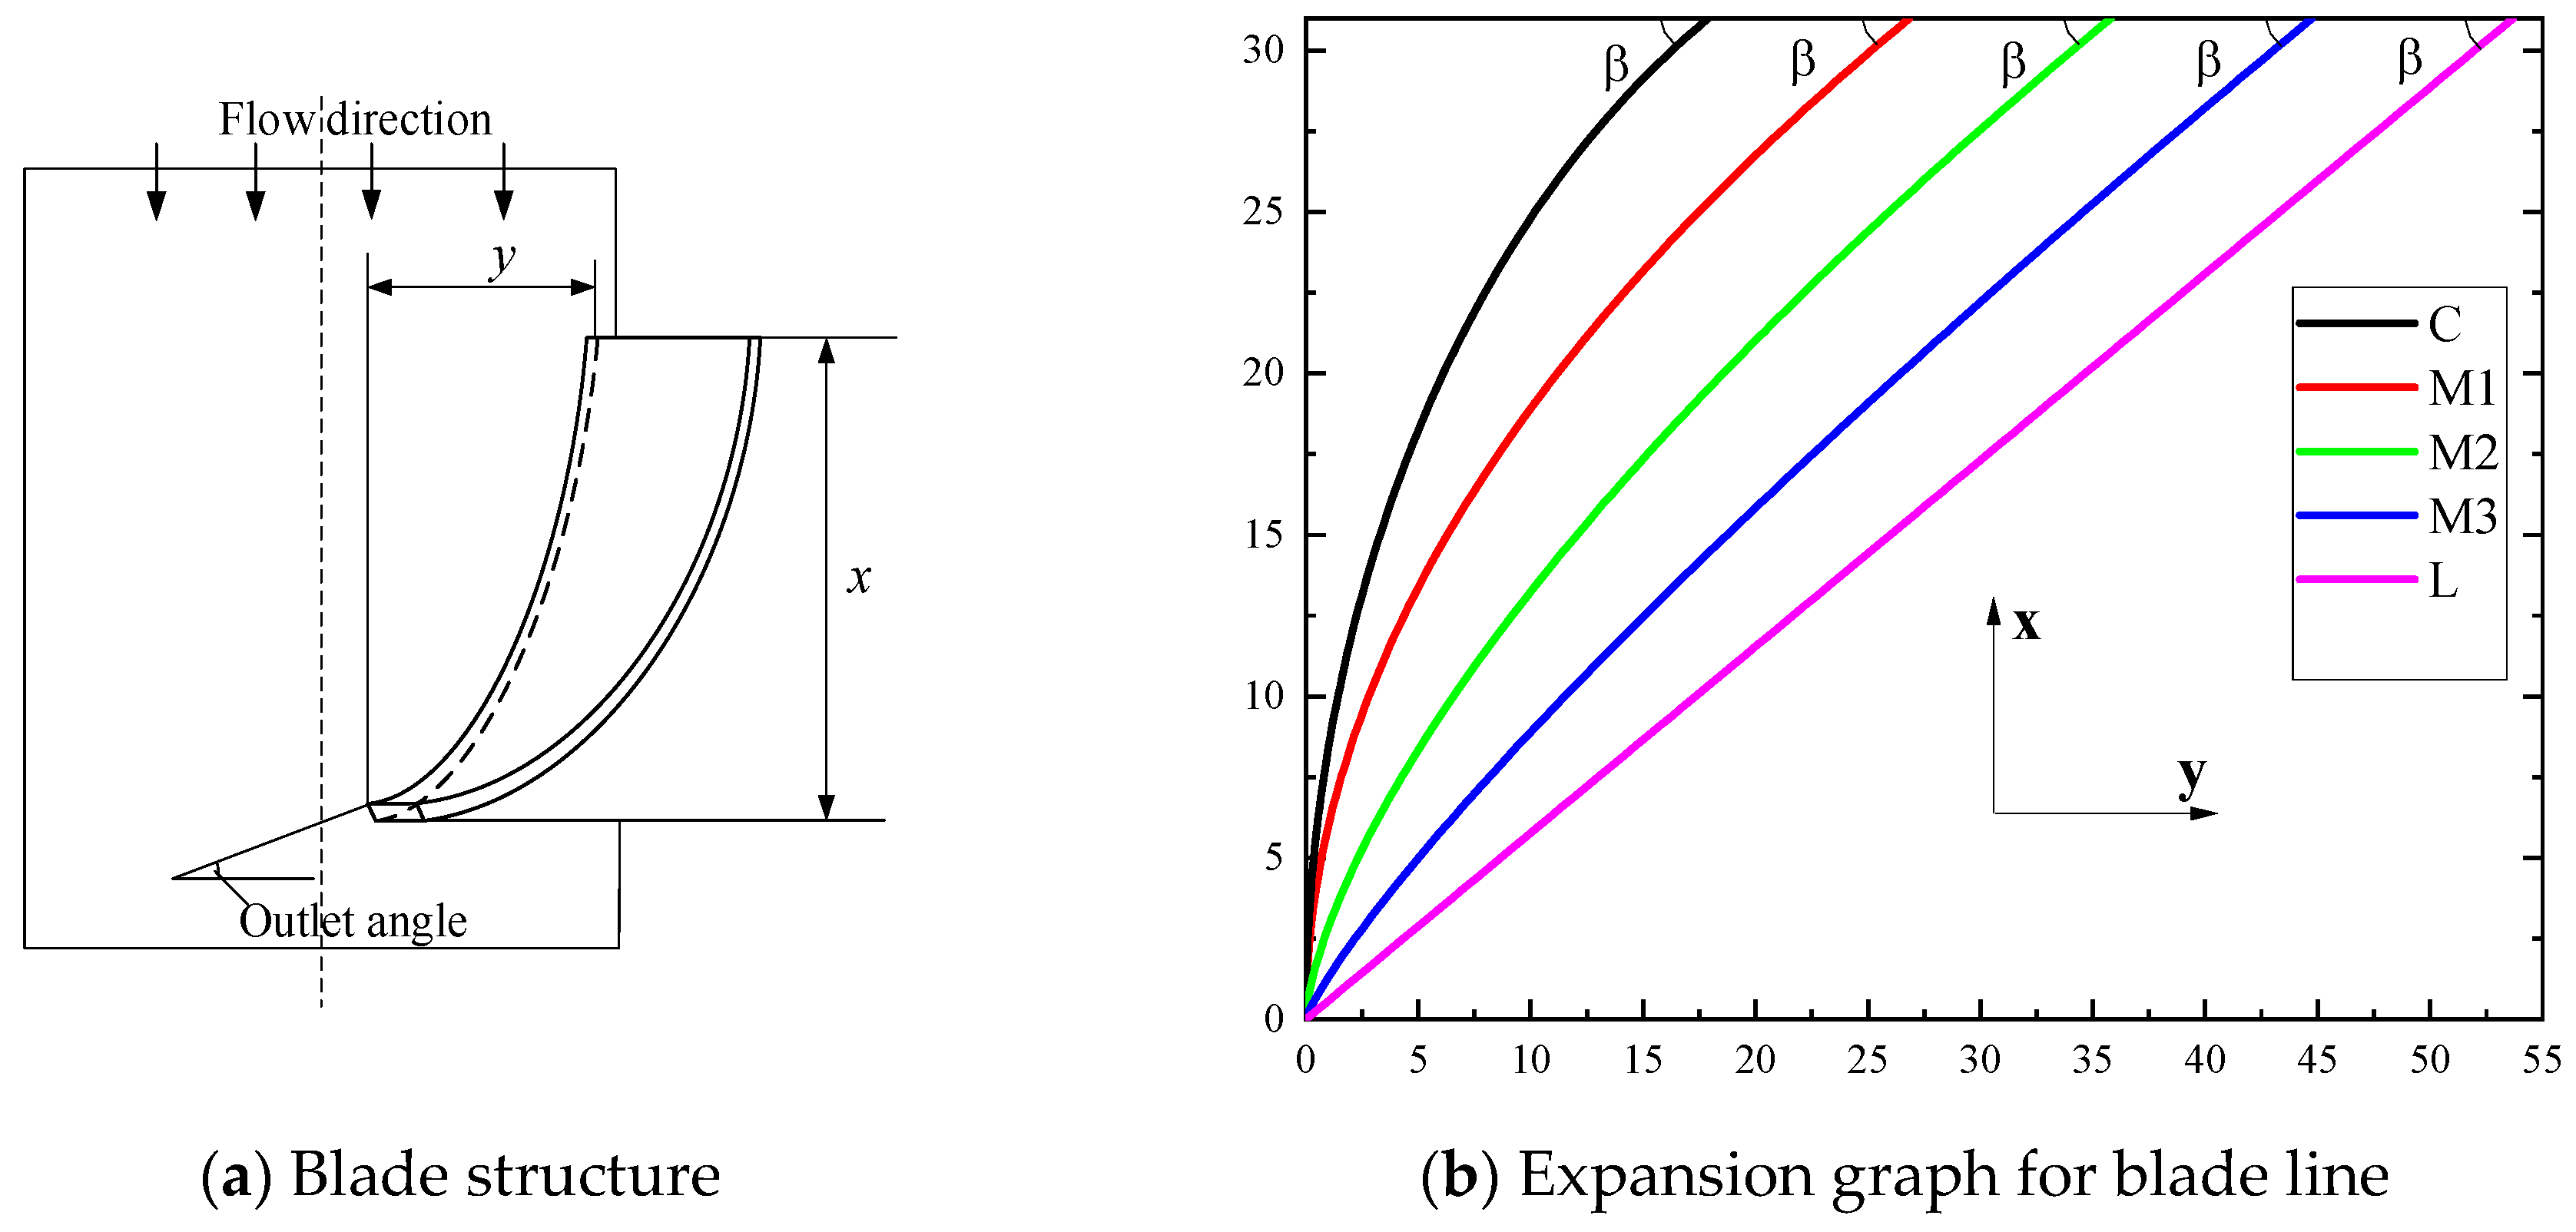
3.3. Influence of the Blade Shape
Figure 13 demonstrates the structure parameter of the blade. In Figure 13a, x represents the blade length alone the flow direction, y represented the circumferential length of the blade, and the functions between x and y relating to the different blade curves are shown in Table 2. Figure 13b is the blade control line along the circumferential direction, the control line of the C blade is an arc line, the lines of M1, M2, and M3 are power functions, and the line of L is a straight line.
The dust removal performance at different blade shapes is shown in Figure 14. As the blade shape changes from C to L, the calculated efficiency of the 167 μm particles increases from 91.65% to 98.76%, the efficiency of the 296 μm particles increases from 82.17% to 93.37%, and the pressure drop is drastically changed from 163.19 Pa to 595.28 Pa. These results demonstrate that a long circumferential length can improve the separation capability; however, it introduces more pressure loss.
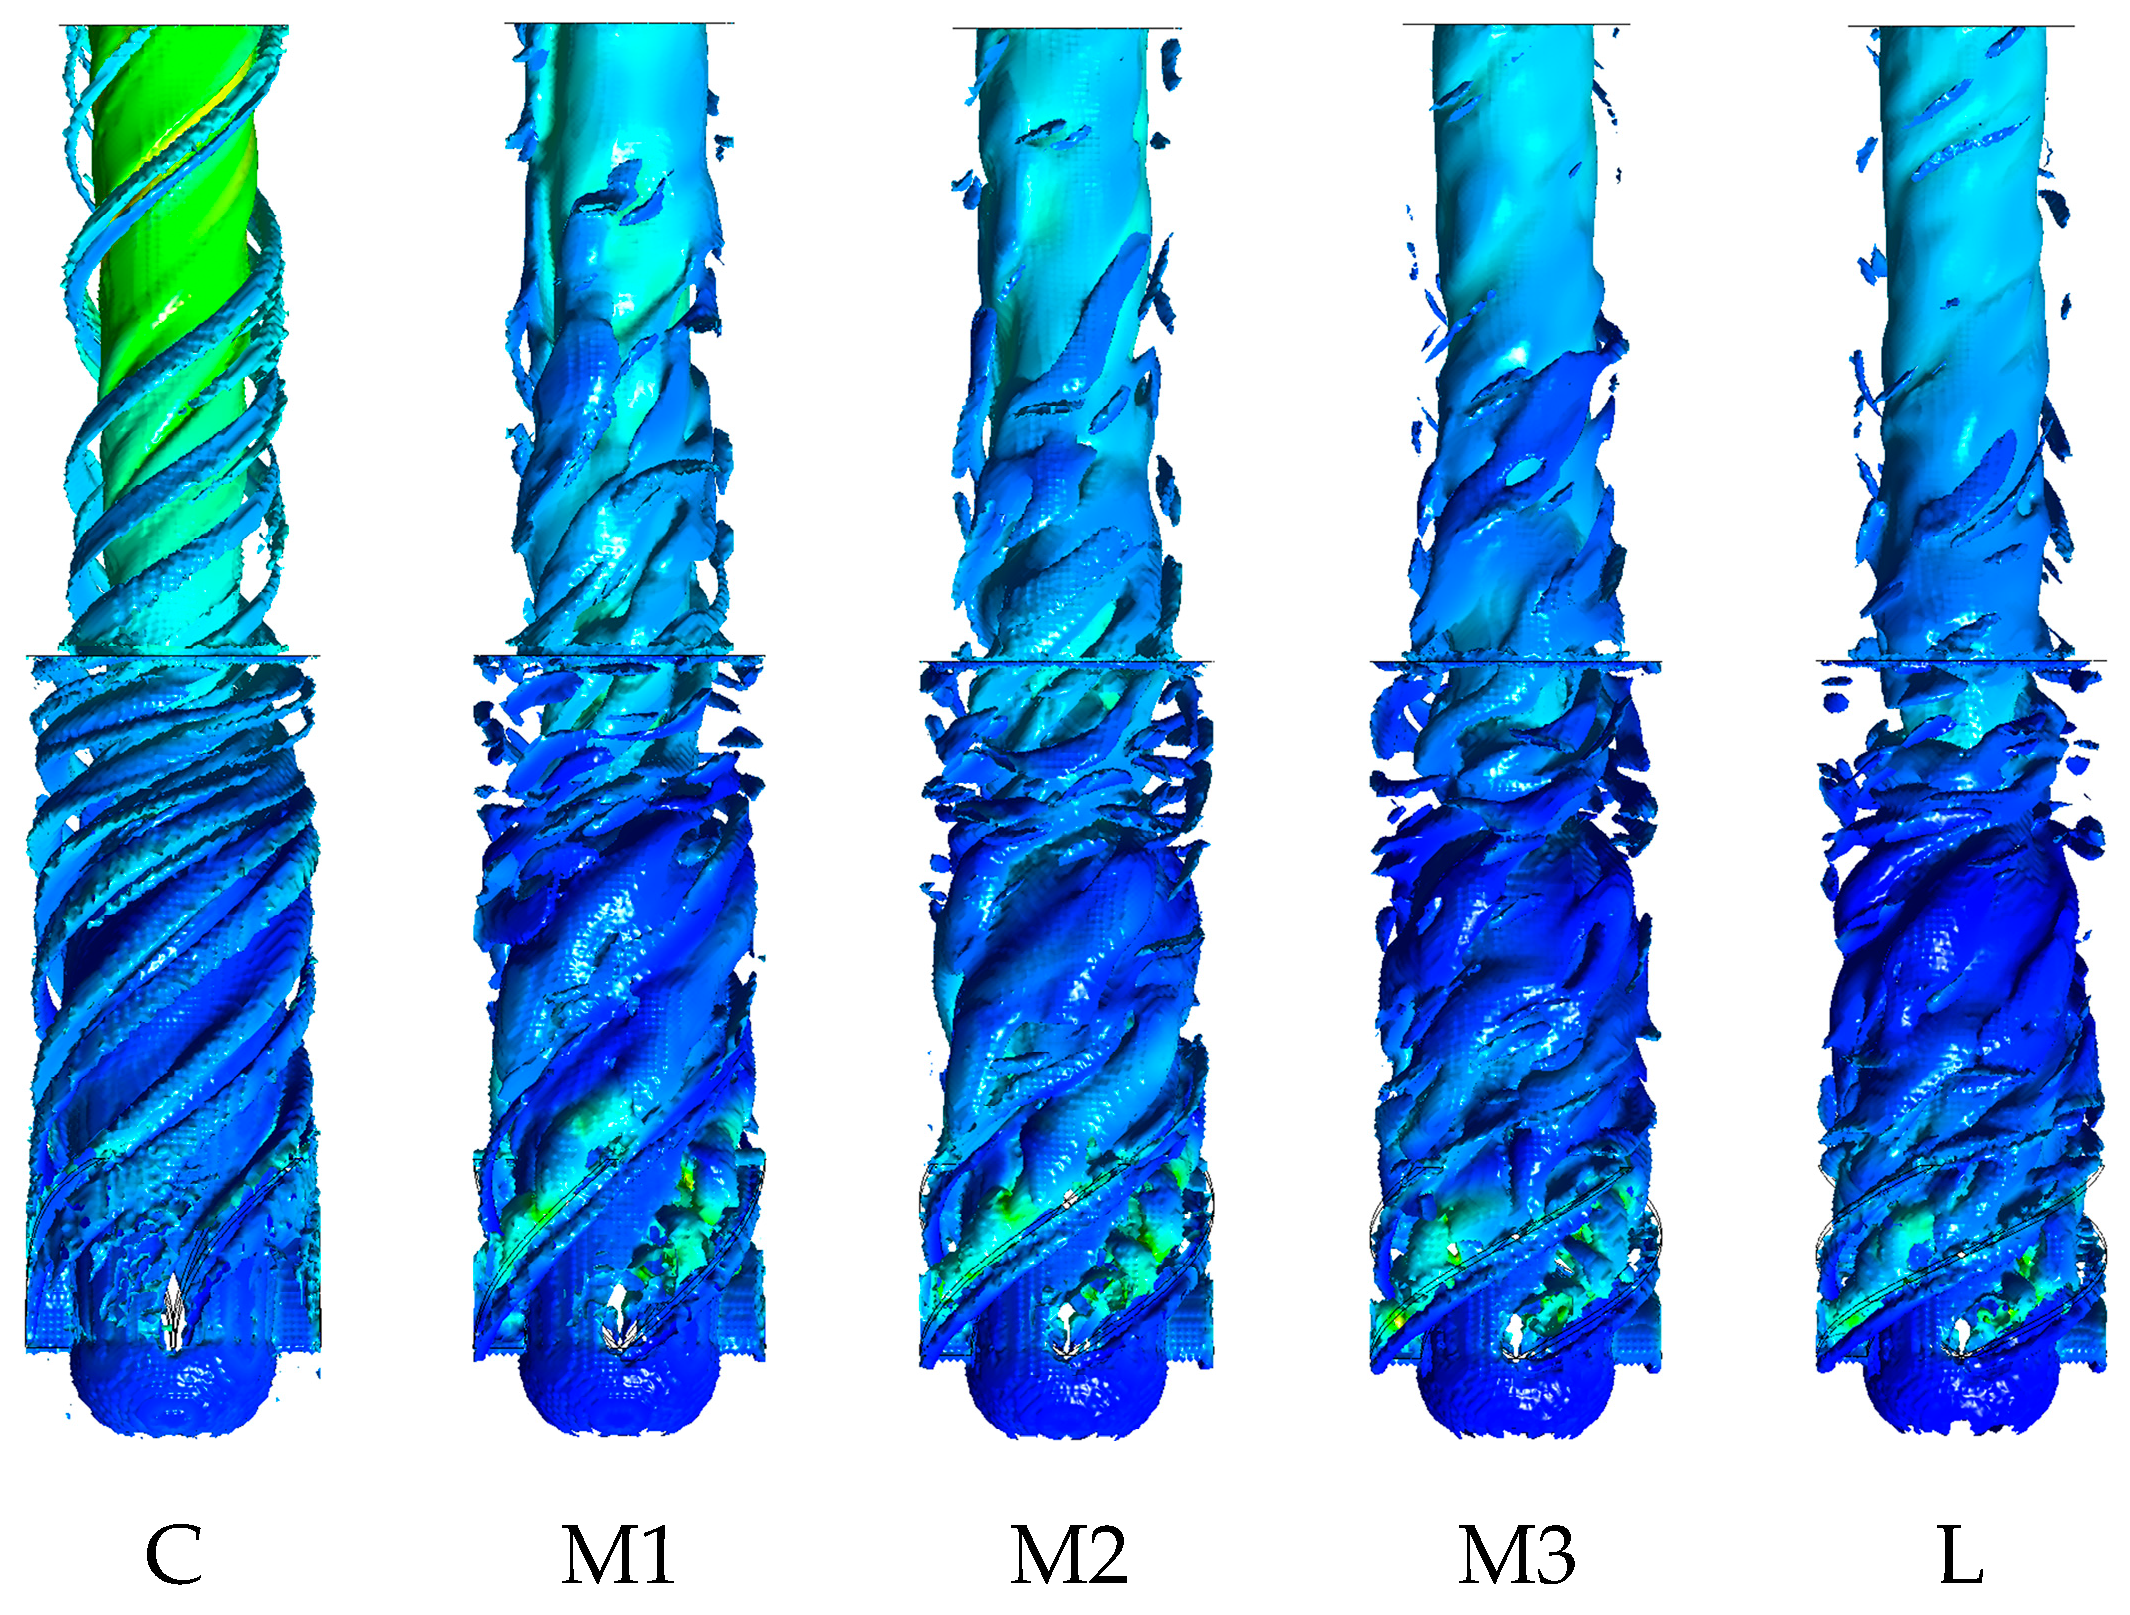
The influence of the blade structure on the flow field is shown in Figure 15. When the blade shape is changed from C to L, the flow path gradually increases, and smaller vortex regions are generated. This indicates that the L blade can produce a stronger induced action.
According to Figure 16, when the blade shape changes from C to L, the production of time-averaged entropy, turbulent entropy, and wall entropy change from 2.1 × 10⁻⁴ W/K, 1.5 × 10⁻³ W/K, and 1.1 × 10⁻³ W/K to 6.0 × 10⁻⁴ W/K, and 5.7 × 10⁻³ W/K, 5.4 × 10⁻³ W/K, respectively. The flow becomes more turbulent in a long flow-guiding passage, leading to the increase in entropy production and wall shear at the position of the blade and the guide vane, resulting in a higher energy loss.
3.4. Guide Cone Diameter
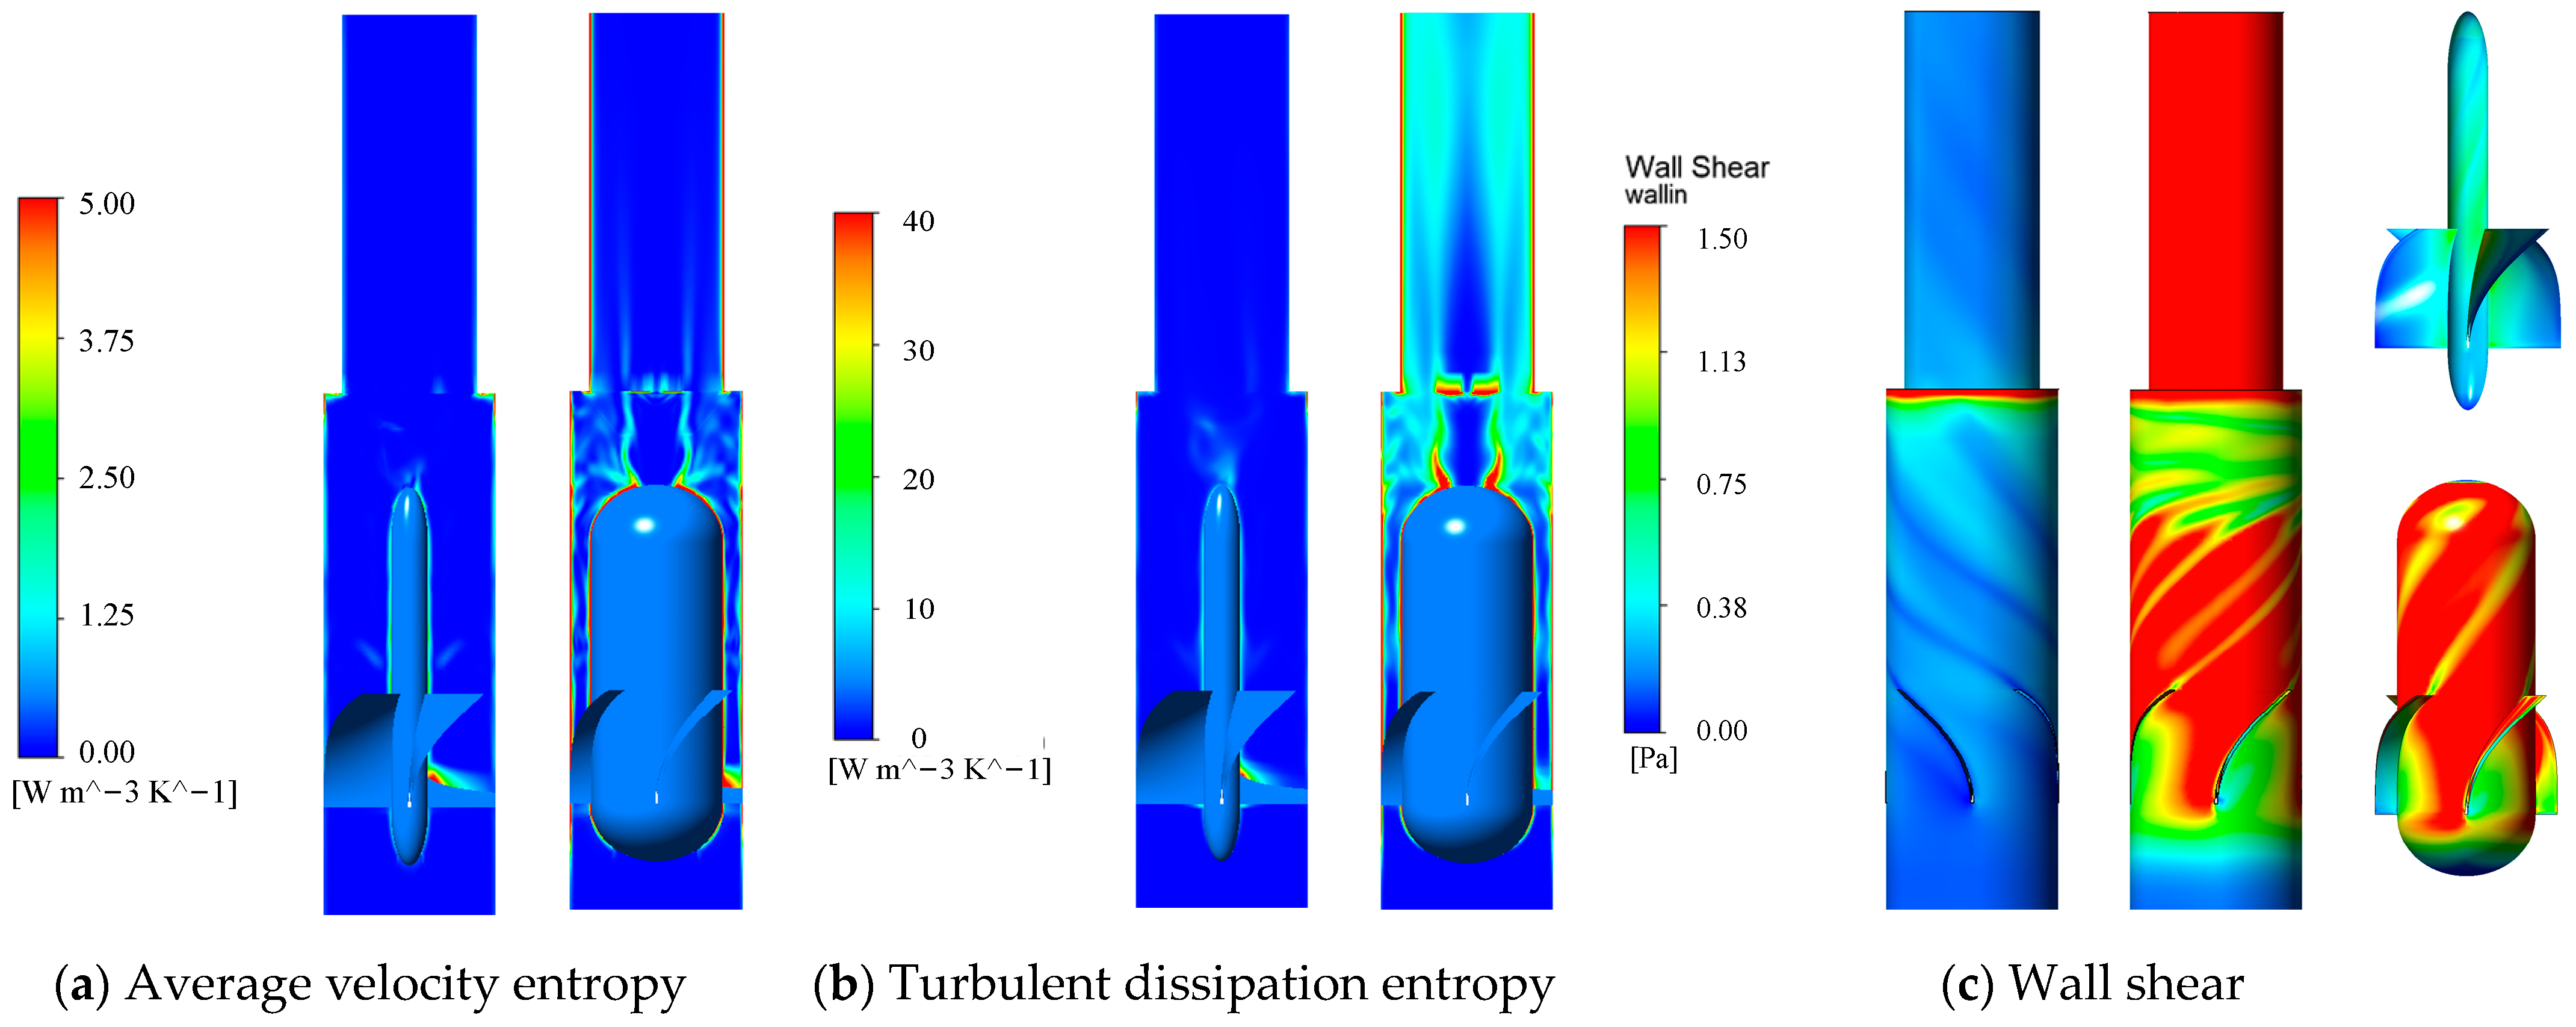
The influence of the cyclone guide cone diameter on the separation efficiency and the pressure drop can be seen in Figure 17. When the guide cone diameter is changed from 10 mm to 40 mm (0.2 D to 0.8 D), the separation efficiency of the 167 μm particles is increased from 59.10% to 100%, the separation efficiency of the 296 μm particles is increased from 48.16% to 98.98%, and the pressure drop is increased from 43.02 Pa to 977.76 Pa. Comparing the numerical results, we conclude that the 30 mm and 35 mm guide cones (0.6 D and 0.7 D) have satisfactory properties and the separation efficiencies for the 167 μm particles are 91.87% and 98.83% with 163.19 Pa and 303.81 Pa pressure drops, respectively.
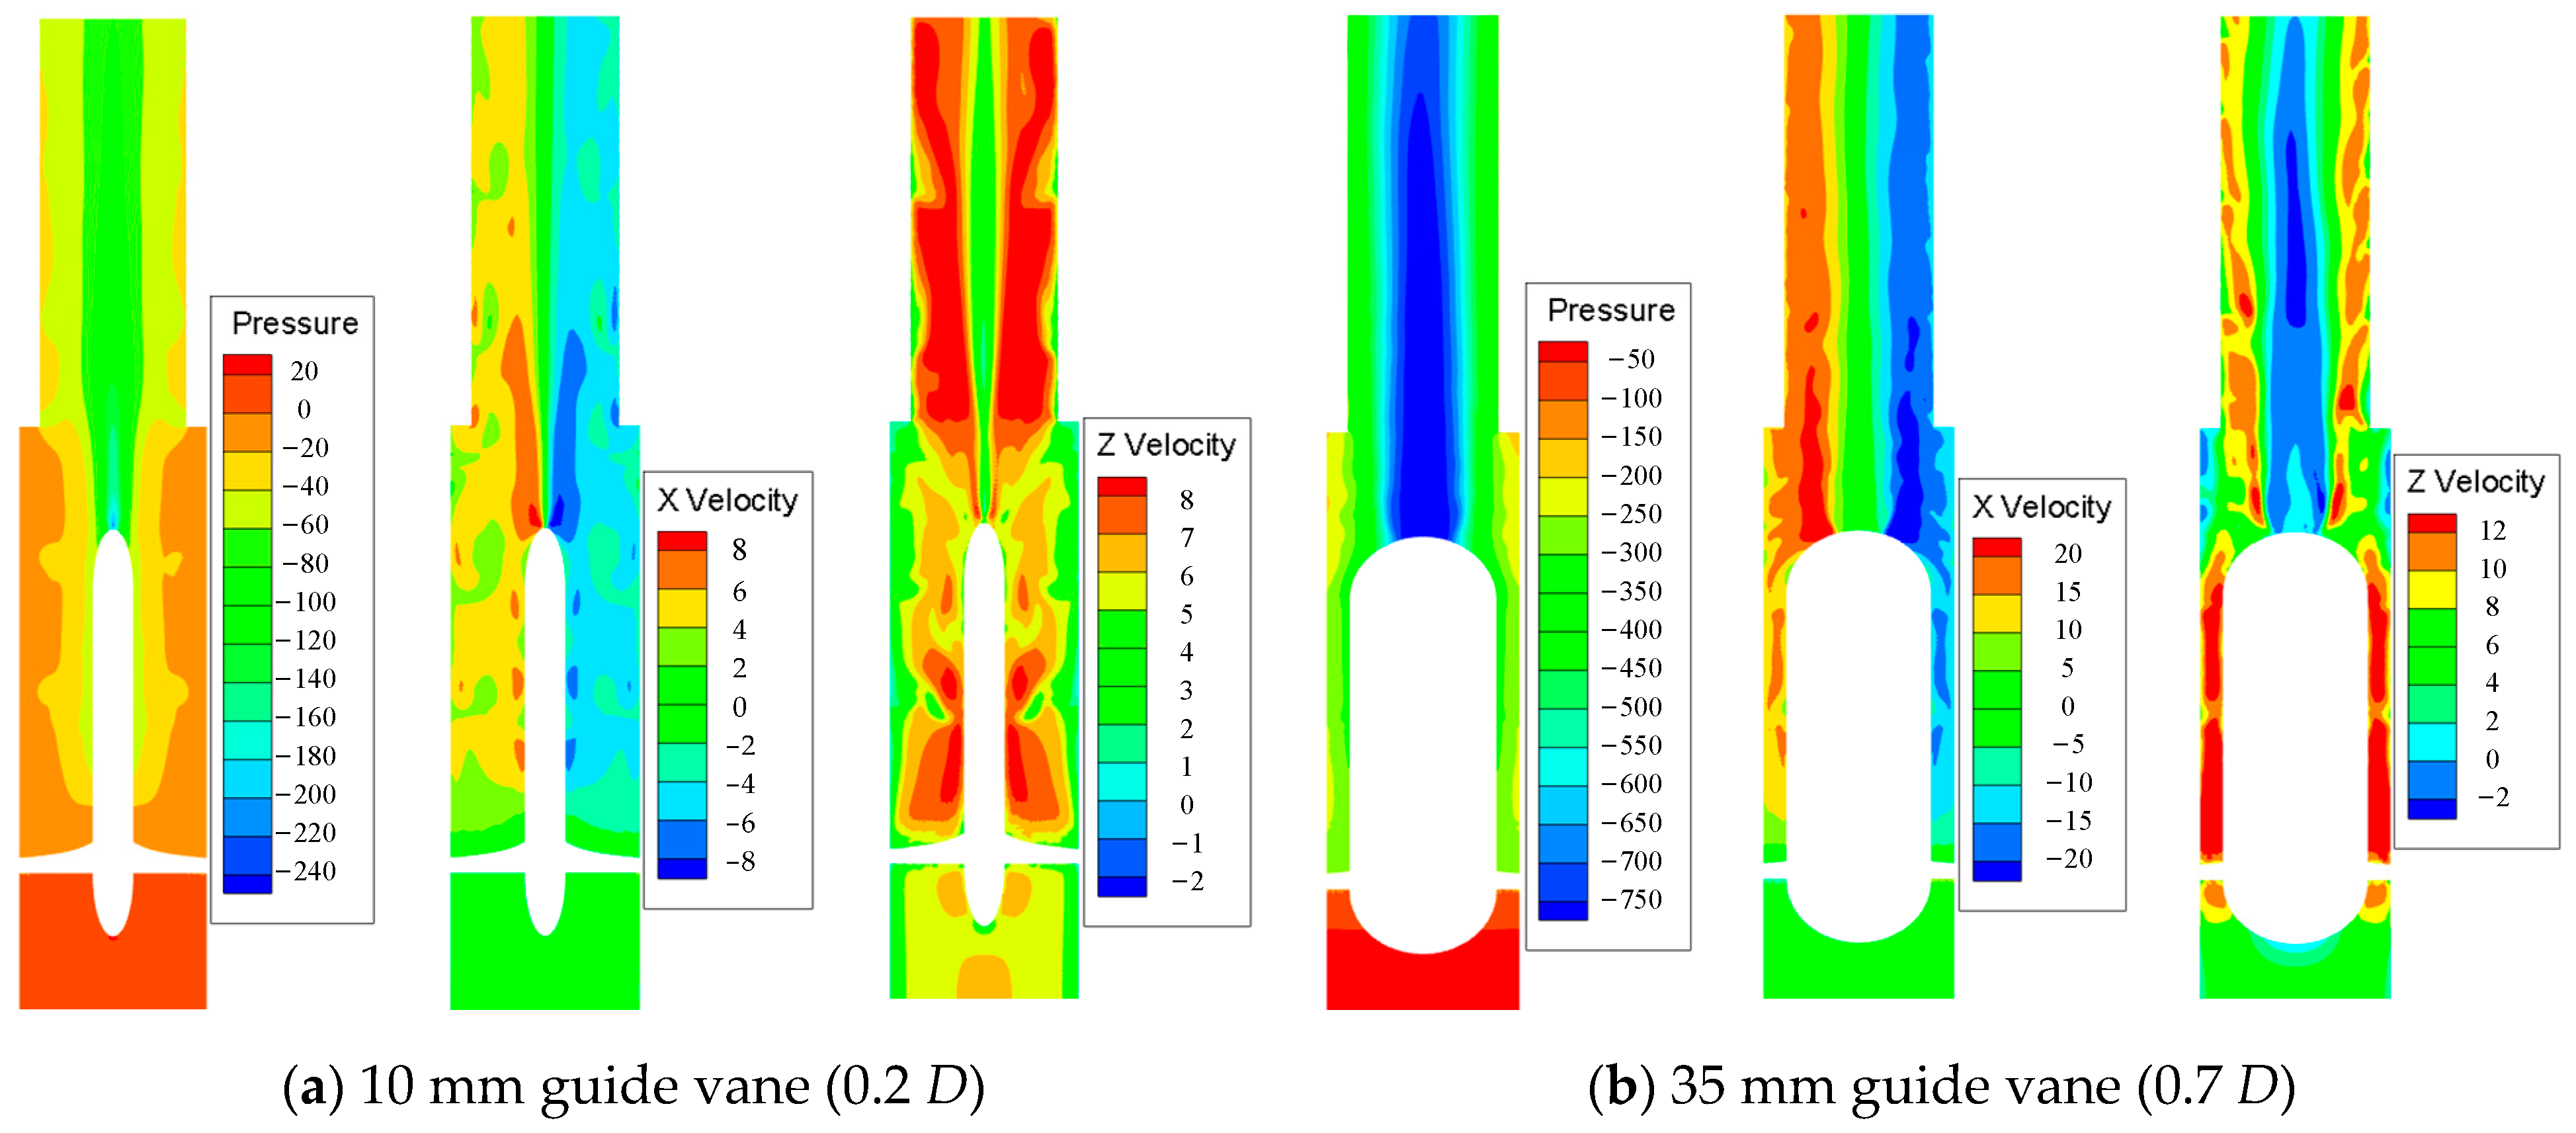
The flow fields between the 10 mm and 35 mm guide cones are given in Figure 18 (the units for the pressure and velocity fields are Pa and m/s, respectively). For the 35 mm guide vane, the flow has a larger pressure gradient, a higher tangential velocity, and a larger reflow region than that of the 10 mm guide cone. The maximum tangential velocity in the 10 mm guide cone cyclone is mainly distributed at the rear of guide cone. By comparison, the tangential velocity in the 35 mm guide vane tube is increased significantly near the particle outlet.
When the diameter of guide vane is changed from 0.2 D to 0.8 D (see Figure 19), the maximum outlet velocity is increased from 9.48 m/s to 31.54 m/s and the maximum tangential velocity is changed from 6.61 m/s to 29.09 m/s. This can be explained by the fact that the cross-sectional area is changed by the guide vane, creating a higher diameter of the guide vane and enabling a higher tangential velocity; hence, the particles are separated more efficiently.
Figure 20 presents the entropy production at different diameters of the guide vane. When the diameter of the guide vane is increased from 0.2 D to 0.7 D, the time-averaged entropy, turbulent entropy, and wall entropy are gradually increased from 4.3 × 10⁻⁵ W/K, 2.2 × 10⁻⁴ W/K, and 2.0 × 10⁻⁴ W/K to 4.6 × 10⁻⁴ W/K, 3.1 × 10⁻³ W/K, and 2.7 × 10⁻³ W/K due to the higher velocity and turbulence intensity.
3.5. Exhaust Pipe Diameter
Figure 21 illustrates the separation performance for different exhaust pipe diameters. By increasing the exhaust pipe diameter from 36 mm to 44 mm, the efficiency of the 167 μm particles is decreased from 96.52% to 67.82%, that of the 296 μm particles is decreased from 90.03% to 49.09%, and pressure drop is decreased from 195.11 Pa to 116.83 Pa. A smaller diameter of the exhaust tube can increase the particle separation efficiency. Similarly, it also leads to an increase in the pressure drop.
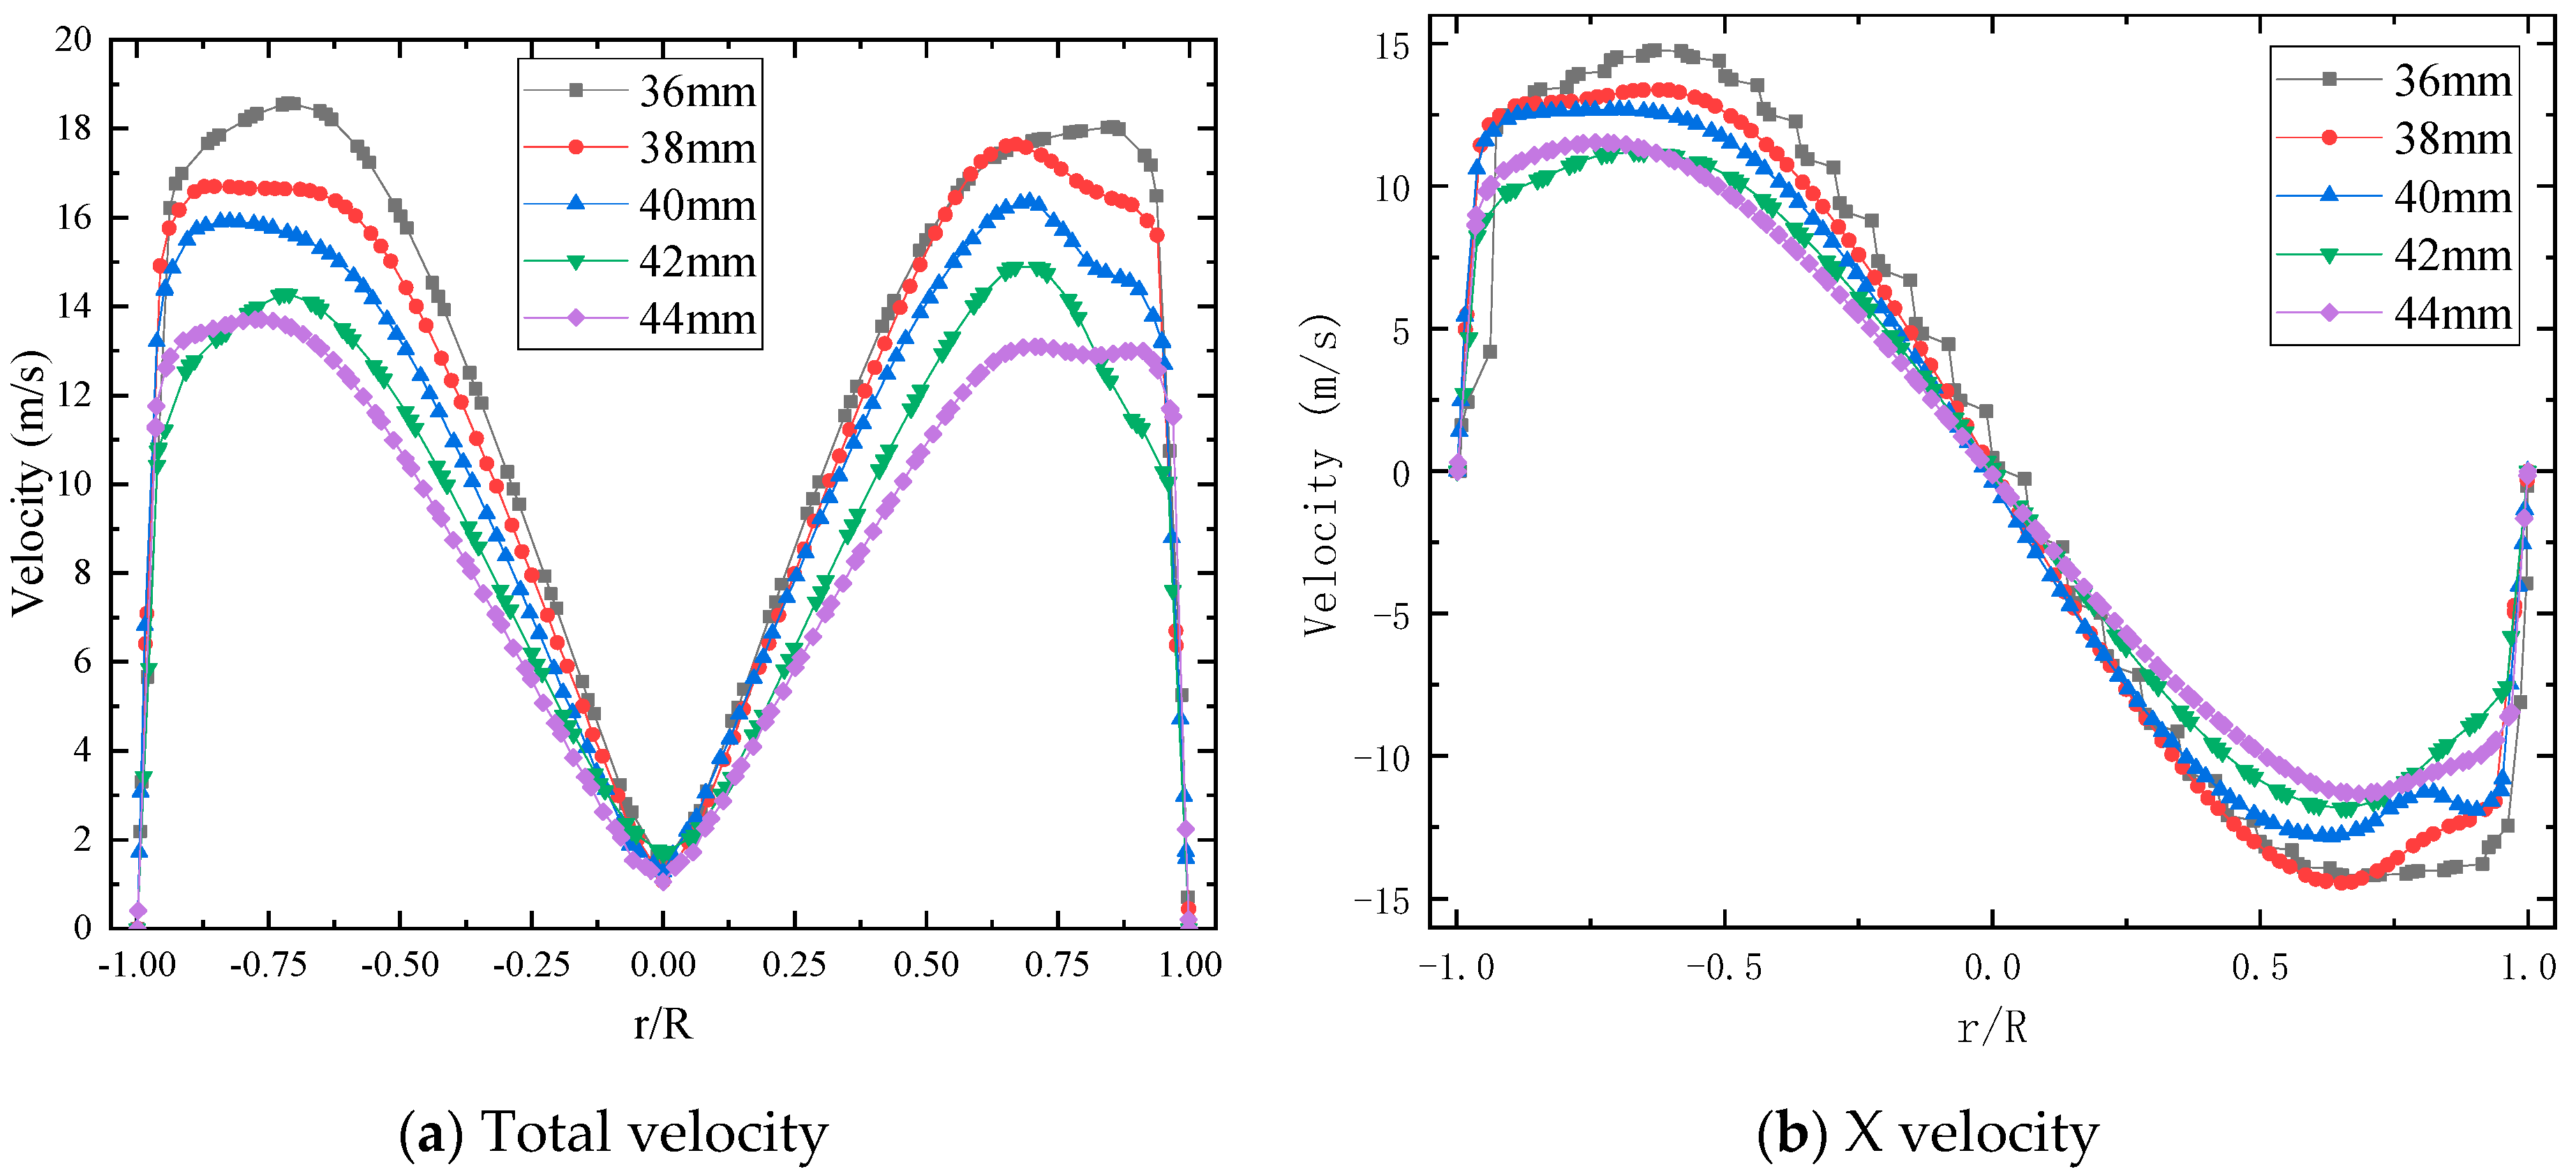
The cyclone exhaust pipe diameter has a notable influence on the velocity distribution, as shown in Figure 22. With the exhaust pipe changing from 44 mm to 36 mm, the distribution of internal velocity showed no significant difference, except for the variation in the velocity value. Correspondingly, the maximum total velocity changed from 13.70 m/s to 18.04 m/s and the maximum tangential velocity changed from 11.53 m/s to 14.17 m/s.
Figure 23 shows the entropy production for different outer diameters of the exhaust pipe changing from 36 mm to 44 mm. The entropy production rate at the rear end of the guide vane and exhaust pipe caused by the cross-section area gradually decreases, which results in a decrease in the time-averaged entropy, turbulent entropy, and wall entropy from 2.5 × 10⁻⁴ W/K, 2.0 × 10⁻³ W/K, 1.3 × 10⁻³ W/K to 1.8 × 10⁻⁴ W/K, 1.1 × 10⁻³ W/K, 1.0 × 10⁻³ W/K.
3.6. Exhaust Pipe Shape
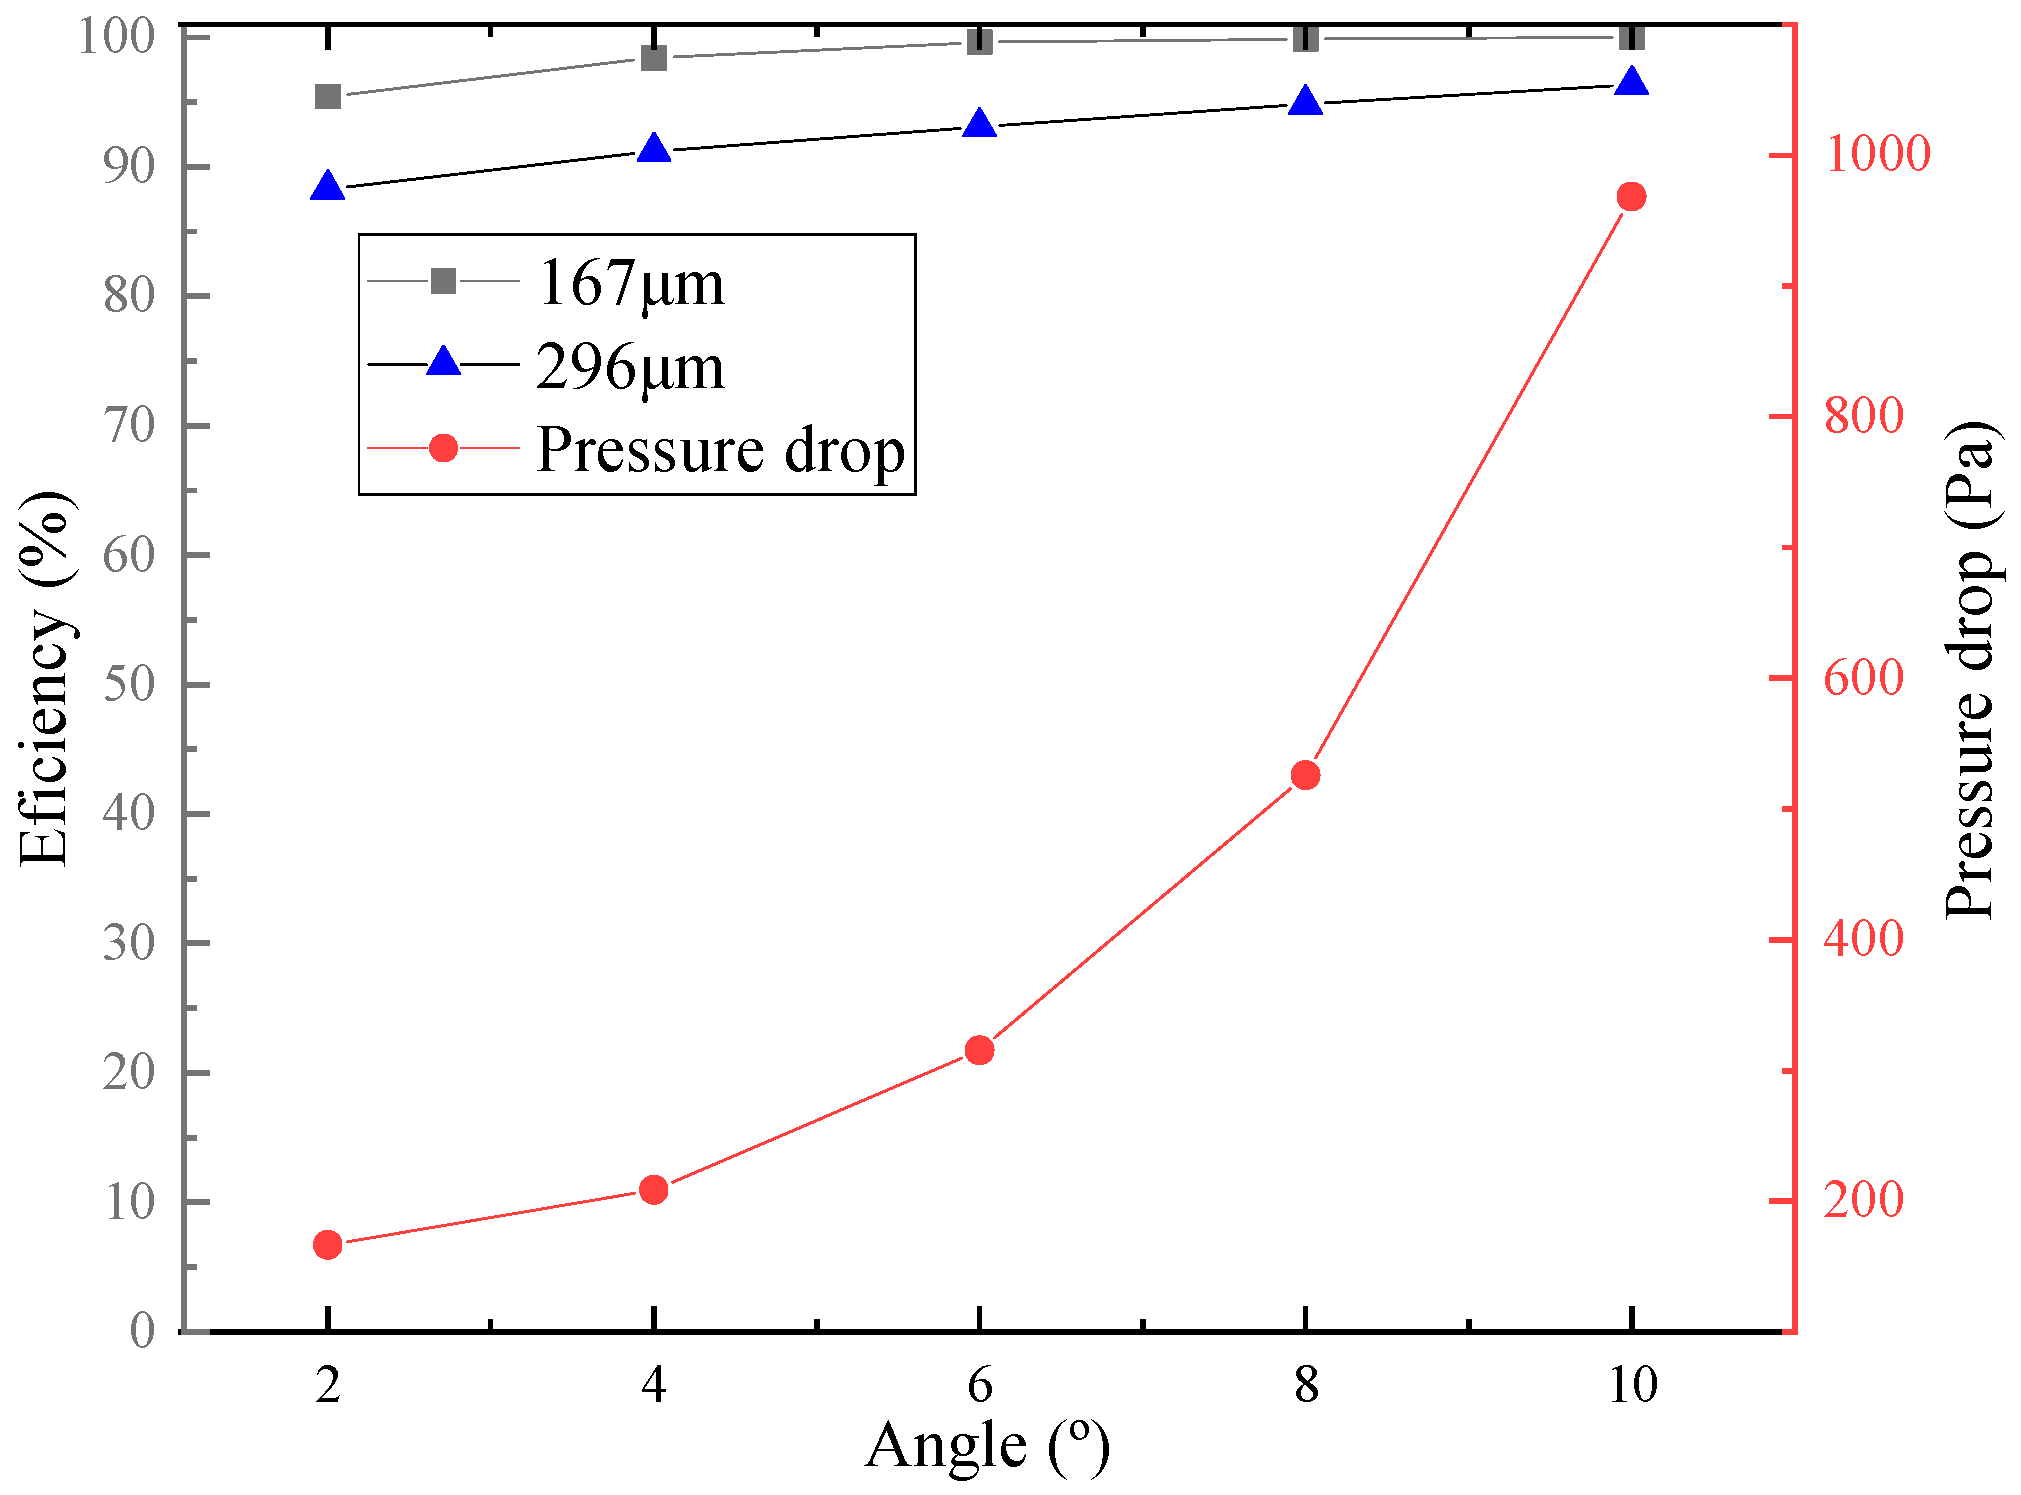
The cyclone performances of different exhaust pipe shapes are shown in Figure 24. When the inclination angle is changed from 2° to 10°, the efficiencies of 167 μm particles and 296 μm particles are increased from 95.44% and 88.30% to 100% and 96.36%. Correspondingly, the pressure drop is increased from 166.33 Pa to 968.38 Pa. This indicates that a larger inclination angle can improve the dust removal efficiency and increase the pressure consumption.
Figure 25 shows the axial flow velocity distribution measured in m/s. The downstream flow field of the guide cone is significantly affected by the shape of the exhaust pipe. A higher inclination angle can increase the velocity at the inlet of the exhaust pipe, causing more zones to be affected by the back flow at the inlet of exhaust pipe.
From Figure 26, one sees that as the exhaust pipe inclination angle increases, the fluid distribution at the blade and guide vane has little variation. However, an obvious acceleration zone and a recirculation zone appears at the rear end of the guide vane and exhaust pipe, leading to higher energy loss at this position. Correspondingly, the time-averaged entropy production, turbulent entropy production, and wall entropy production are increased from 2.4 × 10⁻⁴ W/K, 1.7 × 10⁻³ W/K, and 1.2 × 10⁻³ W/K to 3.9 × 10⁻⁴ W/K, 7.5 × 10⁻³ W/K, and 1.9 × 10⁻³ W/K.
4. Conclusions
A study of the separation performance of the axial cyclone separator was performed using the model based on the entropy production model. The effects of blade number, blade outlet angle, and blade shape on the separation performance are considered. In addition, the influence of guide cone diameter, exhaust pipe diameter, and exhaust pipe shape are investigated.
Numerical simulation shows that a higher performance of an axial cyclone separator can be achieved by an appropriate structure design. Increasing blade number, decreasing blade outlet angle, and choosing the L blade form increase the separation efficiency. Furthermore, a larger guide cone diameter, a smaller exhaust pipe diameter, and a large exhaust pipe inclination angle can also improve the separation efficiency. All of these methods can lead to a larger pressure drop and entropy production due to a higher turbulence dissipation entropy and wall entropy, which is a main reason for energy loss. Our results provide new insights into the particle separation processes and give practical recommendations for improving the dust removal performance of industrial axial flow cyclone separators.
Author Contributions
Investigation and Writing the original version of the manuscript: Y.M.; Project administration, Supervision and Editing the manuscript: R.C. and L.C. All authors have read and agreed to the published version of the manuscript.
Funding
This research was funded by Fundação para a Ciência e Tecnologia grant number UIDB/00147/2020, UIDP/00147/2020, LA/P/0112/2020, PTDC/EEI-AUT/3522/2020, DSAIPA/CS/0086/2020.
Data Availability Statement
Data are unavailable due to privacy or ethical restrictions.
Acknowledgments
RC acknowledges the funding sources including the Base (UIDB/00147/2020) and Programmatic funding (UIDP/00147/2020) of the SYSTEC (Center for Systems and Technologies) and ARISE (Associate Laboratory for Advanced Production and Intelligent Systems, LA/P/0112/2020); as well as the projects RELIABLE (ref. PTDC/EEI-AUT/3522/2020) and MLDLCOV projects (ref. DSAIPA/CS/0086/2020) all funded by the Foundation for Science and Technology (FCT, Portugal). YL has been supported by the China Scholarship Council.
Conflicts of Interest
The authors declare no conflicts of interest.
References
- Eckhoff, R.K.; Li, G. Industrial dust explosions. A brief review. Appl. Sci. 2021, 11, 1669. [Google Scholar] [CrossRef]
- Zhou, X.; Li, X.; Cui, Z.; Wu, L.; Zhou, H.; Lu, X. Combustible wood dust explosions and impacts on environments and health-A review. Environ. Res. 2023, 216, 114658. [Google Scholar] [CrossRef] [PubMed]
- Ray, S.K.; Khan, A.M.; Mohalik, N.K.; Mishra, D.; Mandal, S.; Pandey, J.K. Review of preventive and constructive measures for coal mine explosions: An Indian perspective. Int. J. Min. Sci. Technol. 2022, 32, 471–485. [Google Scholar] [CrossRef]
- Afshar-Mohajer, N.; Wu, C.-Y.; Curtis, J.S.; Gaier, J.R. Review of dust transport and mitigation technologies in lunar and Martian atmospheres. Adv. Space Res. 2015, 56, 1222–1241. [Google Scholar] [CrossRef]
- Shim, J.; Joe, Y.-H.; Park, H.-S. Influence of air injection nozzles on filter cleaning performance of pulse-jet bag filter. Powder Technol. 2017, 322, 250–257. [Google Scholar] [CrossRef]
- Gu, Y.; Tian, E.; Xia, F.; Yu, T.; Afshari, A.; Mo, J. A new pin-to-plate corona discharger with clean air protection for particulate matter removal. Energy Built Environ. 2020, 1, 87–92. [Google Scholar] [CrossRef]
- Han, N.; Wang, Y.; Su, B.-L. Unveiling oscillatory nature for sustainable fuel production. Natl. Sci. Rev. 2024, nwae068. [Google Scholar] [CrossRef]
- Liu, Y.; Cheng, Q.; Zhang, B.; Tian, F. Three-phase hydrocyclone separator–A review. Chem. Eng. Res. Des. 2015, 100, 554–560. [Google Scholar] [CrossRef]
- Nassaj, O.R.; Toghraie, D.; Afrand, M. Effects of multi inlet guide channels on the performance of a cyclone separator. Powder Technol. 2019, 356, 353–372. [Google Scholar] [CrossRef]
- Sakin, A.; Karagoz, I.; Avci, A. Performance analysis of axial and reverse flow cyclone separators. Chem. Eng. Process. Process. Intensif. 2019, 144, 107630. [Google Scholar] [CrossRef]
- Wang, Z.; Zhang, X.; Liao, R.; Lei, Y.; Fang, Z. Study on Pressure Drop Characteristics of a Two-Stage Swirler Separator. SPE Prod. Oper. 2022, 37, 107–119. [Google Scholar] [CrossRef]
- Liu, L.; Bai, B. Numerical study on swirling flow and separation performance of swirl vane separator. Interfacial Phenom. Heat Transf. 2017, 5, 9–21. [Google Scholar] [CrossRef]
- Liu, L.; Bai, B. Scaling laws for gas–liquid flow in swirl vane separators. Nucl. Eng. Des. 2016, 298, 229–239. [Google Scholar] [CrossRef]
- Matsubayashi, T.; Katono, K.; Hayashi, K.; Tomiyama, A. Effects of swirler shape on swirling annular flow in a gas–liquid separator. Nucl. Eng. Des. 2012, 249, 63–70. [Google Scholar] [CrossRef]
- Huard, M.; Briens, C.; Berruti, F.; Gauthier, T.A. A review of rapid gas-solid separation techniques. Int. J. Chem. React. Eng. 2010, 8. [Google Scholar] [CrossRef]
- Gao, S.; Liu, Y.; Fan, Y.; Lu, C. Experimental assessment on an integral two-stage demister of coupling cyclonic separation and granular bed filtration. Powder Technol. 2023, 416, 118178. [Google Scholar] [CrossRef]
- Rocha, A.D.; Bannwart, A.C.; Ganzarolli, M.M. Numerical and experimental study of an axially induced swirling pipe flow. Int. J. Heat Fluid Flow 2015, 53, 81–90. [Google Scholar] [CrossRef]
- Hsiao, T.-C.; Chen, D.-R.; Li, L.; Greenberg, P.; Street, K.W. Development of a multi-stage axial flow cyclone. Aerosol Sci. Technol. 2010, 44, 253–261. [Google Scholar] [CrossRef]
- Mo, X.; Cai, R.; Huang, X.; Zhang, M.; Yang, H. The effects of wall friction and solid acceleration on the mal-distribution of gas–solid flow in double identical parallel cyclones. Powder Technol. 2015, 286, 471–477. [Google Scholar] [CrossRef]
- Ali, H.; Plaza, F.; Mann, A. Flow visualization and modelling of scrubbing liquid flow patterns inside a centrifugal wet scrubber for improved design. Chem. Eng. Sci. 2017, 173, 98–109. [Google Scholar] [CrossRef]
- Azadi, M.; Azadi, M.; Mohebbi, A. A CFD study of the effect of cyclone size on its performance parameters. J. Hazard. Mater. 2010, 182, 835–841. [Google Scholar] [CrossRef] [PubMed]
- Li, Y.-J.; Wang, F.-J. Numerical investigation of performance of an axial-flow pump with inducer. J. Hydrodyn. 2007, 19, 705–711. [Google Scholar] [CrossRef]
- Mao, Y.; Pu, W.; Zhang, H.; Zhang, Q.; Song, Z.; Chen, K.; Han, D. Orthogonal experimental design of an axial flow cyclone separator. Chem. Eng. Process. Process. Intensif. 2019, 144, 107645. [Google Scholar] [CrossRef]
- Kwak, D.; Kiris, C.; Kim, C.S. Computational challenges of viscous incompressible flows. Comput. Fluids 2005, 34, 283–299. [Google Scholar] [CrossRef]
- Sung, G.; Kim, H.-U.; Shin, D.; Shin, W.G.; Kim, T. High efficiency axial wet cyclone air sampler. Aerosol Air Qual. Res. 2018, 18, 2529–2537. [Google Scholar] [CrossRef]
- Tarpagkou, R.; Pantokratoras, A. CFD methodology for sedimentation tanks: The effect of secondary phase on fluid phase using DPM coupled calculations. Appl. Math. Model. 2013, 37, 3478–3494. [Google Scholar] [CrossRef]
- Kock, F.; Herwig, H. Local entropy production in turbulent shear flows: A high-Reynolds number model with wall functions. Int. J. Heat Mass Transf. 2004, 47, 2205–2215. [Google Scholar] [CrossRef]
- Hou, H.; Zhang, Y.; Li, Z.; Jiang, T.; Zhang, J.; Xu, C. Numerical analysis of entropy production on a LNG cryogenic submerged pump. J. Nat. Gas Sci. Eng. 2016, 36, 87–96. [Google Scholar] [CrossRef]
- Delimont, J.M.; Murdock, M.K.; Ng, W.F.; Ekkad, S.V. Effect of Temperature on Microparticle Rebound Characteristics at Constant Impact Velocity—Part I. J. Eng. Gas Turbines Power 2015, 137, 112603. [Google Scholar] [CrossRef]
Figure 1.
The structure of an axial cyclone separator.

Figure 2.
The grid distribution.

Figure 3.
The pressure drops of the simulation and test values.

Figure 4.
Particle diameter distribution [23].
Figure 4.
Particle diameter distribution [23].

Figure 5.
Separation efficiency and pressure drop varies with blade numbers.

Figure 6.
Flow field in the cyclone.

Figure 7.
Vortex core region (swirling strength = 0.06).

Figure 8.
The outlet velocity distribution in various blades.

Figure 9.
Entropy production rates and wall shear distribution.

Figure 10.
The separation performance under different blade outlet angle.

Figure 11.
The velocity distribution at different outlet angle.

Figure 12.
The influence of blade outlet angle on entropy production rates.

Figure 13.
The detailed parameters of the blade.

Figure 14.
The separation performance varies with blade shape.

Figure 15.
Vortex structures of different blades in the cyclone.

Figure 16.
Effect of blade structure on entropy production rates and wall shear.

Figure 17.
Influence of guide vane diameter on performance.

Figure 18.
Details of the flow field in the cyclone.

Figure 19.
The velocity under different diameters of guide vanes.

Figure 20.
Entropy dissipation rates and wall shear at different guide vanes.

Figure 21.
Influence of exhaust pipe diameter on performance.

Figure 22.
Effect of the exhaust pipe diameter on the outlet velocity.

Figure 23.
Entropy dissipation rates and wall shear for different exhaust pipe diameters.

Figure 24.
Effects of outlet pipe shape on performance.

Figure 25.
The axial velocity distribution with different outlet shape.

Figure 26.
Entropy dissipation rates and wall shear at different exhaust pipe angles.


Table 1.
The dimensions of the swirl generator.
| Variable | Project | Value/mm |
|---|---|---|
| D1 | outer diameter | 50 |
| D2 | inner diameter | 46 |
| d | diameter of guiding cone | |
| a1 | wall thickness | 2 |
| a2 | guide vane length | 30 |
| a3 | guiding cone length | 100 |
| a4 | distance between the pressure hole and dust outlet | 50 |
Table 2.
The function relationships and parameters of different blades.
| Blade Shape | Function | Parameter |
|---|---|---|
| C | ||
| M1 | A = 0.0328 B = 1.9107 | |
| M2 | A = 0.1969 B = 1.4657 | |
| M3 | A = 0.6280 B = 1.1889 | |
| L |
Disclaimer/Publisher’s Note: The statements, opinions and data contained in all publications are solely those of the individual author(s) and contributor(s) and not of MDPI and/or the editor(s). MDPI and/or the editor(s) disclaim responsibility for any injury to people or property resulting from any ideas, methods, instructions or products referred to in the content. |
© 2024 by the authors. Licensee MDPI, Basel, Switzerland. This article is an open access article distributed under the terms and conditions of the Creative Commons Attribution (CC BY) license (https://creativecommons.org/licenses/by/4.0/).
Share and Cite
MDPI and ACS Style
Mao, Y.; Chertovskih, R.; Cai, L. Numerical Study of the Gas–Solid Separation Performance of Axial Flow Cyclone Separators. Inventions 2024, 9, 34. https://doi.org/10.3390/inventions9020034
AMA Style
Mao Y, Chertovskih R, Cai L. Numerical Study of the Gas–Solid Separation Performance of Axial Flow Cyclone Separators. Inventions. 2024; 9(2):34. https://doi.org/10.3390/inventions9020034
Chicago/Turabian StyleMao, Yanqin, Roman Chertovskih, and Liang Cai. 2024. "Numerical Study of the Gas–Solid Separation Performance of Axial Flow Cyclone Separators" Inventions 9, no. 2: 34. https://doi.org/10.3390/inventions9020034