Article

Quality of Crowdsourced Data on Urban Morphology—The Human Influence Experiment (HUMINEX)

1
Center for Earth System Research and Sustainability, University of Hamburg, D-20146 Hamburg, Germany
2
Department of Forest and Water Management, Ghent University, 9000 Ghent, Belgium
3
Institute for Astronomy, Astrophysics, Space Applications and Remote Sensing, National Observatory of Athens, Athens GR-15236, Greece
4
School of Chemical Engineering, National Technical University of Athens, Athens GR-15780, Greece
5
Institute of Ecology, Technische Universität Berlin, D-12165 Berlin, Germany
6
Department of Earth and Environmental Sciences, KU Leuven, 3001 Leuven, Belgium
7
Institute of Geography, University of Augsburg, D-86159 Augsburg, Germany
8
School of Geographical Sciences and Urban Planning, Arizona State University, Tempe, AZ 85287, USA
9
School of Geography, University College Dublin, Dublin 4, Ireland
10
Purdue University, West Lafayette, IN 47906, USA
11
Ecosystems Services and Management Program, International Institute for Applied Systems Analysis, A-2361 Laxenburg, Austria
*
Author to whom correspondence should be addressed.
Urban Sci. 2017, 1(2), 15; https://doi.org/10.3390/urbansci1020015
Submission received: 13 March 2017 / Revised: 28 April 2017 / Accepted: 6 May 2017 / Published: 9 May 2017
(This article belongs to the Special Issue Crowdsourcing Urban Data)

Abstract

:
The World Urban Database and Access Portal Tools (WUDAPT) is a community initiative to collect worldwide data on urban form (i.e., morphology, materials) and function (i.e., use and metabolism). This is achieved through crowdsourcing, which we define here as the collection of data by a bounded crowd, composed of students. In this process, training data for the classification of urban structures into Local Climate Zones (LCZ) are obtained, which are, like most volunteered geographic information initiatives, of unknown quality. In this study, we investigated the quality of 94 crowdsourced training datasets for ten cities, generated by 119 students from six universities. The results showed large discrepancies and the resulting LCZ maps were mostly of poor to moderate quality. This was due to general difficulties in the human interpretation of the (urban) landscape and in the understanding of the LCZ scheme. However, the quality of the LCZ maps improved with the number of training data revisions. As evidence for the wisdom of the crowd, improvements of up to 20% in overall accuracy were found when multiple training datasets were used together to create a single LCZ map. This improvement was greatest for small training datasets, saturating at about ten to fifteen sets.

Graphical Abstract

1. Introduction

The role of cities as drivers of global environmental change and as places that are uniquely exposed to a range of natural hazards (both current and projected) has highlighted a data gap. While there are numerous studies on urban growth [1,2,3], building urban resilience [4,5,6], and on urban analytics and smart cities [7,8,9], there is a dearth of information on the place-specific character of urban landscapes worldwide. This information is needed to make informed decisions about the nature of urban risks, to provide a basis for planning of sustainable cities, to transfer knowledge between cities, to run increasingly sophisticated models on urban impacts on ecosystems, and to link global/regional environmental change to city outcomes. Fundamentally, urban science needs data on the form and functions of cities at a scale that is useful for decision making. Form describes the physical layout of the city (land-cover), while function captures the ‘metabolic’ processes that consume energy, materials and water and generate wastes (land-use). Urban adaptation and mitigation strategies seek to modify and regulate these aspects of cities to manage risk and its components. Data on form and function must be acquired using consistent methodologies to have universal relevance. Satellite-based sensors are ideally suited to this task and have been used to generate global urban masks (that is, the extent of urban cover) [10,11] but these have not provided any detail on the internal make-up of cities [12]. The World Urban Database and Access Portal Tools (WUDAPT) project is designed to address this lacuna [13].
WUDAPT takes a hierarchical approach to urban data acquisition; its first objective is to map the basic physical geography of cities worldwide using a standard classification scheme, Landsat data and crowdsourced knowledge. The Local Climate Zones (LCZ) system [14] provides the framework for data gathering. LCZ types (also referred to in this paper as LCZ categories and LCZ classes) are comprised of 10 urban and 7 natural types that are each associated with data values that describe variables on the typical building, thermal, radiative and metabolic properties of urban neighborhoods (≥1 km2). The LCZ scheme was designed primarily for assessing local climate impacts [15,16,17,18,19]; but as it describes the urban landscape generally (e.g., vegetative and building fractions), a map of LCZ types across a city also encodes its internal structure. As such, WUDAPT data can be used to assess current and project urban impacts on the local atmosphere and hydrosphere and can be used to map exposure to existing and projected hazards [20,21,22]. Moreover, these maps can provide a spatial framework for gathering related information on ecosystems, carbon emissions, public health, etc. A worldwide LCZ database on cities would provide much of the data infrastructure to support global initiatives on urban-scale risk assessment and appropriate adaptation and mitigation strategies.
Several methods for creating LCZ maps have been proposed, including supervised pixel-based classification from multiple Earth Observation (EO) data streams [23], model-based GIS approaches [24,25,26], and object-based image analysis [27,28]. For WUDAPT, it was decided that a simple and efficient computing workflow based on free software and data was needed. This resulted in a universal WUDAPT methodology [29] that uses high-resolution imagery from Google Earth as the basis for identifying and digitizing training areas (TAs) that represent typical examples of the LCZs present in their city. Along with free Landsat satellite imagery, these TAs are used in the LCZ classification, which here refers to the process of using a machine learning approach to assign the LCZ types to derive a complete LCZ map for the respective city. This method has been implemented in a single LCZ classification tool in the open source SAGA software [30]. While several improvements with new sources of data [31,32,33,34] and methods [35,36,37,38] are currently being investigated, this simple methodology has proven to be useful: to date, a large number of individuals around the world have classified over 50 cities worldwide [31,32,39]. As such, WUDAPT is an example of the crowdsourcing of geographic information—also referred to as volunteered geographic information (VGI) [40] and citizen science—amongst other terms related to user generated content [41]. Generally, crowdsourcing involves the distribution of tasks to a crowd [42], often due to the sheer volume of the work involved and the lack of labour needed to complete it. For WUDAPT, another important element in involving the crowd is to elicit the knowledge of individuals located in different cities around the world. Hence, members of the International Association of Urban Climate [43] are the main contributors to WUDAPT due to their strong interest in urban climate related issues but anyone with an interest in contributing to the WUDAPT database can participate.
Since the LCZ maps are intended for use in a range of different applications, such as climate models at various scales, there is a clear need for a common quality assessment process. Critical for mapping accuracy is the quality of the TAs provided by the crowd. Previous examinations of TAs for different cities revealed that not everyone in the crowd follows the WUDAPT recommendations for TA sizes and shapes and that often LCZ TAs have simply been misidentified. This is mainly driven by the large variability in human interpretation of imagery, which is a common problem in supervised classification [44,45,46]. Similar concerns have recently been raised with respect to the quality of crowdsourced data [47,48]. Hence, new methods are emerging to assess and improve the quality of crowdsourced data, both during data collection and in post-processing afterwards [49,50].
To investigate the effect of the crowdsourcing of TAs on the LCZ mapping process within the WUDAPT methodology, the HUMan INfluence EXperiment (HUMINEX) was designed. The overall aims are to (1) investigate the quality of LCZ maps produced by different individuals (hereafter referred to as the operators) using the WUDAPT methodology; (2) address the influence of their individual perception and interpretation, which is based on their experience and prior knowledge; and (3) investigate how the mapping accuracy can be improved, e.g., by revision of the initial training data or by joining crowdsourced data from several operators. This paper provides the first results of HUMINEX, organized as follows: (i) in Section 2 the experiment is introduced; (ii) in Section 3 the data collection for the experiment and the analysis methods are outlined; (iii) the results obtained are presented in Section 4; followed by (iv) a discussion of the implications of the findings for future LCZ mapping in Section 5; (v) and finally, the conclusions are presented in Section 6.

2. Description of the Human Influence Experiment

HUMINEX was designed to evaluate how individual perception and bias impacts the mapping accuracy of cities following the WUDAPT framework across different cities in the world. The experiment was set up as a coordinated effort among student courses from several universities. Participants were provided with materials (software, website, and papers) for their classroom exercises, which included the LCZ mapping workflow as described briefly below. However, since the courses had different starting times and different formats, the degree of standardization was limited.

2.1. The LCZ Scheme

The LCZ scheme presented in Figure 1 includes ten urban types that describe urban neighbourhoods in terms of typical building heights and densities, construction materials (i.e., lightweight vs. concrete), and vegetation cover. These urban types can be further categorized as: dense urban fabric (LCZs 1 to 3), open urban fabric (LCZs 4 to 6), and commercial and other urban fabric (LCZs 7 to 10). The LCZ scheme also contains seven natural types, which are discriminated by the abundance and kind of vegetation, bare soil, bare rock and water.

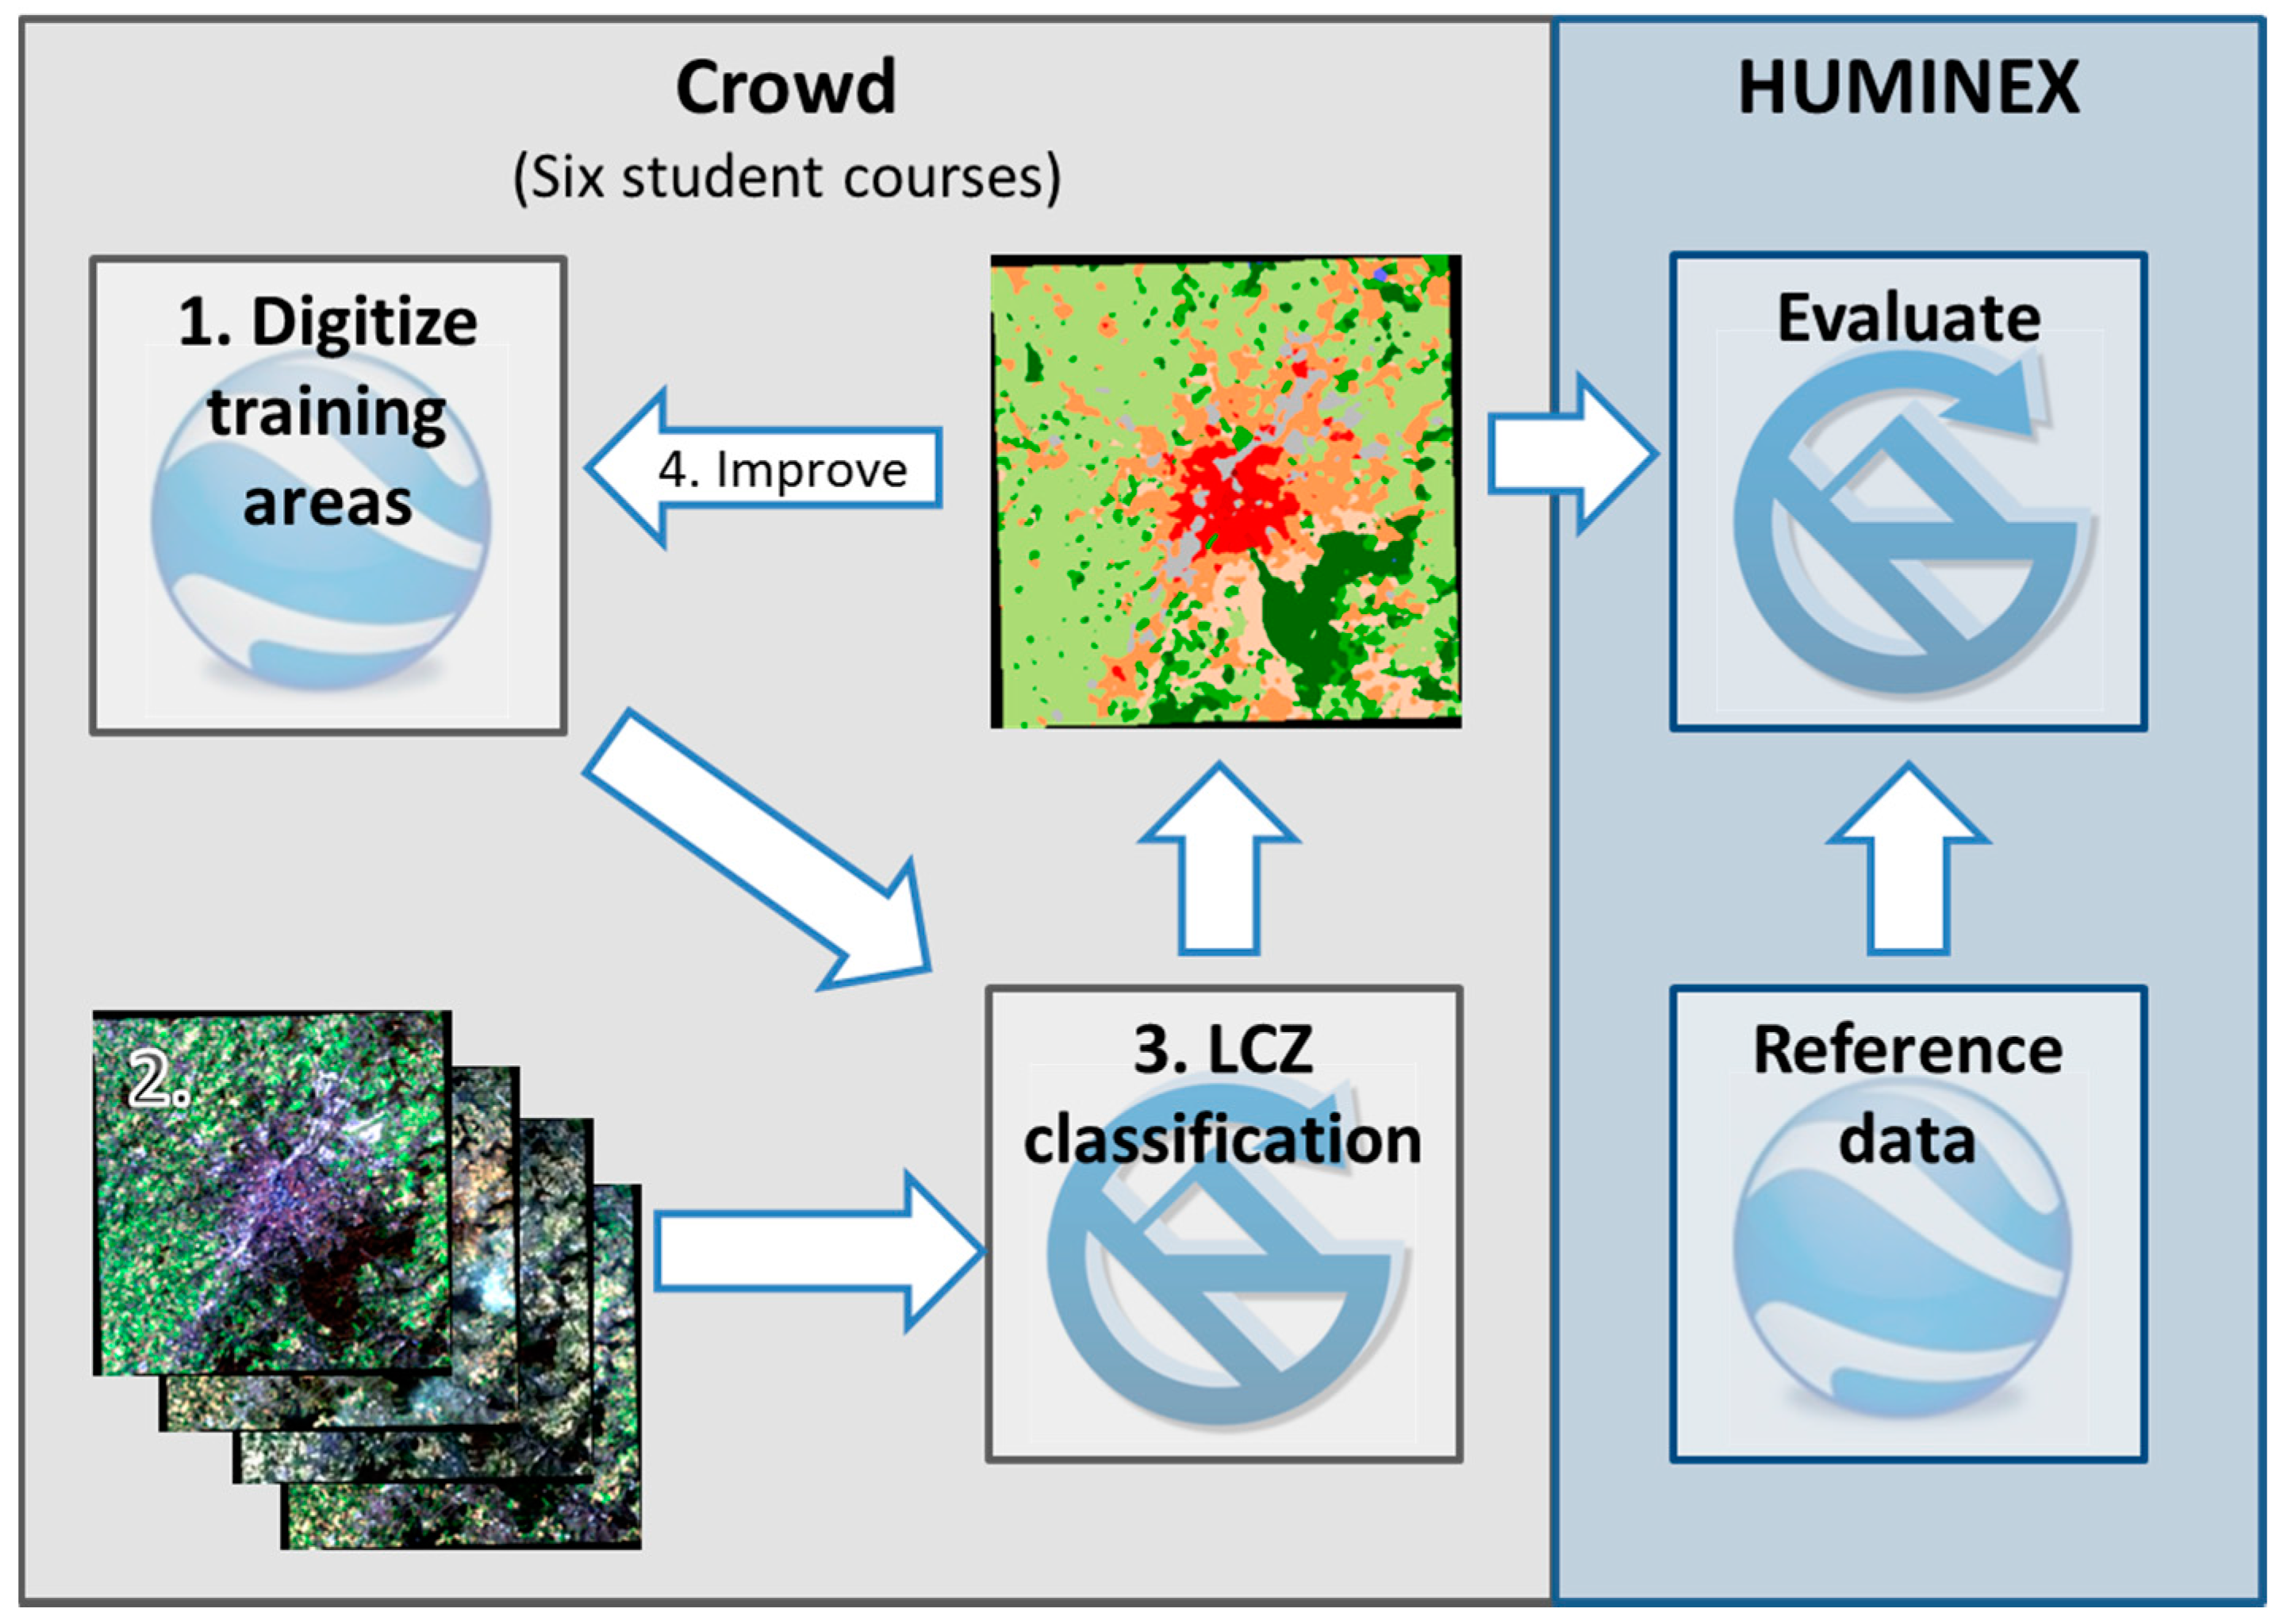
2.2. LCZ Classification Workflow

The classification workflow is outlined in Figure 2. Since LCZs are visually identifiable from high-resolution satellite imagery, the first step is to identify and digitize representative examples (=polygons) of all LCZ types present in a city (i.e., the TAs) using the Google Earth desktop application.
The second step in the LCZ classification workflow (Figure 2, point 2) is to download Landsat imagery for the city, clip it to the region of interest (including a buffer around the city built-up), and resample the imagery to a common 100 m grid (grid cells are referred to as pixels here) using the SAGA GIS software [30]. Subsequently, a supervised random forest classifier [51] is applied to the multispectral and thermal satellite image data to create an LCZ map (Figure 2, point 3). This is implemented in the LCZ classification tool in SAGA as detailed in [29]. The LCZ map is then inspected visually by the operator using Google Earth to evaluate how well it matches the underlying urban landscape. Subsequently, additional TAs are digitized and existing TAs are modified for those LCZ classes that are not well represented or where confusion between different LCZ classes has occurred (Figure 2, point 4). This procedure is then repeated iteratively until no further improvements are deemed necessary.
This basic LCZ workflow was provided as a set of online training materials that were used in designated student exercises. Typically, the students (subsequently referred to as operators) were introduced to the LCZ scheme and the WUDAPT framework before they were provided with the software and a template containing predefined folders for each LCZ class. Each participant was asked to define TAs for their specific city according to the WUDAPT protocol, i.e., to be of a size of approximately 1 km2; to be as homogeneous as possible; to be compact in shape, and to have sufficient space along the borders with neighbouring LCZ areas. In addition, the TAs of each LCZ class should include at least five to ten TA polygons in the first round to cover the city-specific class internal variation (e.g., for an urban LCZ class the internal variation due to different roof colors/materials).

2.3. Collection of Metadata on Individual Operators

In addition to the TAs and LCZ maps, comprehensive metadata was collected from each operator using a questionnaire. Table 1 provides an overview of the collected metadata, ranging from basic information (e.g., age and gender) to LCZ specific knowledge, details on the TA collection and LCZ classification (e.g., number of iterations), and questions relating to the behavioural aspects and personality (e.g., “I like to collaborate”). Additionally, some self-assessment questions were asked, including their assessment of the final LCZ map, their knowledge of the city being mapped, and their image classification experience. The design of the questionnaire was influenced largely by Van Coillie et al. [46], who found that the operator performance is mainly determined by demographic, non-cognitive and cognitive personality factors, and less by external and technical factors.
It should be noted that some courses had already started when HUMINEX was fully set up, so that the metadata was not always collected during the mapping exercise. In these cases, the questionnaire was filled in retrospectively, which impacted completeness and may have affected answers depending on the recall of the participants.

3. Data and Methods

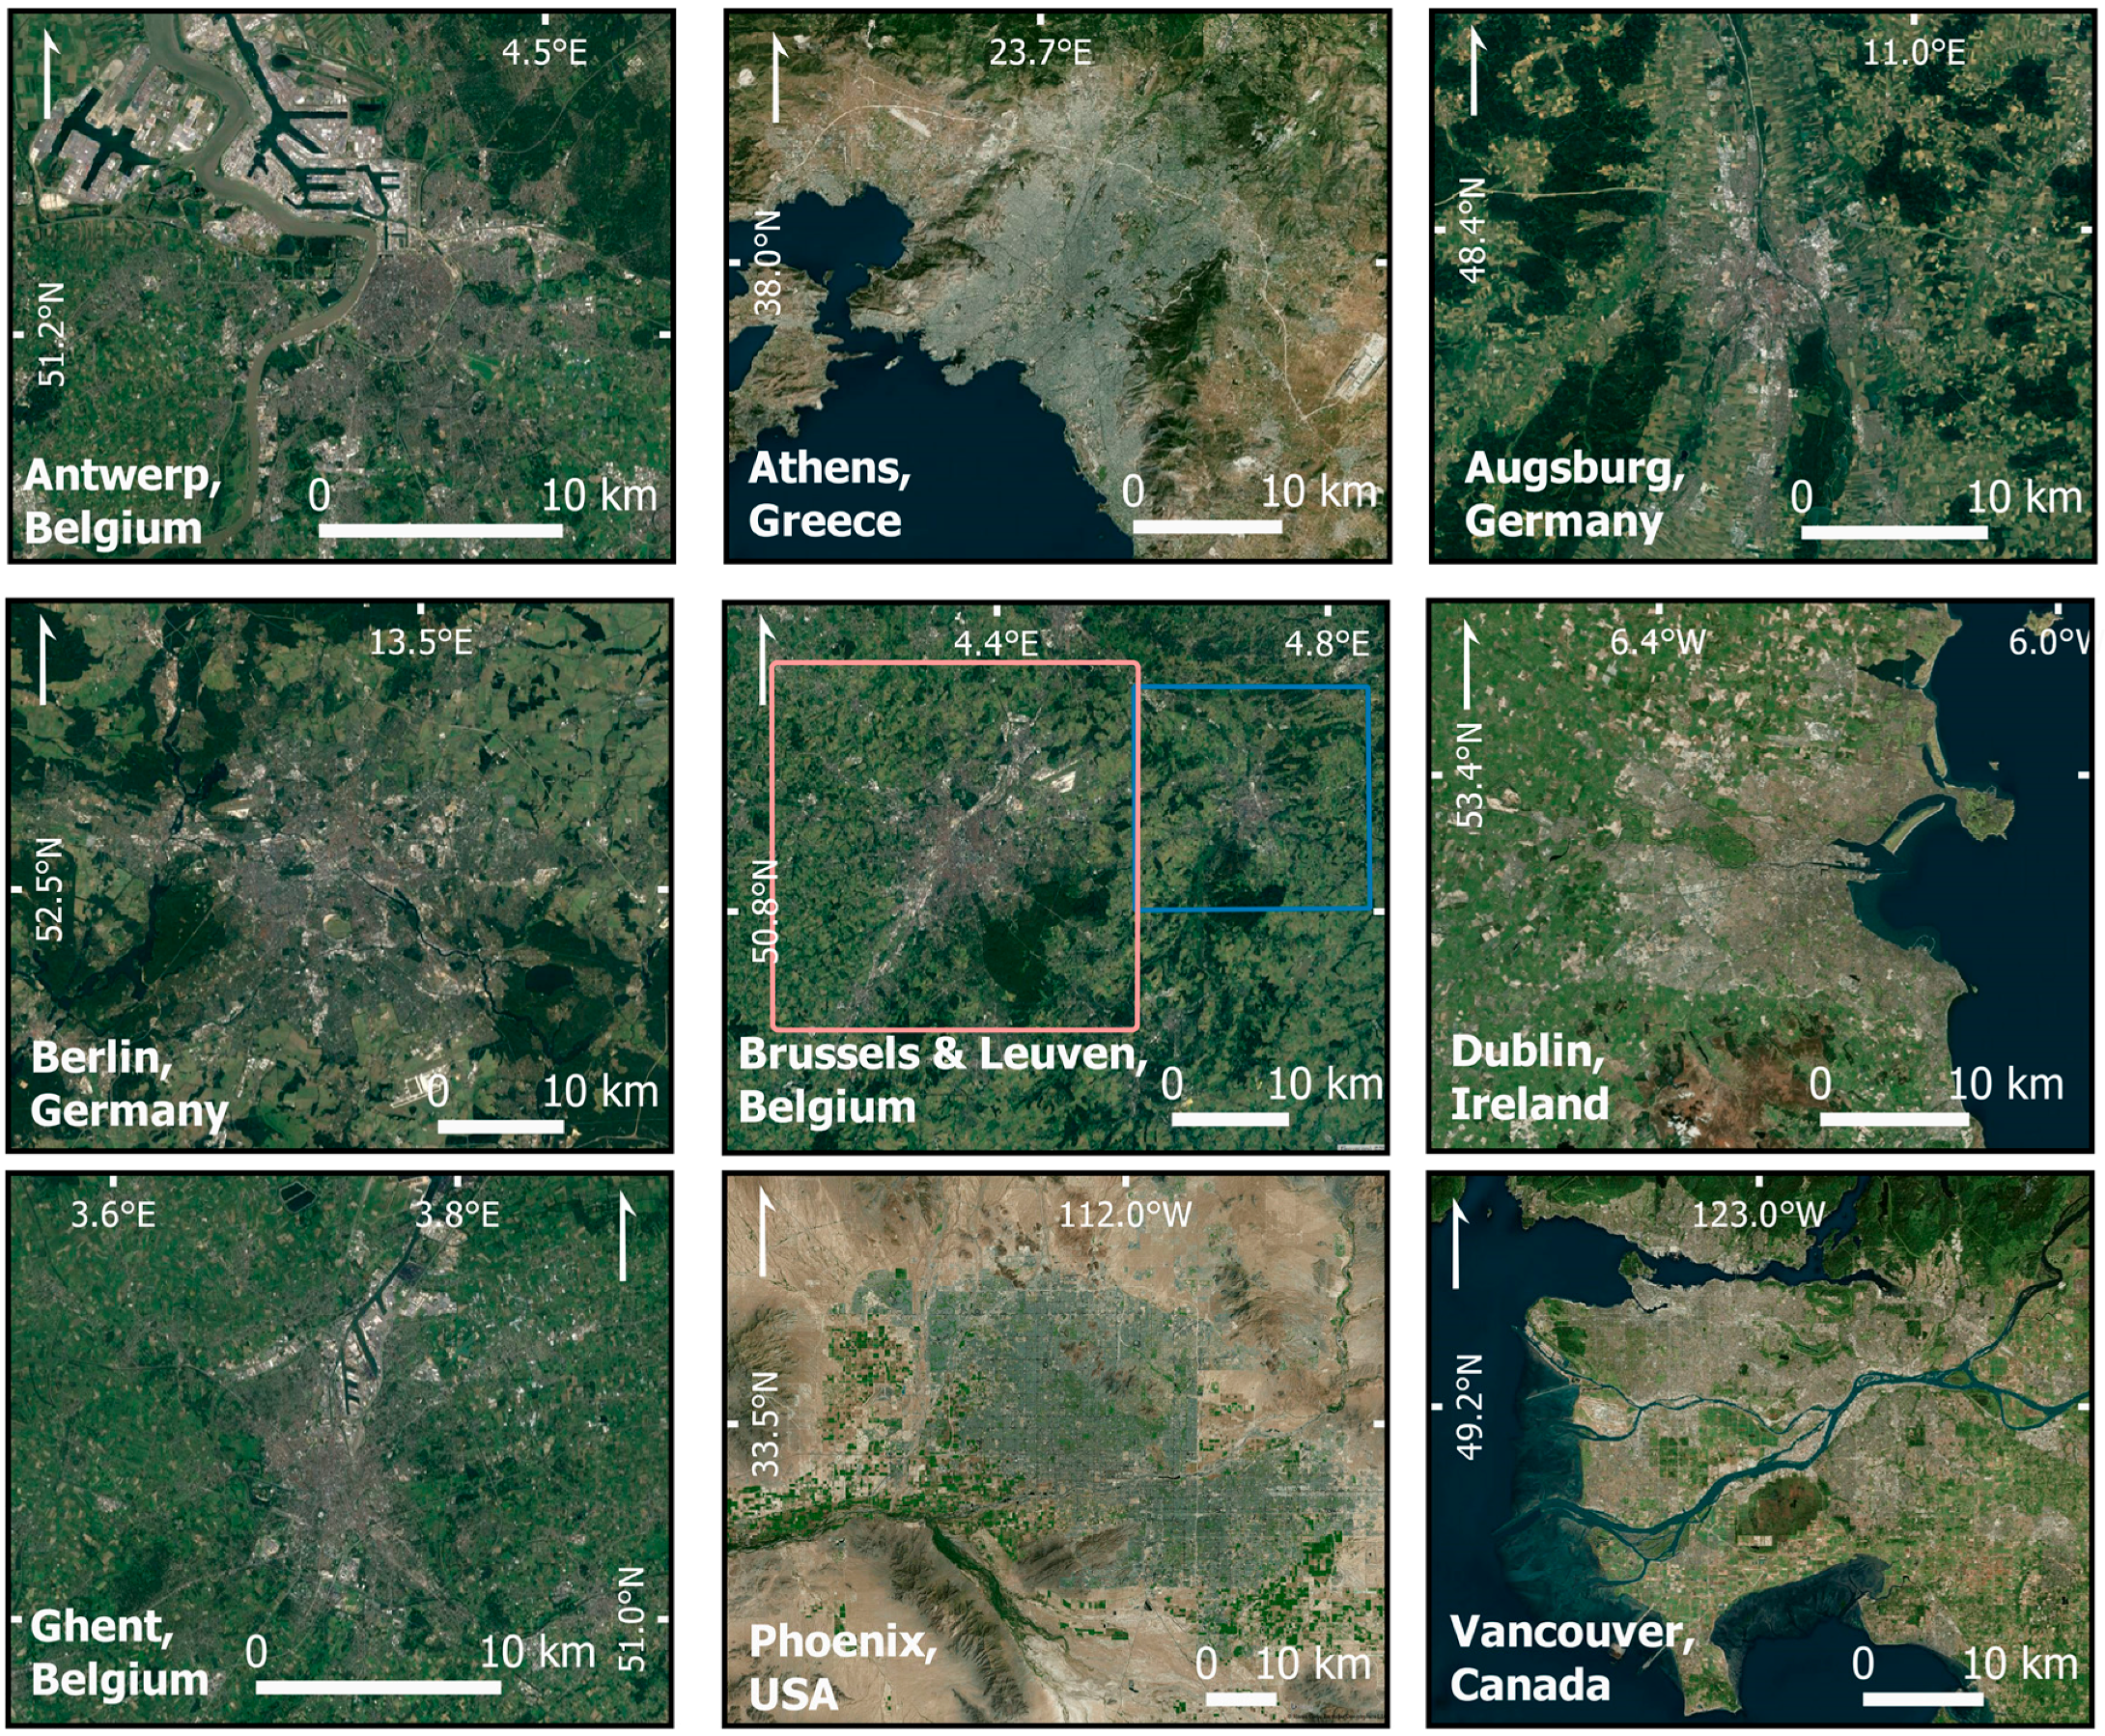
3.1. TAs and LCZ Maps Collected during HUMINEX

In total, six institutions took part in HUMINEX, creating multiple versions of TAs and LCZ maps for ten different cities, as outlined in Table 2 and shown in Figure 3. 119 students participated, while the number of operators working on a single city varied between institutions, ranging from four for Antwerp, Belgium, and Dublin, Ireland, to 31 for the city of Leuven, Belgium. Moreover, operators were given different times for completion, from twelve hours to several weeks as a homework assignment. In a few cases, two or more participants worked together to digitize the TAs while creating only a single LCZ map. A few operators only submitted the classified maps and not the TAs and were excluded from the analysis. One map was not considered due to an erroneous output format of the classification result. In total, 94 TA sets were evaluated.
Since the WUDAPT protocol involves an iterative process, additional TAs were digitized and new LCZ maps were produced after each iteration. The number of iterations varied widely between operators. TUB, NOA, and KUL saved the TA sets from each iteration for further analysis.

3.2. Accuracy Assessment of the LCZ Maps

We assessed the accuracy of the training data based on the resulting LCZ maps; other sources of error that are inherent in the machine learning process were ignored. For each city, a sample of reference areas were identified by an LCZ expert (in most cases, the course teacher) familiar with the methodology and the city under study. Since the reference data are also affected by subjective interpretation, a second expert reviewed them to minimize this effect; unclear cases were excluded from the study.
For each map, we derived the following standard accuracy measures from their respective confusion matrices: overall accuracy (OA = percentage of correctly classified pixels); producer accuracy (PAi = percentage of correctly classified pixels for class i); user accuracy (UAi = percentage of the pixels classified as class i that actually belong to class i); the F1 value, which is the weighted harmonic mean of UA and PA: F1i = 2 × UAi × PAi/(UAi + PAi); and the κ-index, which is a single standard measure accounting for the class-wise performance. A summary of relevant accuracy measures can be found in [52].
Since the urban LCZ types are of particular relevance (e.g., with respect to intra-urban climatic differentiations) and because several of these types are quite similar, we introduced additional accuracy measures. The OAurb is the OA of only the urban reference polygons and thus gives the quality for the urban classes. The OAbuiltup is the overall accuracy of built vs. natural types only, ignoring their internal differentiation. Therefore, we reclassified the maps into urban and natural only (class E is omitted since it can be paved (artificial) or rock (natural)). Finally, we introduced a weighted accuracy (WA) measure, which uses a similarity matrix called the LCZ metric (cf. Appendix A) to account for the similarity between LCZ types. WA is based on the climatic impact as discussed in [15] and consists of up to twelve points for the properties openness, height, cover, and thermal inertia, penalizing confusion between dissimilar types more than confusion between similar classes [53]. For example, LCZ 1 is most similar to the other two compact urban types (LCZs 2 and 3) and hence these pairs have higher weights than classes which are very different, such as LCZ 1 and the natural types. The weights are applied to the confusion matrix so that WA measures the accuracy of the LCZ map in terms of the expected thermal impact, rather than the percentage of predicted LCZ values that exactly match those in the reference areas.
In addition, we used ordinal statistics to assess the spatial and type wise accordance of the classification results of different operators. In particular, the modal LCZ type (most frequently chosen LCZ type among N operators) was calculated for each pixel. The consistency of the class for this pixel was further defined as the percentage of classifications where the modal class was chosen.

4. Results

The analysis was performed in different phases. First, we compared the classifications of the same city to assess the impact of the operator on the classification result (Section 4.1). Second, we conducted a class-specific analysis through the comparison with reference data to determine if some LCZ types were consistent and generally had higher accuracies than others (Section 4.2). Third, we assessed the accuracy of the different iterations by diverse accuracy measures (Section 4.3); and finally, the added value of combining multiple TA datasets to create a single LCZ map was assessed (Section 4.4).

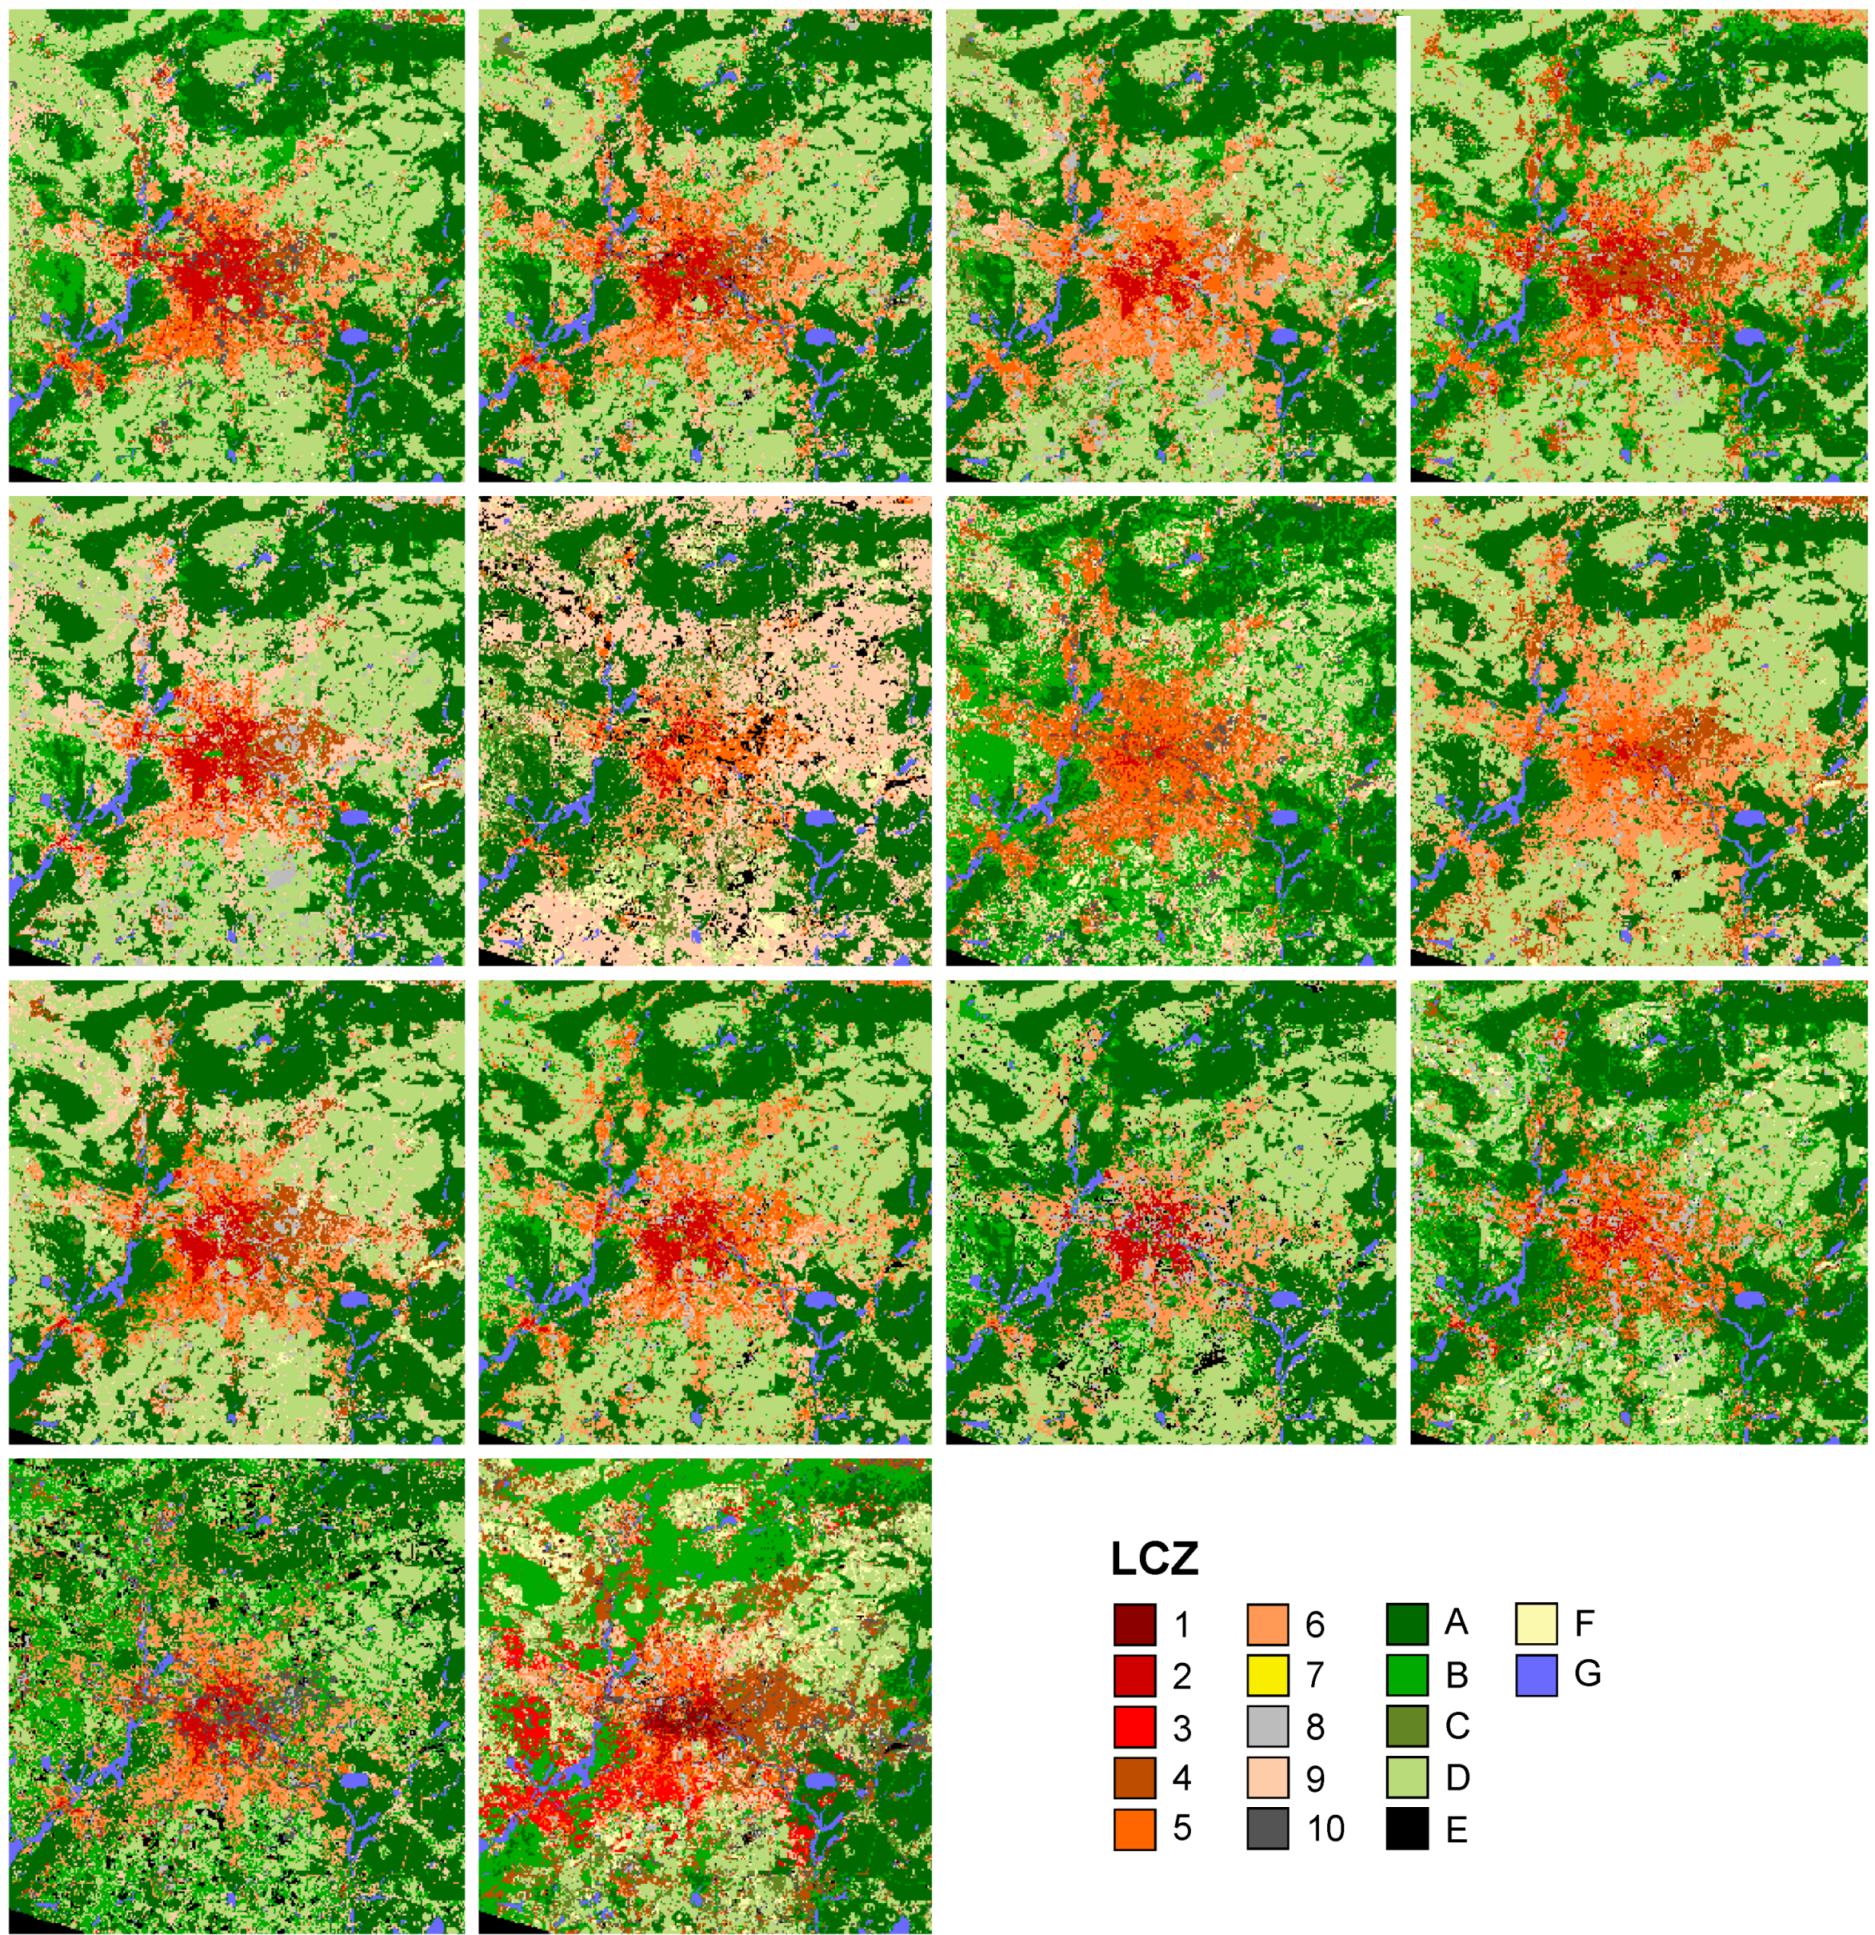
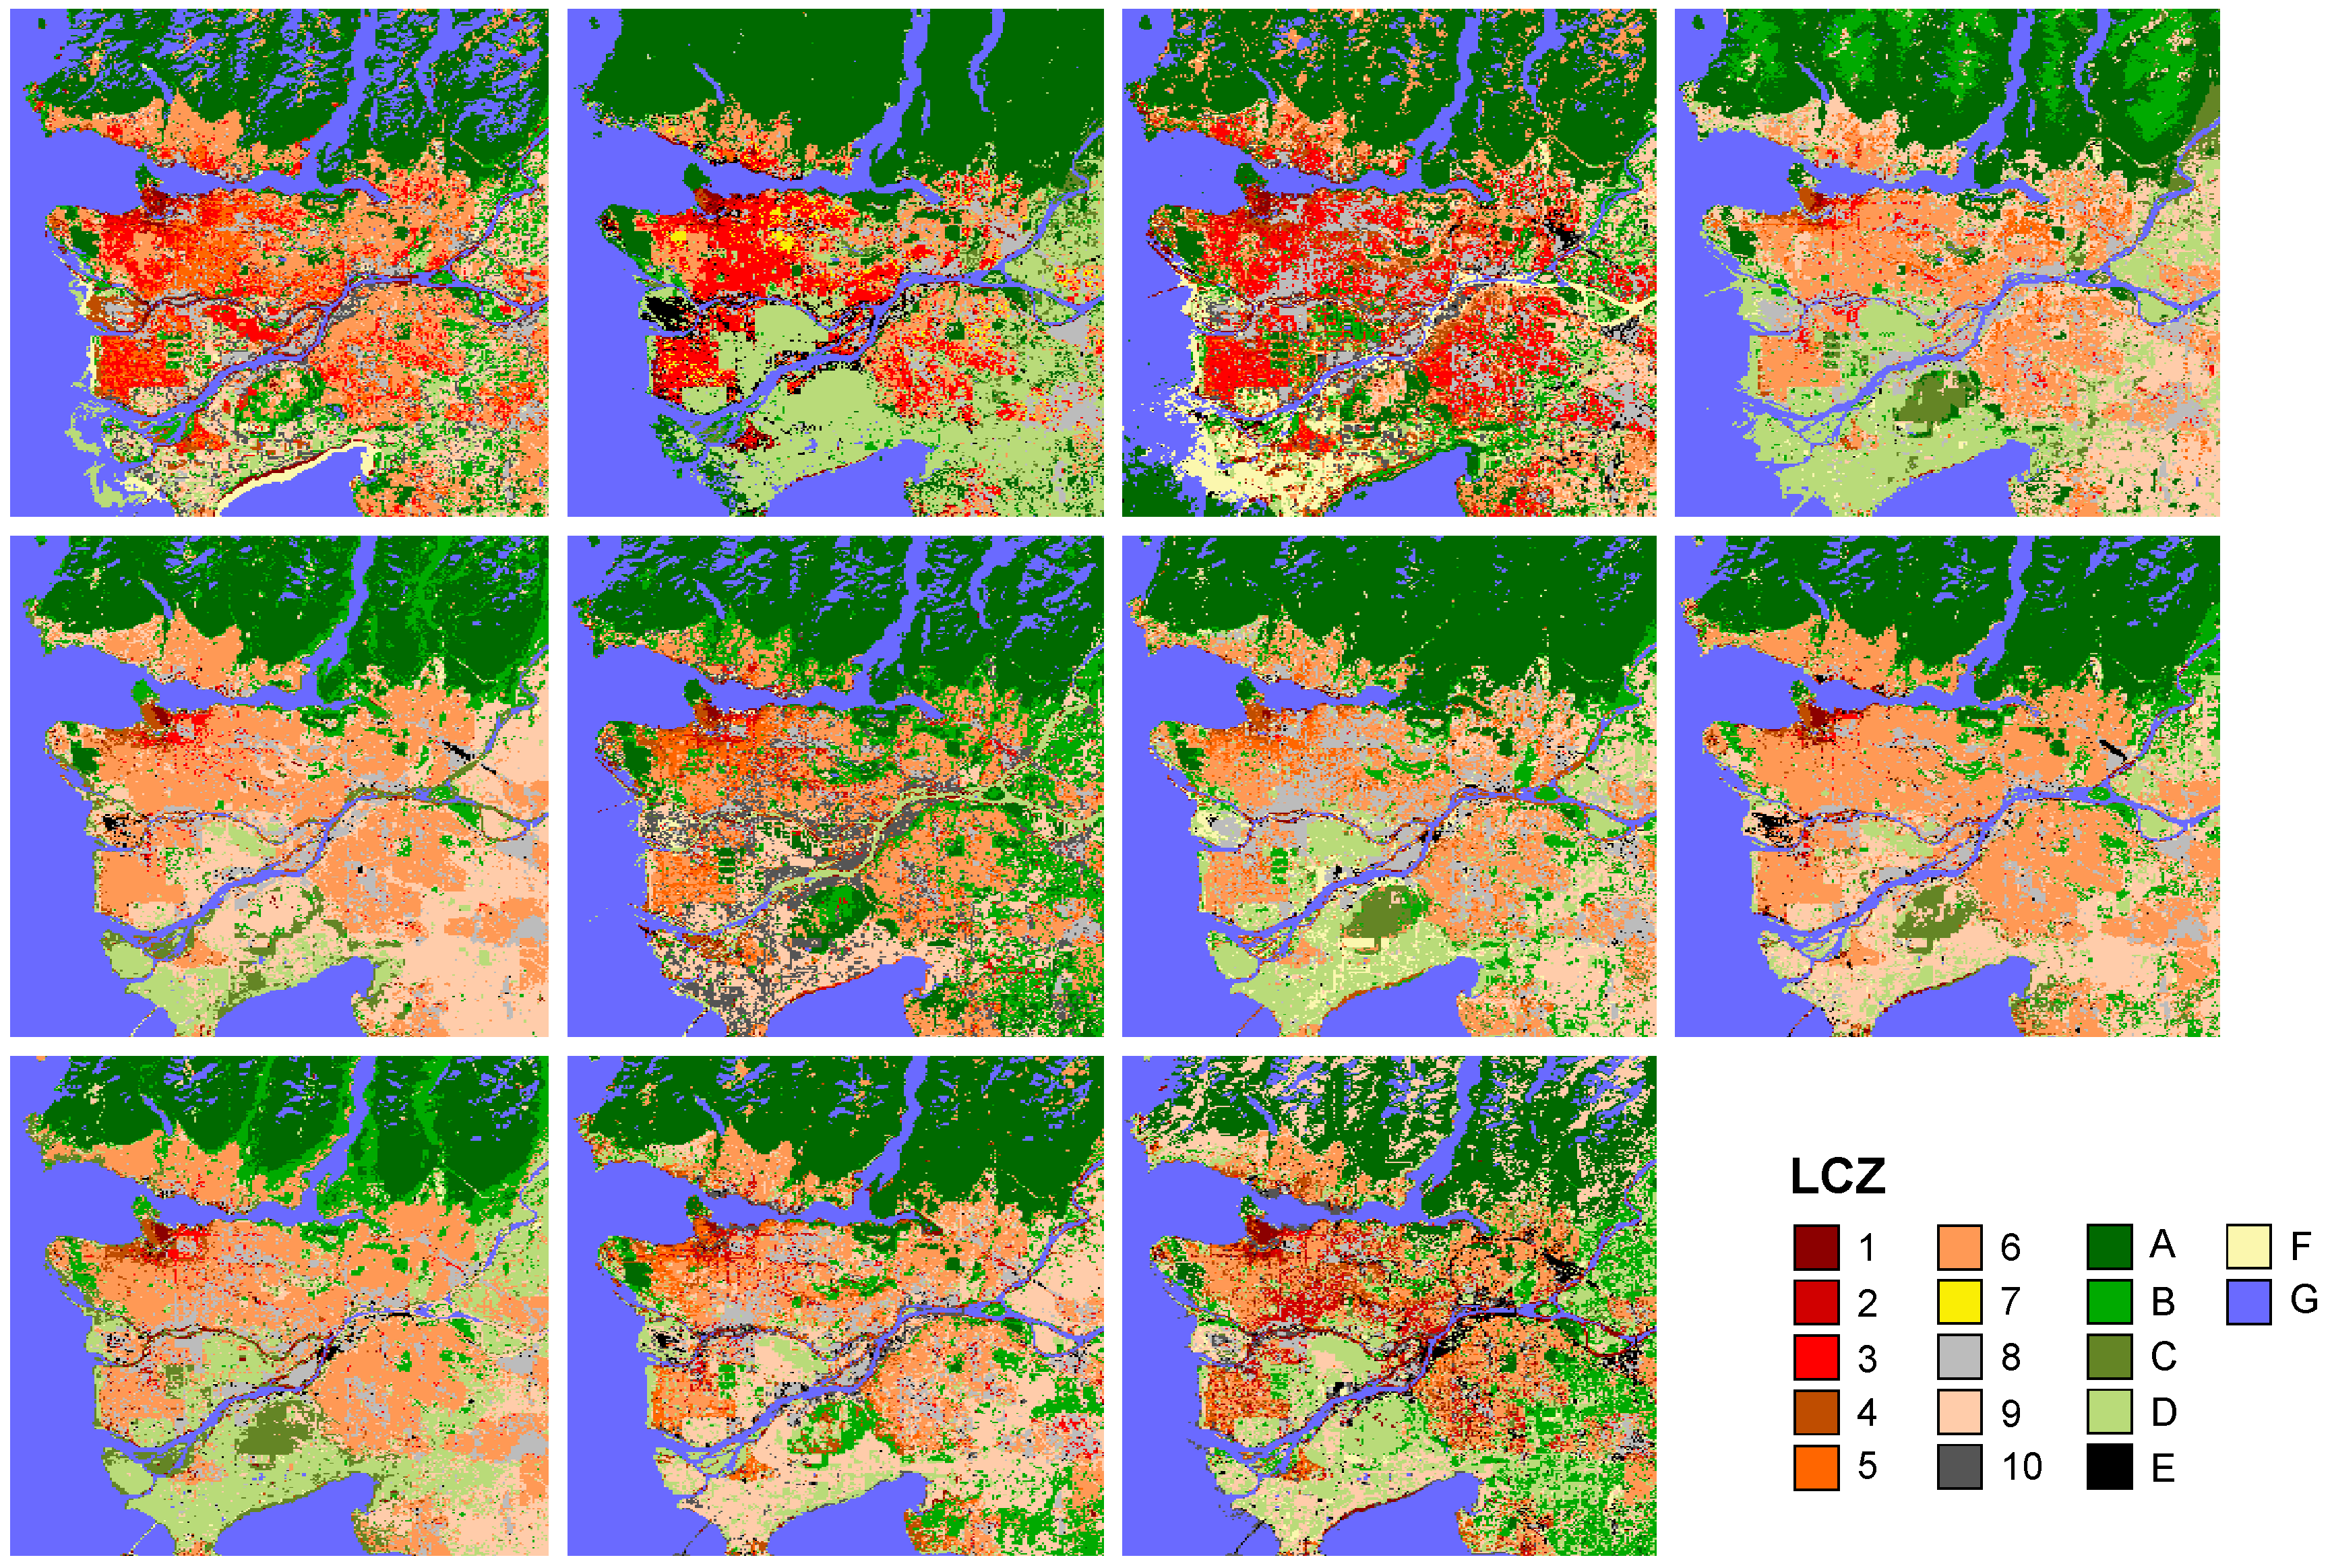
4.1. Variation in Classification Results

The LCZ classifications showed considerable variation when compared with each other. This is the case for all cities included in HUMINEX. Figure 4 and Figure 5 show the classification results from the final iteration of each participant for Berlin and Vancouver, respectively, highlighting differences between LCZs and their size and extent. Overall, the differentiation between urban and natural areas for one city was similar. Yet, some classification results differed considerably from the rest (e.g., for Berlin, the map in the second row, second column of Figure 4). Moreover, the differentiation between water (LCZ G) and land surfaces was generally good, especially for coastal cities (e.g., Vancouver, Figure 5) or cities with an abundance of water surfaces. However, some deviations from this general pattern exist, e.g., the first classification result for Vancouver (Figure 5).
The modal LCZ type of all classifications for Athens, Greece, is shown in Figure 6a, along with the corresponding consistency map (Figure 6b). As stated above, consistency is defined here as the fraction of all maps that match the modal class for that pixel. The highest agreement amongst the LCZ maps for Athens can be found for water surfaces (LCZ G), dense trees (LCZ A), and central areas of the city (LCZ 2) (Figure 6). For the other types, no clear pattern exists.
Figure 7 shows, as an example, the distribution of consistency amongst different operators for urban and natural LCZ types for each city (Figure 7a) and for each LCZ type in Vancouver (Figure 7b). For the majority of the considered cities, the median consistency for natural types was higher than for urban types; while for Antwerp and Phoenix, the median consistency values were the same (Figure 7a). Since the possible values are discrete according to the number of maps per city and the median is always one of these values, the mean consistency was also evaluated (not shown in Figure 7). The mean urban consistencies varied between 0.45 for Phoenix and 0.69 for Brussels. With the exception of Antwerp, the mean consistency was higher for natural types than for urban, with the largest differences found in Vancouver (mean consistencies of 0.78 for the natural types (LCZs A to G) and 0.59 for the urban types (LCZs 1 to 10) and Berlin (0.73 and 0.52, respectively). Figure 7b illustrates the reason behind this finding: for Vancouver, the most prominent natural LCZ types are LCZ A (23% of pixels) and LCZ G (24% of pixels). The estimated consistency for these two LCZ types was high (average values of 0.82 and 0.92, respectively), while for the urban types the mean consistency ranged between 0.39 (LCZ 10, 1% of pixels) and 0.62 (LCZ 6, 17% of pixels). The natural types with lower average consistency were only present in a small number of pixels (with the exception of LCZ D; 0.50, 8% of pixels). This implies that the dominant natural types (LCZs A to G) showed high consistency amongst different operators. However, high consistency does not necessarily mean that the modal LCZ is correct. For this reason, a comparison with reference data, which is presented in the next section, was also performed.

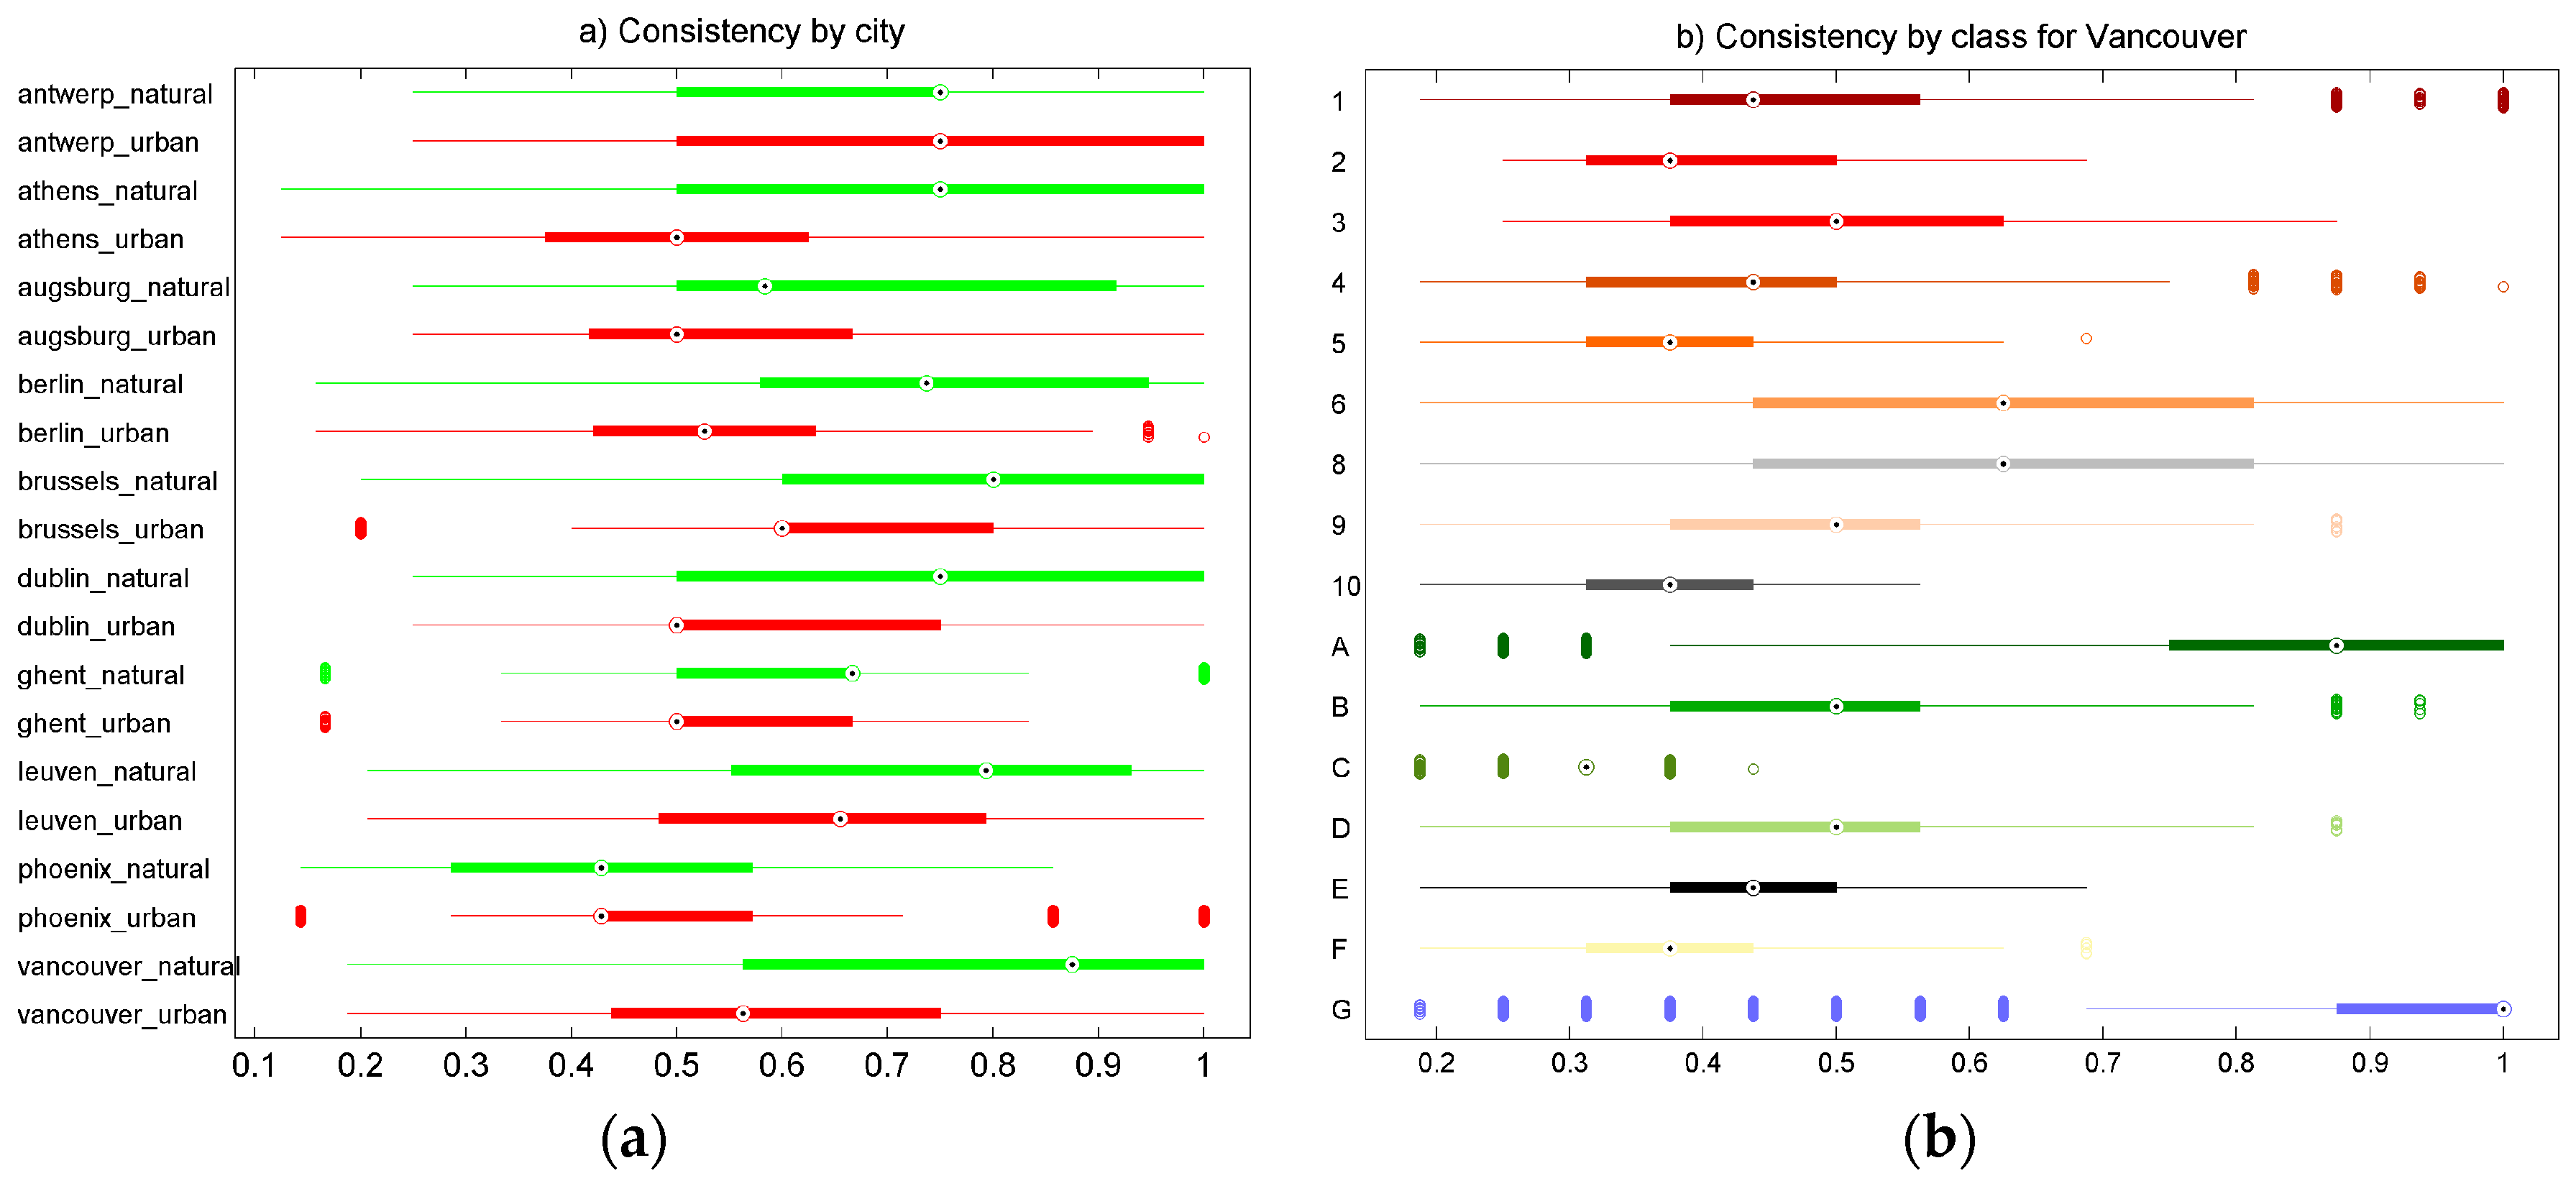
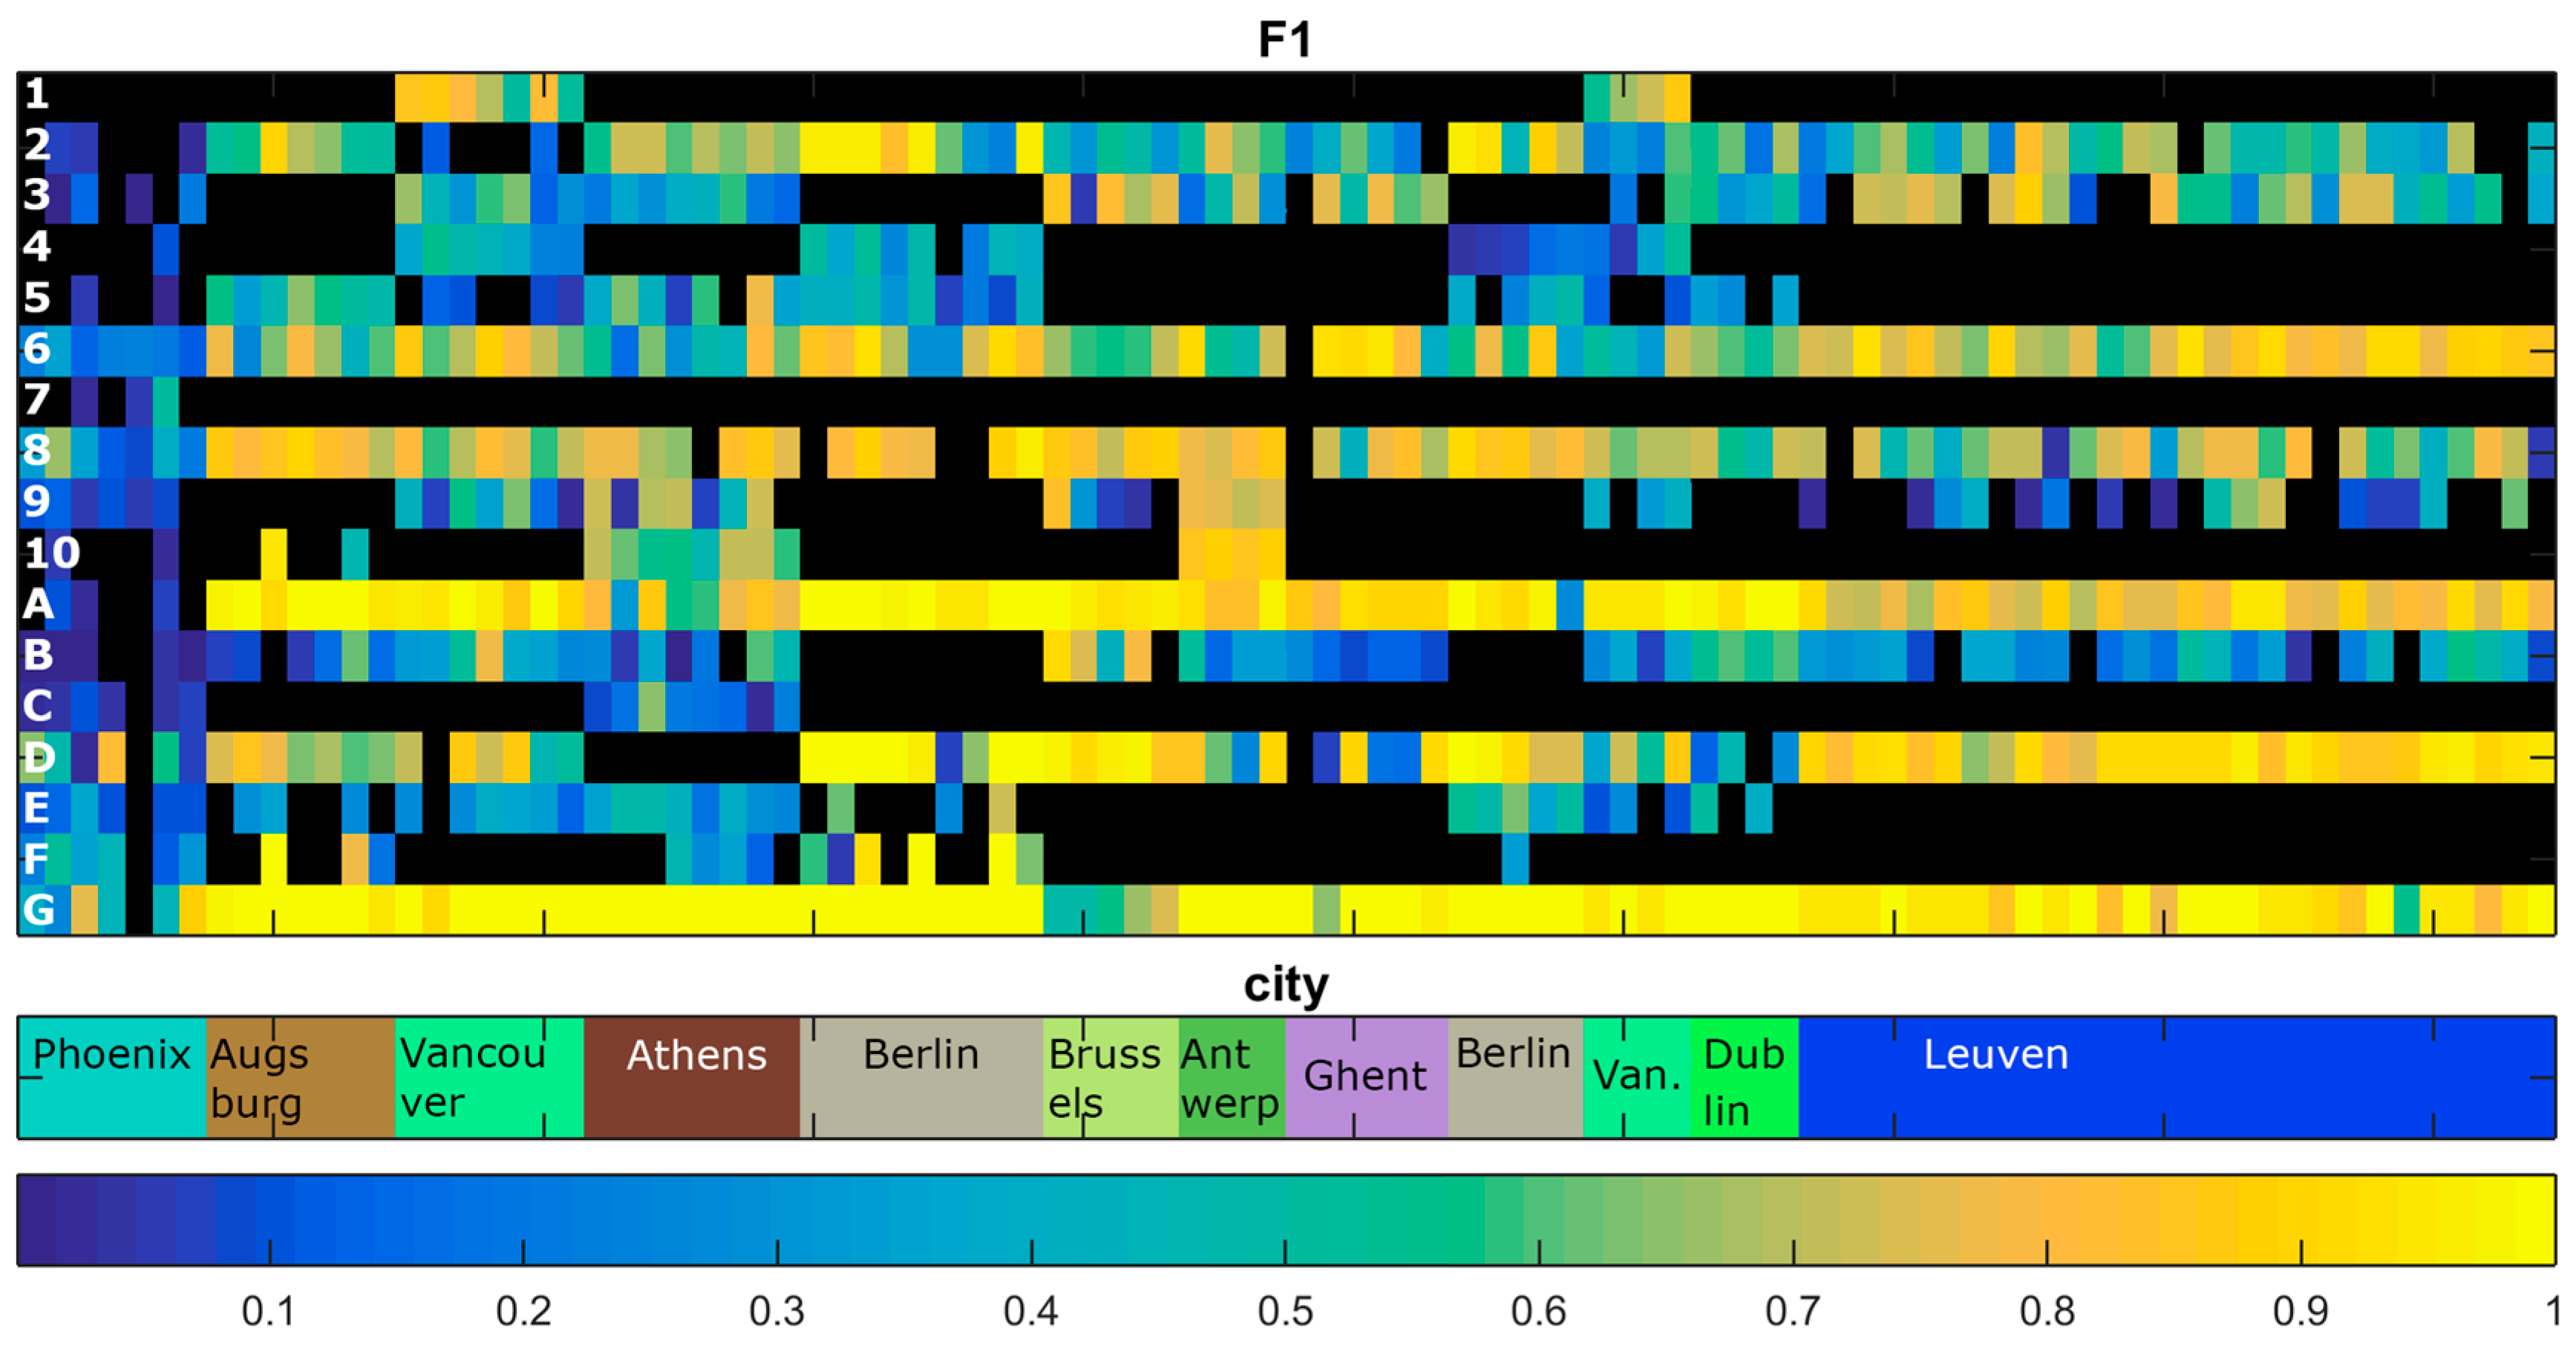
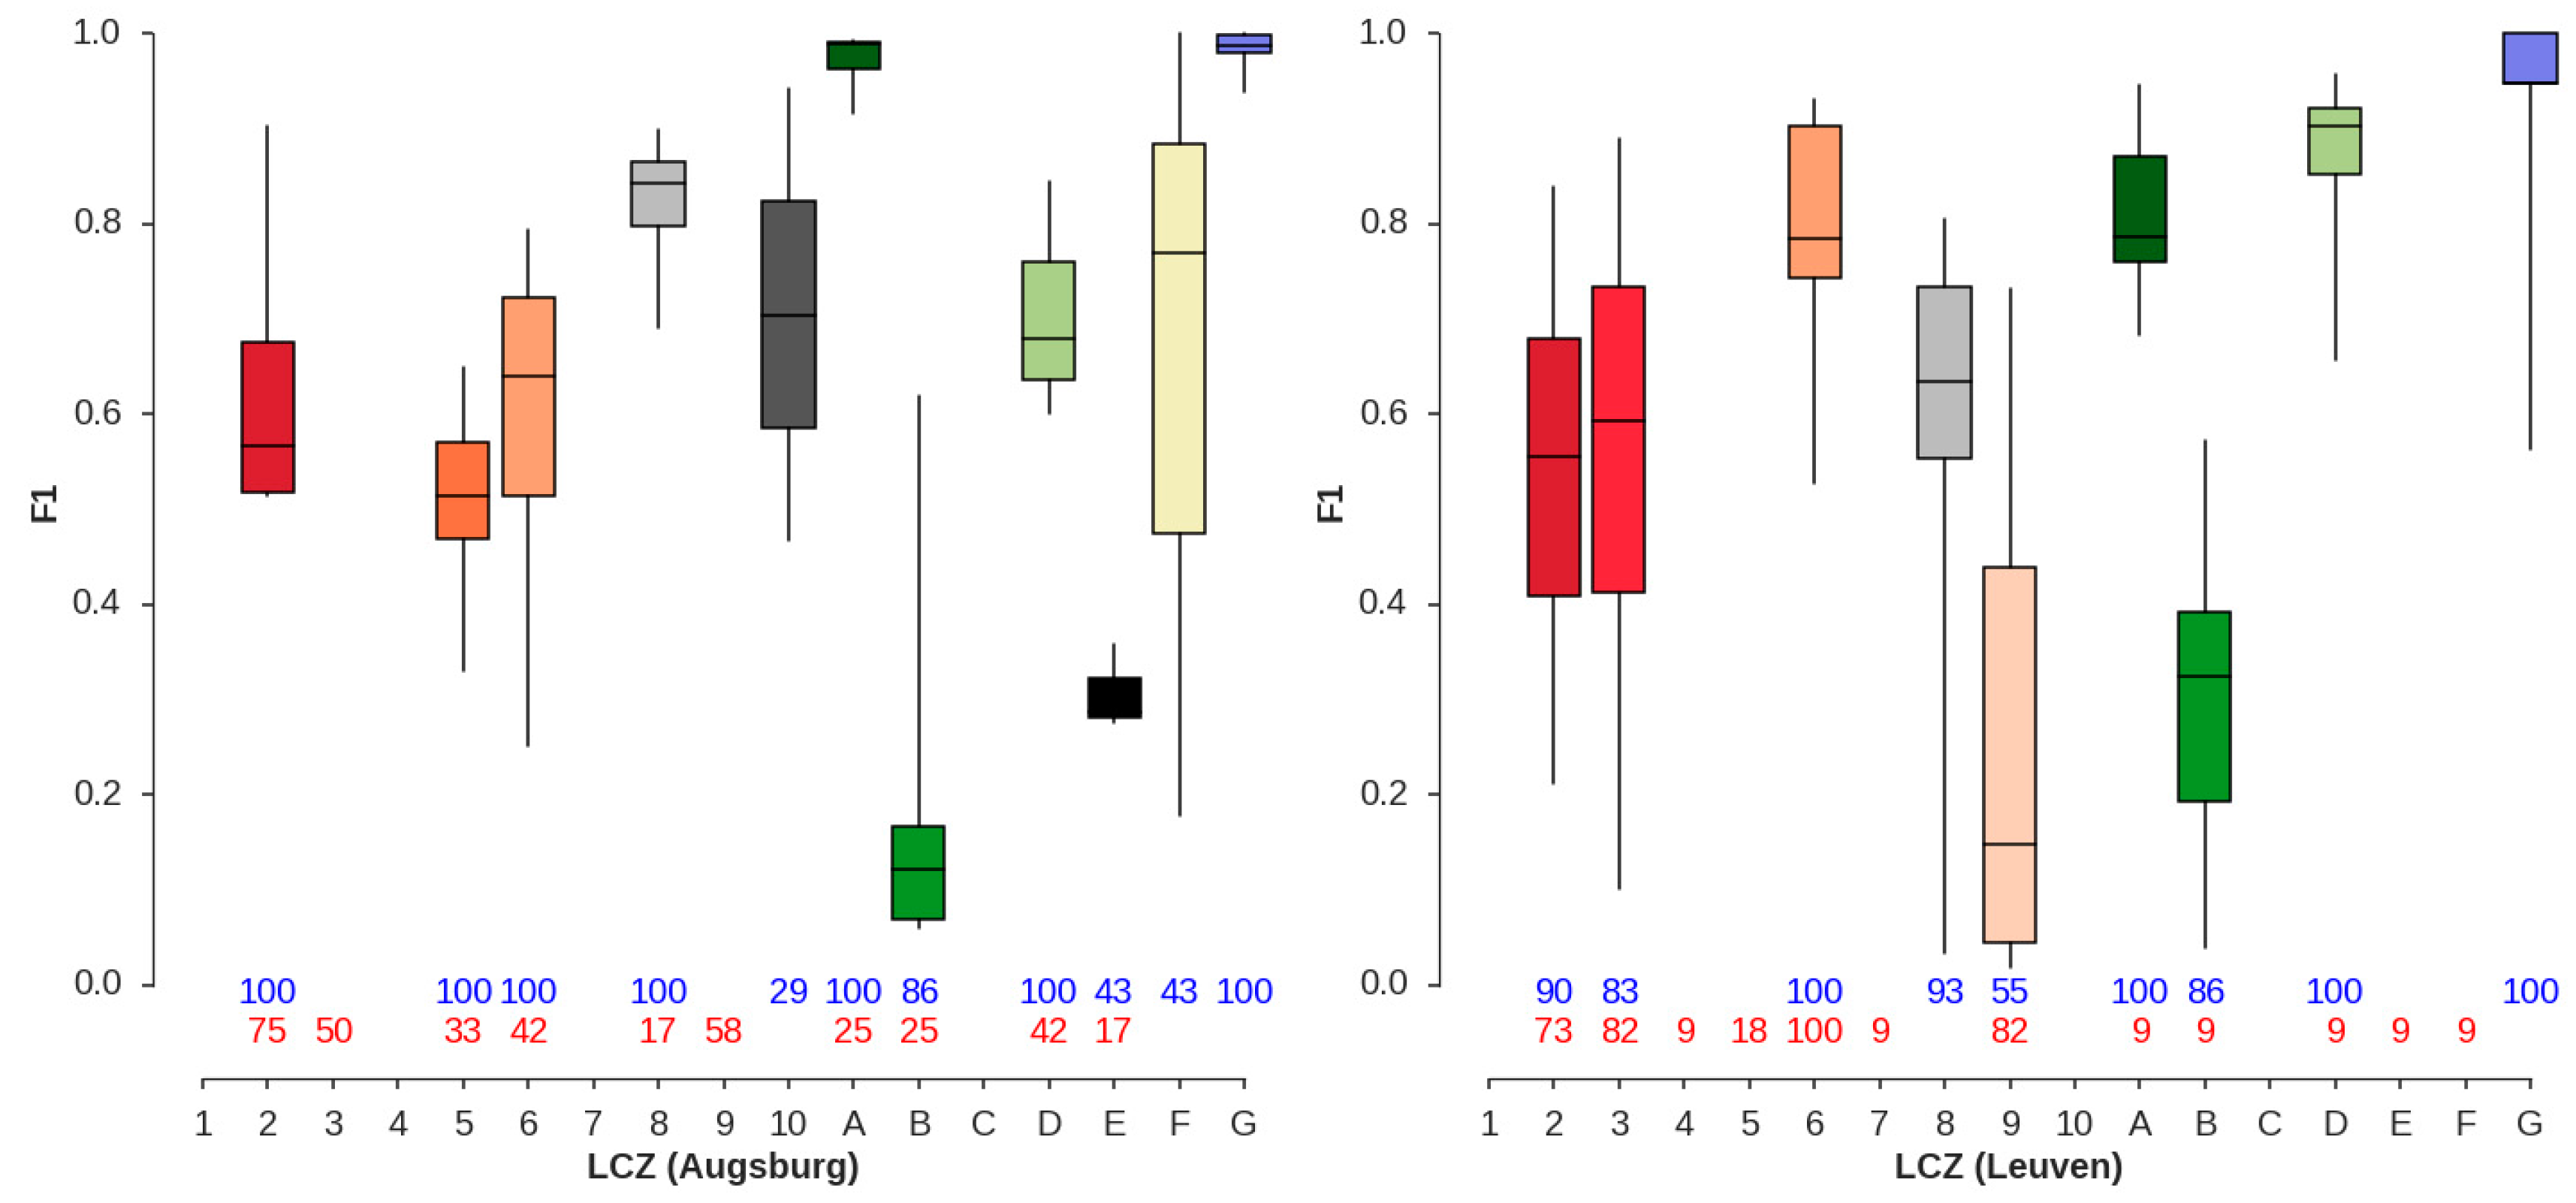
4.2. LCZ Type Specific Accuracies
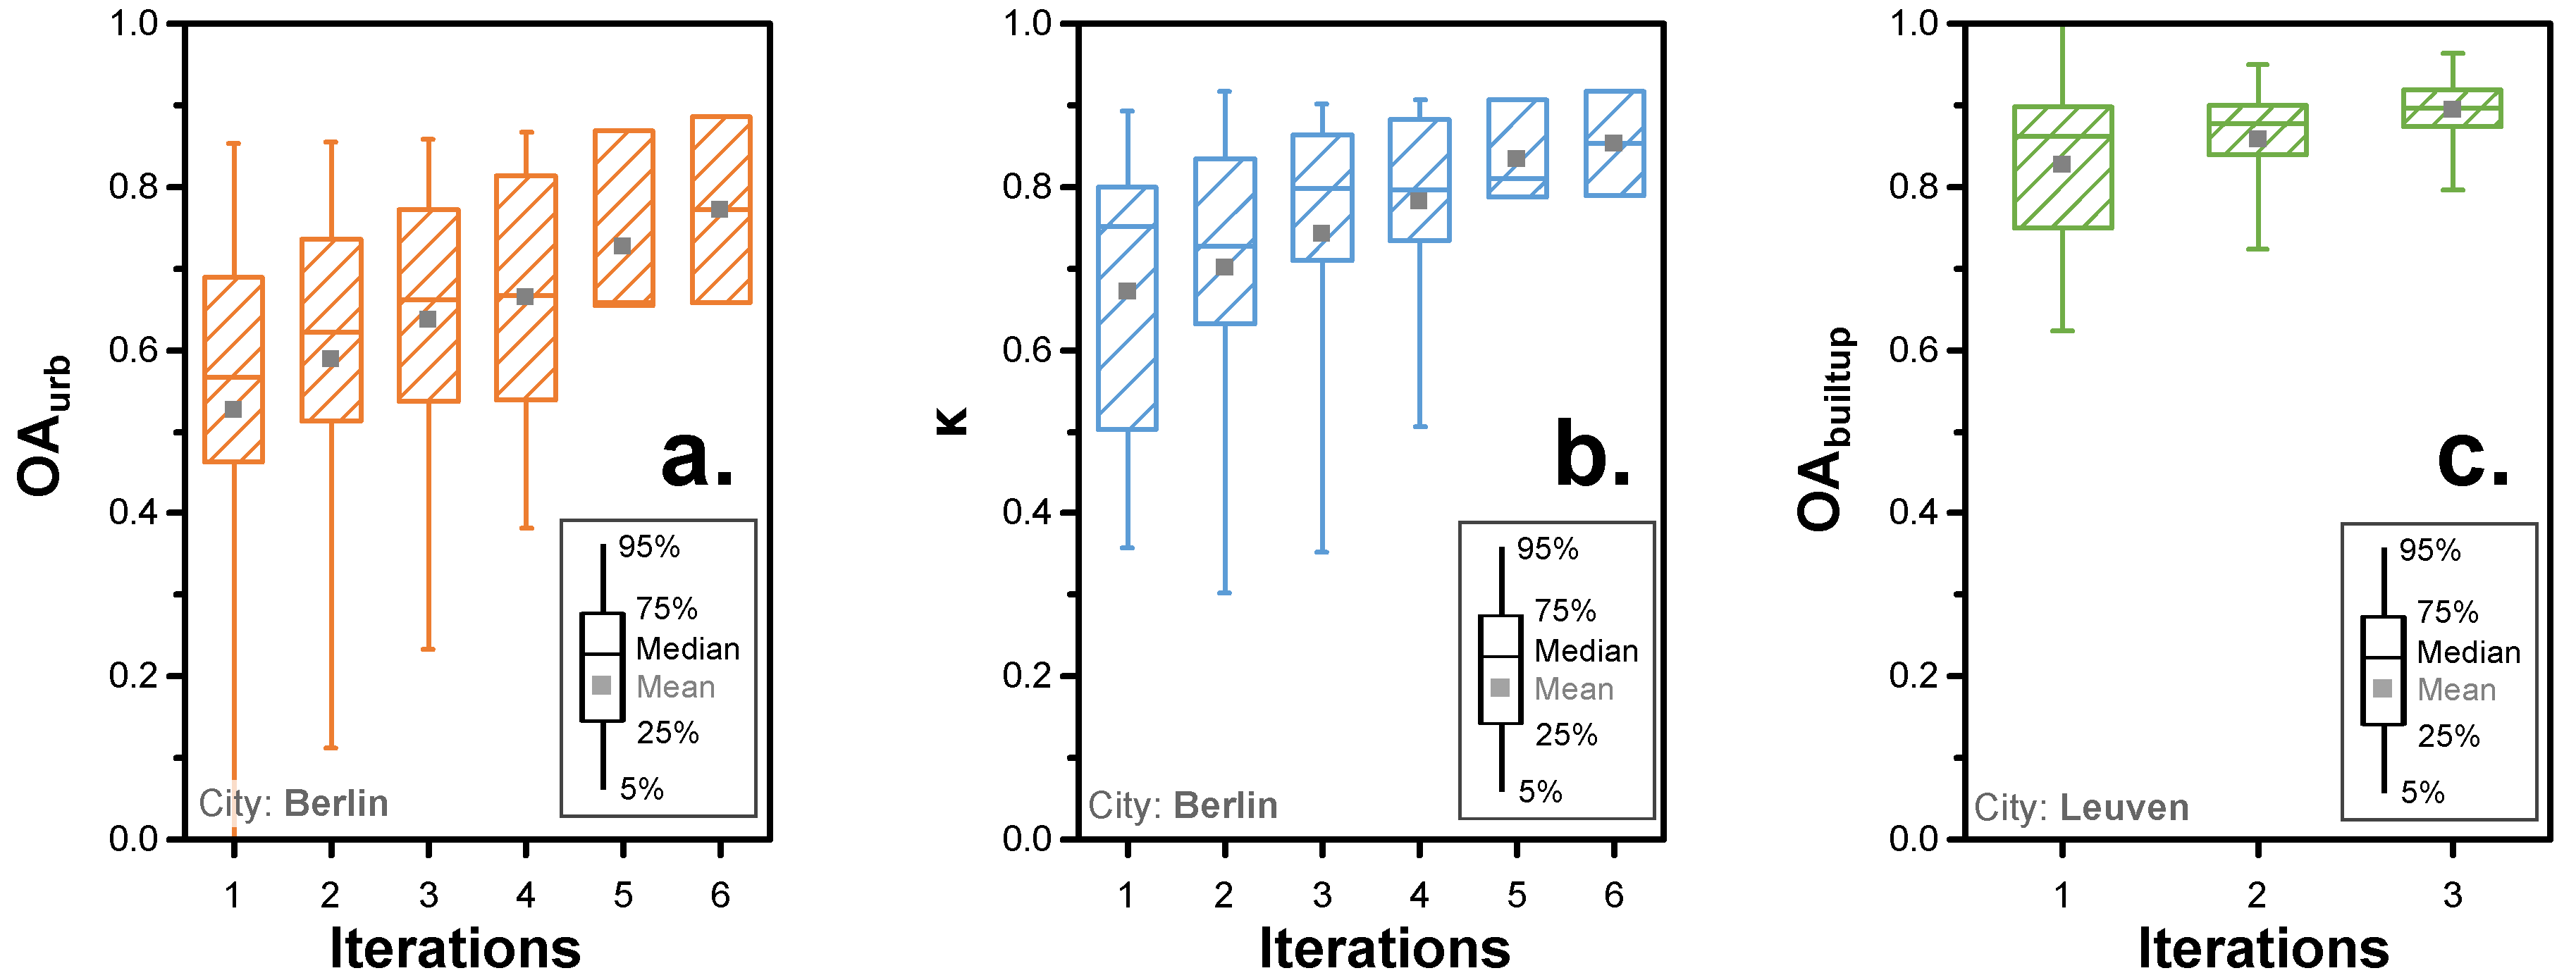
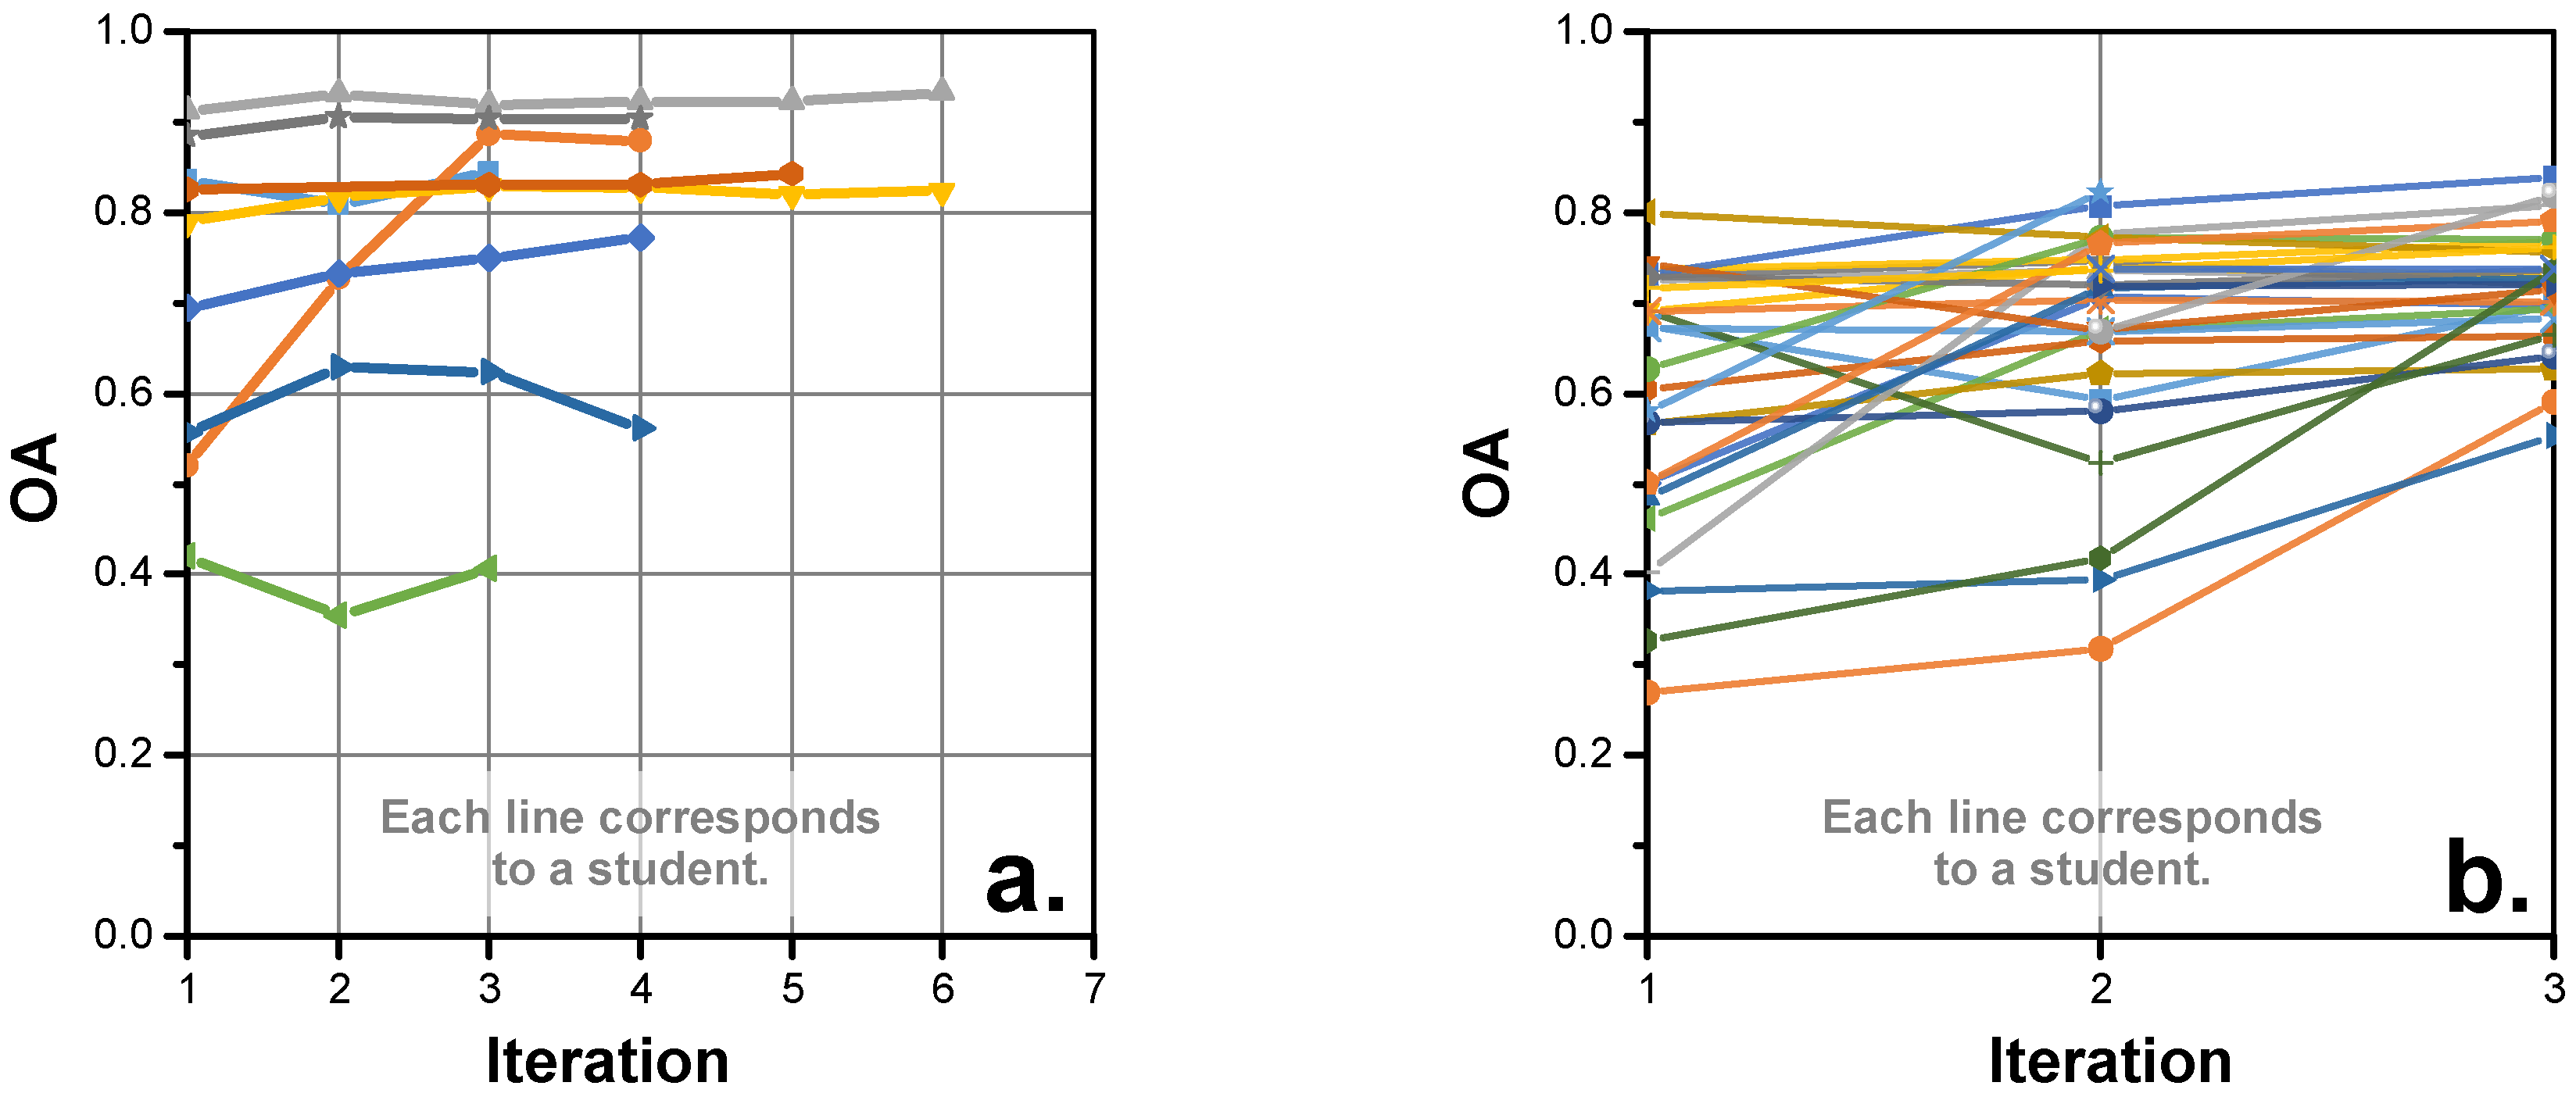
The type-specific accuracies for all operators are shown in Figure 8, which plots F1 scores by LCZ type. LCZs A (dense trees), D (low plants), and G (water) were recognized consistently by all operators (high F1 scores). Of the urban types, LCZs 2 (compact midrise), 6 (open low-rise), and 8 (large low-rise) performed well, while LCZ 4 and 5 (open high- and midrise) did not. LCZs 1 (compact high-rise) and 7 (lightweight low-rise) were not present in most cities under study. In addition, there were differences between cities (vertical lines in Figure 8).
Figure 9 provides a more detailed illustration of the F1 accuracy score for Augsburg, Germany and Leuven, Belgium. Similar to Figure 8, some LCZ types were accurately classified (F1 close to 1) in both cities, while others were not. As expected, for both cities, LCZ G was digitized accurately by all operators and none reported in the questionnaire that this LCZ type was difficult to identify (cf. Table 1). For LCZ A, again most operators identified this category accurately, but some found it hard to distinguish (25% and 9% for Augsburg and Leuven, respectively). Lowest F1 accuracies were found for LCZs 9 (sparsely built) and B (scattered trees). For Augsburg, 86% of the operators identified LCZ B, although 25% stated that it was difficult to identify. This is reflected in a low median F1 accuracy of approximately 0.1. For Leuven, the same percentage of operators identified this LCZ but only 9% considered it difficult to identify; here, the overall median accuracy was slightly better (0.35). LCZ 9 in Leuven was mapped by 55% of the operators although 82% considered this category as difficult to identify. The accuracy of this LCZ was variable, between 0 and 0.75. For most of the other classes it was difficult to find a direct relation between the F1 accuracy scores for LCZ categories and the self-assessed level of difficulty in identifying that category. For example, LCZ 6 in Leuven was mapped by all of the operators with relatively high accuracies, despite the fact that all operators indicated that LCZ 6 was difficult to identify. By comparison, LCZ 2 in Augsburg had accuracies between 0.5 and 0.9, yet 75% of the operators found this class difficult to distinguish. Note that these inconclusive results may partly originate from the fact that some of the operators have provided their answers to the questionnaire retrospectively.

4.3. Iterations

Figure 10 presents the OAurb and κ for Berlin, and OAbuiltup for Leuven by iteration, whilst Figure 11 shows the increase in OA as a function of the iteration round for different operators. The different accuracy indicators clearly improved with the number of iterations. Figure 10a reveals that the mean OAurb increased from iteration 1 to iteration 4 by more than 10% (from 0.53 to 0.67), while Figure 10b shows that the mean κ increased from 0.67 for iteration 1 to 0.74 for iteration 4 (an increase of 7%). This trend is also visible in Figure 10c, where the mean OAbuiltup for Leuven increased by 6% after three iterations (from 0.83 for iteration 1 to 0.89 for iteration 3). As the iteration process progresses, the classification accuracy achieved by the different operators also converged to a higher accuracy value. This is depicted in Figure 10, where the box size (25th–75th percentiles) and the whisker length (5th–95th percentiles) decrease with number of iterations, and also in Figure 11b, where the OA, which shows considerable variability at iteration 1, converges at approximately 0.7 for iteration 3. In addition to the relationships between accuracy and iteration, classification time and classification accuracy self-rating were also reported in the metadata and thus also investigated, but no meaningful correlations were found.

4.4. Multiple Training Sets

The final experiment tested if additional training data improve the classification. Therefore, the accuracy measures were compared across the different cities (Table 3) using:
(1)
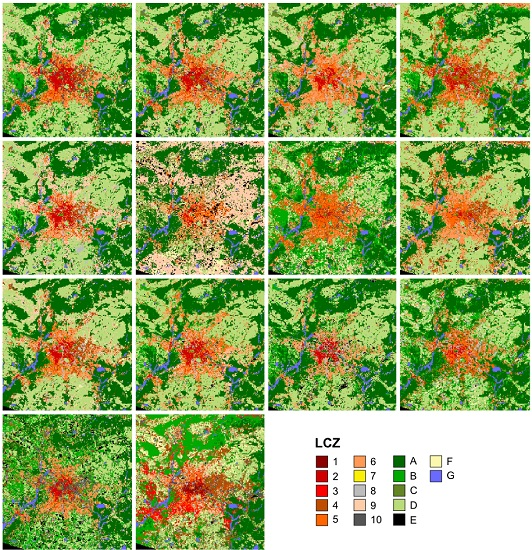
the mean accuracies achieved across individual runs, i.e., the LCZ maps created with one TA set as shown in Figure 12a for Leuven (=µ of individual runs);
(2)
the best accuracies achieved across the individual runs, which requires prior knowledge and therefore cannot be done without reference data (=best run);
(3)
the accuracies achieved when selecting the most frequently chosen category across the individual maps (=modal LCZ); and
(4)
the accuracies achieved when combining all TAs into a single LCZ classification per city.
Figure 12b shows all the TAs digitized by the operators for Leuven, which are then used to create a single LCZ map for the city (=all in). This example implements the idea of the wisdom of the crowd [54] or verification of Linus’ Law [55], and examines whether the combined efforts might yield a better LCZ map than individual ones.
The accuracy of the modal LCZ maps (3. in Table 3) was better than the average accuracy of the maps from the individual TA sets (1) for all measures and cities except for OAbuilt-up for Dublin and Ghent. The classification results using multiple TA sets (4) were always better than the average of the individual runs (1), and for 82% of the cities and measures, the accuracy was even higher than for the best individual TA set (2). The average increase over the ten cities in OA (OAurb) was 0.102 (0.151) for the modal category (3), and 0.145 (0.184) for the multiple TA classification (4) compared to the mean of the individual runs (1). Compared to the best individual run for the multiple TA classification (2), the average (urban) OA still increased by 0.042 (0.010). Figure 13 shows the distribution of the improvements for the modal classification (3) and the classification using multiple TAs compared (4) with the average accuracies of the individual maps (1). It can be seen that OA, κ, and OAurb benefited, in particular, from the additional training data.
Figure 14 shows the dependency of the accuracy improvement in the five standard measures on the number N of available TA sets. There was a strong positive correlation found between the improvement and N. Less improvement was seen in the OAbuiltup and the WA, since both are already quite high for the individual classifications. This increase was not linear but rather showed a strong increase in the beginning and saturation at about ten to fifteen TA sets for most accuracy measures. This seems to be a strategy to improve the accuracy of WUDAPT LCZ maps, but the effect of bad quality TAs and the need for filtering processes in such a setup need to be investigated in more detail.

5. Discussion

HUMINEX showed that there are large differences between different LCZ maps generated for a single city. The consistency and accuracy measures indicated that the quality of single TA sets and the resulting LCZ maps was, in most cases, poor to moderate. Furthermore, there were differences found between the cities, which can partly be explained by small differences in the experimental setup. In particular, the Phoenix classifications performed substantially worse than the other cities. This could be explained by the structure of the exercise on this city, which allocated operators to different areas in the Phoenix metropolitan area; the TAs were supposed to be combined into a city-wide TA set subsequently, but nevertheless were evaluated separately here. Therefore, the individual TA sets did not include all LCZs (for example, high-rise (LCZs 1 and 4) was only found in Phoenix Downtown, but nowhere else) and did not represent the variation within the scene. Yet, even by combining all the TAs, the overall accuracy was not greatly improved for this city, mainly because iterations were not performed until the accuracy converged to a stable value.
For many TA sets, the number of iterations was low and iterations were not performed until classification results converged to acceptable results due to the schedules of the different courses. While these problems could clearly be identified in the accuracy assessment, there are other factors such as the number and type of classes present, domain size, and frequency distribution in reference data, which hamper an inter-city comparison. For instance, coastal cities typically achieve higher OA, since the LCZ type G (water) is comparably easy to detect. This underlines the added value of the new accuracy measures based on the urban types, built-up and WA for different purposes. However, it remains a shortcoming of a non-stratified sampling approach that the accuracy measures may be biased towards some categories, which was addressed by careful selection and checking of the reference data.
Generally, the results show that it is more difficult for largely untrained operators to identify TAs for LCZ classification than expected. While this influence of human interpretation is a general topic in remote sensing [46] and crowdsourcing [56], some aspects are specific to the LCZ typology. In particular, urban morphologies are a continuum and the real existing forms are more diverse than the idealized types (e.g., mixture of different height and densities), which implies a certain fuzziness of the system. Moreover, the size of homogenous areas greatly depends on the existing and past planning regulations and there is some evidence that in some cases (e.g., smaller towns, historic cores, and rapidly evolving cities), the typical patches might be smaller than the neighbourhood scale (≤1 km2). In addition, some LCZ categories cause specific problems. For example, LCZ 9 (sparsely built) is urban, but has a built fraction of less than 20%, which is difficult to define in the given spatial resolution, since at the local scale many pixels will contain no houses. LCZ E (bare rock or paved) can be either paved or natural stone, which makes little difference for the climatic impact but an enormous difference for settlement mapping. Moreover, operators often do not follow the recommendation for defining TAs regarding size, shape, and distance to other LCZs as specified in the instructions. In summary, it can be stated that: (1) operator knowledge is critical (hence the need for standardized training and assessment); and (2) independent controls (reference data or review by a trained expert) are necessary.
However, there is also good news for the validity of crowdsourced data on urban structure in the WUDAPT framework. First, the quality of the classifications clearly improved with the number of iterations, which indicates that good classifications can be achieved if sufficient time is invested, even though the general relation between time and accuracy over all datasets was unclear. The latter was also the case for most other parameters of the metadata and the few significant correlations found were partly contradictive or counter-intuitive and thus need further investigation before publication. In addition to the difficulties in inter-city comparisons discussed above, this can be related to the partly retrospective collection of metadata, since some courses had already started while the experiment was still in the design phase, resulting in a reduced quality of, and considerable gaps in, the metadata. This might also partly explain why there was generally little agreement between the quality of the classification and the self-assessment by the participants. Therefore, the experiment is currently being repeated with a more rigid setup and more standardized protocols in a second phase of HUMINEX.
Second, a striking and welcome finding was that considerable improvement of the LCZ maps could be achieved by combining multiple training datasets. Despite the variable accuracy of individual LCZ maps, the aggregation of all TA sets showed improved accuracy, which is evidence for the ‘wisdom of the crowd’. Moreover, the dependency of the accuracy on the number of available TA sets showed a strong increase in the beginning, with saturation afterwards, indicating that TA sets from about ten to fifteen individuals could result in a good quality LCZ map. This is similar to the finding by Haklay et al. [55] in the context of the positional accuracy of road features in OpenStreetMap as a function of the number of volunteers, who found that the first five volunteers make the largest contributions to improving the positional accuracy. Thus, one future strategy for WUDAPT will be to focus on the collection of a minimum of ten sets of TAs per city.

6. Conclusions

In this paper, we have presented the results of HUMINEX, an experiment to assess the influence of individual operators in classifying urban areas into LCZs according to the WUDAPT protocol. Six universities contributed to the experiment with a total of 94 sets of training data from 119 operators for ten different cities. Despite some limitations in the experimental setup, we were able to collect consistent results across the institutions. Specifically, we found that some LCZs could be identified in the landscape without difficulty (e.g., LCZs A or G), while other categories posed problems resulting in lower consistencies and accuracies. This was independent of the geographic location of the city or climatic region. In most cases, these LCZ categories were also reported as ‘hard to classify’ (=identify) by the participants, indicating that this question might be relevant for evaluation of single LCZ classifications. In addition, we found that with an increasing number of iterations in the LCZ classification process, the accuracy of the classification improved, indicating that the existing WUDAPT protocol is a valid approach for LCZ mapping, but that at least four iterations should be carried out. Finally, it was shown that classifications using the mode of all available classifications or using multiple training data sets for one classification had higher accuracies than the mean accuracy of individual classifications of a city, and often even higher than the best one. This was especially true for the urban LCZ types. From these results, we conclude that at least ten individual TA sets should be used for one city to produce a LCZ map of good quality, although this aspect needs further investigation.
Hence, HUMINEX is currently being continued in a second phase with a more systematic approach. This includes a standardized introduction to the topic as part of the student courses within participating institutions and a focus on a single city. This could help to address further questions, such as: Can the quality of LCZ TAs be assessed from the TA themselves? Can the quality of LCZ TAs be assessed from operator self-assessment? Does the personality of the operator influence the classification quality? Is local knowledge a key factor for an accurate LCZ classification?
It goes without saying that education and the motivation of the operators are indispensable for achieving good results. Thus, improved course materials and a ‘driving test’ for LCZ knowledge to help become familiar with the LCZ scheme and to better recognize LCZ classes from aerial imagery are currently being developed.

Acknowledgments

Most of all we thank the participating students, namely: Alex Apostolakis, Lien Arnalsteen, Julia Bartsch, Jeany Behrens, Gunnar Berghman, Anjes Bloch, Kasper Bonte, Willem Boone, Eirini Bouskou, Adamantia Boutsi, Fran Broekmans, Gauthier Buyse, Gauthier Buyse, Thomas Chavakis, Tina Christmann, Marnick Clé, Ilias Daradimos, Vasiliki Daskalopoulou, Karel De Bauw, Fien De Doncker, Anton Deboeck, Koen Devos, Sinah Drenske, Athanasios Drivas, Ann Elen, Vera Gebhardt, Ioannis Gerardis, David Haaf, Nora Herbosch, Tony Huang, Cuinera Isenborghs, Hannah Jacobs, Nick Kalogeras, Ioannis Karavasilis, David Köhler, Michael Kottas, Carolina Krynda, Carina Lemke, Annelies Loos, Annelies Loos, Amber Mertens, Dorien Mollen, Katharina Patricia, Ellen Philips, Siebe Puynen, Siebe Puynen, Maria Reisert, Lukas Röder, Spyridon Savvas, Stefanie Schepers, Vasileios Sitokonstantinou, Laurence Stalmans, Sara Stoffels, Helena Tavernier, Helena Tavernier, Rhune Van Cleemput, Jonas Van den Brande, Korneel van Dooren, Wouter Van Roeyen, Roxanne Vanhaeren, Kasper VanRoey, Vyron Vasileiadis, Vincet Verswijvel, Marlies Vervoort, Axelle Vincent, Jef Vinken, Odysseas Vlachopoulos, Pieter-Jan Vroom, Simon Weber, Maximilian Wirth, Nele Wuyts as well as those who were forgotten or did not deliver the metadata. We would also like to thank Iain Stewart for support with the LCZ metric and all data providers, i.e., NASA and USGS. This work was partly supported by the Cluster of Excellence ‘CliSAP’ (EXC177), University of Hamburg, funded through the German Science Foundation (DFG) and the EU FP7 funded ERC grant Crowdland (No. 617754).

Author Contributions

Benjamin Bechtel, Daniel Fenner, Oscar Brousse and Matthias Demuzere first conceived of the idea for running the HUMINEX. Oscar Brousse, Panagiotis Sismanidis, Iphigenia Keramitsoglou, Daniel Fenner, Marco Otto, Marie-Leen Verdonck, Matthias Demuzere, Ariane Middel and Christoph Beck ran the HUMINEX experiment with their students. Benjamin Bechtel mostly analysed the data, supported by Matthias Demuzere and Panagiotis Sismanidis in particular. All of the authors contributed to the writing of the paper.

Conflicts of Interest

The authors declare no conflict of interest.

Appendix A

Figure A1. LCZ metrics: similarity used for the weighted accuracy (WA).
Urbansci 01 00015 g015

References

  1. Makse, H.A.; Havlin, S.; Stanley, H.E. Modelling urban growth patterns. Nature 1995, 377, 608–612. [Google Scholar] [CrossRef]
  2. Batty, M. Cities and Complexity: Understanding Cities with Cellular Automata, Agent-Based Models, and Fractals; MIT Press: Cambridge, MA, USA, 2005. [Google Scholar]
  3. Schneider, A.; Woodcock, C.E. Compact, dispersed, fragmented, extensive? A comparison of urban growth in twenty-five global cities using remotely sensed data, pattern metrics and census information. Urban Stud. 2008, 45, 659–692. [Google Scholar] [CrossRef]
  4. Jha, A.K.; Miner, T.W.; Stanton-Geddes, Z. Building Urban Resilience: Principles, Tools, and Practice; World Bank Publications: Washington, DC, USA, 2013. [Google Scholar]
  5. Satterthwaite, D.; Dodman, D. Towards resilience and transformation for cities within a finite planet. Environ. Urban. 2013, 25, 291–298. [Google Scholar] [CrossRef]
  6. Meerow, S.; Newell, J.P.; Stults, M. Defining urban resilience: A review. Landsc. Urban Plan. 2016, 147, 38–49. [Google Scholar] [CrossRef]
  7. Batty, M. The New Science of Cities; MIT Press: Cambridge, MA, USA, 2013. [Google Scholar]
  8. Kitchin, R. The real-time city? Big data and smart urbanism. GeoJournal 2014, 79, 1–14. [Google Scholar] [CrossRef]
  9. White, L.; Burger, K.; Yearworth, M. Smart Cities: Big Data and Behavioral Operational Research. In Behavioral Operational Research; Kunc, M., Malpass, J., White, L., Eds.; Palgrave Macmillan: London, UK, 2016; pp. 303–318. [Google Scholar]
  10. Esch, T.; Marconcini, M.; Felbier, A.; Roth, A.; Heldens, W.; Huber, M.; Schwinger, M.; Taubenbock, H.; Muller, A.; Dech, S. Urban footprint processor—Fully automated processing chain generating settlement masks from global data of the TanDEM-X mission. IEEE Geosci. Remote Sens. Lett. 2013, 10, 1617–1621. [Google Scholar] [CrossRef]
  11. Pesaresi, M.; Ferri, S.; Ehrlich, D.; Florczyk, A.J.; Freire, S.; Halkia, M.; Julena, A.; Kemper, T.; Soille, P.; Syrris, V. Operating Procedure for the Production of the Global Human Settlement Layer from Landsat Data of the Epochs 1975, 1990, 2000, and 2014; JRC Technical Report; Publications Office of the European Union: Luxembourg, 2016; Volume EUR 27741 EN. [Google Scholar]
  12. Bechtel, B.; Pesaresi, M.; See, L.; Mills, G.; Ching, J.; Alexander, P.J.; Feddema, J.J.; Florczyk, A.J.; Stewart, I. Towards consistent mapping of urban structures—Global human settlement layer and local climate zones. ISPRS Int. Arch. Photogramm. Remote Sens. Spat. Inform. Sci. 2016, XLI-B8, 1371–1378. [Google Scholar] [CrossRef]
  13. Mills, G.; Ching, J.; See, L.; Bechtel, B.; Feddema, J.; Masson, V.; Stewart, I.; Neophytou, M.; O’Connor, M.; Chen, F.; et al. Introduction to the WUDAPT project. In Proceedings of the 9th International Conference on Urban Climate, Toulouse, France, 20–24 July 2015. [Google Scholar]
  14. Stewart, I.D.; Oke, T.R. Local Climate Zones for Urban Temperature Studies. Bull. Am. Meteorol. Soc. 2012, 93, 1879–1900. [Google Scholar] [CrossRef]
  15. Stewart, I.D.; Oke, T.R.; Krayenhoff, E.S. Evaluation of the “local climate zone” scheme using temperature observations and model simulations. Int. J. Climatol. 2014, 34, 1062–1080. [Google Scholar] [CrossRef]
  16. Alexander, P.J.; Mills, G. Local climate classification and Dublin’s urban heat island. Atmosphere 2014, 5, 755–774. [Google Scholar] [CrossRef]
  17. Lehnert, M.; Geletič, J.; Husák, J.; Vysoudil, M. Urban field classification by “local climate zones” in a medium-sized Central European city: The case of Olomouc (Czech Republic). Theor. Appl. Climatol. 2015, 122, 531–541. [Google Scholar] [CrossRef]
  18. Fenner, D.; Meier, F.; Scherer, D.; Polze, A. Spatial and temporal air temperature variability in Berlin, Germany, during the years 2001–2010. Urban Clim. 2014, 10(Part 2), 308–331. [Google Scholar] [CrossRef]
  19. Arnds, D.; Böhner, J.; Bechtel, B. Spatio-temporal variance and meteorological drivers of the urban heat island in a European city. Theor. Appl. Climatol. 2017, 128, 43–61. [Google Scholar] [CrossRef]
  20. Brousse, O.; Martilli, A.; Foley, M.; Mills, G.; Bechtel, B. WUDAPT, an efficient land use producing data tool for mesoscale models? Integration of urban LCZ in WRF over Madrid. Urban Clim. 2016, 17, 116–134. [Google Scholar] [CrossRef]
  21. Alexander, P.J.; Bechtel, B.; Chow, W.T.L.; Fealy, R.; Mills, G. Linking urban climate classification with an urban energy and water budget model: Multi-site and multi-seasonal evaluation. Urban Clim. 2016, 17, 196–215. [Google Scholar] [CrossRef]
  22. Wouters, H.; Demuzere, M.; Blahak, U.; Fortuniak, K.; Maiheu, B.; Camps, J.; Tielemans, D.; van Lipzig, N.P.M. The efficient urban canopy dependency parametrization (SURY) v1.0 for atmospheric modelling: description and application with the COSMO-CLM model for a Belgian summer. Geosci. Model Dev. 2016, 9, 3027–3054. [Google Scholar] [CrossRef]
  23. Bechtel, B.; Daneke, C. Classification of Local Climate Zones based on multiple Earth Observation data. IEEE J. Sel. Top. Appl. Earth Obs. Remote Sens. 2012, 5, 1191–1202. [Google Scholar] [CrossRef]
  24. Lelovics, E.; Unger, J.; Gál, T.; Gál, C. Design of an urban monitoring network based on Local Climate Zone mapping and temperature pattern modelling. Clim. Res. 2014, 60, 51–62. [Google Scholar] [CrossRef]
  25. Gal, T.; Bechtel, B.; Lelovics, E. Comparison of two different Local Climate Zone mapping methods. In Proceedings of the ICUC9, Toulouse, France, 20–24 July 2015. [Google Scholar]
  26. Geletič, J.; Lehnert, M. GIS-based delineation of local climate zones: The case of medium-sized Central European cities. Morav. Geogr. Rep. 2016, 24. [Google Scholar] [CrossRef]
  27. Weng, Q. (Ed.) Global Urban Monitoring and Assessment through Earth Observation; Remote Sensing Applications Series; CRC Press: Boca Raton, FL, USA, 2014. [Google Scholar]
  28. Casonne, A. Deriving Local Climate Zones from Remote Sensing Data. Master’s Thesis, University of Strasbourg, Strasbourg, France, 2016. [Google Scholar]
  29. Bechtel, B.; Alexander, P.J.; Böhner, J.; Ching, J.; Conrad, O.; Feddema, J.; Mills, G.; See, L.; Stewart, I. Mapping Local Climate Zones for a worldwide database of the form and function of cities. ISPRS Int. J. Geo-Inf. 2015, 4, 199–219. [Google Scholar] [CrossRef]
  30. Conrad, O.; Bechtel, B.; Bock, M.; Dietrich, H.; Fischer, E.; Gerlitz, L.; Wehberg, J.; Wichmann, V.; Böhner, J. System for Automated Geoscientific Analyses (SAGA) v. 2.1.4. Geosci. Model Dev. 2015, 8, 1991–2007. [Google Scholar] [CrossRef]
  31. Bechtel, B.; See, L.; Mills, G.; Foley, M. Classification of Local Climate Zones using SAR and multi-spectral data in an arid environment. IEEE J. Sel. Top. Appl. Earth Obs. Remote Sens. 2016, 9, 3097–3105. [Google Scholar] [CrossRef]
  32. Danylo, O.; See, L.; Bechtel, B.; Schepaschenko, D.; Fritz, S. Contributing to WUDAPT: A Local Climate Zone classification of two cities in Ukraine. IEEE J. Sel. Top. Appl. Earth Obs. Remote Sen. 2016, 9, 1841–1853. [Google Scholar] [CrossRef]
  33. Kaloustian, N.; Bechtel, B. Local climatic zoning and urban heat island in Beirut. Proced. Eng. 2016, 169, 216–223. [Google Scholar] [CrossRef]
  34. Xu, Y.; Ren, C.; Meng, C.; Ng, E.; Wu, T. Classification of local climate zones using ASTER and Landsat data for high-density cities. IEEE J. Sel. Top. Appl. Earth Obs. Remote Sens. 2017. [Google Scholar] [CrossRef]
  35. Tuia, D.; Moser, G.; Saux, B.L.; Bechtel, B.; See, L. 2017 IEEE GRSS Data Fusion Contest: Open Data for Global Multimodal Land Use Classification [Technical Committees]. IEEE Geosci. Remote Sens. Mag. 2017, 5, 70–73. [Google Scholar] [CrossRef]
  36. Mitraka, Z.; Frate, F.D.; Chrysoulakis, N.; Gastellu-Etchegorry, J.P. Exploiting Earth Observation data products for mapping Local Climate Zones. In Proceedings of the 2015 Joint Urban Remote Sensing Event (JURSE), Ecublens, Switzerland, 30 March–1 April 2015; pp. 1–4. [Google Scholar]
  37. Bechtel, B.; Demuzere, M.; Xu, Y.; Verdonck, M.L.; Lopes, P.; See, L.; Ren, C.; Van Coillie, F.M.B.; Tuia, D.; Fonte, C.C.; et al. Beyond the Urban Mask: Local Climate Mask Zones as a Generic Descriptor of Urban Areas—Potential and Recent Developments. In Proceedings of the IEEE 2017 Joint Urban Remote Sensing Event (JURSE), Dubai, UAE, 6–8 March 2017. [Google Scholar]
  38. Tuia, D.; Moser, G.; Wurm, M.; Taubenbock, H. Land Use Modelling in North Rhine-Westphalia with Interaction and Scaling Laws. In Proceedings of the IEEE 2017 Joint Urban Remote Sensing Event (JURSE), Dubai, UAE, 6–8 March 2017. [Google Scholar]
  39. Perera, N.G.R.; Emmanuel, R. A “Local Climate Zone” based approach to urban planning in Colombo, Sri Lanka. Urban Clim. 2016. [Google Scholar] [CrossRef]
  40. Goodchild, M.F. Citizens as sensors: The world of volunteered geography. GeoJournal 2007, 69, 211–221. [Google Scholar] [CrossRef]
  41. See, L.; Mooney, P.; Foody, G.; Bastin, L.; Comber, A.; Estima, J.; Fritz, S.; Kerle, N.; Jiang, B.; Laakso, M.; et al. Crowdsourcing, citizen science or Volunteered Geographic Information? The current state of crowdsourced geographic information. ISPRS Int. J. Geo-Inf. 2016, 5, 55. [Google Scholar] [CrossRef]
  42. Howe, J. The rise of crowdsourcing. Wired Mag. 2006, 14, 1–4. [Google Scholar]
  43. International Association for Urban Climate. Available online: http://www.urban-climate.org/ (accessed on 13 March 2017).
  44. Foody, G.M.; See, L.; Fritz, S.; Van der Velde, M.; Perger, C.; Schill, C.; Boyd, D.S. Assessing the accuracy of Volunteered Geographic Information arising from multiple contributors to an Internet based collaborative project: Accuracy of VGI. Trans. GIS 2013, 17, 847–860. [Google Scholar] [CrossRef]
  45. Foody, G.M.; See, L.; Fritz, S.; Van der Velde, M.; Perger, C.; Schill, C.; Boyd, D.S.; Comber, A. Accurate attribute mapping from Volunteered Geographic Information: Issues of volunteer quantity and quality. Cartogr. J. 2015, 52, 336–344. [Google Scholar] [CrossRef]
  46. Van Coillie, F.M.B.; Gardin, S.; Anseel, F.; Duyck, W.; Verbeke, L.P.C.; Wulf, R.R.D. Variability of operator performance in remote-sensing image interpretation: The importance of human and external factors. Int. J. Remote Sens. 2014, 35, 754–778. [Google Scholar] [CrossRef]
  47. Flanagin, A.; Metzger, M. The credibility of volunteered geographic information. GeoJournal 2008, 72, 137–148. [Google Scholar] [CrossRef]
  48. Antoniou, V.; Skopeliti, A. Measures and indicators of VGI quality: An overview. In ISPRS Annals of the Photogrammetry, Remote Sensing and Spatial Information Sciences; ISPRS Annals: La Grande Motte, France, 2015; Volume II-3/W5, pp. 345–351. [Google Scholar]
  49. Allahbakhsh, M.; Benatallah, B.; Ignjatovic, A.; Motahari-Nezhad, H.R.; Bertino, E.; Dustdar, S. Quality control in crowdsourcing systems: Issues and directions. IEEE Internet Comput. 2013, 17, 76–81. [Google Scholar] [CrossRef]
  50. Fonte, C.C.; Bastin, L.; See, L.; Foody, G.; Lupia, F. Usability of VGI for validation of land cover maps. Int. J. Geogr. Inf. Sci. 2015, 29, 1269–1291. [Google Scholar] [CrossRef]
  51. Breiman, L. Random Forests. Mach. Learn. 2001, 45, 5–32. [Google Scholar] [CrossRef]
  52. Congalton, R.G. A review of assessing the accuracy of classifications of remotely sensed data. Remote Sens. Environ. 1991, 37, 35–46. [Google Scholar] [CrossRef]
  53. Stewart, I.; Global Cities Institute, University of Toronto, Toronto, Canada, LCZ metric. Personal communication, 2016.
  54. Surowiecki, J. The Wisdom of Crowds; Anchor Books: New York, NY, USA, 2005. [Google Scholar]
  55. Haklay, M.; Basiouka, S.; Antoniou, V.; Ather, A. How many volunteers does it take to map an area well? The validity of Linus’ Law to volunteered geographic information. Cartogr. J. 2010, 47, 315–322. [Google Scholar] [CrossRef]
  56. See, L.; Comber, A.; Salk, C.; Fritz, S.; Van der Velde, M.; Perger, C.; Schill, C.; McCallum, I.; Kraxner, F.; Obersteiner, M. Comparing the quality of crowdsourced data contributed by expert and non-experts. PLoS ONE 2013, 8, e69958. [Google Scholar] [CrossRef] [PubMed]
Figure 1. Urban (1–10) and natural (A–G) LCZ types and their characteristics (adapted from Table 2 in [14], text shortened, icons reworked) and colour code used in the WUDAPT framework. B: Buildings; C: cover; M: materials; F: function; Tall: >10 stories, Mid-rise: 3–9 stories, Low: 1–3 stories.
Urbansci 01 00015 g001
Figure 2. LCZ classification workflow (by operators) and HUMINEX evaluation (by authors of this study).
Urbansci 01 00015 g002
Figure 3. Classified cities: Antwerp, Belgium; Athens, Greece; Augsburg, Germany; Berlin, Germany; Brussels & Leuven, Belgium; Dublin, Ireland; Ghent, Belgium; Phoenix, USA; Vancouver, Canada. Please note the different scales in the maps. © Imagery: Google Earth & Bing Aerial.
Urbansci 01 00015 g003
Figure 4. Classification results using different training area sets for Berlin, Germany.
Urbansci 01 00015 g004
Figure 5. Classification results using different training area sets for Vancouver, Canada.
Urbansci 01 00015 g005
Figure 6. (a) The modal LCZ type and (b) the consistency (see Section 3.2 for details) for Athens, Greece.
Urbansci 01 00015 g006
Figure 7. (a) Consistency per city for urban (red) and natural (green) LCZ types (including LCZ E: paved/rock) and (b) consistency per LCZ for Vancouver, Canada. Central mark is median, the solid box corresponds to the 25th–75th percentile range, whiskers extend to all data points not considered outliers; Outliers (distance to solid box greater than 1.5 times its length) are discrete due to the fixed number N of classifications per city.
Urbansci 01 00015 g007
Figure 8. F1 accuracy (bottom legend) per LCZ type for all classification results.
Urbansci 01 00015 g008
Figure 9. Distributions of F1 accuracy for all LCZs for Augsburg, Germany (left), and Leuven, Belgium (right). Box and whiskers refer to the interquartile range and min -and maximum values, respectively. Numbers in blue denote the percentage of operators identifying a specific LCZ in the city, red numbers indicate the percentage of operators tagging a LCZ as difficult to distinguish in the questionnaire (cf. Table 1).
Urbansci 01 00015 g009
Figure 10. Results of different iterations. (a) urban OA for Berlin, Germany; (b) κ for Berlin, and (c) OAbuiltup for Leuven, Belgium.
Urbansci 01 00015 g010
Figure 11. Results of individual operators at different number of iterations. (a) OA for Berlin, Germany and (b) OA for Leuven, Belgium.
Urbansci 01 00015 g011
Figure 12. (a) Multiple individual classifications for comparison of accuracy measures and (b) the combined training areas from all participants to create a single LCZ map for the city of Leuven, Belgium.
Urbansci 01 00015 g012
Figure 13. Improvements with additional training data: (a) modal type and (b) multiple training areas (TA) result vs average of individual TA sets. Distribution for ten cities.
Urbansci 01 00015 g013
Figure 14. Dependency of the accuracy improvement on the number of available TA sets.
Urbansci 01 00015 g014
Table 1. Metadata collected from the participants. The allowed answers are provided in brackets.
CategoryMetadata Collected
GeneralID; City name
OperatorNumber of operators per training area set; highest degree (B.Sc./M.Sc./Ph.D.); total years of study (Number of years); University course; Experience with Image Classification (Self-Estimation 1); Age; Gender; City of origin
LCZ knowledgeIntroduction in seminar/course (Yes/No); WUDAPT website visit (Yes/No); study of Stewart & Oke 2012 paper (Yes/No); study of LCZ fact sheets (Yes/No); completion of LCZ Driving test (Yes/No); Numbers of cities classified before (Number of cities); LCZ knowledge self-estimation (0–100%)
City knowledgeHow long have you lived in the city of interest (Number of years); how long have you lived in similar (climate, morphology) cities (Number of years); Familiarity with city of interest self-estimation (0–100%)
ClassificationTime invested for training area collection (Number of hours); Number of iterations (Number of iterations); Used online manuals? (Yes/No); Which LCZ did you find difficult to distinguish? (LCZ type)
OverallSelf-Rating (0–100%) of final classification [map] quality
Personality 2I like to follow a schedule; I know how to captivate people; I am relaxed most of the time; I don’t mind being the centre of attention; I see myself as sympathetic/warm, I see myself as dependable, self-disciplined; I see myself as open to new experiences; I see myself as calm, emotionally stable; I like to collaborate.
1 Experience with image classification: 0-Novice; 1-Advanced Beginner; 2-Competent; 3-Proficient; 4-Expert; 2 The answer to the personality questions was a value between 1 and 5, where 1 corresponds to “strongly disagree” and 5 to “strongly agree”.
Table 2. Participants and cities in the HUMan INfluence EXperiment. For AUG and TUB multiple operators were working on joint TA sets. Students from NOA additionally classified Hamburg, Madrid, Milan, Prague, Vienna, which were not included in the evaluation due to the small number of classifications per city.
Institute IDNameNumber of StudentsCities Classified (Number of Students)Maximum Time for CompletionNumber of TA Sets Used in Evaluation
ASUArizona State University7Phoenix (7)2 weeks (homework)7
AUGUniversity of Augsburg12Augsburg (12), Vancouver (12)homework14
KULUniversity of Leuven31Leuven (31)9 h28
NOANational Observatory of Athens & University of Peloponnese (Joint course)8Athens (8)homework8
TUBTechnical University of Berlin14Berlin (14)2 days (16 h)9
GUGhent University28Antwerp (4), Berlin (5), Brussels (5), Dublin (4), Ghent (6), Vancouver (4)12 h28
Table 3. Results of the experiment comparing the use of multiple training areas. N: number of training area sets; 1. mean (µ) and 2. best accuracies of N individual classifications; 3. Modal of all TA: accuracies of modal LCZ type from N classifications; 4. all TAs used to create a single LCZ map: accuracies if one classification using all training areas.
CITYAntwerpAthensAugsburgBerlinBrusselsDublinGhentLeuvenPhoenixVancouver
N4871454628711
1. µ single runs
OA0.710.560.660.760.710.710.610.720.180.78
ĸ0.670.520.580.720.670.650.550.640.120.73
OAurb0.700.540.600.610.590.550.550.600.300.57
OAbuiltup0.930.920.850.960.940.930.960.890.660.91
WA0.930.910.900.950.930.910.910.920.640.93
2. best single run
OA0.750.740.710.930.850.740.720.830.280.87
ĸ0.720.710.630.920.820.680.680.780.200.83
OAurb0.720.740.810.890.740.650.750.800.440.82
OAbuiltup0.930.970.900.990.980.950.990.970.790.96
WA0.950.950.920.980.970.910.950.950.720.97
3. mode all TA
OA0.790.730.790.950.810.750.660.850.230.87
ĸ0.760.700.720.930.780.690.610.800.170.83
OAurb0.760.750.660.890.700.690.760.770.410.74
OAbuiltup0.940.970.910.990.980.930.950.940.750.93
WA0.950.950.940.990.970.920.930.950.680.96
4. all TA in
OA0.790.750.850.940.860.790.800.920.230.93
ĸ0.770.720.800.930.840.740.760.900.170.91
OAurb0.720.770.850.870.790.660.720.890.360.84
OAbuiltup0.940.990.921.000.970.950.990.980.820.97
WA0.960.960.960.990.980.930.970.980.720.98

