Promoting Crowdsourcing for Urban Research: Cycling Safety Citizen Science in Four Cities

1
Department of Geography, University of Victoria, PO Box 1700 STN CSC, Victoria, BC V8W 2Y2, Canada
2
School of Geographical Sciences & Urban Planning, Arizona State University, PO Box 875302, Tempe, AZ 85287-5302, USA
3
Traffic Injury Research Foundation (TIRF), 171 Nepean Street, Suite 200, Ottawa, ON K2P 0B4, Canada
4
Faculty of Health Science, Simon Fraser University, Blusson Hall, Room 11300, 8888 University Drive, Burnaby, BC V5A 1S6, Canada
*
Author to whom correspondence should be addressed.
Urban Sci. 2017, 1(2), 21; https://doi.org/10.3390/urbansci1020021
Submission received: 17 May 2017
/
Revised: 17 June 2017
/
Accepted: 19 June 2017
/
Published: 21 June 2017
(This article belongs to the Special Issue Crowdsourcing Urban Data)
Abstract
:People generate massive volumes of data on the Internet about cities. Researchers may engage these crowds to fill data gaps and better understand and inform planning decisions. Crowdsourced tools for data collection must be supported by outreach; however, researchers typically have limited experience with marketing and promotion. Our goal is to provide guidance on effective promotion strategies. We evaluated promotion efforts for BikeMaps.org, a crowdsourced tool for cycling collisions, near misses, hazards, and thefts. We analyzed website use (sessions) and incidents reported, and how they related to promotion medium (social, traditional news, or in-person), intended audience (cyclists or general), and community context (cycling mode share, cycling facilities, and a survey in the broader community). We compared four Canadian cities, three with active promotion, and one without, over eight months. High-use events were identified in time periods with above average web sessions. We found that promotion was essential for use of the project. Targeting cycling specific audiences resulted in more data submitted, while targeting general audiences resulted in greater age and gender diversity. We encourage researchers to use tools to monitor and adapt to promotion medium, audience, and community context. Strategic promotion may help achieve more diverse representation in crowdsourced data.
1. Introduction
Cities are ideal environments for crowdsourcing geographic information. Within cities, there is access to digital tools (e.g., cellular data networks) and people with expertise and motivation to contribute [1]. Data generated through crowdsourcing can help our understanding of travel behaviour [2], inventory the built environment [3], monitor and identify improvement opportunities [4], and potentially improve public perceptions of new infrastructure projects [5,6]. Within cities, crowdsourced data cover a diverse range sources and topics, including, but not limited to city-launched applications for civic-services [7], researcher- and citizen- collaborations to monitor and address public health concerns [8], and widespread contextual geographic information about current events in social media [9]. In particular, crowdsourced tools are providing solutions to a lack of active transportation and mobility data. For example, global positioning systems (GPS) data collected from fitness applications can document bicycle and foot trips [7], information from bike share stations can help to understand transportation demands within cities [8], citizens can report cycling safety [10] and routes [11], and researchers have integrated information from multiple platforms to better understand mobility and accessibility in cities, given diverse preferences and needs [2]. Data generated from crowdsourcing can supplement standard data collection, often adding local nuance, increasing data resolution, and extending data coverage. The ability of crowdsourced data to be rapidly updated in response to local issues is also unique, relative to more formal data collection approaches [9]. The growing popularity of crowdsourcing is creating data-rich research environments and changing paradigms in scientific research [12,13].
A challenge for researchers and organizations using crowdsourced tools is effective promotion to citizen participants. Training for researchers leading crowdsourced projects does not typically include marketing or promotion skills. However, recently there has been more emphasis in training scientists to communicate with the public about research, as well as goals to increase public science literacy using citizen science as a tool for informal science education [14]. In the health sciences, there is considerable expertise in knowledge transfer and exchange and participatory action research; however, these practices have traditionally been aimed at knowledge dissemination and exchange between researchers, practitioners, and organizations rather than knowledge exchange with individuals at as wide of a scale as in citizen science and crowdsourcing [15]. Interestingly, traditional commercial marketing often utilize crowdsourced approaches [16], although small organizations typically have more diverse non-monetary goals [17]. While promotion strategies may draw on experience and knowledge generated in these diverse disciplines, crowdsourcing tools for urban data are by nature highly innovative and therefore new approaches are rapidly being developed as experience is gained [18]. Tools are needed to measure how promotion efforts relates to uptake and use.
Bikemaps.org is a crowdsourced tool to compile, analyze, and communicate urban data about cycling safety. Cities need information about active transportation to effectively manage and expand their facilities [6,19]. However, cycling collisions are under-reported in traditional data sources such as police reports, hospital records, and automobile insurance, especially minor crashes and crashes that do not involve automobiles [20,21]. There is no official mechanism for reporting near misses. Minor collisions and near misses are associated with cyclists’ perceptions of safety [22], and can be a leading barrier to cycling for people who use other transportation forms [23]. BikeMaps.org features web-map and smartphone applications where cyclists can report collisions, near misses, hazards and thefts to make their experiences visible to other cyclists, planners, and researchers [10]. In addition, there are pages for visualization of the submitted data including heatmaps and graphs of incidents. Two years after launch, more than 4000 reports had been made to BikeMaps.org and citizens are reporting incidents globally. BikeMaps.org has been promoted using a variety of strategies, including in-person at events, traditional news media, and using social media. Evaluating how website use and incident reporting in BikeMaps.org relates to these efforts serves a case study to understand how promotion of a crowdsourced urban data project relates to use by individuals in cities.
The objective of this paper is to understand how the spatial and temporal patterns of BikeMaps.org use was related to promotion in four Canadian cities. Our study period is April 2016–January 2017, during which active promotion for BikeMaps.org took place in three cities (Edmonton, AB; Ottawa, ON; and Victoria, BC). One city, where no active promotion took place during the study, is used as a control (Kelowna, BC). For the promotion activities, we considered the medium (social, traditional news, or in-person) and the intended audience (cyclists or more general audiences). For BikeMaps.org use we considered both views of the webpage (web sessions), and submission of data. To describe community context, we considered the cycling mode share, status of cycling facilities, and barriers to cycling reported in a survey, and previous BikeMaps.org reporting.
In this paper, we present and describe the data, and then we discuss the possible reasons for the relationships between variables. We identified discrete high-use events based on time periods with above-average web sessions, and we compared the attributes of web sessions and incidents reported following different promotion events. Specifically, we hypothesize that promotion medium and audience are related to the rates and demographics of BikeMaps.org use, with promotion targeted to cyclists being linked to more data submitted, and promotion targeted to more general audiences being related to more demographic diversity for incidents submitted. We hypothesize that there will be more use in cities with active cycling communities and cycling-specific infrastructure available to ride because there are more cyclists to make reports and more interest in cycling.
2. Materials and Methods
2.1. Study Areas and Time Frame
Over the spring and summer of 2016, BikeMaps.org was actively promoted in three Canadian cities (Edmonton, AB; Ottawa, ON; and Victoria, BC) and a fourth Canadian city was chosen for comparison with no promotion (Kelowna, BC) as part of a grant from the Public Health Agency of Canada (PHAC). For this analysis, we use a study period of 15 April 2016–31 December 2016, marking the beginning of spring and summer riding season when the bulk of the promotion activities occurred, and the progression into the winter riding season. In this study, we used Canadian census divisions (CDs), which included both the metropolitan centres and the nearby communities, including suburban and rural areas. For each city, we used the spatial boundaries for the following CDs with the following populations in the 2011 National Household Survey (NHS): Edmonton, Alberta: Division No. 11 (1,366,050); Ottawa, Ontario: Ottawa (Ont) (934,243); Victoria, British Columbia: Capital (383,360); and Kelowna, British Columbia: Central Okanagan (194,882).
2.2. Promotion
BikeMaps.org was launched in Victoria, BC in October 2014 and promotional strategies were originally developed in that city. The approaches take several forms: in person at events, guerilla marketing, earned traditional media, and social media. An example of promotion in-person at events is Bike to Work Week, where local bike advocacy groups organize booths from local organizations, and usually, free food or other services (e.g., bike repairs) where cyclists congregate. The BikeMaps.org team coordinates or partners with these organizations to set up a table, distribute promotional material (branded water bottles, stickers, saddle rain covers, and pamphlets, etc.), and attend the booth to answer questions and talk with participants. Guerrilla marketing tactics include low-cost and unconventional marketing approaches. For BikeMaps.org, these have entailed distributing branded water bottles and saddle rain covers on parked bikes. Earned traditional media is associated with articles by journalists in local newspapers. For BikeMaps.org, these usually follow press releases, in this case associated with the launch of promotion activities in the community, but can also occur with the release of BikeMaps.org data products or by providing data to inform local interest. Finally, social media, including Facebook (http://Facebook.com) and Twitter (http://twitter.com) are used to engage with individuals, and cycling organizations in BikeMaps.org cities. Since day-to-day social media use is frequent and ongoing, in this study we focused on notable social media events outside of day-to-day use, mostly by outside organizations.
Over the course of the study period, marketing approaches were used in the three intervention cities. In this paper, we considered all promotion events led by the BikeMaps.org team and all external media that we were aware of. We investigated for outside promotion during all periods of above average website use. For each promotion event we recorded: the city, the date, the medium (in-person, social, or traditional news), and the intended audience (people whose primary interest was cycling, or more general audiences).
2.3. BikeMaps.org Use
2.3.1. Web Sessions and Users
Information about web sessions and users at the BikeMaps.org website was obtained from Google Analytics (http://analytics.google.com). The number of sessions and unique users on a daily basis were queried by city. Sessions are defined by Google as a series of temporally contiguous and meaningful interactions with a website (i.e., connections where no interaction takes place do not count) (Google Analytics 2017). Users are tracked based on Google user accounts and web browser metadata (Google Analytics 2017). Demographic information for users is obtained from voluntary social media information, where available, or profiling and classification based on web activity, where not available (Google Analytics 2017). Demographic information for users were queried by city over the entire study duration. Data were obtained using R Version 3.3.2 (R Foundation for Statistical Computing, Vienna, Austria) and the package RGoogleAnalytics Version 0.1–5 (https://cran.r-project.org/web/packages/RGoogleAnalytics/index.html).
2.3.2. Incident Reporting
All incidents were extracted from the BikeMaps.org database for the CDs over the time period. This included the time and location, type of incident, health or ridership impacts, optional demographic information, and open-ended text descriptions. Spatial analyses were completed using R Version 3.3.2 and the package rgdal Version 1.2-5 (https://cran.r-project.org/web/packages/rgdal/index.html).
2.4. High-Use Events
To allow comparison between promotion efforts, sessions, and incidents reported, we used web sessions to identify high-use events. Based on visual evaluation of web sessions, we developed the following definition of high-use events: starting on the first day with more than twice the mean number of daily sessions, and lasting until the first day that the number of daily sessions returns below the mean for at least two consecutive days (this accounts for the observation that sessions declined on mid-week statutory holidays and then resumed after). Promotion events, web sessions, and incident reporting were attributed to high-use events based on concurrent timing. All analyses were completed using R Version 3.3.2.
2.5. Community Context
2.5.1. Mode Share
Mode share was obtained from Statistics Canada 2011 National Household Survey for journey to work mode share by city [24]. These data represent the proportion of workers using each mode of travel for most trips to or from work. The data do not sum to 100% because of workers who do not commute or use other means of travel.
2.5.2. Cycling Facilities
Cycling facilities were acquired from OpenStreetMap (OSM). OSM is a crowdsourced project to create and maintain global street mapping data [3]. OSM features are assigned tags to store attributes. Queries were written to interpret tags related to bicycle facilities for OSM ways (line features) (Table 1). Features were identified as separated bike lane, painted bike lane, shared street bikeway (shared with automobiles), or multi-use trail (shared with pedestrians). We chose to use OSM because of the ability to obtain data for all areas from a single source. We intended for this dataset to be indicative of the nature of local cycling facilities, rather than an exact description, as there may be slight deviations in coding, boundaries, local definitions, completeness between cities [25], and the results depend on the specific queries used. Queries were run using R Version 3.3.2 and the package overpass Version 0.2.0.9 (https://github.com/hrbrmstr/overpass), data were downloaded in XML format, and using the package rgdal Version 1.2-5, projected to Statistics Canada Lambert Conformal Conic Projection, clipped to CD boundaries, and the distance of each feature was calculated in kilometers. The data were acquired 4 May 2017.
2.5.3. Questionnaires
The survey was designed by the Traffic Injury Research Foundation (TIRF) and fielded by Nielsen using Harris Panel participants, including third-party panel providers. Panelists were invited to participate by email between 17 October 2016 and 31 October 2016. Invites were sent proportionately to the general Canadian population and the final results were weighted to represent the general population of the targeted cities based on Statistic Canada’s population counts in the 2011 Canadian census. The overall response rate was 22%. Panel members were rewarded for their participation with points that could be exchanged for merchandise. Previous studies by members of our research group have used and validated this recruitment approach and the representativeness of the resulting samples in transportation research [26,27].
For this study, we selected questionnaire items to report on attitudes about cycling safety, cycling infrastructure, barriers to cycling for non-cyclists, and what would need to change to start cycling. For the discrete questions, we used a chi-squared test of proportions to look at differences in these outcomes across cities. The null hypothesis is that the proportions for each response were equal for all cities, and the alternate hypothesis that the proportions were not equal. For the open-ended questions “I do not ride a bicycle because” and “For me to ride a bicycle, the following would need to change”, words in response were stemmed to their root word, and stop words and words with ambiguous meanings were removed using the R package tm Version 0.7-1 (text mining) (https://cran.r-project.org/web/packages/tm/index.html) and NLP Version 0.1–10 (natural language processing) (https://cran.r-project.org/web/packages/NLP/index.html). Items mentioned more than three times were tallied into the following themes: (1) physical ability (2) safety (3) the built environment (e.g., bike facilities) (4) convenience (e.g., too far to ride, or need to use car for job) (5) the natural environment (e.g., hills or weather) (6) access to a bicycle and (7) social (only observed for the question about what would need to change to ride a bicycle; e.g., “respect” or “education”), and (8) other. A chi-squared test of multiple proportions was completed with the null hypothesis that the city samples were drawn from populations with the same distribution and the alternative hypothesis that the city samples were drawn from populations with differing distributions of responses. All processing was completed using R Version 3.3.2.
3. Results
3.1. Promotion
In the study cities, the most promotion events were in Edmonton (12) followed by Victoria (11), Ottawa (6). One event happened in Kelowna, unrelated to the team, where a social media posting by an outdoor retailer with national popularity resulted in a rise in web sessions in all cities (Table 2 and Table 3). In-person promotion was most frequent (18 events), followed by social media (8), and print (4). The majority of the promotion events targeted cyclists (20), rather than general audiences (10).
3.2. BikeMaps.org Use
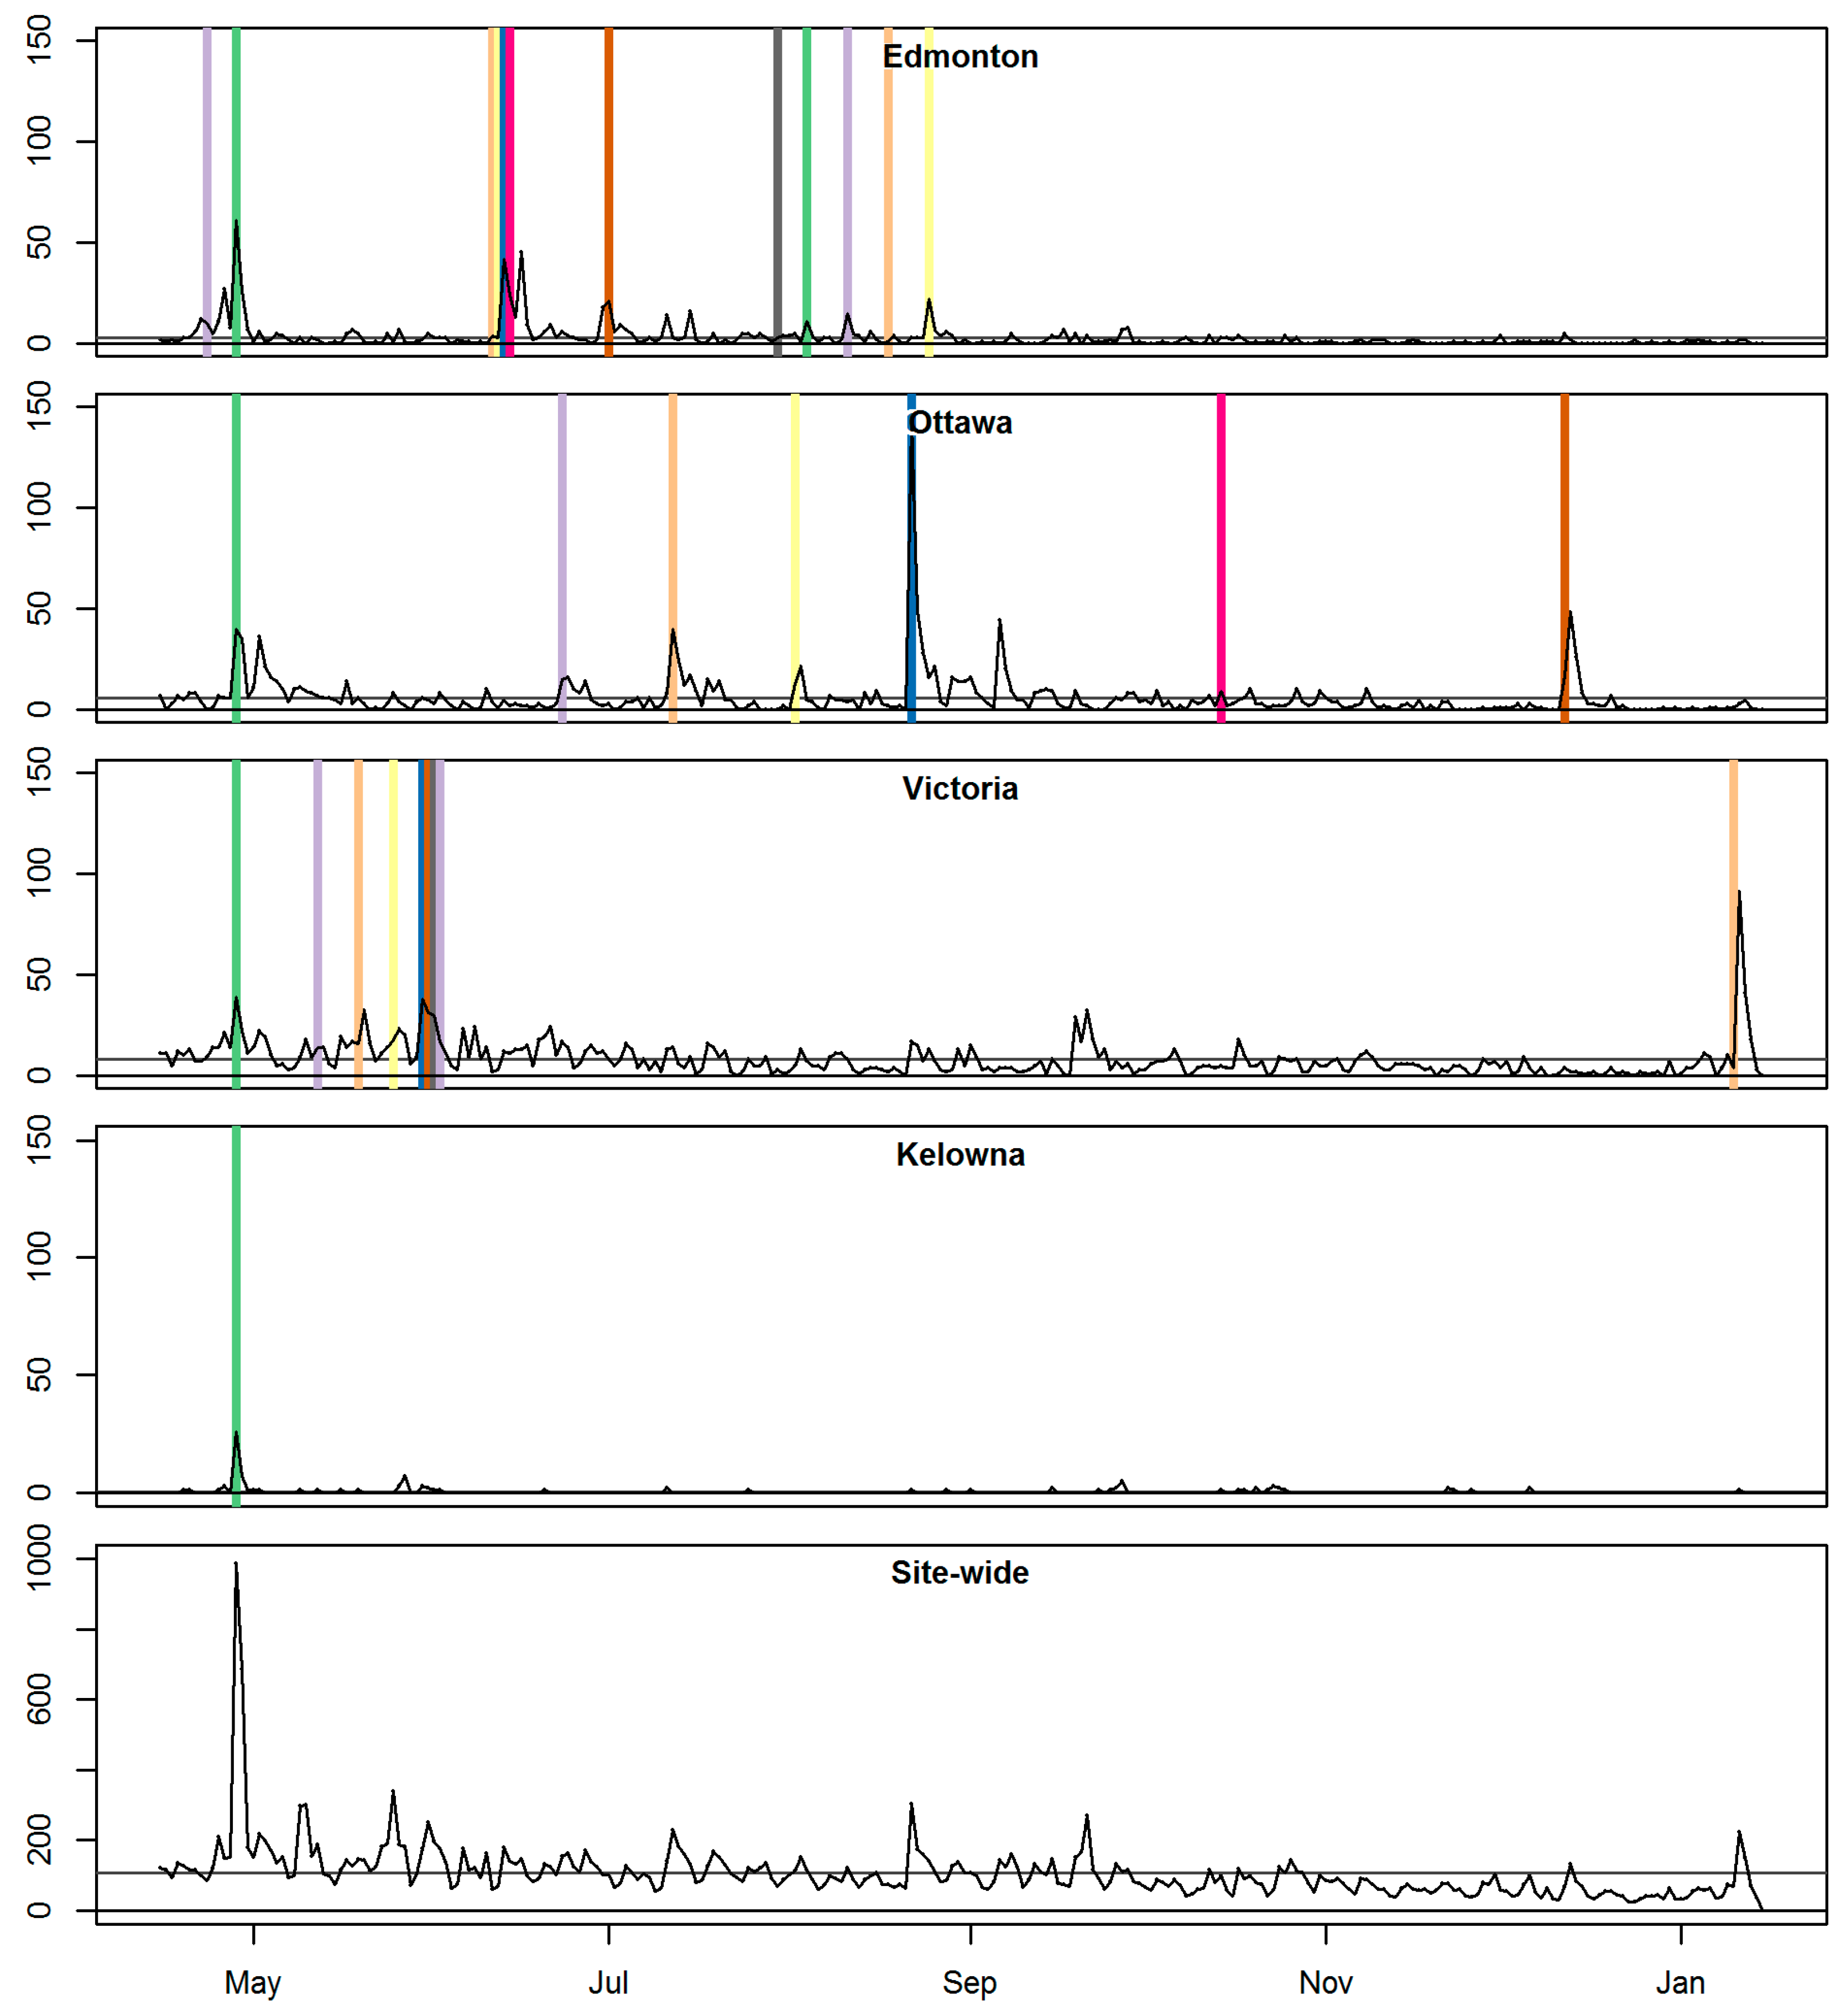
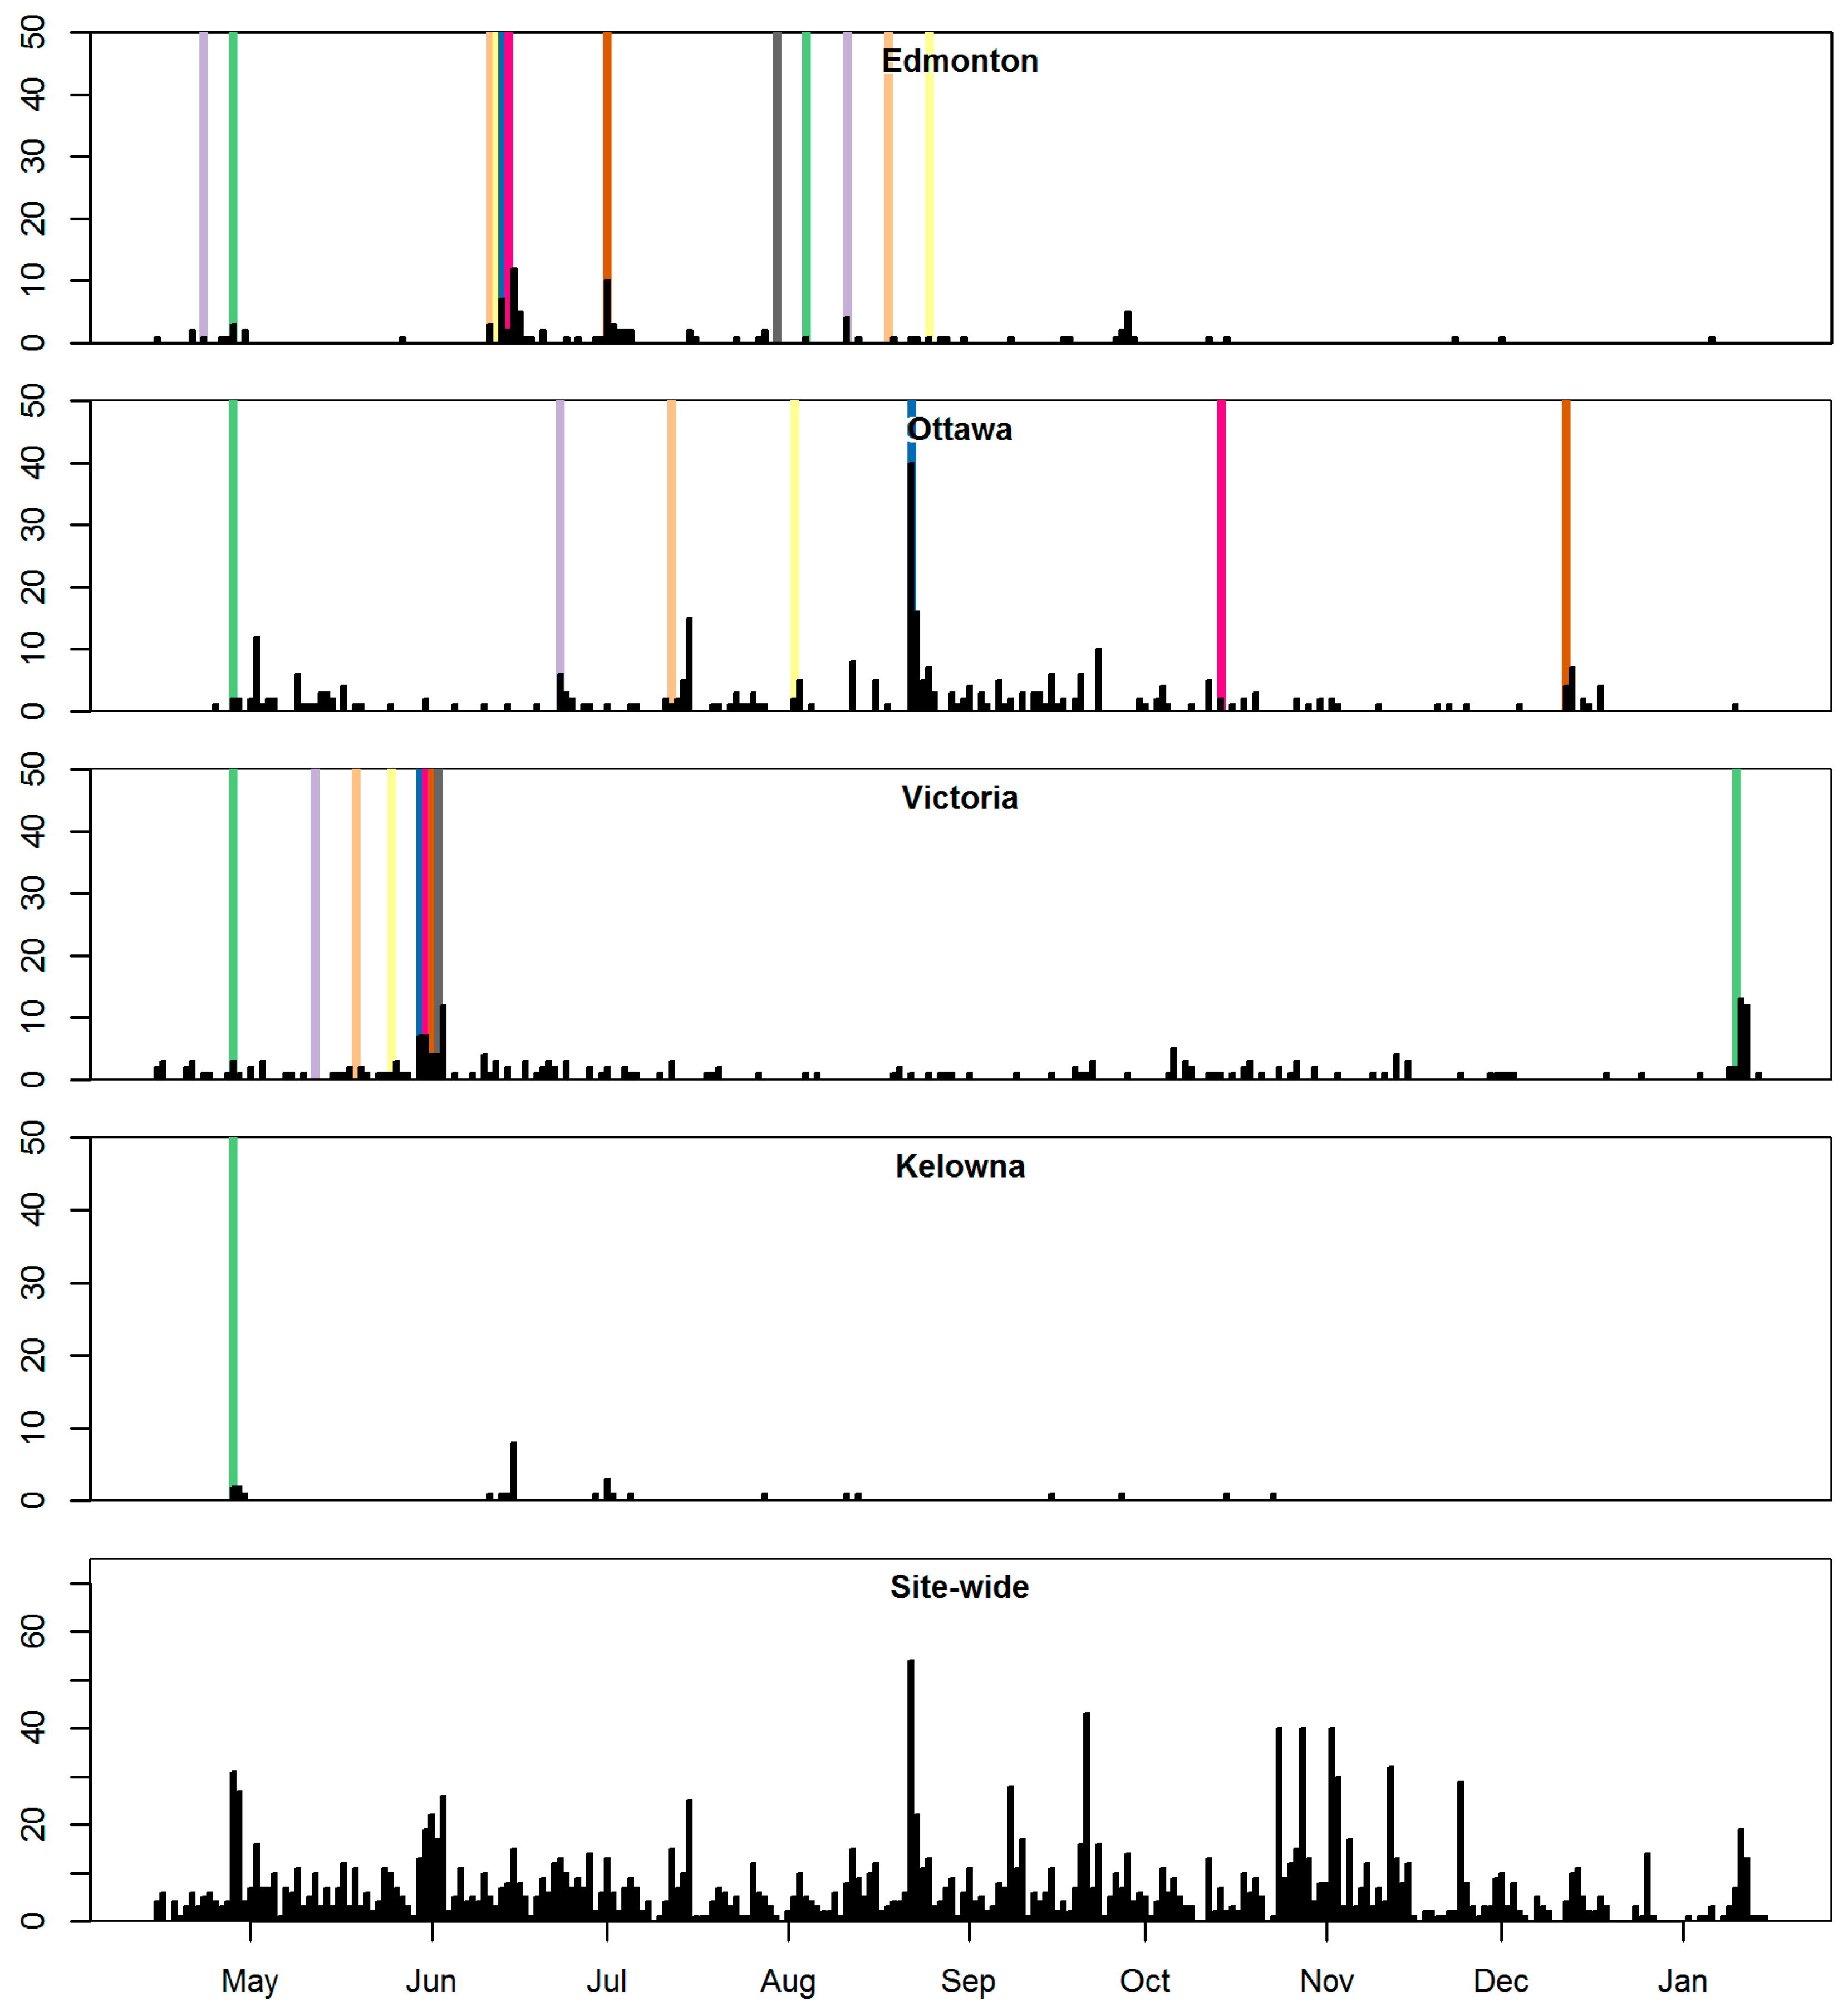
Peaks in the number of web sessions coincided with promotion events (Figure 1). Incidents reported also had peaks coinciding with promotion events, but were more sustained over time (Figure 2). Ottawa had the highest peaks in web sessions, while in Victoria, web sessions were more ongoing. There were more web sessions in the spring through the fall than the winter. In Edmonton, web sessions and incidents reported coincided with the earlier promotion events, were lower for later promotion events, and were very low when promotion did not occur. Considering the ratio of unique visitors to total website sessions, Victoria had more repeat users, while Ottawa, Edmonton, and Kelowna were closer to a 1:1 ratio (many unique visitors) (Table 4). Other than Kelowna, all cities had the majority of use by males, with similar proportions by gender. Also, for all cities, the majority of website users were greater than 35 years of age.
In Victoria, more people viewed the website without submitting data, while in Ottawa it was more common to actively partake in submitting data, and this was indicated by the ratio of website views to incidents mapped (Table 5). The response rates for complete age and gender reporting was consistent across cities. The median age for incidents with complete gender and age information was higher in Victoria and Kelowna than Ottawa and Edmonton. Finally, the percent of incidents reported by people over 35 years of age was similar to the web sessions for Edmonton, Kelowna, and Ottawa, while a higher percentage of people over 35 reported incidents than viewed the webpage in Victoria. The people who submitted incidents in Victoria over this time period were older than the previous data, where 35 was the approximate median age [28].
3.3. High-Use Events
Fifty-three high-use events were identified, and there were differences in reported age and gender depending on the medium and audience (Table 6 and Table A1). Often there were multiple coincident promotions, or at other times, rises in website traffic occurred without promotion. In general, traditional print media corresponded with incidents reported by people with higher median ages and a high proportion of males; events that targeted cyclists corresponded with incidents with lower median ages and males (notably, the Edmonton Bike Club had higher female participation); and social media posts by outdoor retailers with higher median ages and females, though active participation rates (i.e., ratio of views to incidents reported) was lower than other media. Spontaneous high-use events tended to occur in cities where previous BikeMap.org use had occurred, during peak times for cycle commuting (i.e., in the spring and late summer in Victoria, and in the late summer in Ottawa). Since high-use events were identified relative to normal use, this measure was less useful in Kelowna due to low overall use.
3.4. Community Context
3.4.1. Mode Share
Victoria had the highest active transportation mode share (bicycling and walking), approximately double that of Ottawa and Kelowna, and nearly six times that of Edmonton (Table 7). Ottawa had much higher public transit mode share, and motorized vehicle use was highest in Kelowna.
3.4.2. Bicycle Facilities
Edmonton had very-few on-street bicycle facilities, while they had abundant multi-use trails (Table 8). The distance estimated in this project was larger than reported by the city (160 km—from https://www.edmonton.ca/activities_parks_recreation/parks_rivervalley/trail-system.aspx), because the definitions used in this study included unmaintained trails, neighbouring communities, and other types of urban paths shared between cyclists and pedestrians. Nonetheless, these figures were indicative of the large population in the CD, very few on-street bike facilities, and many multi-use trails (e.g., the River Valley Trail System) not principally designed for bicycle transportation. In contrast, Kelowna had a much smaller population, numerous painted bike lanes, and some multi-use trails. We may have underestimated the availability of multi-use trails in Kelowna, since we did not include gravel surfaced trails, such as the Kettle Valley Railway and others, which may be used for bicycle transportation in the city. Both Ottawa and Victoria had painted lane bike lanes and multi-use trails. At the time of writing, only Ottawa had a separated bike lane, while both cities have plans to expand in the future. None of the cities had neighbourhood greenways, i.e., shared lanes in combination with reduced speed limits and traffic calming measures.
3.4.3. Attitudes towards Cycling
The majority of respondents to the survey were male, with a median age of 57 years (Table 9). Respondents in Victoria and Ottawa were slightly more frequently in agreement that bicycling is unsafe. Respondents in Edmonton were more frequently in agreement with the negative view that bicycling lanes cause congestion, while people in the more rural community of Kelowna were less concerned about bicycle lanes causing congestion. For all cities, the most frequently mentioned reasons for not cycling were physical abilities followed by safety, the availability of bike lanes or suitability of roads for cycling, and reasons of practicality or convenience (e.g., long distances). Across all cities, improvements to bike facilities were the most frequently mentioned theme for people who don’t ride bikes to ride their bikes more often.
4. Discussion
In this study of the relationships between promotion and use of an urban crowdsourcing project, we found a link between promotion and the periods with the highest website use and incident reporting. Incident reporting only occurred in sufficient numbers to be informative for city planning or research in cities where the project was promoted actively. Incident reporting and website use corresponded with individual promotion events, with obvious peaks in web traffic immediately following promotions and more delayed responses in terms of incidents submitted. Periods of high-use also occurred spontaneously, usually during peak cycle commuting periods in cities where BikeMaps.org had been previously promoted and use was established. Additionally, we found that different cities showed different potential for ongoing use, with more responsiveness to crowdsourced cycling safety tools where there was higher cycling mode share and more bike facilities.
There was a period of above average sessions that occurred in Ottawa in late August and early September and did not correspond with active promotion by the team. This surge in activity followed a series of three serious collisions between cyclists and automobiles between 29 August 2016 and 1 September 2016, including a fatal incident following the opening of a new bike lane that received international media attention. Shortly before this, another high-use event had occurred, when the City of Ottawa included BikeMaps.org in an email newsletter. In research related to disaster preparedness, Monroe et al. [29] found a critical window with highest salience and action mobilization for community engagement in wildfire preparedness immediately after being impacted by a fire event. Similarly, promoting crowdsourcing tools may build latent interest that is later realized in response to community need.
Victoria was the anchoring community where the technology was developed (at the University of Victoria) and project was launched. The local connection to the project team may have led to wider general interest, resulting in sessions by non-cyclists who may not have had anything to report. As well, in the year prior to launching it, the city of Victoria was engaged about testing a prototype which may have primed had interested in the project. High-use events occurred here in the spring and late summer (times with high cycle-commuting traffic) without promotion, indicating a high level of community awareness of the project. In Victoria, a greater proportion of collisions and near-misses were mapped compared to Ottawa, where a greater proportion of hazards were mapped. In Kelowna, where no intentional promotion took place, reporting was limited, and all incidents with gender reported had male gender indicated, despite a number of web sessions likely by females. With the limited reporting, given the higher rates of male reporting site-wide, it’s possible that all contributors who provided gender information were male. Previously mapped data may have influenced how people interacted with the project [30]. This can be described as a network effect, where a product is “valuable to the extent that other people are using it as well” [31]. As a result, different promotion approaches may be successful at different stages of project use, with an emphasis on filling the map with hazards at early stages as a low-barrier entry, and reporting more serious incidents and visualizing data at later stages.
One of the main findings of this work was related to community context, with cities with higher mode share and more cycling facilities achieving more web sessions and submitting more data. More current mode share numbers will be released in the near future, but we expect a similar trend based on experiences in the community and the corroborating cycling facilities data. People in cities with higher cycling mode share and more cycling facilities somewhat more frequently expressed concerns about cycling safety. Additionally, where higher quality cycling facilities were available, cyclists may have held higher expectations for safety. In contrast, despite most of the promotion activity being deployed in Edmonton, sustained use was not achieved. With lower cycling mode share, there are fewer potential mappers. Additionally, local cycling advocacy groups highlighted other activities as priorities for their efforts. Overall, in Edmonton cycling facilities were the most limited, and attitudes towards building new cycling facilities were the most negative in the broader community (i.e., causing congestion for personal automobiles). In contrast, in Ottawa, people were very responsive to a city email promoting BikeMaps.org, generating the second largest high-use event in this study. The email, which was part of the “Cycling in the City” newsletter on updates for city led-bicycling facility improvements, included a heading titled “Help make cycling safer—BikeMaps.org” along with a project description. The large response to this message was likely indicative of receptiveness by the cycling community to communication by the city about cycling. Otherwise, the survey responses, which were mostly by non-cyclists, did not differ very much by city. These findings suggest that in order to achieve regular use, there needs to be sufficient underlying interest, previous positive outcomes from civic participation processes, and support from local groups.
In previous research, Robson et al. [32] found that social media was effective for sharing knowledge in non-profits; however, for generating volunteered citizen science data, partnering with existing organizations was more effective. Research by Cardoso et al. [33] found that eBird, a citizen science project with massive participation, had wider and more diverse social networks compared to other projects with more limited use (diversity over density). We found that promotion events targeted to cyclists were associated with more data submitted, while events targeted to general audiences resulted in more diversity in terms of age and gender. We suggest that both types of promotion and engagement are important. Engaging special interest groups is helpful to generate masses of data and start positive network effects, while later, engaging more diverse audiences benefits long-term longevity of the project. Beyond age and gender there are other types of diversity to consider, such as representing new cyclists, or different socioeconomic class, and a future research priority is to consider more advanced measures of representation.
Two key considerations for the use of crowdsourced data to inform active transportation planning decisions are data quality and representation [8]. Several crowd-based mechanisms that can help ensure data quality also depend on volumes of use and therefore can be aided by promotion; for example, with many people viewing the data mistakes can be found and reported, or trusted individuals in the cycling community may help moderate the data [12]. Both of these mechanisms have been observed in BikeMaps.org, with participants contacting the team to report small fixes to improve data quality. Regarding representation, Haklay ([30]) emphasized, “When using and analyzing crowdsourced information, consider the implications of participation inequality on the data and take them into account in the analysis”. A goal for active transportation is to achieve facilities that are safe and appealing to new riders and older people in order to grow the cycling mode share [34]. However, in Western countries with growing cycling populations, often the majority of cyclists are still male [35]. Likewise, for online volunteer mapping efforts, such as OpenStreetMap [36] and also for bike-specific data collection [37] the majority of use has been by young, educated males who are experienced cyclists (in the case of cycling data). Therefore, these data may under-represent the interests of target groups for cycling growth such as older individuals, females, and new cyclists. In this work, we observed a shift towards greater use by older populations in Victoria compared to earlier periods (i.e., higher median age). We also observed different demographic cohorts responding to different types of promotion events. Targeted promotion may provide a tool that may be used in combination with the design of the crowdsourcing tools to engage and improve the representation of target populations.
This research focused on promotion events for uptake of new contributors, which is critical for launching in new cities and because cycling near-misses and crashes are infrequent events that require large reporting populations. Ongoing in-person and social media communication were also used to maintain interest, engagement, and build community amongst dedicated users (in particular, we play an active role in Twitter social networks). In this project, participation by individuals beyond reporting has taken the form of grassroots promotion and championing derived data products. While these activities are harder to measure, they have been essential to the project’s success.
With growing interest and rapid advances in crowdsourcing to provide data to meet information needs for research and planning, understanding effective promotion is critical. Several researchers have evaluated the motivations of regular participants in citizen science projects, often using surveys [38,39,40]. This work is strongly complimentary, since it can be applied directly to promotion events. We offer three recommendations for researchers promoting crowdsourced projects. The first is to reflect on project goals, develop metrics that indicate these goals, and use the metrics to monitor the crowd’s responses to promotion efforts. The second is to carefully consider community context and tailor crowdsourcing tools and promotion to community needs. The third and final recommendation is to use feedback from monitoring to adapt promotion efforts as participants’ needs and project goals evolve over time. These actions, in combination with experience gained on-the-ground, can help project coordinators collect volumes of high quality crowdsourced data that represent populations of interest.
5. Conclusions
We found that promotion was critical for the uptake and use of a crowdsourced cycling tools. Community context was an important consideration, with cities with higher cycling mode share and more cycling facilities being more responsive to promotion of a crowdsourced cycling safety project. We observed that promotion to cyclists resulted in more incidents reported, and generally by younger cohorts, traditional media targeting general audiences was associated with incidents reported by older males, and social media targeting general audiences associated with more diverse data in terms of gender and age. We encourage project promoters to consider project goals, develop metrics for monitoring, and adapt and respond over time. Targeted promotion may be one tool to work towards better representation of all cohorts in crowdsourced data.
Acknowledgments
This BikeMaps.org research has been funded by a grant from the Public Health Agency of Canada. We acknowledge the work of Taylor Denouden in creating the webmap with funding from an NSERC Engage grant sponsored by CAA. Darren Boss developed the mobile applications that have enabled the collection of BikeMaps.org incident data. We thank the members of the BikeMaps.org team and community whose outreach ensured that a sufficient number of people who bike were informed about BikeMaps.org. The authors thank Marisela Hing and partners at TIRF for their assistance. Most of all, we thank everyone who took the time to report an incident on BikeMaps.org.
Author Contributions
Colin Ferster composed text, conducted analyses, and conceived ideas. Trisalyn Nelson principally guided the research, conceived ideas, and was influential throughout. Karen Laberee conceived ideas around community uptake, guided analyses on an ongoing basis, and was influential throughout. Ward Vanlaar conducted the survey and had influential ideas. Meghan Winters guided research and provided essential feedback to link crowdsourcing research with cycling and public health research.
Conflicts of Interest
The authors declare no conflict of interest.
Appendix A

Table A1.
Details of all high-use events.
| City | Start | End | Number of Days | Events | Sessions | Incidents | Collisions | Near Misses | Hazards | Thefts | Complete Demographic Information | Median Age | Female |
|---|---|---|---|---|---|---|---|---|---|---|---|---|---|
| Edmonton | 22 April 2016 | 2 May 2016 | 11 | Run, Walk, Ride; MEC Facebook post | 174 | 10 | 4 | 1 | 1 | 4 | 0.33 | 42 | 0.5 |
| 18 May 2016 | 19 May 2016 | 2 | NA | 12 | 0 | 0 | 0 | 0 | 0 | 0 | |||
| 26 May 2016 | 26 May 2016 | 1 | NA | 7 | 0 | 0 | 0 | 0 | 0 | 0 | |||
| 13 June 2016 | 17 June 2016 | 5 | Swag; EBC Presentation | 133 | 24 | 2 | 9 | 10 | 3 | 0.52 | 32 | 0.27 | |
| 21 June 2016 | 24 June 2016 | 4 | NA | 22 | 0 | 0 | 0 | 0 | 0 | 0 | |||
| 30 June 2016 | 5 July 2016 | 6 | EBC Newsletter | 66 | 19 | 6 | 7 | 5 | 1 | 0.44 | 34 | 0.62 | |
| 11 July 2016 | 11 July 2016 | 1 | NA | 14 | 0 | 0 | 0 | 0 | 0 | 0 | |||
| 15 July 2016 | 15 July 2016 | 1 | NA | 16 | 0 | 0 | 0 | 0 | 0 | 0 | |||
| 4 August 2016 | 5 August 2016 | 2 | Facebook ad. | 15 | 1 | 0 | 1 | 0 | 0 | 1 | 60 | 1 | |
| 11 August 2016 | 15 August 2016 | 5 | Paths for People Twitter | 31 | 5 | 0 | 2 | 2 | 1 | 1 | 41.5 | 1 | |
| 25 August 2016 | 29 August 2016 | 5 | Troubadour Cycles FB | 43 | 2 | 0 | 0 | 0 | 2 | 0 | |||
| 17 September 2016 | 21 September 2016 | 5 | NA | 17 | 2 | 0 | 1 | 0 | 1 | 1 | 28 | 0 | |
| 27 September 2016 | 28 September 2016 | 2 | NA | 15 | 2 | 0 | 2 | 0 | 0 | 0.5 | 40 | 0 | |
| Ottawa | 28 April 2016 | 12 May 2016 | 15 | MEC Facebook post | 238 | 31 | 2 | 8 | 20 | 1 | 0.37 | 49 | 0.36 |
| 17 May 2016 | 17 May 2016 | 1 | NA | 14 | 0 | 0 | 0 | 0 | 0 | 0 | |||
| 23 June 2016 | 27 June 2016 | 5 | Ottawa launch | 63 | 11 | 0 | 3 | 8 | 0 | 0.73 | 35.5 | 0.12 | |
| 12 July 2016 | 20 July 2016 | 9 | Seat cover blitz | 142 | 24 | 2 | 6 | 14 | 2 | 0.68 | 33 | 0.33 | |
| 2 August 2016 | 3 August 2016 | 2 | Seat cover blitz | 34 | 1 | 1 | 0 | 0 | 0 | 0 | |||
| 22 August 2016 | 26 August 2016 | 5 | City of Ottawa email | 256 | 65 | 12 | 25 | 24 | 4 | 0.67 | 38 | 0.34 | |
| 29 August 2016 | 2 September 2016 | 5 | NA | 68 | 10 | 4 | 3 | 3 | 0 | 0.7 | 33 | 0.43 | |
| 6 September 2016 | 8 September 2016 | 3 | NA | 73 | 6 | 0 | 2 | 3 | 1 | 0.6 | 38 | 0.33 | |
| 12 December 2016 | 15 December 2016 | 4 | MetroNews | 99 | 11 | 1 | 4 | 5 | 1 | 0.9 | 51 | 0 | |
| Victoria | 26 April 2016 | 4 May 2016 | 9 | MEC Facebook post | 172 | 10 | 4 | 4 | 1 | 1 | 0.56 | 51 | 0.6 |
| 10 May 2016 | 13 May 2016 | 4 | Pre-Bike to Work Week | 55 | 1 | 0 | 1 | 0 | 0 | 0 | |||
| 16 May 2016 | 3 June 2016 | 19 | Saanich news; Bike to work week; | 349 | 37 | 7 | 20 | 5 | 5 | 0.75 | 32 | 0.32 | |
| 6 June 2016 | 10 June 2016 | 5 | NA | 78 | 2 | 0 | 1 | 1 | 0 | 1 | 48.5 | 0.5 | |
| 19 June 2016 | 24 June 2016 | 6 | NA | 102 | 8 | 3 | 4 | 1 | 0 | 0.88 | 51 | 0.14 | |
| 22 August 2016 | 25 August 2016 | 4 | NA | 52 | 1 | 0 | 0 | 0 | 1 | 0 | |||
| 19 September 2016 | 24 September 2016 | 6 | NA | 118 | 7 | 1 | 3 | 3 | 0 | 0.43 | 26 | 0.75 | |
| 17 October 2016 | 18 October2016 | 2 | NA | 28 | 1 | 0 | 0 | 0 | 1 | 0 | |||
| 11 January 2017 | 13 January 2017 | 3 | Times Colonist | 150 | 25 | 7 | 9 | 9 | 0 | 0.6 | 41 | 0.31 | |
| Kelowna | 19 April 2016 | 20 April 2016 | 2 | NA | 2 | 0 | 0 | 0 | 0 | 0 | 0 | ||
| 25 April 2016 | 2 May 2016 | 8 | MEC Facebook post | 40 | 5 | 2 | 1 | 1 | 1 | 0 | |||
| 9 May 2016 | 9 May 2016 | 1 | NA | 1 | 0 | 0 | 0 | 0 | 0 | 0 | |||
| 12 May 2016 | 12 May 2016 | 1 | NA | 1 | 0 | 0 | 0 | 0 | 0 | 0 | |||
| 16 May 2016 | 16 May 2016 | 1 | NA | 1 | 0 | 0 | 0 | 0 | 0 | 0 | |||
| 19 May 2016 | 19 May 2016 | 1 | NA | 1 | 0 | 0 | 0 | 0 | 0 | 0 | |||
| 26 May 2016 | 27 May 2016 | 2 | NA | 10 | 0 | 0 | 0 | 0 | 0 | 0 | |||
| 30 May 2016 | 2 June 2016 | 4 | NA | 7 | 0 | 0 | 0 | 0 | 0 | 0 | |||
| 20 June 2016 | 20 June 2016 | 1 | NA | 1 | 0 | 0 | 0 | 0 | 0 | 0 | |||
| 11 July 2016 | 11 July 2016 | 1 | NA | 2 | 0 | 0 | 0 | 0 | 0 | 0 | |||
| 25 July 2016 | 25 July 2016 | 1 | NA | 1 | 0 | 0 | 0 | 0 | 0 | 0 | |||
| 22 August 2016 | 22 August 2016 | 1 | NA | 1 | 0 | 0 | 0 | 0 | 0 | 0 | |||
| 28 August 2016 | 28 August 2016 | 1 | NA | 1 | 0 | 0 | 0 | 0 | 0 | 0 | |||
| 1 September 2016 | 1 September 2016 | 1 | NA | 1 | 0 | 0 | 0 | 0 | 0 | 0 | |||
| 15 September 2016 | 15 September 2016 | 1 | NA | 2 | 0 | 0 | 0 | 0 | 0 | 0 | |||
| 23 September 2016 | 27 September 2016 | 5 | NA | 9 | 0 | 0 | 0 | 0 | 0 | 0 | |||
| 14 October 2016 | 14 October 2016 | 1 | NA | 1 | 0 | 0 | 0 | 0 | 0 | 0 | |||
| 17 October 2016 | 25 October 2016 | 9 | NA | 11 | 1 | 0 | 1 | 0 | 0 | 1 | 47 | 0 | |
| 22 November 2016 | 23 November 2016 | 2 | NA | 3 | 0 | 0 | 0 | 0 | 0 | 0 | |||
| 26 November 2016 | 26 November 2016 | 1 | NA | 1 | 0 | 0 | 0 | 0 | 0 | 0 | |||
| 6 December 2016 | 6 December 2016 | 1 | NA | 2 | 0 | 0 | 0 | 0 | 0 | 0 | |||
| 11 January 2017 | 11 January 2017 | 1 | NA | 1 | 0 | 0 | 0 | 0 | 0 | 0 |
References
- Quattrone, G.; Capra, L.; de Meo, P. There’s No Such Thing as the Perfect Map. In Proceedings of the 18th ACM Conference on Computer Supported Cooperative Work & Social Computing—CSCW ’15; ACM Press: New York, NY, USA, 2015; pp. 1021–1032. [Google Scholar]
- Prandi, C.; Salomoni, P.; Mirri, S. mPASS: Integrating People Sensing and Crowdsourcing to Map Urban Accessibility. In Proceedings of the 2014 IEEE 11th Consumer Communications and Networking Conference (CCNC), Las Vegas, NV, USA, 10–13 January 2014. [Google Scholar]
- OpenStreetMap Contributors. Available online: http://www.openstreetmap.org/ (accessed on 17 July 2016).
- Mergel, I.A. Distributed Democracy: SeeClickFix.Com for Crowdsourced Issue Reporting. SSRN Electron. J. 2012, 19, 20. [Google Scholar] [CrossRef]
- Misra, A.; Gooze, A.; Watkins, K.; Asad, M.; le Dantec, C.A. Crowdsourcing and Its Application to Transportation Data Collection and Management. Transp. Res. Rec. J. Transp. Res. Board 2014. [Google Scholar] [CrossRef]
- Smith, A. Crowdsourcing Pedestrian and Cyclist Activity Data. Available online: http://www.pedbikeinfo.org/cms/downloads/PBIC_WhitePaper_Crowdsourcing.pdf (accessed on 19 June 2017).
- Jestico, B.; Nelson, T.; Winters, M. Mapping ridership using crowdsourced cycling data. J. Transp. Geogr. 2016, 52, 90–97. [Google Scholar] [CrossRef]
- Romanillos, G.; Zaltz Austwick, M.; Ettema, D.; de Kruijf, J. Big Data and Cycling. Transp. Rev. 2015, 1647, 114–133. [Google Scholar] [CrossRef]
- Feick, R.; Roche, S. Understanding the value of VGI. In Crowdsourcing Geographic Knowledge: Volunteered Geographic Information (VGI) in Theory and Practice; Sui, D.Z., Elwood, S., Goodchild, M.F., Eds.; Springer: Berlin, Germany, 2013; pp. 15–29. [Google Scholar]
- Nelson, T.A.; Denouden, T.; Jestico, B.; Laberee, K.; Winters, M. BikeMaps.org: A Global Tool for Collision and Near Miss Mapping. Front. Public Health 2015, 3, 1–8. [Google Scholar] [CrossRef] [PubMed]
- Le Dantec, C.A.; Asad, M.; Misra, A.; Watkins, K.E. Planning with Crowdsourced Data. In Proceedings of the 18th ACM Conference on Computer Supported Cooperative Work & Social Computing, Vancouver, BC, Canada, 14–18 March 2015. [Google Scholar]
- Miller, H.J.; Goodchild, M.F. Data-driven geography. GeoJournal 2014, 80, 449–461. [Google Scholar] [CrossRef]
- Kelling, S.; Hochachka, W.M.; Fink, D.; Riedewald, M.; Caruana, R.; Ballard, G.; Hooker, G. Data-intensive Science: A New Paradigm for Biodiversity Studies. Bioscience 2009, 59, 613–620. [Google Scholar] [CrossRef]
- Bonney, R.E.; Cooper, C.B.; Dickinson, J.; Kelling, S.; Phillips, T.; Rosenberg, K.V.; Shirk, J. Citizen Science: A Developing Tool for Expanding Science Knowledge and Scientific Literacy. Bioscience 2009, 59, 977–984. [Google Scholar] [CrossRef]
- Scott, S.D.; Albrecht, L.; O’Leary, K.; Ball, G.D.; Hartling, L.; Hofmeyer, A.; Jones, C.A.; Klassen, T.P.; Burns, K.K.; Newton, A.S.; et al. Systematic review of knowledge translation strategies in the allied health professions. Implement. Sci. 2012. [Google Scholar] [CrossRef] [PubMed]
- Whitla, P. Crowdsourcing and Its Application in Marketing Activities. Contemp. Manag. Res. 2009, 5, 15–28. [Google Scholar] [CrossRef]
- Hou, Y.; Lampe, C. Social Media Effectiveness for Public Engagement. In Proceedings of the 33rd Annual ACM Conference on Human Factors in Computing Systems, Seoul, Korea, 18–23 April 2015. [Google Scholar]
- Cooper, C.B.; Lewenstein, B.V. Two meanings of citizen science. In The Rightful Place of Science: Ctizen Science; Cavalier, D., Kennedy, E.B., Eds.; Consortium for Science, Policy, & Outcomes: Tempe, AZ, USA, 2016; pp. 51–62. [Google Scholar]
- Buehler, R.; Pucher, J. Walking and Cycling in Western Europe and the United States: Trends, Policies, and Lessons. Available online: http://onlinepubs.trb.org/onlinepubs/trnews/trnews280WesternEurope.pdf (accessed on 19 June 2017).
- Teschke, K.; Frendo, T.; Shen, H.; Harris, M.A.; Reynolds, C.C.O.; Cripton, P.A.; Brubacher, J.; Cusimano, M.D.; Friedman, S.M.; Hunte, G.; et al. Bicycling crash circumstances vary by route type: A cross-sectional analysis. BMC Public Health 2014, 14, 1205. [Google Scholar] [CrossRef] [PubMed]
- Winters, M.; Branion-Calles, M. Cycling Safety: Quantifying the underreporting of cycling incidents. J. Transp. Health 2017. [Google Scholar] [CrossRef]
- Aldred, R. Cycling near misses: Their frequency, impact, and prevention. Transp. Res. Part A Policy Pract. 2016, 90, 69–83. [Google Scholar] [CrossRef]
- Winters, M.; Davidson, G.; Kao, D.; Teschke, K. Motivators and deterrents of bicycling: Comparing influences on decisions to ride. Transportation 2011, 38, 153–168. [Google Scholar] [CrossRef]
- Statistics Canada. NHS in Brief: Commuting to Work; Statistics Canada: Ottawa, ON, Canada, 2011. [Google Scholar]
- Hochmair, H.H.; Zielstra, D.; Neis, P. Assessing the completeness of bicycle trail and lane features in OpenStreetMap for the United States. Trans. GIS 2015, 19, 63–81. [Google Scholar] [CrossRef]
- Robertson, R.D.; Mainegra Hing, M.; Pashley, C.R.; Brown, S.W.; Vanlaar, W.G.M. Prevalence and trends of drugged driving in Canada. Accid. Anal. Prev. 2017, 99, 236–241. [Google Scholar] [CrossRef] [PubMed]
- Vanlaar, W.; Robertson, R.; Marcoux, K.; Mayhew, D.; Brown, S.; Boase, P. Trends in alcohol-impaired driving in Canada. Accid. Anal. Prev. 2012, 48, 297–302. [Google Scholar] [CrossRef] [PubMed]
- Ferster, C.J.; Nelson, T.; Winters, M.; Laberee, K. Geographic Age and Gender Representation in Volunteered Cycling Safety Data: A Case Study of Bikemaps.org. In Proceedings of the Annual Meeting of the Transportation Research Board, Washington, DC, USA, 8–12 January 2017. [Google Scholar]
- Monroe, M.; Pennisi, L.; McCaffry, S.; Mileti, D. Social Science to Improve Fuels Management: A Synthesis of Research Relevant to Communicating with Homeowners About Fuels Management. Available online: https://www.nrs.fs.fed.us/pubs/gtr/gtr_nc267.pdf (accessed on 19 June 2017).
- Haklay, M. Why is participation inequality important? In European Handbook of Crowdsourced Geographic Information; Capineri, C., Haklay, M., Huang, H., Antoniou, V., Kettunen, J., Ostermann, F., Purves, R., Eds.; Ubiquity Press: London, UK, 2016; pp. 35–44. [Google Scholar]
- Easley, D.; Kleinberg, J. Network Effects. In Networks, Crowds, and Markets: Reasoning about a Highly Connected World; Cambridge University Press: Cambridge, UK, 2010; pp. 509–542. [Google Scholar]
- Robson, C.; Hearst, M.A.; Kau, C.; Pierce, J. Comparing the use of social networking and traditional media channels for promoting citizen science. In Proceedings of the 2013 conference on Computer supported cooperative work, San Antonio, TX, USA, 23–27 February 2013. [Google Scholar]
- Cardoso, M.; Warrick, E.; Golbeck, J.; Preece, J. Motivational Impact of Facebook Posts on Environmental Communities. In Proceedings of the 19th ACM Conference on Computer Supported Cooperative Work and Social Computing Companion, San Francisco, CA, USA, 26 February–2 March 2016. [Google Scholar]
- Pucher, J.; Komanoff, C.; Schimek, P. Bicycling renaissance in North America? Recent trends and alternative policies to promote bicycling. Transp. Res. Part A Policy Pract. 1999, 33, 625–654. [Google Scholar] [CrossRef]
- Aldred, R.; Woodcock, J.; Goodman, A. Does More Cycling Mean More Diversity in Cycling? Transp. Rev. 2015, 1647, 1–17. [Google Scholar] [CrossRef]
- Stephens, M. Gender and the GeoWeb: Divisions in the production of user-generated cartographic information. GeoJournal 2013, 78, 981–996. [Google Scholar] [CrossRef]
- Le Dantec, C.A.; Watkins, K.E.; Clark, R.; Mynatt, E. Cycle Atlanta and OneBusAway: Driving Innovation Through the Data Ecosystems of Civic Computing. In Lecture Notes in Computer Science (Including Subseries Lecture Notes in Artificial Intelligence and Lecture Notes in Bioinformatics); Springer: Berlin, Germay, 2015; Volume 9171, pp. 327–338. [Google Scholar]
- Coleman, D.J.; Georgiadou, Y.; Labonte, J. Volunteered Geographic Information: The Nature and Motivation of Produsers. Int. J. Spat. Data Infrastruct. Res. 2009, 4, 332–358. [Google Scholar]
- Domroese, M.C.; Johnson, E.A. Why watch bees? Motivations of citizen science volunteers in the Great Pollinator Project. Biol. Conserv. 2017, 208, 40–47. [Google Scholar] [CrossRef]
- Tinati, R.; Luczak-Roesch, M.; Simperl, E.; Hall, W. An investigation of player motivations in Eyewire, a gamified citizen science project. Comput. Hum. Behav. 2017, 73, 527–540. [Google Scholar] [CrossRef]
Figure 1.
The number of daily web sessions on BikeMaps.org (black line) and the timing of promotion events (coloured lines; no scale). See Table 1 for colour key. Note longer y-axis for site-wide sessions.
Figure 1.
The number of daily web sessions on BikeMaps.org (black line) and the timing of promotion events (coloured lines; no scale). See Table 1 for colour key. Note longer y-axis for site-wide sessions.

Figure 2.
The number of incidents reported on BikeMaps.org by day (black bars) and the timing of promotion events (coloured lines; no scale). See Table 1 for colour key. Note longer y-axis for site-wide incidents.
Figure 2.
The number of incidents reported on BikeMaps.org by day (black bars) and the timing of promotion events (coloured lines; no scale). See Table 1 for colour key. Note longer y-axis for site-wide incidents.

Table 1.
Definitions and queries used for OpenStreetMap (OSM) data. Asterisk (*) indicates any combination of zero or more characters.
Table 1.
Definitions and queries used for OpenStreetMap (OSM) data. Asterisk (*) indicates any combination of zero or more characters.
| Cycling Facility | OSM Query | Attributes |
|---|---|---|
| Separated bike lane | highway = cycleway AND foot = no AND surface != (dirt OR gravel OR ground) | -Space for cyclists only: no pedestrians or automobile traffic. -Surface is improved (to distinguish from recreational trails). -Physical separation |
| Painted bike lane | highway = * AND cycleway = lane | -Lines painted on a road shared with automobiles. |
| Local street bikeway | Highway = * AND cycleway:shared | -Space shared with automobiles, usually indicated by signs or painted markings on the road (“sharrows”). |
| Multi-use trail | (highway = cycleway OR highway = path OR highway = footway) AND (bicycle = designated AND foot = designated) OR (bicycle = yes AND foot = yes) AND (surface = (dirt OR gravel OR ground) | -Space shared between cyclists and pedestrians. -Intended to represent major shared paths, but also includes small sections of connecting trail. -Surface is improved (to distinguish from recreational trails) |
Table 2.
Promotion events. Date format is year-month-day. Colour key is for Figure 1 and Figure 2 (8 colour qualitative accent scheme for promotion events from https://colorbrewer2.org).
Table 2.
Promotion events. Date format is year-month-day. Colour key is for Figure 1 and Figure 2 (8 colour qualitative accent scheme for promotion events from https://colorbrewer2.org).
| City | Date | Description | Lead | Medium | Audience | Key |
|---|---|---|---|---|---|---|
| Edmonton | 2016-04-23 | Run, Walk, Ride | Team | In person | Cyclists | |
| 2016-04-28 | MEC 1 Facebook post | Other | Social | General | ||
| 2016-06-11 | Ritchie Bike Day | Team | In person | Cyclists | ||
| 2016-06-12 | Bike to Market | Team | In person | Cyclists | ||
| 2016-06-13 | Swag | Team | In person | Cyclists | ||
| 2016-06-14 | EBC 2 Presentation | Team | In person | Cyclists | ||
| 2016-07-01 | EBC 2 Newsletter | Team | Cyclists | |||
| 2016-07-30 | Heritage Festival | Team | In person | General | ||
| 2016-08-04 | Facebook advertisement | Team | Social | General | ||
| 2016-08-11 | Paths for People Twitter | Other | Social | Cyclists | ||
| 2016-08-18 | SnapChat Geo-filter | Team | Social | General | ||
| 2016-08-25 | Troubadour Cycles FB 3 | Other | Social | Cyclists | ||
| Ottawa | 2016-04-28 | MEC 1 Facebook post | Other | Social | General | |
| 2016-06-02 | Ottawa launch | Team | In person | Cyclists | ||
| 2016-07-12 | Seat cover blitz | Team | In person | Cyclists | ||
| 2016-08-02 | Seat cover blitz | Team | In person | Cyclists | ||
| 2016-08-22 | City of Ottawa Email | Other | Social | Cyclists | ||
| 2016-10-14 | Seat cover blitz | Team | In person | Cyclists | ||
| 2016-12-12 | MetroNews | Other | General | |||
| Victoria | 2016-04-28 | MEC 1 Facebook post | Outside | Social | General | |
| 2016-05-12 | Pre-Bike to Work Week | Team | In person | Cyclists | ||
| 2016-05-19 | Saanich news | Other | General | |||
| 2016-05-25 | Commuter challenge | Team | In person | Cyclists | ||
| 2016-05-30 | Bike to work week | Team | In person | Cyclists | ||
| 2016-05-31 | Bike to work week (Colwood) | Team | In person | Cyclists | ||
| 2016-05-31 | Bike to work week (UVic 4) | Team | In person | Cyclists | ||
| 2016-06-01 | Bike to work week (Saanich) | Team | In person | Cyclists | ||
| 2016-06-02 | Bike to work week (Blenkinsop) | Team | In person | Cyclists | ||
| 2016-06-02 | Bike to work week (UVic 4) | Team | In person | Cyclists | ||
| 2017-01-10 | Times Colonist | Other | General | |||
| Kelowna | 2016-04-28 | MEC 1 Facebook post | Other | Social | General |
1 Mountain Equipment Coop; 2 Edmonton Bike Club; 3 Facebook; 4 University of Victoria.
Table 3.
Counts of promotion events by theme.
| Metric | Edmonton | Ottawa | Victoria | Kelowna |
|---|---|---|---|---|
| Date of first team-led event | 23 April 2016 | 2 June 2016 | 12 May 2016 | NA/ |
| Medium: In Person | 6 | 4 | 8 | 0 |
| Medium: Social | 5 | 1 | 1 | 1 |
| Medium: Print | 1 | 1 | 2 | 0 |
| Audience: Cyclists | 8 | 4 | 8 | 0 |
| Audience: General | 4 | 2 | 3 | 1 |
| Total | 12 | 6 | 11 | 1 |
Table 4.
Counts of promotion events by theme.
| Description | Edmonton | Ottawa | Victoria | Kelowna |
|---|---|---|---|---|
| Total sessions over study period | 880 | 1661 | 2281 | 100 |
| Maximum number daily sessions | 61 | 142 | 91 | 26 |
| Mean daily sessions | 5 | 7 | 9 | 2 |
| SD daily sessions | 7 | 12 | 9 | 4 |
| Count of unique users | 807 | 1512 | 1767 | 90 |
| Ratio of sessions: unique users | 1.1 | 1.1 | 1.3 | 1.1 |
| Percent users female | 39 | 37 | 38 | 53 |
| Percent users older than 35 | 54 | 64 | 60 | 60 |
Table 5.
Incidents reported to BikeMaps.org for the four Canadian cities 16 April 2016 to 15 January 2017.
Table 5.
Incidents reported to BikeMaps.org for the four Canadian cities 16 April 2016 to 15 January 2017.
| Description | Edmonton | Ottawa | Victoria | Kelowna |
|---|---|---|---|---|
| Incidents (count) | 104 | 316 | 216 | 9 |
| Collisions (percent of incidents) | 22% | 13% | 24% | 22% |
| Near misses (percent of incidents) | 40% | 34% | 43% | 33% |
| Hazards (percent of incidents) | 21% | 47% | 26% | 22% |
| Thefts (percent of incidents) | 16% | 5% | 7% | 22% |
| Ratio of sessions: incident mapped | 10 | 6 | 14 | 17 |
| Incidents (collisions and near-misses) with complete age and gender information | 65% | 67% | 68% | 67% |
| Incidents reported by females | 38% | 40% | 31% | 0% |
| Incidents reported by people older than 35 | 56% | 62% | 71% | 100% |
Table 6.
Highlights of high-use events (top 15 by sessions). NA indicates spontaneous high-use events (no concurrent promotion event was identified). Full details are given in Appendix A Table A1.
Table 6.
Highlights of high-use events (top 15 by sessions). NA indicates spontaneous high-use events (no concurrent promotion event was identified). Full details are given in Appendix A Table A1.
| City | Start | End | Promotion Events | Sessions | Incidents | Median Age for Incidents | Gender for Incidents (% Female) |
|---|---|---|---|---|---|---|---|
| Victoria | 16 May 2016 | 3 June 2016 | Saanich news; Bike to work week | 349 | 37 | 32 | 32% |
| Ottawa | 22 August 2016 | 26 August 2016 | City of Ottawa email newsletter | 256 | 65 | 38 | 34% |
| Ottawa | 28 April 2016 | 12 May 2016 | MEC Facebook post | 238 | 31 | 49 | 36% |
| Edmonton | 22 April 2016 | 2 May 2016 | Run, Walk, Ride; MEC Facebook post | 174 | 10 | 42 | 50% |
| Victoria | 26 April 2016 | 4 May 2016 | MEC Facebook post | 172 | 10 | 51 | 60% |
| Victoria | 11 January 2017 | 13 January 2017 | Times Colonist | 150 | 25 | 41 | 31% |
| Ottawa | 12 July 2016 | 20 July 2016 | Seat cover blitz | 142 | 24 | 33 | 33% |
| Edmonton | 13 June 2016 | 17 June 2016 | Swag; EBC Presentation | 133 | 24 | 32 | 27% |
| Victoria | 19 September 2016 | 24 September 2016 | NA | 118 | 7 | 26 | 75% |
| Victoria | 19 June 2016 | 24 June 2016 | NA | 102 | 8 | 51 | 14% |
| Ottawa | 12 December 2016 | 15 December 2016 | MetroNews | 99 | 11 | 51 | 0% |
| Victoria | 6 June 2016 | 10 June 2016 | NA | 78 | 2 | 48.5 | 50% |
| Ottawa | 6 September 2016 | 8 September 2016 | NA | 73 | 6 | 38 | 33% |
| Ottawa | 29 August 2016 | 2 September 2016 | NA | 68 | 10 | 33 | 43% |
| Edmonton | 30 June 2016 | 5 July 2016 | EBC Newsletter | 66 | 19 | 34 | 62% |
Table 7.
Mode share (percent of workers using the mode as their main form of transportation to and from work) from the 2011 National Household Survey (Statistics Canada 2011).
Table 7.
Mode share (percent of workers using the mode as their main form of transportation to and from work) from the 2011 National Household Survey (Statistics Canada 2011).
| City | Personal Vehicle | Public Transit | Walking | Bicycle |
|---|---|---|---|---|
| Edmonton | 82.2 | 11.3 | 4.1 | 1.1 |
| Ottawa | 67.7 | 21.8 | 7.1 | 2.4 |
| Victoria | 70.7 | 11.1 | 10.0 | 5.9 |
| Kelowna | 87.2 | 3.4 | 4.9 | 2.6 |
Table 8.
Bicycle facilities by city (km).
| City | Population 1 | Painted Lane | Separated Lane | Shared Lane | Multi-Use |
|---|---|---|---|---|---|
| Edmonton | 1,366,050 | 27 | 0 | 9 | 301 |
| Ottawa | 934,243 | 260 | 2 | 3 | 98 |
| Victoria | 383,360 | 142 | 0 | 13 | 96 |
| Kelowna | 194,882 | 199 | 0 | 0 | 11 |
1 2016 National Census.
Table 9.
Replies to survey. An asterisk (*) indicates a significant difference in proportions of responses between cities at p = 0.05.
Table 9.
Replies to survey. An asterisk (*) indicates a significant difference in proportions of responses between cities at p = 0.05.
| Item | Response | Edmonton | Ottawa | Victoria | Kelowna | Overall |
|---|---|---|---|---|---|---|
| n (%) | n (%) | n (%) | n (%) | n (%) | ||
| Gender | Female | 297 (59%) | 283 (56%) | 275 (55%) | 160 (53%) | 1016 (56%) |
| Male | 206 (41%) | 218 (47%) | 226 (45%) | 140 (47%) | 790 (41%) | |
| Median Age | Years | 54 | 57 | 58 | 61 | 57 |
| Bicycling is unsafe | Agree | 93 (18%) | 119 (24%) | 125 (25%) | 64 (21%) | 401 (22%) |
| Disagree | 346 (59%) | 329 (66%) | 307 (61%) | 203 (68%) | 1185 (66%) | |
| Don’t know | 64 (13%) | 53 (11%) | 70 (14%) | 33 (11%) | 220 (12%) | |
| Bicycle lanes cause congestion * | Agree | 193 (38%) | 137 (27%) | 138 (27%) | 47 (16%) | 515 (29%) |
| Disagree | 237 (47%) | 290 (58%) | 312 (62%) | 220 (73%) | 1059 (59%) | |
| Don’t know | 73 (15%) | 74 (15%) | 52 (10%) | 33 (11%) | 232 (13%) | |
| If you never ride a bicycle, please describe in your own words why | Physical ability | 71 (33%) | 58 (29%) | 88 (36%) | 59 (43%) | 276 (35%) |
| Safety | 38 (17%) | 37 (18%) | 43 (18%) | 25 (18%) | 143 (18%) | |
| Built environment | 37 (17%) | 43 (21%) | 51 (21%) | 14 (10%) | 145 (18%) | |
| Convenience | 33 (15%) | 35 (17%) | 34 (14%) | 17 (13%) | 119 (15%) | |
| Natural environment | 21 (10%) | 14 (7%) | 9 (4%) | 12 (9%) | 56 (7%) | |
| Access to a bike | 6 (3%) | 6 (3%) | 11 (5%) | 6 (4%) | 29 (4%) | |
| Other | 12 (6%) | 9 (4%) | 7 (3%) | 3 (2%) | 31 (4%) | |
| If you never ride a bicycle, describe what would need to change for you to ride a bicycle | Physical ability | 40 (16%) | 37 (15%) | 55 (17%) | 25 (17%) | 157 (16%) |
| Safety | 30 (12%) | 25 (10%) | 40 (12%) | 13 (9%) | 108 (11%) | |
| Built environment | 79 (31%) | 71 (29%) | 95 (29%) | 50 (34%) | 295 (30%) | |
| Convenience | 20 (8%) | 25 (10%) | 45 (14%) | 22 (15%) | 112 (11%) | |
| Natural environment | 16 (6%) | 16 (7%) | 6 (2%) | 7 (5%) | 45 (5%) | |
| Access to a bike | 31 (12%) | 44 (18%) | 52 (16%) | 16 (11%) | 143 (15%) | |
| Social | 7 (3%) | 6 (2%) | 11 (3%) | 3 (2%) | 27 (3%) | |
| Other | 29 (12%) | 20 (8%) | 28 (8%) | 12 (8%) | 89 (9%) |
© 2017 by the authors. Licensee MDPI, Basel, Switzerland. This article is an open access article distributed under the terms and conditions of the Creative Commons Attribution (CC BY) license (http://creativecommons.org/licenses/by/4.0/).
Share and Cite
MDPI and ACS Style
Ferster, C.; Nelson, T.; Laberee, K.; Vanlaar, W.; Winters, M. Promoting Crowdsourcing for Urban Research: Cycling Safety Citizen Science in Four Cities. Urban Sci. 2017, 1, 21. https://doi.org/10.3390/urbansci1020021
AMA Style
Ferster C, Nelson T, Laberee K, Vanlaar W, Winters M. Promoting Crowdsourcing for Urban Research: Cycling Safety Citizen Science in Four Cities. Urban Science. 2017; 1(2):21. https://doi.org/10.3390/urbansci1020021
Chicago/Turabian StyleFerster, Colin, Trisalyn Nelson, Karen Laberee, Ward Vanlaar, and Meghan Winters. 2017. "Promoting Crowdsourcing for Urban Research: Cycling Safety Citizen Science in Four Cities" Urban Science 1, no. 2: 21. https://doi.org/10.3390/urbansci1020021