
Unequal Landscapes: Vulnerability Traps in Informal Settlements of the Jacuí River Delta (Brazil)
by
 , ,
, ,
Alexandre Pereira Santos
1,* ,
,
Juan Miguel Rodriguez-Lopez
1,
Cleiton Chiarel
2 and
Jürgen Scheffran
1 1
Research Group Climate Change and Security (CLISEC), Institute of Geography, Center for Earth System Research and Sustainability (CEN), University of Hamburg, 20146 Hamburg, Germany
2
Social Sciences Graduate Program, Vale dos Sinos University (UNISINOS), São Leopoldo 93022-750, Brazil
*
Author to whom correspondence should be addressed.
Urban Sci. 2022, 6(4), 76; https://doi.org/10.3390/urbansci6040076
Submission received: 26 September 2022
/
Revised: 20 October 2022
/
Accepted: 25 October 2022
/
Published: 30 October 2022
(This article belongs to the Special Issue Coastal Urban Dynamics under Climate Change)
Abstract
:How just are risk responses that worsen vulnerability in the long term? Should the urban poor be left with self-reliance when facing hazards in the Anthropocene? This research investigates urban development and vulnerability in the Anthropocene. While it is known that informal settlements face greater hazards than most urbanized areas, there are different landscapes of risk. The analysis explores divergent risk-response strategies among households according to their residents’ risk perception and response capacity in two different landscapes of an urban delta using logit regression models. These models evaluate the associations between 14 response options to floods and control for factors of income, age, number of residents in the household, location, access to vehicles, and self-identified ethnicity. This study uses data from the Living with Floods Survey by the World Bank to investigate risk responses to the 2015 flood in the Jacuí River delta. The analysis considers a large sample of households (n = 1451) in informal settlements. The results show the intense influence of income on location choice and response capacity. We also found that income is a more robust social descriptor of response capacity than age or ethnicity. Risk perception proved limited in determining response strategies and can be associated with resignation to losses from floods. We argue that these results suggest trade-offs between short- and long-term responses to hazards in informal settlements in coastal and delta regions, which link adaptive behavior to environmental justice.
1. Introduction
Responses to risk events often require decisions under conditions of high uncertainty. Responses are limited by the capacity to understand risks, assess potential damages, and implement adaptation or coping strategies to prevent losses. Urban poor communities frequently face difficult decisions during these crises, such as relocating to avoid harm, creating potential opportunities for theft in vacated households, or failing to prevent losses of immovable assets (e.g., their houses) located in risk-prone areas. The increasing magnitude of hazard events, the limited support capacity from authorities, and failures in distributing support provision (e.g., during Hurricane Katrina, mostly Black poor were left unattended) raise questions of fairness in pushing the urban poor toward self-reliance during environmental crises, such as coastal or riverine floods [1]. They also present trade-offs between responding to short-term weather shocks and adapting to long-term climate change [2]. These issues demonstrate a research gap in the poverty–vulnerability traps fostered by unequal development. To address this gap, this research seeks to unravel some of the connections between vulnerability [3,4,5] and urban development [6,7] in the Anthropocene [8,9].
The concept of the Anthropocene helps bring to the foreground the degree to which human transformations have altered natural systems on a global scale [10]. It is telling that these changes ushered in a series of impacts that are significantly detrimental to cities, such as rising sea levels and increased frequency of extreme weather events, demonstrating the face of the climate crisis [11]. Cities are a nexus of multiple problems in the climate crisis. On the one hand, urban areas are responsible for most energy consumption and global CO2 emissions (ca. 70%). On the other hand, urban areas are also dangerously exposed to sea-level rise and coastal storms [12]. This paper explores the potential losses and damages for coastal and deltaic cities in the Anthropocene, their connections to environmental justice [13,14], and risk–risk trade-offs (i.e., when there are no risk-safe choices available) [15]. It does so by analyzing flood hazard responses in the delta region of the Jacuí River in Porto Alegre (Brazil). We present this case as an example of the combination of exposure and low coping capacity that is present in many urban deltas globally, but more acutely so in the Global South [16,17,18]. We analyze flood responses to understand the role of risk information and response capacity based on a large sample of households in informal settlements of the delta (n = 1451). Our findings show that structural inequality is the most significant risk differentiator, notably through spatial location and response capacity.
1.1. Urban Development and Compound Effects of Hazards
Global urban growth is marked by unequal patterns of development that lead to differential levels of vulnerability to the impacts of climate change [19]. While cities in developed countries have some measures of risk-management policies and infrastructure in place, many cities in the Global South lack financial resources or coordination for climate adaptation while facing rapid growth and unequal spatial development patterns [20]. Power asymmetries, social norms, and political relations skew infrastructure distribution (e.g., when caste systems or political clout influence the distribution of infrastructure), resulting in the unequal provision of adaptation measures [2,21]. More urbanization does not always result in increased vulnerability [19]; more unequal urban development does, though. More affluent households buy access to safe locations, increasing demand and pushing up prices which excludes the socially vulnerable to exposed areas [22].
Considering the predicted changes in rainfall and extreme weather events, highly vulnerable areas in coastal or deltaic regions will be increasingly challenged [16,23]. In these areas, increased rainfall variability, extreme weather events, and rising sea levels can produce large-scale damage and loss of life [24,25]. Cities in the urban deltas of developing countries face the compounding effects of high exposure and low resistive or responsive capacities [17,26]. Furthermore, urban development patterns in these cities often concentrate on infrastructure and services in small upper-class sectors, leading to increased overall vulnerability.
Unequal urban development is cyclic in nature [27]. Areas with better environmental conditions attract residential demand. This increased demand leads to investment by the market supply sectors (e.g., real estate developers) and higher prices. Investment leads to renewed demand, especially among affluent households, which leads to new investments, and so forth. One of the results of these valuation cycles is the exclusion of low-income households from areas with good environmental quality [22]. The Latin American urban development model [28] exemplifies this process—with preferential investment in areas where the rich, and often powerful, are located to the detriment of the poorer segments of the population [29]—but similar examples may be found in Africa and Southeast Asia (e.g., Lagos and Jakarta) [4].
Public housing and risk-prevention policies often seek to contain or mitigate the risk distribution thus generated but are often insufficient for current or historical demand [30,31]. These development processes effectively exclude many of the urban poor from the formal land market, and environmentally fragile areas become a de facto solution for housing and access to opportunities [32,33]. This condition connects hazards to other social differentiators, such as poverty and ethnicity, since informal, low-income settlements (ILISs) often concentrate poor households from underprivileged ethnicities and are more vulnerable to hazards [14,34,35]. ILISs in urban deltas combine high exposure with other aspects of vulnerability, such as social or ethnic exclusion, low-quality or non-existent infrastructure, little tenure security, and restricted access to resources and services.
Given this setting, this paper considers the following research questions: How do inhabitants of ILISs in delta regions respond to extreme flooding events? What are the factors that condition these responses? This paper presents two possible perspectives, one related to risk perception and the other based on response capacity. The following sections explore response motivation and capacity, the risk–vulnerability relationship, and the empirical research context.
1.2. Risk Response Motivation and Capacity
Behavioral research on risk response often assumes a centrality of risk perception [36]. Many risk models also assume a certain homogeneity of response and rationality among risk-prone actors [37,38]. These assumptions contradict the empirical evidence frequently found in ILISs, where residents invest time, effort, and resources despite looming disaster risks [39]. An argument could be made that risk is one factor considered, along with accessibility to economic opportunities, relative tenure stability, and strong social and family ties. A similar reasoning is found in protection motivation theory (PMT), which decouples risk appraisal from coping appraisal, highlighting the differences between acknowledging a risk and assessing one’s own capacity to withstand it [36].
Furthermore, without the financial possibilities of buying access to land [40], the urban poor have historically developed land occupation and acquisition methods that circumvent formal land markets [29,30,32,41,42]. Location choice for urban families means a risk–risk trade-off: either accept risk to improve access to jobs and services, or seek locations far enough to be cheap but risk social exclusion [27,43,44]. This trade-off establishes a contradiction around risk perception: Some families choose to expose themselves. To test this contradiction, we propose a hypothesis aligned with behavioral risk response theory: (H1) The higher the risk perception, the higher the probability of a response to this risk.
Finally, risk response capacity is often missing where it is most needed [45]. Traditional approaches in risk modeling often assume that risk perception is necessary for an adequate risk response [38], meaning that policies addressing the risk information deficit increase resilience. Contrary to this simplicity, individual agency in hazard response is heterogeneous, given the differences between the perceived efficacy of response against the impacts, individual response implementation capacity, and the cost assessment between responses and potential negative consequences from inaction [46]. These factors are often mediated through social capital [38] or political bias at the individual, family, or community scales [4]. Financial constraints may severely limit response capacity (e.g., not affording transportation costs for evacuation) and increase damages and losses (e.g., when households accumulate their investment in physical, immovable, but fragile assets) [3]. Consequently, the alternative hypothesis (H2) is that the higher the response capacity, the higher the probability of responding to risk.
1.3. Poverty–Vulnerability Traps
Considering the families that somehow choose to settle in risk-prone areas, careful examination of the deciding factors may provide nuanced considerations of behavior that is often described as reckless [47]. One critical factor is possessing some form of tenure (e.g., from legal certificates to collective or ethnic land rights or tolerated, albeit irregular, occupancy) [31]. Another factor is kin relations that allow access to land, supporting social networks, and familiarity with the context [39,48]. Furthermore, the poor may depend on access to more affluent neighborhoods for many economic activities (e.g., service sector jobs or daily work) and opportunities for upward socioeconomic mobility (i.e., for one family generation to ascend to a better socioeconomic condition than the previous generations) [49,50].
The price of land is also a determinant. When urban planning enforcement has little efficacy, risk-prone areas enter the urban land market through informality (i.e., land sold, ceded, or rented, despite having no official approval or certification) [31,41]. The land or buildings available for low-income families often present discounted prices due to low accessibility (e.g., settlements at the edges of urbanization in rural or natural areas), tenure insecurity (e.g., derelict central buildings or unused peripheral plots), hazard incidence (e.g., the flood-prone areas frequent in deltas and coastal regions), or absence of credit for their purchase (e.g., when tenure cannot be proved, or legislation forbids occupation). The discounts thus obtained lower the acquisition threshold, often allowing families to access locations that benefit from market integration and service provision [22]. However, this accessibility is a short-term gain, and hazard incidence or tenure insecurity may lead to unforeseen or variable losses in the long run [23].
Evolving city risk profiles in the Anthropocene mean that risks considered unlikely one or two generations ago are more tangible to the current inhabitants. However, suppose a low-income family has achieved a semblance of stability in a given location, profiting from the investments of previous generations. In that case, the new, higher risk profile presents an unfair trade-off: assume the potential risk of significant losses in the current location from hazards, or absorb certain, albeit limited, losses from starting anew somewhere else. Additionally, some increased vulnerability may be attributed to the settlers in these areas; for example, alterations to the terrain contour at the microscale that increase the risk of flooding or mass movements. This notwithstanding, the overall risk profile has a more significant contribution from technological interventions in other locations, such as altering a river course and reducing floodwater retention areas in the watershed, expanding urbanization, and reducing permeability at the city or regional scale.
Ultimately, low-income families’ location choices occur under pressure from market and political forces, the need to access services, and the evolving risk profiles of informal urban areas. This far-from-trivial decision-making process leads many low-income families to settle into different risk landscapes where they face increased exposure and decreased response capacity and resilience. Over time, repeated hazard impacts on especially vulnerable households establish a cycle in which poverty leads to exposure, which results in losses that increase poverty [22,23]. Cycles such as these can effectively lock specific populations into vulnerable conditions, eliminating conditions for resilience or social mobility. This is a complex process involving different individual and community factors (e.g., family composition and social capital distribution) that may lead to a variety of outcomes, even among the poor. Scholarly research has defined similar conditions as cycles of dispossession [21], climate gentrification [22], or vulnerability traps [4,23].
This context demonstrates the complex relationship between response capabilities and risk perception. This research seeks to investigate whether risk perception or response capacity is the primary driver of response. We are aware that this complexity may not be fully explained by two simple independent and mutually exclusive arguments, as tested in this paper. Furthermore, both statements are possibly related beyond simple contradiction (i.e., the inclusion of one begets the exclusion of the other), may be determined by similar factors, and may not exclude one another. Notwithstanding these limitations, framing a contradiction between risk perception and response capacity allows us to contrast these elements of risk response using a sizable empirical dataset. This design also lays the groundwork for more complex research setups in future work, focusing, for example, on the interrelationships between response capacity and risk perception.
1.4. Urban Floods in Informal Settlements: Components of Anthropogenic and Natural Hazard Exposure in the Jacuí River Delta
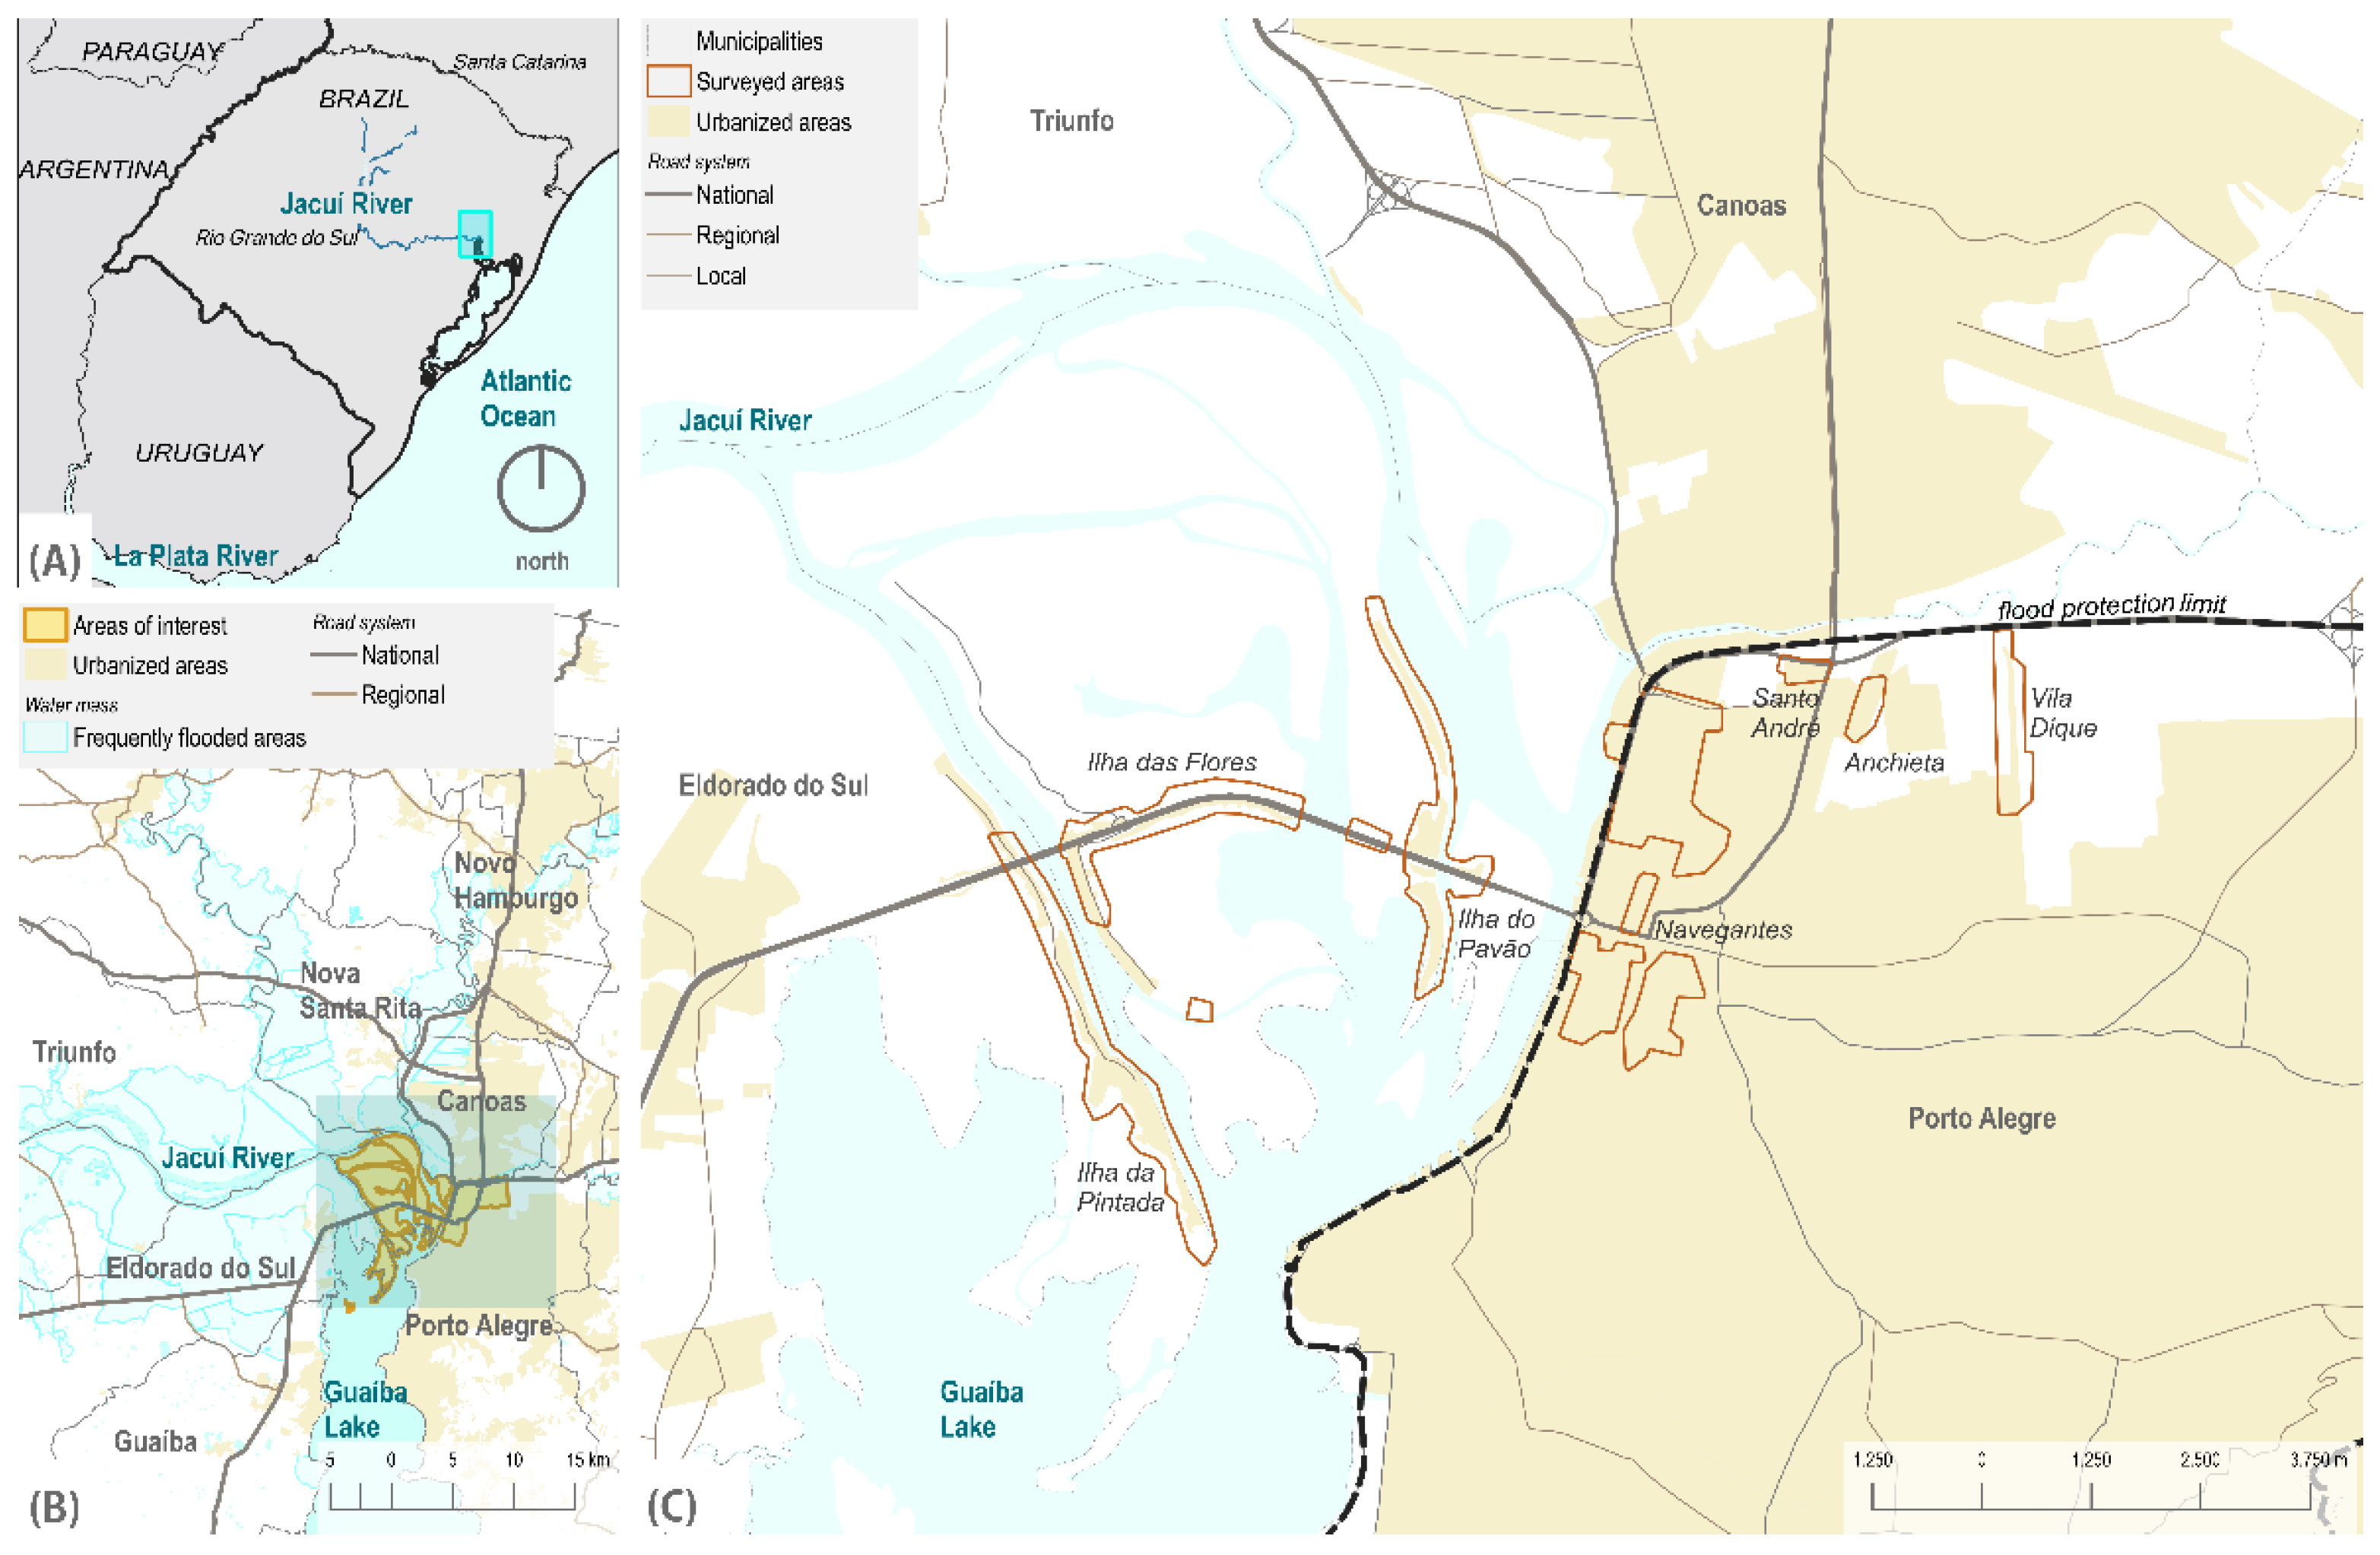
This research focuses on the Jacuí River delta in southern Brazil. This region’s climate is temperate, with no dry season and hot summers [51]. The Jacuí River flows 710 km from the highlands in the northwest of the Rio Grande do Sul state into the Guaíba Lake, forming a delta some 110 km from the Atlantic Ocean with marshes, swamps, inlets, and 30 islands (Figure 1). Climate change will impact the Jacuí delta in the coming century. Robust evidence shows increased flow trends in the Patos Lagoon basin (where the delta is located) and southeastern South America. Future predictions indicate that extreme weather events that lead to floods will be more frequent, including extreme rainfall and tropical cyclones [10,52]. Rising sea levels and southern winds may induce more frequent surges at the Patos Lagoon, damming the Guaíba Lake and resulting in significant flooding when combined with heavy rainfall [53].
The Jacuí River delta occupies 22,836 hectares of the Pampa and Atlantic Rainforest biomes. Land use in the delta includes agriculture, fishing, mining, shipping, and urbanization [54]. The cities of Porto Alegre, Canoas, Nova Santa Rita, Triunfo, Charqueadas, and Eldorado do Sul lie at its margins, housing 1,971,299 inhabitants [55]. Porto Alegre is the capital of Rio Grande do Sul state and the largest city in the delta, with 13.2% of the state population distributed in 471.85 km2 [55].
Two regions in Porto Alegre are among the most affected by fluvial or pluvial flooding: Arquipélago and Humaitá-Navegantes. These regions present different risk landscapes associated with exposure to flooding, built environments, and the socioeconomic composition of their populations. The Arquipélago region has 44.2 km2 of islands integrated into the delta water regime and exposed to riverine flooding [56]. The Arquipélago region also presents a Human Development Index of 0.659, the second lowest in the city [57], and faces critical public security issues (e.g., drug trafficking and organized crime) [58]. The Humaitá-Navegantes region has 15.11 km2 in the “continental” section of the city. In the past, the area had a similar exposure to flooding as the Arquipélago region. To remedy exposure, the city implemented a flood protection system in 1974 with 68 km of walls, levees, and 18 water pump stations [56]. Today, instead of riverine floods, it faces pluvial flooding in the form of chronic stormwater overflow caused partly by the river flood protection system that does not pump water out effectively [59].
Historical records of the water level at Guaíba Lake present major flood events in the delta in 1873, 1928, 1936, 1941, and 1967. The national disaster records database includes additional disasters from 1972–1973, 1988, and 2015. The flood event on 10 October 2015, is considered the most recent large-scale flood event and is the reference for the World Bank investigation analyzed here [58]. The 2015 flood developed after several days of intense rainfall in the Jacuí, Caí, and Gravataí watersheds and an intense southern wind-induced surge from the Patos Lagoon. The water level reached 2.94 m above sea level (2.5 m above its average level). Civil Defence reports indicate the displacement of over 8,300 people in Porto Alegre, an estimated USD 6,369,836 in public service losses, and USD 23,382,041 in housing and infrastructure damages (BRL 19,858,602 and BRL 72,895,850, respectively), equivalent to 13.6% of the city’s yearly GDP [58].
2. Materials and Methods
This research was centered on the primary data from the Living with Floods survey, as presented below. It also employed secondary data (e.g., census and physical datasets) for supporting analysis (e.g., low-income hot spots).
2.1. Survey Structure and Methodological Considerations
The household survey that was the focus of this paper was part of a broader investigation by the World Bank and the Porto Alegre municipal government. The World Bank investigated the legal, financial, and local governance structures related to flood risk management using secondary data, and implemented a survey to collect primary data and examine the direct and indirect social impacts of flooding. The survey offered a structured questionnaire to residents in the Arquipélago and Humaitá-Navegantes regions. The World Bank published survey methods [60] and a report [58] in their channels. For this paper, we independently accessed and analyzed the microdata from the household survey to present it for the first time in a peer-reviewed format.
The survey examined the perceived risks and impacts of the October 2015 flood and investigated four types of vulnerabilities—physical (households and their immediate surroundings), socioeconomic, institutional, and community-related—and vulnerability from risk perception (or lack thereof). Toward this aim, the survey presented 161 questions organized into four groups: risk perception and willingness to adapt, social and economic impacts of floods, response measures adopted after the 2015 event, and the socioeconomic characteristics of the residents [58].
2.2. Data Collection, Correction, and Validation
The World Bank wanted to improve the accuracy of information about flooded areas, because there were no previous studies exclusively on them in this region [58]. Previously available information on floods came from impact estimations (e.g., physical modeling of flood surfaces), Civil Defence reports, and the national population census. The latest Brazilian census occurred in 2010 and presented two problems. One is that the World Bank investigation was already in the late stage of the 10-year census wave; the survey took place seven years after the census. Second, the smallest census spatial unit was the “tract,” which did not separate flooded and non-flooded areas. These problems add bias to the data in the form of outdated population estimates and homogeneous demographics about different population groups. The areas present fluctuation in the resident population that heightens the impact of outdated data. Furthermore, data in these areas are difficult to collect, as organized crime often restricts access to outside surveyors (including those of the census).
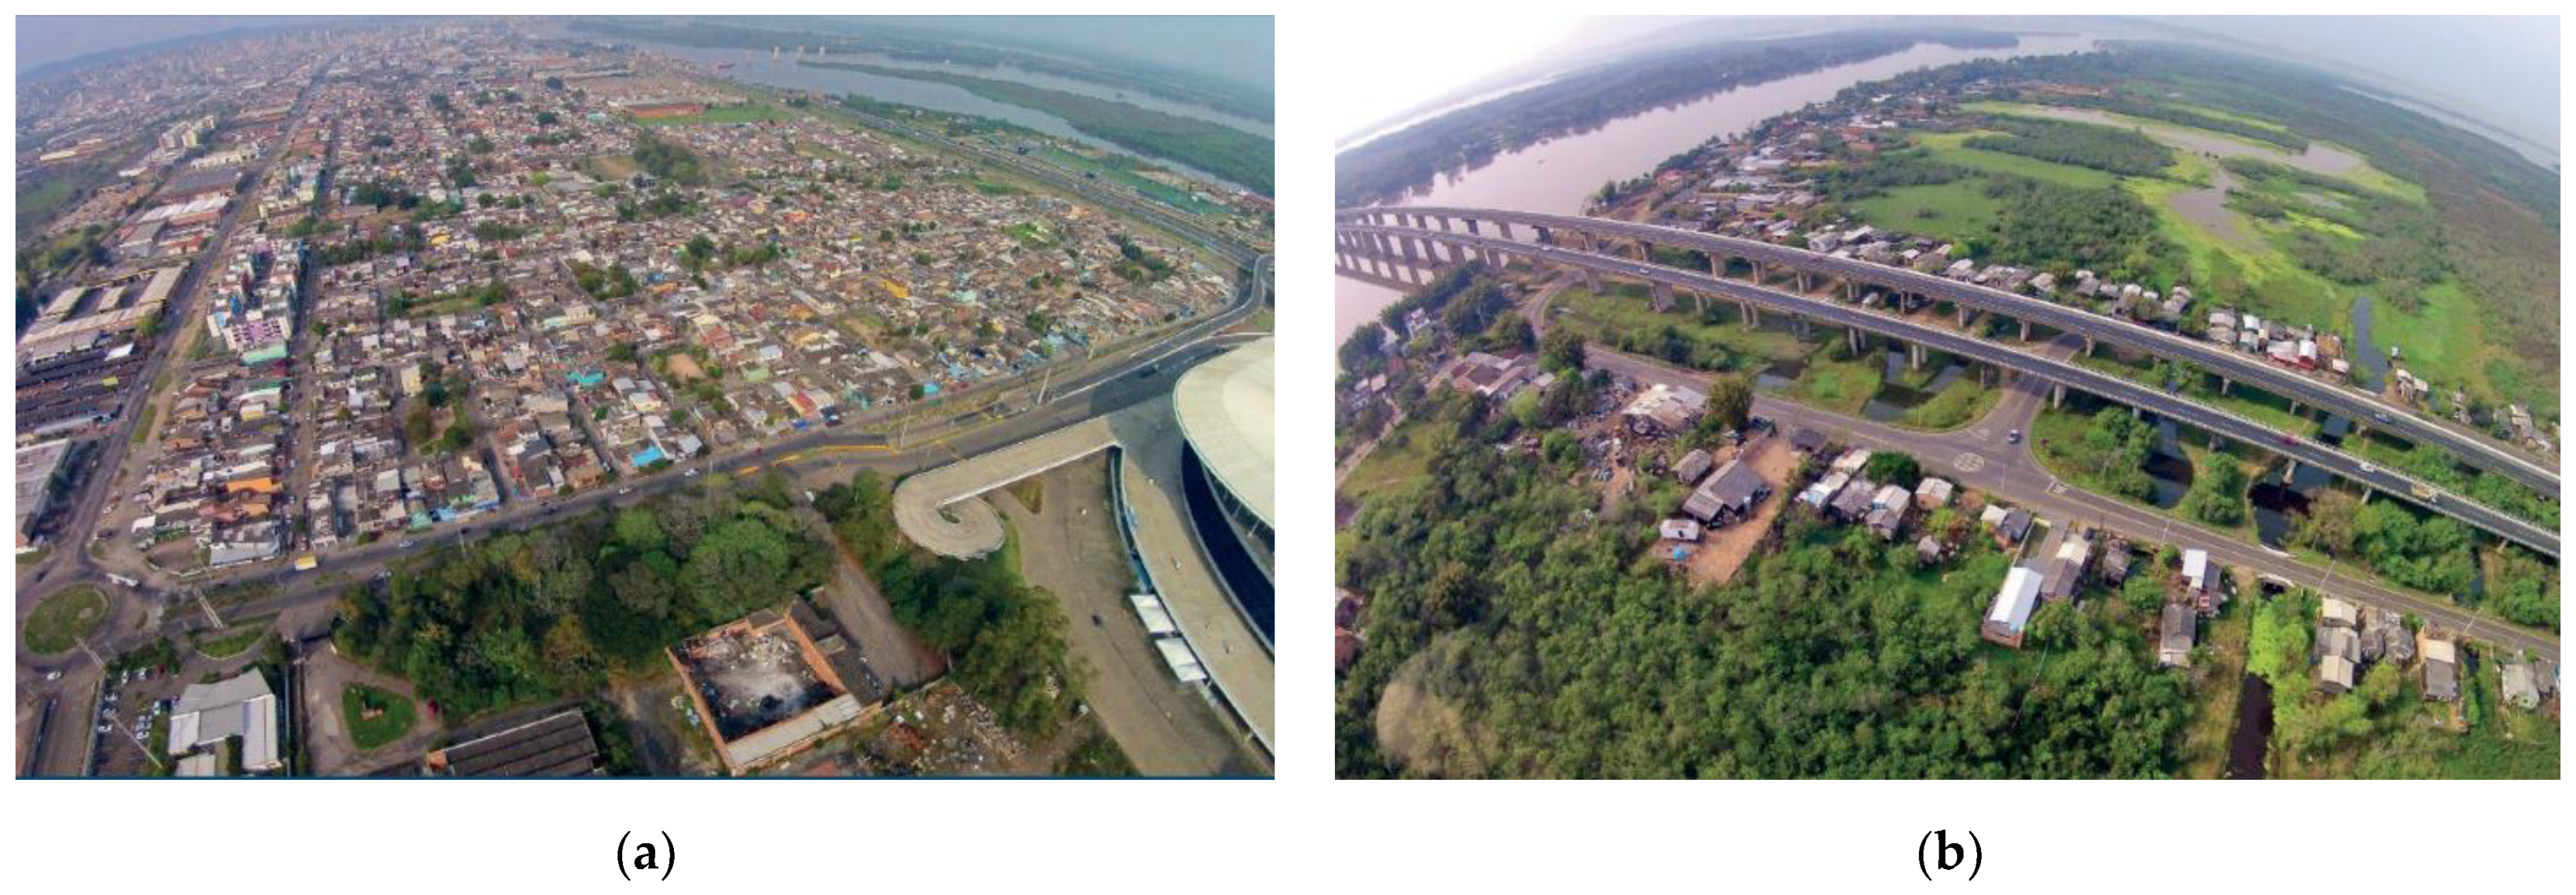
The World Bank local survey team collected household data for two months, in June and July 2017, following a sampling proportion of flood-prone households in each census tract of the areas of interest. The areas of interest included the Arquipélago and Humaitá-Navegantes administrative regions of Porto Alegre. Figure 2 presents the urban landscape of the research sites: the more intense urbanization in the flood-protected region in Humaitá-Navegantes and the peri-urban, informal, and risk-prone setting of Arquipélago, respectively. Figure 1 shows the locations of the areas of interest.
The survey team was composed of the World Bank staff, responsible for management, methods, and supervision, and a local professional surveyor team. The surveyors interviewed residents in Portuguese for about 40 min during household visits, and the residents provided information on all the answers. The team designed the sample around the ca. 8500 households in flood-prone areas of the Arquipélago and Humaitá-Navegantes regions [58]. The sample’s most prominent criterion was spatial distribution (i.e., being affected by flooding), adopting sampling quotas proportional to the census tract population of approximately 17% of the total population in each tract of the flooded regions. The team did not consider other sample distribution criteria (e.g., gender, age, or other) because of high population fluctuation, outdated census data, and security concerns. Public safety played a significant part in the survey implementation, and local power structures and organized crime limited access to the population. Notwithstanding these limitations, the high sample proportion limits sampling bias and provides sufficient response variety among the selected population. Furthermore, the World Bank dataset is the first to specifically investigate these flooded areas, improving the outdated and imprecise previous data and providing a benchmark for future studies.
2.3. Data Analysis
The authors of this investigation received, from the World Bank, a sample of 5474 individual anonymized answers from 1484 households as a spreadsheet (i.e., an Excel XLS file). From these households, we discarded 33 responses, as they contained incomplete data, leaving 1451 households for analysis. The data identified the regions where households were located (e.g., Arquipélago, Humaitá-Navegantes), but no disaggregation within these regions. We prepared and recoded the data as necessary for analysis, identifying the data type (e.g., categorial, continuous), correcting punctuation and data format, and simplifying data units (e.g., converting all temporal data into hours). We recoded the variables into numerical keys (i.e., dummy variables) to process the data in the regression models. After preparation, we implemented regression models and generated descriptive statistics. The Supplementary Material includes the Python (data preparation) and Stata (regression models) codes, and the data used in the analyses.
The analyses included an initial, global, and exploratory association analysis of the dataset, which indicated a set of variables representing risk perception and risk response with more frequent associations. To test the hypothesis that risk perception is a critical response driver (H1), we used regression models, with risk perception as the dependent variable and risk responses as the independent variables. To test the hypothesis that response capacity (i.e., capacity to respond by short-term coping or long-term adapting) explains risk response (H2), we added the control variables of income, age, self-identified ethnicity, access to cargo vehicles, and the number of residents per household. The assumption was that having more significant income and access to transportation means increased capacity. At the same time, older residents living in more populous households and of Black or Pardo ethnicities would have lower capacity.
We also tested for additional variables (e.g., education, employment, and gender), but the results were not statistically significant or suffered from collinearity. The analysis’s primary purpose was to measure the influence of risk perception and capacity variables on effective risk response, mainly looking for alternative or complementary explanations. We opted for a logistic regression specification due to the binary character of our dependent variable (risk response), and we decided on the well-known logit method [61].
We additionally performed a hot spot analysis of poverty in the areas of interest. The research used the Getis-Ord Gi* [62,63] statistic to identify the region’s significant concentrations of poverty. This study implements the optimized hot spot analysis in ArcGIS Pro, which automatically adjusts model parameters for multiple testing and spatial dependence. The input data for the hot-spot analysis were point features derived from census information [64] at the tract scale (finer scale available).
3. Results
3.1. Characteristics of the Sample
The sample included all residents from the surveyed households, and the information came from self-identification. Most residents were young (32.28 mean, 21.73 S.D.), had a low level of education, and had a low monthly income (USD 390.06 mean, 430.18 S.D.), with many family members sharing the same household (4.58 mean persons per house, 2.27 S.D.). Precarious employment or unemployment was frequent among active working-age residents (42.23% of households).
There was a substantial difference between the neighborhoods within the city’s flood protection system and those on the delta islands, describing the two risk landscapes seen in Figure 3. The hot spot analysis shows that all areas in the Arquipélago region were poverty hot spots with a 99% confidence level. A similar pattern was present in three areas of the Humaitá-Navegantes region, notably in the Humaitá neighborhood and Vila Dique. The data for the surveyed households are presented in Table 1. Those on the islands had a lower percentage of non-white ethnicities and were younger. The most significant disparity, though, was in risk perception, which was much more prevalent among those living on the islands, suggesting an association with frequent past-hazard experience.
The sampled households resided in areas affected by the 2015 floods, albeit to different degrees depending on the risk landscape they are located in. Most households (79%) had single-story houses. Stilts were part of the building tradition of the Arquipélago region, but residents had recently replaced them with stone masonry foundations, perceiving the latter as more modern, even if more exposed. Exposed brick masonry was the most common building standard, but 11% of households were composed of reused wood and were very vulnerable. Many houses presented open-air sewage (24%) and deposits of garbage or construction debris (30%) in their immediate environments. Most residents in the sample (80.4%) declared that they owned their houses. Still, tenure security is a persistent issue in the area [58], and further information is necessary to determine its degree of formality.
3.2. Risk Perception
Risk perception was low among residents, as reported in the form of knowledge about potential exposure, as presented in Table 2. The survey structure established that only households affected by the 2015 floods (826, 56.93% of the total) answered the question about potential exposure. About 19.92% of these households knew about their exposure (n = 289), and 246 were located outside the flood protection system. Only 5.51% of households estimated that water could reach the levels of the 2015 flood. Most of these were outside the flood-protected areas. Despite the low previous risk perception, future risk expectations were high, as presented in Table 3. Most households expected their house to flood in the next ten years, as 69.75% thought it was inevitable or probable (n = 1012).
3.3. Risk Response
Table 4 shows that the most frequent risk response was to adapt the household’s interior by lifting furniture or objects (52.38%, n = 760). The second most frequent response was preparation before the flood (31.08%, n = 451). Turning off the power was third (30.05%, n = 436), followed by household evacuation (26.26%, n = 381). Less frequent responses included passive coping mechanisms in the form of prayer (23.57%, n = 342), modifying the house’s exterior to prevent damage (moving vehicles, animals, and objects to higher places, 22.47%, n = 326), or placing obstacles around the house to prevent interior flooding (12.06%, n = 175). Responses based on community reliance, social capital, or support from authorities account for smaller proportions. Only 8.75% (n = 127) of households sought help from the authorities or community leaders, 8.27% (n = 120) provided other family and community members with information, and fewer still sought information or participated in support groups (n = 49 and 30, respectively).
Response strategies varied greatly depending on the location of the household, as expected. Of the 14 possible responses, the families outside the flood protection system adopted risk responses (n = 8) much more frequently than those inside the protection system. The distribution of answers stating that they evacuated and stocked food reserves was the most dissimilar between the protected and unprotected regions. Of the total households adopting these risk responses, 90% were in unprotected areas. The second group of responses followed, with roughly 80% concentration among those unprotected: asking for help, adjusting the interior, turning off power, seeking and providing information on responses, and joining a community group.

Table 1.
Identification of variables for the study in the original database.
| Variable | Description | |||
|---|---|---|---|---|
| Risk response | Categorical scale, non-ordered. RP1 = Evacuate, RP2 = Turn off power, RP3 = Place obstacles to block water entry, RP4 = Adjust house’s interior: move objects higher, RP5 = Adjust house’s exterior: move objects higher, RP6 = Stock up food, RP7 = Seek information, RP8 = Join a community alert group, RP9 = Ask for help from leader or Civil Defence, RP10 = Provide information about what to do, RP11 = Pray, RP12 = Other, RP13 = Nothing, there was no time, RP14 = Adapt the household to flooding before the event. | |||
| Ethnicity | Categorical scale, non-ordered. ETC = White, ETB = Black, ETN = Native, ETP = “Pardo” | |||
| Variable | Description (range) | Flood protection status | Households by flood protection status | Households total |
| Flood protection status | 1 = inside flood-protected areas, 2 = outside flood-protected areas | 1 = protected | 592 (40.80%) | 1451 (100%) |
| 2 = unprotected | 859 (59.20%) | |||
| Variable | Description (range) | Flood protection status | Mean by status of households (S.D.) | Mean in all households (S.D.) |
| Risk perception (RPC) | 1 = NA, 2 = Knew household could be flooded, 3 = Did not know (1–3) | 1 = protected | 1.53 (0.84) | 1.9 (0.89) |
| 2 = unprotected | 2.17 (0.84) | |||
| Gender (GEN) | 1 = NA, 2 = Female, 3 = Male (1–3) | 1 = protected | 2.46 (0.53) | 2.48 (0.50) |
| 2 = unprotected | 2.50 (0.54) | |||
| Cargo capacity (CCA) | 1 = NA, 2 = Small capacity only, 3 = Large capacity (1–3) | 1 = protected | 2.72 (0) | 2.74 (0.50) |
| 2 = unprotected | 2.77 (0.47) | |||
| Number of residents in household (NRS) | Numerical (1–19) | 1 = protected | 4.74 (2.32) | 4.58 (2.27) |
| 2 = unprotected | 4.47 (2.26) | |||
| Monthly income (INC) | Numerical, USD (00.00–4811.40) | 1 = protected | 425.90 (439.22) | 390.06 (430.18) |
| 2 = unprotected | 370.19 (422.33) | |||
| Age (AGE) | Numerical, years (0–120) | 1 = protected | 33.50 (22.72) | 32.28 (21.73) |
| 2 = unprotected | 31.40 (20.99) | |||
Table 2.
Flood risk perception among households.
| Variable | Description | Flood Protection Status | 1 = Yes | 2 = No | 3 = No Answer | Total | |
|---|---|---|---|---|---|---|---|
| By Household Status | In All Households | ||||||
| Flood impact in 2015 | Was this house/building flooded in October 2015? | 1 = protected | 173 (11.92%) | 826 (56.93%) | 574 (39.56%) | 51 (3.51%) | 1451 (100%) |
| 2 = unprotected | 653 (45.00%) | ||||||
| Previous knowledge about risk exposure | Did you already know this house or building could be flooded? | 1 = protected | 43 (2.96%) | 289 (19.92%) | 498 (34.32%) | 664 (45.76%) | 1451 (100%) |
| 2 = unprotected | 246 (16.95%) | ||||||
| Hazard impact estimation | Did you imagine the water could reach that level when you built or moved here? | 1 = protected | 15 (1.03%) | 80 (5.51%) | 707 (48.73%) | 664 (45.76%) | 1451 (100%) |
| 2 = unprotected | 65 (4.48%) | ||||||
Table 3.
Future flood risk assessment among households.
| Flood Protection Status | 1 = Certainly or Probably | 2 = Not Likely or Not at All | 3 = No Answer | Total | ||||
|---|---|---|---|---|---|---|---|---|
| By Household Status | In All Households | By Household Status | In All Households | |||||
| Future risk expectation | Do you believe your home may be flooded in the next ten years? | 1 = protected | 362 (24.95%) | 1,012 (69.75%) | 196 (13.51%) | 359 (24.74%) | 80 (5.51%) | 1451 (100%) |
| 2 = unprotected | 650 (44.80%) | 163 (11.23%) | ||||||
Table 4.
Bivariate analysis of risk response options against household location.
| At this Point [When the Water Reached the House], What Have You Done to Protect Yourself and the House? | Flood Protection Status | Risk Response Option Frequency among Households | |
|---|---|---|---|
| By Household Status | In All Households | ||
| Evacuate (RP1) | 1 = protected | 35 (2.41%) | 381 (26.26%) |
| 2 = unprotected | 346 (23.85%) | ||
| Turn off power (RP2) | 1 = protected | 106 (7.31%) | 436 (30.05%) |
| 2 = unprotected | 330 (22.74%) | ||
| Place obstacles to block water entry (RP3) | 1 = protected | 82 (5.65%) | 175 (12.06%) |
| 2 = unprotected | 93 (6.41%) | ||
| Adjust interior (RP4) | 1 = protected | 168 (11.58%) | 760 (52.38%) |
| 2 = unprotected | 592 (40.80%) | ||
| Adjust exterior (RP5) | 1 = protected | 61 (4.20%) | 326 (22.47%) |
| 2 = unprotected | 265 (18.26%) | ||
| Stock food reserves (RP6) | 1 = protected | 16 (1.10%) | 177 (12.20%) |
| 2 = unprotected | 161 (11.10%) | ||
| Seek information (RP7) | 1 = protected | 12 (0.83%) | 49 (3.38%) |
| 2 = unprotected | 37 (2.55%) | ||
| Join a community alert group (RP8) | 1 = protected | 7 (0.48%) | 30 (2.07%) |
| 2 = unprotected | 23 (1.59%) | ||
| Ask for help (RP9) | 1 = protected | 19 (1.31%) | 127 (8.75%) |
| 2 = unprotected | 108 (7.44%) | ||
| Provide information (RP10) | 1 = protected | 27 (1.86%) | 120 (8.27%) |
| 2 = unprotected | 93 (6.41%) | ||
| Pray (RP11) | 1 = protected | 98 (6.75%) | 342 (23.57%) |
| 2 = unprotected | 244 (16.82%) | ||
| Other (RP12) | 1 = protected | 221 (15.23%) | 274 (18.88%) |
| 2 = unprotected | 53 (3.65%) | ||
| Nothing. There was no time (RP13) | 1 = protected | 74 (5.10%) | 128 (8.82%) |
| 2 = unprotected | 54 (3.72%) | ||
| Prepare before the flood (RP14) | 1 = protected | 120 (8.27%) | 451 (31.08%) |
| 2 = unprotected | 331 (22.81%) | ||
3.4. Association between Variables under the Logistic Regression Approach
We analyzed the data with logistic regression models, where risk response was the dependent variable. We regressed each response option separately on risk perception (in the form of previous knowledge of exposure) and residents’ socioeconomic and location characteristics. While Table 1 presents the descriptive statistics for these variables, Table 4 presents an example of the six models run for each risk-response option (RP1–RP14). In these models, we added the control variables stepwise to test the robustness of the main effect (risk perception, [RPC]) and alternative explanations. Model 85 thus tests only against the main effect, model 86 tests for RPC and adds income (INC), and so on until model 90, which includes RPC, INC, age (AGE), ethnicity (ETC, ETN, ETP, and ETB), number of residents (NRS), and limited transportation capacity (CCA). For the models, we used individual-level survey data to account for different ethnicities, ages, and incomes within each household. We ran these model combinations and response options, grouping residents into sets: (a) with residents located in all areas (n = 5291 residents, models 1–84), and two sets classified according to their location, (b) with residents in the flood-protected risk landscape of Humaitá-Navegantes (n = 2194 residents, models 85–168) and (c) with residents in the unprotected risk landscape of Arquipélago (n = 3097 residents, models 169–252). The 252 models thus generated feature in the Supplementary Materials.
Table 5 presents the logit regression results for the “evacuate the area” risk response for set (b). Significant factors include risk perception, income, and the number of people in the household (negative association), as well as age and “Pardo” ethnicity (positive association). We checked the specifications of models 85–90 with the chi-squared test of each model. The results varied between 22.36 (0.00) and 53.46 (0.00) for models 85 and 90, respectively. We report R2 as usual in logistic regressions [61].
Table 6 presents the results for set (c). Significant variables are income, Black ethnicity, and the number of people in the household (negative association). We tested the specifications of the models using the chi-squared method. In the logistic regressions, the chi-squared test generated values between 0.05 (0.83) and 66.11 (0.00) for models 169 and 174, respectively. This test evaluated whether all variables were significant, rejecting this hypothesis with at least a 5% probability, as usual. Ultimately, this model accepts the test as valid because at least one of the explanatory variables affected the response “evacuate the area” and explains whether the residents evacuate or not. We report the R2 to describe the model’s explanatory power, but it should be interpreted cautiously as recommended by the literature because logistic regressions present considerable uncertainty in this measure [61].
Table 7 compares the models with all dependent variables (e.g., models 90 and 174, above) for each risk-response option for the three sets of residents: (a), (b), and (c). In this table, we present only the significant associations between variables graphically coded for positive (■ and ☐, at 0.01 or 0.05 significance levels, respectively) or negative associations (● and ○, similar significance levels).
As expected, the results suggest divergent strategies between locations. The results show a general agreement between the responses of set (a) and those of set (c), which is intuitive, as the residents in the latter consisted of 58.53% of the former. Sets (a) and (c) had more frequent significant associations than set (b), which can be explained by the lower number of observations in the latter (mean 585 observations in [b], 2089 in [c], and 2772 in [a]).
The commonality between all sets is the influence of income, which is the most frequently associated factor. Income was negatively associated with evacuations and was positively associated with preparation before floods. One substantial difference between the sets is risk perception. First, it is mainly associated with variables within sets (a) and (c). In set (a), it is positively associated with RP1, evacuation, while in both sets, it is negatively associated with strategies connected to staying in the household during the flood: RP2, powering off, and RP3, placing obstacles to prevent flooding of the house. It is also negatively associated with responses connected with social capital—RP7, seek information, RP8, join community group, and RP9, ask for help from the authorities—in both sets. These results contradict hypothesis H1 in favor of H2, as discussed below.
Concerning response strategies, the most frequent association among all sets is RP1, evacuation. Counterintuitively, it has more significant associations within set (b), where fewer evacuations took place (2.41% of households). It is positively associated with Caucasian, Pardo, and Black self-perceived ethnicities, and negatively with risk perception, income, and the NRS. In set (c), families evacuated more frequently (23.85% of households); the associations were negative to income and Black self-perceived ethnicity, and positive to the NRS. RP1 has opposing associations with the NRS in each household: negative for set (b) and positive for (c). Social capital responses (RP 7–10) mainly had negative associations in all sample sets. Reliance on public authorities is reported by RP9, which presents negative associations with income, age, and risk perception.
Table 5.
Logit regression analysis for set (b): residents inside the flood protection system for risk-response alternative RP1: evacuate the area. Acronyms follow the definitions in Table 1.
Table 5.
Logit regression analysis for set (b): residents inside the flood protection system for risk-response alternative RP1: evacuate the area. Acronyms follow the definitions in Table 1.
| Variable | Model 85 | Model 86 | Model 87 | Model 88 | Model 89 | Model 90 |
|---|---|---|---|---|---|---|
| Did you know about flooding? Yes (RPC) | −1.074 ** (0.0) | −0.8814 ** (0.0) | −0.8829** (0.0) | −0.7441 ** (0.003) | −0.8952 ** (0.0) | −0.8524 ** (0.001) |
| Monthly income (INC) | −0.0007 ** (0.0) | −0.0007** (0.0) | −0.0007 ** (0.0) | −0.0007 ** (0.0) | −0.0008 ** (0.0) | |
| Age (AGE) | 0.0006 (0.911) | −0.0063 (0.319) | 0.001 (0.86) | −0.0062 (0.335) | ||
| Caucasian (ETC) | −0.1462 * (0.013) | 12.9931 (0.99) | 18.7544 ** (0.0) | |||
| Native (ETN) | 13.8464 (0.989) | 19.7517 (.) | ||||
| Pardo (ETP) | 13.0029 (0.99) | 18.9396 ** (0.0) | ||||
| Black (ETB) | 12.6047 (0.99) | 18.5492 ** (0.0) | ||||
| How many people live in this household now? (NRS) | −0.1442 * (0.02) | |||||
| Small cargo capacity transportation mode only (CCA) | 0.5754 (0.118) | |||||
| Number of observations | 672 | 614 | 614 | 614 | 614 | 614 |
| chi2 | 22.3588 | 39.2620 | 39.2745 | 46.5209 | 44.0775 | 53.4634 |
| Prob > chi2 | 0.0000 | 0.0000 | 0.0000 | 0.0000 | 0.0000 | 0.0000 |
| Pseudo R2 | 0.0395 | 0.0767 | 0.0767 | 0.0909 | 0.0861 | 0.1045 |
Dependent variable: Risk perception. ** and * denote significance at the 0.01 and 0.05 levels, respectively.
Table 6.
Logit regression analysis for set (c): residents outside the flood protection system for risk-response alternative RP1: evacuate the area. Acronyms follow the definitions in Table 1.
Table 6.
Logit regression analysis for set (c): residents outside the flood protection system for risk-response alternative RP1: evacuate the area. Acronyms follow the definitions in Table 1.
| Variable | Model 169 | Model 170 | Model 171 | Model 172 | Model 173 | Model 174 |
|---|---|---|---|---|---|---|
| Did you know about flooding? Yes (RPC) | 0.0182 (0.832) | 0.0494 (0.585) | 0.042 (0.643) | 0.0263 (0.774) | 0.0058 (0.949) | −0.0129 (0.89) |
| Monthly income (INC) | −0.0001 ** (0.003) | −0.0001 ** (0.008) | −0.0001 ** (0.006) | −0.0001 * (0.027) | −0.0001 ** (0.007) | |
| Age (AGE) | −0.0074 ** (0.001) | −0.0043 (0.065) | −0.0076 ** (0.001) | −0.0045 (0.055) | ||
| Caucasian (ETC) | 0.0944 ** (0.0) | −0.574 (0.072) | −0.5439 (0.091) | |||
| Native (ETN) | −0.2606 (0.564) | −0.1484 (0.744) | ||||
| Pardo (ETP) | −0.013 (0.969) | 0.028 (0.933) | ||||
| Black (ETB) | −0.7101 * (0.047) | −0.7537 * (0.037) | ||||
| How many people live in this household now? (NRS) | 0.1034 ** (0.0) | |||||
| Small cargo capacity transportation mode only (CCA) | 0.2008 (0.101) | |||||
| Number of observations | 2.277 | 2.065 | 2.065 | 2.049 | 2.065 | 2.049 |
| Chi2 | 0.0450 | 10.1098 | 21.7742 | 33.8552 | 49.6160 | 66.1073 |
| Prob > chi2 | 0.8319 | 0.0064 | 0.0001 | 0.0000 | 0.0000 | 0.0000 |
| Pseudo R2 | 0.0000 | 0.0035 | 0.0076 | 0.0119 | 0.0174 | 0.0233 |
Dependent variable: Risk perception. ** and * denote significance at the 0.01 and 0.05 levels, respectively.
Table 7.
Synthesis of regression models for risk response and risk perception for sets: (a) all residents (risk landscapes 1 and 2), (b) residents in flood-protected areas (risk landscape 1, Humaitá-Navegantes), and (c) residents outside flood-protected areas (risk landscape 2, Arquipélago). Acronyms follow the definitions in Table 1.
| Set (a) all households (risk landscapes 1 and 2) | |||||||||||||||||||||||||||||
|---|---|---|---|---|---|---|---|---|---|---|---|---|---|---|---|---|---|---|---|---|---|---|---|---|---|---|---|---|---|
| RP1 | RP2 | RP3 | RP4 | RP5 | RP6 | RP7 | RP8 | RP9 | RP10 | RP11 | RP12 | RP13 | RP14 | ||||||||||||||||
| RPC | ■ | ● | ● | ○ | ● | ● | |||||||||||||||||||||||
| INC | ● | ■ | ● | ● | ● | ■ | ☐ | ||||||||||||||||||||||
| AGE | ● | ● | ☐ | ||||||||||||||||||||||||||
| ETC | ○ | ☐ | ☐ | ● | |||||||||||||||||||||||||
| ETN | ○ | ■ | ○ | ||||||||||||||||||||||||||
| ETP | ☐ | ☐ | ● | ● | |||||||||||||||||||||||||
| ETB | ● | ○ | ○ | ● | |||||||||||||||||||||||||
| NRS | ■ | ○ | ☐ | ● | |||||||||||||||||||||||||
| CCA | ■ | ☐ | ● | ||||||||||||||||||||||||||
| Set (b) households in flood-protected areas (risk landscape 1, Humaitá-Navegantes) | Set (c) households outside flood-protected areas (risk landscape 2, Arquipélago) | ||||||||||||||||||||||||||||
| 1 | 2 | 3 | 4 | 5 | 6 | 7 | 8 | 9 | 10 | 11 | 12 | 13 | 14 | 1 | 2 | 3 | 4 | 5 | 6 | 7 | 8 | 9 | 10 | 11 | 12 | 13 | 14 | ||
| RPC | ● | ■ | ○ | ● | RPC | ● | ● | ○ | ● | ● | ● | ||||||||||||||||||
| INC | ● | ■ | ■ | ● | ☐ | INC | ● | ■ | ● | ● | ○ | ● | ■ | ■ | ☐ | ||||||||||||||
| AGE | ☐ | ■ | ☐ | AGE | ● | ||||||||||||||||||||||||
| ETC | ■ | ETC | ☐ | ● | |||||||||||||||||||||||||
| ETN | ETN | ○ | |||||||||||||||||||||||||||
| ETP | ■ | ETP | ☐ | ● | ○ | ● | |||||||||||||||||||||||
| ETB | ■ | ETB | ○ | ||||||||||||||||||||||||||
| NRS | ○ | ● | ☐ | ■ | ● | NRS | ■ | ■ | ■ | ☐ | ○ | ○ | |||||||||||||||||
| CCA | ● | ☐ | ☐ | CCA | ☐ | ■ | ■ | ○ | ☐ | ● | |||||||||||||||||||
Colors represent location. Black = all areas, blue = protected areas, and red = unprotected areas. ● and ○ = denotes a negative association with significance at the 0.01 and 0.05 levels, respectively. ■ and ☐ = denotes a positive association with significance at the 0.01 and 0.05 levels, respectively.
4. Discussion
The literature on resilient and adaptive behavior has gradually shifted from perfect rationality toward models based on social capital, cognition, and community influence [38]. Social motivation theories (e.g., PMT) place distinctions between response efficacy, the capacity to implement responses, and the cost assessment between responses and potential impacts [36]. These shifts acknowledge the complexity of making decisions in uncertain, dangerous situations such as flood events [46]. Approaches that consider entitlements, assets, and livelihoods have increased this complexity [19]. These approaches pose frequent trade-offs in avoiding short-term environmental hazards that may lead to exposure to new or increased economic, political, or social risks in the long run [3,4]. On the individual level, psychological factors such as attachment to place, belief in change, and feeling of control inform decisions critically, as do capacities based on mobility, employability, and social networking [65]. Consequently, risk-response decisions are anything but trivial and warrant investigation that considers social response patterns from the bottom up.
This study investigated individual and household responses with statistically significant empirical data from socially vulnerable, low-income communities in the Jacuí River delta. Our study focused on risk perception and risk-response capacity in flood-prone regions, considering the two competing hypotheses that risk perception is the critical driver of response (H1) or that risk-response capacity drives responses (H2). The results from logit regression models run for 14 risk-response options allow us to reject H1 in favor of H2, as presented in Table 7, exemplified in Table 5 and Table 6, and discussed below.
On the first level, these models indicate that location and income are the principal factors in risk response. The location’s role is clear, as responses were more intense in the areas exposed to riverine floods, demonstrated by the number of households affected by the floods in the Arquipélago region. Income plays a double role in defining the landscapes of risk: it influences location choice toward risk-prone areas [14,22,35] and limits response capacity [4,36] for poorer families. The robust negative association between risk perception and income across sets (a), (b), and (c) signals that the poorest in the sample have had direct experience with flooding in the past. This pattern represents the association between social and environmental injustices by excluding the urban poor from hazard-free areas. This exclusion pattern is evident when one considers that these flood-prone areas had some of the lowest income and Human Development Index levels in the city [56,57,58] and presented high-confidence poverty hot spots in the Getis-Ord* analysis.
On the second level, the association of income is more robust than other social descriptors, such as age or self-perceived ethnicity. Considering that the analyzed sample was more exposed than most other families in the city [58], this demonstrates income’s persistent differentiating effect, even within exceptionally vulnerable groups. This further presents income as a significant factor in coupling the social and environmental factors in the landscapes of risk where the households settled. Coupling takes place, as household income was significant in determining their social vulnerability while also influencing their access to environmentally safe areas. Affluent households secure access to safe areas (i.e., coupling low social and environmental vulnerability factors), while poor households are priced out of them (i.e., coupling high social and environmental vulnerability factors). This differentiation of risk landscapes may also be perceived among the urban poor in this analysis. Table 1 shows that the poorest households in this sample were in the unprotected areas (i.e., high-risk landscape), while the households in the protected areas (i.e., low-risk landscape) were poor, but less so (ca. 13% higher income). Recent findings present similar evidence for the COVID-19 pandemic [66,67], suggesting a further negative association between vulnerability and social justice.
Third, risk perception was negatively associated with most strategies among the exposed Arquipélago households. This fact evidences some degree of normalization of hazards and resignation to the impacts. This is evident when considering the negative association of risk perception with the strategy of preparing the household before floods (RP14, see Table 6); families living in the most exposed areas faced frequent, low-level damages and losses to which they had minimal capacity to respond appropriately. This argument aligns with previous research indicating that perceived response efficacy is critical in decision-making during flooding events [46]. The low reliance on public agents among these families (reported by RP9) may also indicate risk-warning fatigue [39]. On the one hand, authorities are responsible for issuing warnings, even when weather patterns are uncertain. On the other hand, exposed families become used to flood risk and may discredit future warnings if past ones did not lead to substantial damage. Moreover, repeated risk experiences can lead to resignation (i.e., acceptance that damages are inevitable), irrespective of new warnings [39]. These considerations reinforce the rejection of H1.
The negative association pattern between social justice and vulnerability is further perceived when considering response capacity. At the city level, there is low reliance on public agents by affected families, as reported by the World Bank [58] and evidenced by the negative associations of the “seek help” strategy. At the community level, there was evidence of low influence from social capital in the responses, given that most residents did not engage in collaborative strategies (e.g., RP7, “seek information” or RP9, “provide information”). It is also noticeable that the association of these strategies to risk perception is predominantly negative, signaling that more vulnerable families are less reliant on community help. This limited role of social capital eliminates alternative explanations for H2.
The low financial capacity of the exposed families was a bottleneck to the response options available to them. The evacuation was not possible or not effective in the absence of means of transportation and a workforce sufficient to move assets, documents, and goods out of residences in time. This is apparent by the negative association between evacuation strategy (RP1) and income. The positive association of this strategy with the NRS indicates that it is a last resort, in line with previous research [39]. Families evacuated to preserve the health of household members, even if incurring further losses when abandoning the household (they may be looted during the absence of their residents, for example) [58].
5. Conclusions and Outlook
The urban poor constantly face unfair trade-offs in their location choices, often assuming high exposure to risk, job loss, and deficient services. This problem presents a research gap, despite recent advances in the topic of poverty traps. This research addressed this gap by investigating poverty–vulnerability traps fostered by unequal development. We implemented spatial and statistical analyses of empirical data in an urban delta of the Global South in two different landscapes. The relevance of this approach is to shed light on risk-response decision-making across different risk landscapes. The approach further explores the connections between unequal development and climate change in the Anthropocene, providing evidence of the persistent role played by income (and inequality) in vulnerability.
This paper assessed poverty concentrations through hot spot analysis, presenting clear spatial exclusion patterns among the urban poor. These patterns allowed nuanced analysis of the landscapes of risk to which two groups of urban poor households are exposed: the urbanized, less poor (but far from affluent), and flood-protected Humaitá-Navegantes region (landscape 1), versus the high social vulnerability, exposed, and infrastructure-lacking Arquipélago (landscape 2).
We implemented an in-depth analysis of risk responses through 252 logit regression models. These models evaluated the association between risk perception, income, age, ethnicity, and other characteristics in 14 responses to a large-scale flood event in 2015. The results show the distinct impact of the event across the two risk landscapes of the Humaitá-Navegantes and Arquipélago regions. These models also present low influence from risk perception, which is associated with resignation to losses from flooding (that is, the normalization of hazard impacts). Finally, the results indicate the persistent role of income as the most robust factor influencing risk responses. These observations allowed us to reject the hypothesis that risk perception is the key factor in risk response. Instead, they support the competing hypothesis that risk-response capacity is a determinant, especially in ILISs.
This investigation presented a limited sample, with little explanatory power regarding the behavior of non-exposed households (see Section 2.2), and new surveys in areas frequently affected by floods could provide new insights. This limitation does not, however, hinder the analyses we present here, but rather provides generalizing potential to these findings. This is relevant, as the changing risk profiles of the Anthropocene may expand exposure to the regions adjacent to those customarily flooded. Further surveys could also identify additional factors behind each risk-response decision-making process. For example, what is the influence of attachment to a place in evacuation decisions? It is also crucial to understand the rationality of settling and remaining in exposed areas after repeated floods, and cognition studies would be welcome to explain behavior and vulnerability.
As a concluding observation, we highlight the self-reinforcing connection between social exclusion and flood vulnerability. As reported previously in the literature [4,21], low-income families are often pushed into exposed situations to which they are not equipped to resist or adapt. Over time, repeated hazards erode savings and assets, which are usually physical investments in the exposed residence itself. With worsening risks from climate change [10] and anthropogenic intervention in riverine systems, the risk profiles of these families evolve, increasing their vulnerability. The current attachment to exposed places (e.g., family, social ties, livelihoods, and immovable assets) puts these families in a position where a cruel trade-off must be made between risking losses in the short-term and accepting further social exclusion in the long run by relocating. We argue that this condition is an example of a poverty–vulnerability trap, as previously reported [3,4], with profound implications for social and environmental justice [13,14,21].
Supplementary Materials
The following supporting information can be downloaded at: https://www.mdpi.com/article/10.3390/urbansci6040076/s1, Table S1: Individual scale dataset for the set (a); Table S2: Individual scale dataset for the set (b); Table S3: Individual scale dataset for the set (c); including question dictionary; Tables S4–S17: Logit models results for the set (a), with all residents in the sample; Tables S18–S32: Logit models results for the set (b), with residents located inside the flood protection system (risk landscape 1); Tables S33–S47: Logit models results for the set (c), with residents located outside the flood protection system (risk landscape 2); Table S48: Variables dictionary.
Author Contributions
Conceptualization, A.P.S.; methodology, A.P.S. and J.M.R.-L.; software, A.P.S. and J.M.R.-L.; validation, A.P.S., C.C. and J.M.R.-L.; formal analysis, A.P.S. and J.M.R.-L.; investigation, A.P.S.; resources, C.C., J.M.R.-L. and J.S.; data curation, A.P.S. and C.C.; writing—original draft preparation, A.P.S.; writing—review and editing, A.P.S., C.C., J.M.R.-L. and J.S.; visualization, A.P.S.; supervision, J.M.R.-L., and J.S.; project administration, J.M.R.-L. and J.S. All authors have read and agreed to the published version of the manuscript.
Funding
This research is part of the COVIDGI Project, funded by the “Corona crisis and beyond” grant from the Volkswagen Stiftung and contributes to the Cluster of Excellence Climate, Climatic Change, and Society (CLICCS), funded the by Deutsche Forschungsgemeinschaft (DFG) (Grant ID EXC 2037), and the Center for Earth System Research and Sustainability (CEN) at Universität Hamburg. A.P.S. is a scholar from Deutscher Akademischer Austauschdienst (DAAD) under grant 57440921.
Data Availability Statement
All data and code developed for the analysis presented in this paper are available at https://github.com/alexandrepereiraarq/vulnerabilitytraps, accessed on 27 August 2022.
Acknowledgments
The authors would like to thank the Living with Floods team from the World Bank for the contributions of Frederico Pedroso, Pauline Cazaubon, and Roque Alberto Sánchez Dalotto, who provided access to the survey data. We also thank Ananda Borges of the Soleil Research Institute for explaining the data collection process. Finally, the authors thank the anonymous reviewers for their valuable comments, feedback, and suggestions that helped improve the manuscript.
Conflicts of Interest
The authors declare no conflict of interest. The funders had no role in the design of the study, in the collection, analysis, or interpretation of data, in the writing of the manuscript, or in the decision to publish the results.
References
- Cutter, S.L.; Emrich, C.T. Moral Hazard, Social Catastrophe: The Changing Face of Vulnerability along the Hurricane Coasts. Ann. Am. Acad. Pol. Soc. Sci. 2006, 604, 102–112. [Google Scholar] [CrossRef]
- Cinner, J.E.; Adger, W.N.; Allison, E.H.; Barnes, M.L.; Brown, K.; Cohen, P.J.; Gelcich, S.; Hicks, C.C.; Hughes, T.P.; Lau, J.; et al. Building Adaptive Capacity to Climate Change in Tropical Coastal Communities. Nat. Clim. Chang. 2018, 8, 117–123. [Google Scholar] [CrossRef] [Green Version]
- Adger, W.N. Vulnerability. Glob. Environ. Chang. 2006, 16, 268–281. [Google Scholar] [CrossRef]
- Pelling, M. The Vulnerability of Cities: Natural Disasters and Social Resilience; Earthscan: London, UK, 2003; ISBN 1849773378. [Google Scholar]
- Revi, A.; Satterthwaite, D.E.; Aragón-Durand, F.; Corfee-Morlot, J.; Kiunsi, R.B.R.; Pelling, M.; Roberts, D.C.; Solecki, W.; Balbus, J.; Cardona, O.D.; et al. Urban Areas. In Climate Change 2014—Impacts, Adaptation and Vulnerability: Part A: Global and Sectoral Aspects; Cambridge University Press: Cambridge, UK, 2015; pp. 535–612. [Google Scholar] [CrossRef]
- Batty, M. Building a Science of Cities. Cities 2014, 29, S9–S16. [Google Scholar] [CrossRef] [Green Version]
- Paresi, M.; Melchiorri, M.; Siragusa, A.; Kemper, T. Atlas of the Human Planet 2016: Mapping Human Presence on Earth with the Global Human Settlement Layer; JRC Science Hub: Ispra, Italy, 2016; ISBN 9789279620225. [Google Scholar]
- Crutzen, P.J. Geology of Mankind. Nature 2002, 415, 23. [Google Scholar] [CrossRef]
- Gibbard, P.; Walker, M.; Bauer, A.; Edgeworth, M.; Edwards, L.; Ellis, E.; Finney, S.; Gill, J.L.; Maslin, M.; Merritts, D.; et al. The Anthropocene as an Event, Not an Epoch. J. Quat. Sci. 2022, 37, 395–399. [Google Scholar] [CrossRef]
- IPCC WGII. Sixth Assessment Report: Summary for Policymakers. In Climate Change 2021: The Physical Science Basis. Contribution of Working Group II to the Sixth Assessment Report of the Intergovernmental Panel on Climate Change; Masson-Delmotte, V., Zhai, P., Pirani, A., Connors, S.L., Péan, C., Berger, S., Caud, N., Chen, Y., Goldfarb, L., Gomis, M.I., et al., Eds.; Cambridge University Press: Cambridge, UK, 2022. [Google Scholar]
- Scheffran, J. Climate Change and Weather Extremes as Risk Multipliers: Tipping Points, Cascading Events, and Societal Instability. In Climate Change, Security Risks, and Violent Conflicts. Essays from Integrated Climate Research in Hamburg; Brzoska, M., Scheffran, J., Eds.; Hamburg University Press: Hamburg, Germany, 2020; pp. 19–48. ISBN 9783943423815. [Google Scholar]
- Elmqvist, T.; Andersson, E.; McPhearson, T.; Bai, X.; Bettencourt, L.; Brondizio, E.; Colding, J.; Daily, G.; Folke, C.; Grimm, N.; et al. Urbanization in and for the Anthropocene. NPJ Urban Sustain. 2021, 1, 6. [Google Scholar] [CrossRef]
- Satterfield, T.A.; Mertz, C.K.; Slovic, P. Discrimination, Vulnerability, and Justice in the Face of Risk. Risk Anal. 2004, 24, 141–162. [Google Scholar] [CrossRef]
- Bolin, B.; Kurtz, L.C. Race, Class, Ethnicity, and Disaster Vulnerability. In Handbook of Disaster Research; Rodríguez, H., Donner, W., Trainor, J.E., Eds.; Springer International Publishing: Cham, Switzerland, 2018; pp. 181–203. ISBN 9783319632544. [Google Scholar] [CrossRef]
- Cummings, C.L.; Rosenthal, S.; Kong, W.Y. Secondary Risk Theory: Validation of a Novel Model of Protection Motivation. Risk Anal. 2020, 41, 204–220. [Google Scholar] [CrossRef]
- Tessler, Z.D.; Vorosmarty, C.J.; Grossberg, M.; Gladkova, I.; Aizenman, H.; Syvitski, J.P.M.; Foufoula-Georgiou, E. Profiling Risk and Sustainability in Coastal Deltas of the World. Science 2015, 349, 638–643. [Google Scholar] [CrossRef] [Green Version]
- Bangalore, M.; Smith, A.; Veldkamp, T. Exposure to Floods, Climate Change, and Poverty in Vietnam. Econ. Disasters Clim. Chang. 2019, 3, 79–99. [Google Scholar] [CrossRef] [Green Version]
- Deinne, C.E.; Ajayi, D.D. Dynamics of Inequality, Poverty and Sustainable Development of Delta State, Nigeria. GeoJournal 2021, 86, 431–443. [Google Scholar] [CrossRef]
- Garschagen, M.; Romero-Lankao, P. Exploring the Relationships between Urbanization Trends and Climate Change Vulnerability. Clim. Chang. 2015, 133, 37–52. [Google Scholar] [CrossRef]
- Monteiro, A.; Ankrah, J.; Madureira, H.; Pacheco, M.O. Climate Risk Mitigation and Adaptation Concerns in Urban Areas: A Systematic Review of the Impact of IPCC Assessment Reports. Climate 2022, 10, 115. [Google Scholar] [CrossRef]
- Henrique, K.P.; Tschakert, P. Pathways to Urban Transformation: From Dispossession to Climate Justice. Prog. Hum. Geogr. 2021, 45, 1169–1191. [Google Scholar] [CrossRef]
- De Koning, K.; Filatova, T. Repetitive Floods Intensify Outmigration and Climate Gentrification in Coastal Cities. Environ. Res. Lett. 2020, 15, 034008. [Google Scholar] [CrossRef]
- Boubacar, S.; Pelling, M.; Barcena, A.; Montandon, R. The Erosive Effects of Small Disasters on Household Absorptive Capacity in Niamey: A Nested HEA Approach. Environ. Urban. 2017, 29, 33–50. [Google Scholar] [CrossRef] [Green Version]
- Brondizio, E.S.; Vogt, N.D.; Mansur, A.V.; Anthony, E.J.; Costa, S.; Hetrick, S. A Conceptual Framework for Analyzing Deltas as Coupled Social–Ecological Systems: An Example from the Amazon River Delta. Sustain. Sci. 2016, 11, 591–609. [Google Scholar] [CrossRef]
- Yang, L.; Scheffran, J.; Qin, H.; You, Q. Climate-Related Flood Risks and Urban Responses in the Pearl River Delta, China. Reg. Environ. Chang. 2014, 15, 379–391. [Google Scholar] [CrossRef]
- Romero-Lankao, P.; Gnatz, D.M.; Sperling, J.B. Examining Urban Inequality and Vulnerability to Enhance Resilience: Insights from Mumbai, India. Clim. Chang. 2016, 139, 351–365. [Google Scholar] [CrossRef]
- Harvey, D. Space as a Keyword. In Spaces of Global Capitalism: Towards a Theory of Uneven Geographical Development; Verso: London, UK, 2006; p. 154. ISBN 1844675501. [Google Scholar]
- Borsdorf, A.; Hidalgo, R.; Sánchez, R. A New Model of Urban Development in Latin America: The Gated Communities and Fenced Cities in the Metropolitan Areas of Santiago de Chile and Valparaíso. Cities 2007, 24, 365–378. [Google Scholar] [CrossRef]
- Gilbert, A.; Gugler, J. Cities, Poverty, and Development: Urbanization in the Third World; Oxford University Press: Oxford, UK, 1984; ISBN 90198740841. [Google Scholar]
- Gilbert, A. Urban Growth, Employment and Housing. In Latin American Development: Geographical Perspectives; Preston, D.A., Ed.; Longman, Harlow, Essex: Harlow, UK, 1987; pp. 169–198. [Google Scholar]
- Hardoy, J.; Pandiella, G. Urban Poverty and Vulnerability to Climate Change in Latin America. Environ. Urban. 2009, 21, 203–224. [Google Scholar] [CrossRef] [Green Version]
- Santos, A.P.; Polidori, M.C.; Peres, O.M.; Saraiva, M.V. The Place of the Poor in the City: Theoretical Exploration on Peripherization and Poverty in the Production of Latin-American Urban Space. Urbe 2017, 9, 430–442. [Google Scholar] [CrossRef] [Green Version]
- Winsemius, H.C.; Jongman, B.; Veldkamp, T.I.E.; Hallegatte, S.; Bangalore, M.; Ward, P.J. Disaster Risk, Climate Change, and Poverty: Assessing the Global Exposure of Poor People to Floods and Droughts. Environ. Dev. Econ. 2018, 23, 328–348. [Google Scholar] [CrossRef] [Green Version]
- Dodman, D.; Archer, D.; Satterthwaite, D. Editorial: Responding to Climate Change in Contexts of Urban Poverty and Informality. Environ. Urban. 2019, 31, 3–12. [Google Scholar] [CrossRef] [Green Version]
- Gran Castro, J.A.; Robles, S.L.R. Climate Change and Flood Risk: Vulnerability Assessment in an Urban Poor Community in Mexico. Environ. Urban. 2019, 31, 75–92. [Google Scholar] [CrossRef]
- Bubeck, P.; Botzen, W.J.W.; Kreibich, H.; Aerts, J.C.J.H. Detailed Insights into the Influence of Flood-Coping Appraisals on Mitigation Behaviour. Glob. Environ. Chang. 2013, 23, 1327–1338. [Google Scholar] [CrossRef]
- Lo, A.Y. The Role of Social Norms in Climate Adaptation: Mediating Risk Perception and Flood Insurance Purchase. Glob. Environ. Chang. 2013, 23, 1249–1257. [Google Scholar] [CrossRef]
- Lo, A.Y.; Xu, B.; Chan, F.K.S.; Su, R. Social Capital and Community Preparation for Urban Flooding in China. Appl. Geogr. 2015, 64, 1–11. [Google Scholar] [CrossRef] [Green Version]
- Penning-Rowsell, E.C.; Sultana, P.; Thompson, P.M. The ‘Last Resort’? Population Movement in Response to Climate-Related Hazards in Bangladesh. Environ. Sci. Policy 2013, 27, S44–S59. [Google Scholar] [CrossRef]
- Watson, V. “The Planned City Sweeps the Poor Away...”: Urban Planning and 21st Century Urbanisation. Prog. Plann. 2009, 72, 151–193. [Google Scholar] [CrossRef]
- Abramo, P. The Com-Fused City: Land Market and the Production of Urban Infrastructure in Great Latin-American Cities. Eure Rev. Latinoam. Estud. Urbano Reg. 2012, 38, 35–69. [Google Scholar]
- Barros, J.X. Exploring Urban Dynamics in Latin American Cities Using an Agent-Based Simulation Approach. In Agent-Based Models of Geographical Systems; Heppenstall, A.J., Crooks, A.T., See, L.M., Batty, M., Eds.; Springer: Dordrecht, The Netherlands, 2004; ISBN 978-90-481-8926-7. [Google Scholar]
- Wheaton, W.C. Urban Spatial Development with Durable but Replaceable Capital. J. Urban Econ. 1982, 12, 53–67. [Google Scholar] [CrossRef]
- Janoschka, M. El Nuevo Modelo de La Ciudad Latinoamericana: Fragmentación y Privatización. EURE 2002, 28, 85. [Google Scholar] [CrossRef]
- Adger, W.N. Social and Ecological Resilience: Are They Related? Prog. Hum. Geogr. 2000, 24, 347–364. [Google Scholar] [CrossRef]
- Bubeck, P.; Botzen, W.J.W.; Aerts, J.C.J.H. A Review of Risk Perceptions and Other Factors That Influence Flood Mitigation Behavior. Risk Anal. 2012, 32, 1481–1495. [Google Scholar] [CrossRef] [Green Version]
- Ajibade, I.; McBean, G. Climate Extremes and Housing Rights: A Political Ecology of Impacts, Early Warning and Adaptation Constraints in Lagos Slum Communities. Geoforum 2014, 55, 76–86. [Google Scholar] [CrossRef]
- Hjälm, A. The ‘Stayers’: Dynamics of Lifelong Sedentary Behaviour in an Urban Context. Popul. Space Place 2014, 20, 569–580. [Google Scholar] [CrossRef]
- Bergman, P.; Chetty, R.; DeLuca, S.; Hendren, N.; Katz, L.F.; Palmer, C. Creating Moves to Opportunity: Experimental Evidence on Barriers to Neighborhood Choice. NBER Work. Pap. Ser. 2019, 26164. [Google Scholar] [CrossRef]
- Feitosa, F.F.; Le, Q.B.; Vlek, P.L.G.; Miguel V Monteiro, A.; Rosemback, R. Countering Urban Segregation in Brazilian Cities: Policy-Oriented Explorations Using Agent-Based Simulation. Environ. Plan. B Plan. Des. 2012, 39, 1131–1150. [Google Scholar] [CrossRef]
- Reyer, C.P.O.; Adams, S.; Albrecht, T.; Baarsch, F.; Boit, A.; Canales Trujillo, N.; Cartsburg, M.; Coumou, D.; Eden, A.; Fernandes, E.; et al. Climate Change Impacts in Latin America and the Caribbean and Their Implications for Development. Reg. Environ. Chang. 2017, 17, 1601–1621. [Google Scholar] [CrossRef]
- Magrin, G.O.; Marengo, J.A.; Boulanger, J.-P.; Buckeridge, M.S.; Castellanos, E.; Poveda, G.; Scarano, F.R.; Vicuña, S. Central and South America. In Climate Change 2014: Impacts, Adaptation and Vulnerability Part B: Regional Aspects Contribution of Working Group II to the Fifth Assessment Report of the Intergovernmental Panel on Climate Change; Girardin, L.O., Ometto, J.P., Eds.; Cambridge University Press: Cambridge, UK, 2014; pp. 1499–1566. [Google Scholar] [CrossRef] [Green Version]
- Marques, W.C. The Temporal Variability of the Freshwater Discharge and Water Levels at the Patos Lagoon, Brazil. Int. J. Geosci. 2012, 03, 758–766. [Google Scholar] [CrossRef] [Green Version]
- Fundação Zoobotânica; SEMA/RS; MCN/RS. Parque Estadual Do Delta Do Jacuí: Plano de Manejo; Secretaria Estadual do Meio Ambiente do Rio Grande do Sul, Fundação Zoobotânica, Museu de Ciências Naturais/RS: Porto Alegre, Brazil, 2014. [Google Scholar]
- IBGE. National Continuous Sampling Survey (PNAD); IBGE: Rio de Janeiro, Brazil, 2020.
- Allasia, D.G.; Tassi, R.; Bemfica, D.; Goldenfum, J.A. Decreasing Flood Risk Perception in Porto Alegre—Brazil and Its Influence on Water Resource Management Decisions. IAHS-AISH Proc. Rep. 2015, 370, 189–192. [Google Scholar] [CrossRef] [Green Version]
- PNUD; IPEA; Fundação João Pinheiro. Atlas of Human Development in Brazil. Available online: http://www.atlasbrasil.org.br/2013/en (accessed on 24 May 2020).
- World Bank Group. Convivendo Com as Inundações: Um Estudo Para Construir Resiliência Com as Comunidades de Porto Alegre; World Bank Group: Porto Alegre, Brazil, 2019. [Google Scholar]
- Martinbiancho, G.K.; Medeiros, M.S.; Fleischmann, A.S.; Dornelles, F.; Fan, F.M.; Paiva, R.; Lopes, V.A.R.; Collischonn, W. Aplicação Preliminar do Modelo Hidrológico MGB-IPH para Análise do Evento Extremo de Cheia em 1941 no Estado do Rio Grande do Sul. In Proceedings of the I Encontro Nacional de Desastres, Porto Alegre, Brazil, 25–27 July 2018; Associação Brasileira de Recursos Hídricos: Porto Alegre, Brazil, 2018. [Google Scholar]
- World Bank Group. Convivendo Com as Inundações—Nota Metodológica; World Bank Group: Porto Alegre, Brazil; Prefeitura Municipal de Porto Alegre: Porto Alegre, Brazil, 2019. [Google Scholar]
- Long, J.S.; Freese, J. Regression Models for Categorical Dependent Variables Using Stata; Stata Press: College Station, TX, USA, 2006; ISBN 1597180114. [Google Scholar]
- Getis, A.; Ord, J.K. The Analysis of Spatial Association by Use of Distance Statistics. Geogr. Anal. 1992, 24, 189–206. [Google Scholar] [CrossRef]
- Ord, J.K.; Getis, A. Local Spatial Autocorrelation Statistics: Distributional Issues and an Application. Geogr. Anal. 1996, 27, 286–306. [Google Scholar] [CrossRef]
- IBGE. Censo Demográfico 2010: Dados Do Universo Agregados Por Setores; IBGE: Brasília, Brazil, 2011.
- Waters, J.; Adger, W.N. Spatial, Network and Temporal Dimensions of the Determinants of Adaptive Capacity in Poor Urban Areas. Glob. Environ. Chang. 2017, 46, 42–49. [Google Scholar] [CrossRef] [Green Version]
- Santos, A.P.; Rodriguez Lopez, J.M.; Heider, K.; Steinwärder, L.; Scheffran, J. One Year of the COVID-19 Pandemic in the Global South: Uneven Vulnerabilities in Brazilian Cities. Erdkunde 2022, 76, 75–91. [Google Scholar] [CrossRef]
- Lorenz, C.; Bermudi, P.M.M.; de Aguiar, B.S.; Failla, M.A.; Toporcov, T.N.; Chiaravalloti-Neto, F.; Barrozo, L.V. Examining Socio-Economic Factors to Understand the Hospital Case Fatality Rates of COVID-19 in the City of São Paulo, Brazil. Trans. R. Soc. Trop. Med. Hyg. 2021, 115, 1282–1287. [Google Scholar] [CrossRef]
Figure 1.
Location of surveyed areas: (A) location in the south of Brazil; (B) surveyed areas in the Jacuí delta; and (C) location of surveyed areas and the flood protection limit.
Figure 1.
Location of surveyed areas: (A) location in the south of Brazil; (B) surveyed areas in the Jacuí delta; and (C) location of surveyed areas and the flood protection limit.

Figure 2.
Landscapes in the areas of interest: (a) urban pattern in the Humaitá-Navegantes region; (b) urban pattern in the Arquipélago region. Source: The World Bank (2017), used under permission.
Figure 2.
Landscapes in the areas of interest: (a) urban pattern in the Humaitá-Navegantes region; (b) urban pattern in the Arquipélago region. Source: The World Bank (2017), used under permission.

Figure 3.
Location of surveyed areas, protection status, hot spots of low-income households, and areas affected by the October 2015 flood.
Figure 3.
Location of surveyed areas, protection status, hot spots of low-income households, and areas affected by the October 2015 flood.

Publisher’s Note: MDPI stays neutral with regard to jurisdictional claims in published maps and institutional affiliations. |
© 2022 by the authors. Licensee MDPI, Basel, Switzerland. This article is an open access article distributed under the terms and conditions of the Creative Commons Attribution (CC BY) license (https://creativecommons.org/licenses/by/4.0/).
Share and Cite
MDPI and ACS Style
Pereira Santos, A.; Rodriguez-Lopez, J.M.; Chiarel, C.; Scheffran, J. Unequal Landscapes: Vulnerability Traps in Informal Settlements of the Jacuí River Delta (Brazil). Urban Sci. 2022, 6, 76. https://doi.org/10.3390/urbansci6040076
AMA Style
Pereira Santos A, Rodriguez-Lopez JM, Chiarel C, Scheffran J. Unequal Landscapes: Vulnerability Traps in Informal Settlements of the Jacuí River Delta (Brazil). Urban Science. 2022; 6(4):76. https://doi.org/10.3390/urbansci6040076
Chicago/Turabian StylePereira Santos, Alexandre, Juan Miguel Rodriguez-Lopez, Cleiton Chiarel, and Jürgen Scheffran. 2022. "Unequal Landscapes: Vulnerability Traps in Informal Settlements of the Jacuí River Delta (Brazil)" Urban Science 6, no. 4: 76. https://doi.org/10.3390/urbansci6040076