1. Introduction
Under conditions of strong adverse pressure gradients (APG), low turbulence intensity (
), and low Reynolds numbers, the boundary layer (BL) may experience separation, leading to increased losses. If turbulent reattachment of the boundary layer occurs, a laminar separation bubble (LSB) forms on the lifting surface. Various applications, such as unmanned aerial vehicles, low-pressure turbines, low-pressure compressors, helicopter blades, and wind turbines, operate under this specific flow configuration. Understanding the flow conditions that cause a relatively short bubble to transition into a long one is crucial, as it significantly alters the pressure distribution profile and heightens the risk of stall. This abrupt change in the bubble state is commonly referred to in the literature as bubble bursting (Marxen and Henningson [
1]). Due to its detrimental nature, significant efforts have been dedicated over the past decades to comprehending bubble bursting. This includes the development of empirical criteria, particularly focused on its prediction (see, for instance, Von Doenhoff [
2], Owen and Klanfer [
3], Crabtree [
4]). Gaster [
5] conducted a comprehensive analysis of the bursting process, proposing a two-parameter criterion for predicting changes in the bubble state. The author conducted experiments on a flat plate with a variable Reynolds number and pressure gradient, revealing a correlation between the momentum thickness Reynolds number at separation and non-dimensional parameter
. Here,
considers the momentum thickness at separation (
) and the velocity gradient across the bubble length (
) with respect to an attached flow condition. In more recent works, Diwan et al. [
6] and Mitra and Ramesh [
7] introduced a single-parameter criterion based on the newly defined quantity
. Diwan et al. [
6] incorporated the maximum bubble height (
h) as an influencing parameter for identifying the bubble state, and
represents the actual velocity gradient between the separation and reattachment locations. Bursting is expected to occur when
. This criterion has been adopted in subsequent literature works focusing on external aerodynamics at very low turbulence levels (see, for example, Serna and Lázaro [
8], Alferez et al. [
9]). Alferez et al. [
9] suggested that the bursting process may be triggered by modifications in shear layer characteristics due to increased distance from the wall rather than a shift in the instability nature from convective to absolute, contrary to the original asumption of Gaster [
5]. Among other studies, Almutairi et al. [
10] conducted numerical simulations of laminar separation bubbles (LSB) undergoing bursting at very low Reynolds numbers, observing more irregular bubble behavior compared to that in previous experimental works at higher Reynolds numbers. In the recent work of Eljack et al. [
11], low-frequency oscillations of an LSB forming over an airfoil were identified as precursors to complete profile stall. Then, the above-mentioned works clearly highlight the complexity of the bursting phenomenon, which is still far to be completely understood. Indeed, the effects occurring due to flow parameter variation are mostly obtained by comparison to different works, concerning both experiments and numerical simulations.
This paper presented a recently obtained experimental database concerning laminar separation bubbles that form on a flat plate under various
levels and pressure gradients. The experiments encompassed different Reynolds numbers for each combination of these two parameters, enabling the observation of both short and long bubble states. In total, approximately 80 distinct flow conditions were examined using Particle Image Velocimetry. The detailed measurements conducted in this study make the dataset well-suited for characterizing the statistical progression of separation-induced transitions in both short and long bubble states. Additionally, the dataset facilitates an examination of the predominant flow dynamics and their associated stability characteristics. Interested parties may request access to the data presented in this paper directly from the authors. This work is an extended version of the conference paper by Dellacasagrande et al. [
12].
2. Setup of Experiments
The present experiments were performed in the wind tunnel of the Aerodynamic and Turbomachinery laboratory at the University of Genova. The wind tunnel operated at low speeds, with a Mach number well below 0.1. Although the experiments were conducted at subsonic regimes, the collected data are representative of laminar separation bubbles evolving at high speeds, provided that shock-induced separation does not occur, and the same effective adverse pressure gradients are considered. Indeed, shock-induced boundary layer separation differs significantly from that induced by a continuous APG distribution. In the conducted experiments, a flat plate with a 4:1 elliptic leading edge was positioned between two adjustable endwalls, allowing for variation in the streamwise pressure gradient imposed on the boundary layer (see
Figure 1). The flow was accelerated from the plate leading edge to the channel throat using a converging fixed geometry. The pressure gradient could be adjusted in the rear part of the plate. The opening angle of the endwalls (
) was set to 7, 9, and 12 degrees, corresponding to acceleration parameter (
) values of −0.18, −0.27, and −0.41, respectively, with
. This parameter is defined based on plate length (
L), the free-stream velocity at the channel throat (
), and the average velocity gradient along the rear part of the plate. The plate dimensions were 300 mm in length and width, providing a 2D time-mean flow at the mid-section of the channel, where Particle Image Velocimetry (PIV) measurements were conducted.
Free-stream turbulence intensity was controlled using turbulence-generating grids located 500 mm upstream of the plate leading edge. The root mean square of velocity fluctuations was measured by Laser Doppler Velocimetry (LDV) at the inlet section of the test section. Velocity data were acquired in the free-stream region at a mean sampling rate of 10 kHz over a sampling period of 120 s.
Table 1 provides geometric parameters for the grids used, corresponding
levels, and a streamwise integral length-scale (
), computed using the auto-correlation function of LDV data under Taylor’s hypothesis of frozen turbulence. For each combination of free-stream turbulence and pressure gradient, approximately 9 Reynolds numbers (
) were tested. This parameter is defined based on the plate length and the free-stream velocity at the plate leading edge. The acquired dataset includes various flow conditions, as listed in
Table 2, presenting the tested values of influencing parameters.
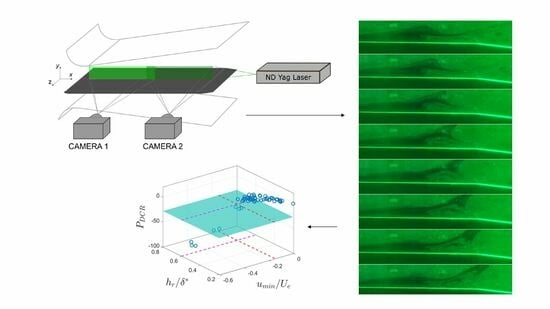
PIV measurements were performed in this work in a wall-normal plane aligned with the meridional section of the plate. To reduce laser reflections, the plate was painted black and the laser incidence angle was minimized by positioning the laser optics far behind the plate trailing edge instead of illuminating the plate from the top. Two cameras were used simultaneously to acquire the evolution of the boundary layer from the channel throat to the end of the plate. This guaranteed that the entire evolution of the laminar separation bubbles forming over the plate surface was recorded for the overall combinations of the above-mentioned parameters. Moreover, using two cameras allowed us extension of the field of view while keeping the spatial resolution sufficiently high to solve, with great detail, the dominant coherent structures within the flow. With the aim of providing a qualitative view of the flow dynamics captured in the present data base,
Figure 2 reports exemplary flow visualizations of the operating PIV system for a very low Reynolds number case. The dark region in the pictures corresponds to the separated shear layer evolving above the plate surface. Depending on the flow Reynolds number, wall-normal oscillations of the separated shear layer were observed, characterized by significantly different central frequency (Boutilier and Yarusevych [
13]). As it is further discussed in this work, vortical structures were seen to form within the recirculating flow region at a low Reynolds number. Such structures interact with the overlaying shear layer, likely provoking the shedding of larger vortices near the position of maximum shear, similar to what is shown in
Figure 2. On the contrary, the classic inviscid convective Kelvin–Helmholtz instability was found to dominate at a high Reynolds number, for which short laminar separation bubbles occur. This provided evidence of the usability of the present experimental database for the characterization of separation-induced transition with reference to different states of a laminar separation bubble.
The PIV system employed in this study was a dual-cavity ND:YLF pulsed laser (Litron LDY 300) with a pulse energy of 30 mJ at a repetition rate of 1000 Hz and a wavelength of 527 nm. Two high-sensitive SpeedSense M340 digital cameras equipped with a cooled 2560 × 1600 pixels CMOS matrix were used to capture the overall velocity field. The magnification factor for these experiments was set to approximately 0.16. For the PIV image analysis, a multi-grid algorithm was implemented to compute adaptive cross-correlation. Initially, a 32 × 32 pixel interrogation area was used, followed by a successive refinement to 16 × 16 pixels with a 50% overlap. This resulted in a vector grid spacing of 0.41 mm. A peak validation method was employed to distinguish between valid and invalid vectors. Additionally, a Gaussian fitting procedure was applied to achieve sub-pixel recognition accuracy of particle displacement equal to 0.1 pixel. The uncertainty in instantaneous velocity measurements was estimated to be less than 3% in the free-stream region and increased to 6% in the boundary layer. This estimation was based on the peak ratio method proposed by Charonko and Vlachos [
14], which correlates particle displacement uncertainty with the ratio between the dominant correlation peak and the second highest one. Commercial software DynamicStudio 7.3, used for these measurements, implemented this method. Instantaneous maps of uncertainty for particle displacement were generated, from which velocity uncertainty values were computed (see also Canepa et al. [
15,
16]). Complementary analysis regarding the impact of near-wall velocity gradients was conducted following the approach outlined in the work of Wilson and Smith [
17]. This comprehensive assessment ensures a thorough understanding of the uncertainties associated with the measured velocity field.
In order to achieve a detailed characterization of the flow dynamics and also of the statistics of short and long laminar separation bubbles, two sets of 6000 snapshots were collected at 1000 and 300 Hz for each combination of the influencing parameters. The statistical reliability of the so-acquired database was assessed based on the temporal auto-correlation functions of the fluctuating velocity field for different cases.
Figure 3 shows exemplary auto-correlation functions for low (left) and high (right) Reynolds numbers at the maximum pressure gradient and the lowest
level, i.e.,
= 12 and
= 1.5%. This represents the most burdensome combination of APG and the
level for the occurrence of bubble bursting. The colored curves reported in
Figure 3 refer to different numbers of PIV snapshots adopted for the computation of the auto-correlation function. Data reported in
Figure 3 clearly indicate that the characteristic period of the main coherent fluctuations is well captured using only 3000 snapshots (see the position of the first negative peak in the auto-correlation function). It should be noted that the time shift (
) is normalized by the overall acquisition period (
). Accordingly, about 100 to 500 shedding cycles were acquired from the lowest to the highest Reynolds numbers at a sampling rate of 1 kHz. For the highest Reynolds numbers, the bubble time-scale was discretized with about 20 sample points, which increased to about 70 for the lowest
values. Further details on the adopted test section and measuring techniques can be found in the previous works by Verdoya et al. [
18] and Canepa et al. [
19].
3. Time-Mean Flow Fields and Boundary Layer Statistical Parameters
In order to highlight the response of the laminar separation bubble to flow parameter variation, this section reports some statistical quantities of the separated boundary layer for selected flow cases among those tested.
Figure 4 shows the contour plots of the normalized streamwise velocity component (
) at fixed
= 1.5% and
= 12 for a variable Reynolds number. This latter is the parameter showing the greatest influence on the definition of the bubble state (i.e., short and long one). Similar time-mean velocity distributions were indeed observed for the other combinations of the pressure gradient and the
level, not shown here for brevity. Results reported in
Figure 4 clearly highlight the increase in the bubble size with the reduction in the Reynolds number. Particularly, moving from the bottom to the top plot, the acquired flow field switches from a very short bubble to a fully stalled case in which the turbulent reattachment does not take place before the end of the plate. The boundary layer separation occurs for all cases in the range of
; thus, the growth of the bubble length occurs mostly due to the downstream shift of the bubble maximum displacement and reattachment positions. Interestingly, for
40,600, the growth rate of the bubble due to Reynolds number reduction significantly increases (the Reynolds number was almost uniformly sampled). This sudden increment of the bubble size can be directly ascribed to the occurrence of the bursting process, as further discussed in the following sections; thus, a critical Reynolds number for bursting was identified for the different flow cases.
Figure 5 shows the contour plots of the root mean square (rms) of the streamwise velocity fluctuations (
) for the same cases reported in
Figure 4. The region where the maximum rms values occur is seen to move downstream as the Reynolds number is reduced, according to the increment of the bubble length. Additionally, the saturation level of the rms of fluctuations becomes increasingly higher as
is reduced. This is due to the occurrence of significantly larger vortices which are responsible for higher levels of fluctuations. As is shown in the following section, the range of the Reynolds number variation tested here was found to cause a substantial modification of the leading structures observed near the bubble maximum displacement, where the maximum rms values occur. Moreover, the growth of fluctuations in the fore part of the bubble was shown to reduce at low
values, which is the cause for delayed transition and reattachment.
To better illustrate the impact of variations in flow parameters on the time-mean shape of the laminar separation bubble and its stability characteristics,
Figure 6 displays streamwise distributions of non-dimensional boundary layer (BL) displacement thickness (
, top plots), recirculating height (
, center plots), and local maxima of root mean square of normal-to-the-wall fluctuations (
, bottom plots) for cases with
,
, and
(from left to right). The influence of Reynolds number variation is shown within the same range of
values in each plot. The displacement thickness distributions (top plots) exhibit a consistent trend in the initial part of the measurement domain when varying the Reynolds number at a constant adverse pressure gradient and turbulence intensity. Higher values of
near the inlet at lower
result from boundary layer thickening, as expected. Comparing cases with different turbulence intensities (
and
), an increase in
leads to a reduced growth of
upstream of the separation position before notable divergence occurs. A reduction in streamwise pressure gradient (comparing
and
) produces a similar effect. Elevated free-stream turbulence enhances the boundary layer resistance to adverse pressure gradients. Conversely, a decrease in channel opening angle reduces velocity gradients, retarding boundary layer growth and delaying detachment according to previous separation criteria (e.g., Curle and Skan [
20]). Moving towards the plate end, significant divergence in the curves for different combinations of
and APG reveals the effects of Reynolds number variation on maximum bubble height and its location. The peak of
shifts upstream and diminishes notably as the Reynolds number increases, consistent with findings in prior literature works (e.g., Istvan et al. [
21], Dellacasagrande et al. [
22]).
Distributions of
(mid-plots of
Figure 6) further demonstrate the effects, occurring due to flow parameter variation, on the separation and reattachment positions. At the lowest
level (left plot), the separation position remains almost unchanged at different
values, according to
Figure 4. A delay in separation position is instead observed when increasing the
level, as well as when reducing the APG, and the role of
variation becomes more relevant in this sense. Nevertheless, the largest changes still concern the reattachment position and the bubble height. Notably, a marked growth of the bubble dimension occurs below a certain
value, which is explained by bursting occurrence. A similar behavior was indeed observed for the other combinations of the flow parameters tested here, which further indicates the presence of different bubble states within the current database.
Finally, the distributions of
(bottom plots of
Figure 6) highlight the changes in the dynamic properties of the tested laminar separation bubbles. For all APG and
levels, an earlier growth of
occurs at higher Reynolds numbers, which highlights the anticipation of the laminar to turbulent transition. This is also confirmed by the upstream shift of the streamwise position at which
saturates for the different cases, which occurs near the bubble maximum displacement position. Moreover, the higher the
, the higher the spatial growth of
, which denotes a modification of stability characteristics of the separated shear layer (see, e.g., Simoni et al. [
23]). Again, there exists an
value below which a marked modification, i.e., reduction, in
growth is observed. Data reported in
Figure 6 make clear that this behavior is linked to the increment of the bubble size (see
distributions). The growth rate of fluctuations is found to also reduce at lower APG, while the
level has minor effects in this sense.
4. Instantaneous Perturbation Velocity Fields
The present section reports exemplary PIV snapshots to highlight the main structures driving the transition process of an LSB as well as changes in the shear layer stability properties due to bursting occurrence. Since the bubble state has been found to be mostly affected by the flow Reynolds number variation,
Figure 7,
Figure 8 and
Figure 9 compare high and low Reynolds number fluctuating velocity fields at different
levels and pressure gradients.
In the top plot of
Figure 7 (case
with high
), counter-rotating vortices are evident near the maximum displacement of the bubble (indicated by blue circles). These vortices form in the region of maximum shear and subsequently grow as they move in the main flow direction, indicating convective amplification. Further downstream, smaller structures for
suggest that vortex breakup and transition occur. Such spanwise vortices have been shown to constitute a significant source of losses due to the associated high levels of turbulence production (see e.g., Dellacasagrande et al. [
24]). What is shown in the top plot in
Figure 7 illustrates the typical pattern associated with the Kelvin–Helmholtz (K-H) instability process, driving the convective growth of disturbances in short laminar separation bubbles and the subsequent turbulent reattachment of the boundary layer. In contrast, the bottom plot in
Figure 7 depicts a different scenario for the low
case. As the Reynolds number decreases below a certain threshold, the train of counter-rotating vortices characteristic of the K-H instability no longer occurs. Instead, significantly larger vortices start to form within the recirculating flow region (indicated by blue circles in the first snapshot). These spanwise vortices are observed to grow over time at nearly fixed positions (indicated by blue arrows in the plots) rather than being convectively amplified. This indicates a substantial modification of the stability characteristics of the laminar separation bubble, as also evident in
distributions shown in
Figure 6. Specifically, for the low
cases, the occurrence of absolute instability is expected, as further discussed in the following section. This results in a modification of the growth rate of fluctuations and the delayed transition and reattachment of the laminar separation bubble.
Similar effects due to changes in the Reynolds number are observed in
Figure 8 and
Figure 9 at different
levels and pressure gradients: K-H instability dominates at high
, regardless of the free-stream turbulence and the average velocity gradient, whereas the dynamics of an LSB are seen to change significantly at low
values. It is worth noting that all the low Reynolds number cases reported herein suggest that interaction may occur between vortices forming within the recirculating region, which are likely due to the absolute instability of disturbances, and those originating in the region of maximum shear. More precisely, as spanwise vortex-like structures grow over time within the recirculating region, they appear to provoke wall-normal oscillation of the overlaying shear layer, which then exhibits marked sinuous motions leading to the generation of larger-scale vortical structures near the bubble maximum displacement (see the bottom plots of
Figure 8 and
Figure 9). Namely, coherent fluctuations moving at a low speed within the recirculating region act to shrink adjacent vorticity nuclei (blue circles) and the separated shear layer, provoking the successive shedding of convective structures moving at much higher speed (see the inclination of the blue arrows depicted in the plots). The present results indicate that in the long bubble regime, convective and absolute instability may participate in provoking the shear layer instability and its turbulent transition. The present experimental database is therefore usable for the characterization of the flow physics driving the transition of laminar separation bubbles forming over airfoils and turbomachinery bladings.
Based on previous studies (see e.g., Simoni et al. [
25]), the change in stability properties of an LSB may be quantified considering the wave number (
k) of the largest coherent structures shed by the bubble once scaled via the shear layer thickness at the separation position (
l). To overcome the limitation of the visual inspection of PIV data, the wavelength and frequency of the main coherent structures shed by the bubble were computed for each case by means of Proper Orthogonal Decomposition (POD): POD modes provided the dominant wavelength (
) for each case, while the associated central frequency was obtained by means of Fourier transform of the corresponding temporal coefficients. A non-dimensional wave-number
was therefore defined as
. This non-dimensional parameter was equal to about 0.81–0.92 in the short bubble regime, regardless of
, the
level and APG. This indicates a self-similarity of the main vortical structures shed by the bubble. Instead,
significantly deviated from this value when the Reynolds number reduced below a certain threshold. For the cases reported in
Figure 7,
Figure 8 and
Figure 9, the scaling parameter
reduced to about 0.55–0.68 when passing from high to low
conditions. Similarly, the group velocity of the dominant coherent vortical structures was computed and scaled with the local external velocity. The non-dimensional traveling speed of the vortical structures formed in the LSB reduced from about 0.5 in the short regime to null and even negative values for the structures originating within the recirculating region of the bubble. This is linked to the dominance of temporal growth of fluctuations and the onset of absolute instability of disturbances. Again, this indicates a substantial modification of the instability processes driving turbulence generation in the separated shear layer.
5. Data Clustering Based on the Bubble State and BL Instability Characteristics
In this section, statistical parameters defined in previous literature works are used to cluster the current data in terms of short and long bubble types, as well as with reference to the instability mechanisms driving the disturbance growth in the boundary layer. This allows discussion of the eventual link between the occurrence of the bubble bursting and the change in the stability characteristics of the separated shear layer that was highlighted via the inspection of instantaneous flow records. The bubble state is identified based on the
parameter previously defined by Mitra and Ramesh [
7]. Then, two additional parameters are used for the characterization of the instability process for the different cases examined. The first one is the ratio between the maximum height of the recirculating flow region and the local boundary layer displacement thickness, i.e.,
. According to the work of Maucher et al. [
26], when this quantity is higher than 0.6, the absolute instability of fluctuations is expected to occur. Similarly, the switch from the convective to the absolute instability is expected to take place when the maximum reversed flow is larger than 15% of the local external velocity, that is,
(see Maucher et al. [
26], Pauley et al. [
27]). These two different criteria for the occurrence of the absolute instability of fluctuations are combined in
Figure 10 with the
-based criterion for the occurrence of bubble bursting. The blue plane in the plot indicates the bursting threshold corresponding to
, as suggested in the work of Mitra and Ramesh [
7]. Based on the adopted bursting criterion, most of the acquired flow cases are representative of a short bubble state (i.e.,
), whereas part of them is classified as long ones. These latter conditions are characterized by
and
values that are higher than the proposed thresholds for the occurrence of the absolute instability in the laminar separation bubble (see the dashed lines in the plot). Otherwise, all the short bubbles fall within the range typical of convective one, i.e., that of the K-H instability process. What is shown in
Figure 10 clearly indicates the link between the change in the bubble state and the modification of its stability characteristics, which can be further studied in future works by means of the present experimental database.


