Article

Heterogeneity of Micro- and Nanopore Structure of Lacustrine Shales with Complex Lamina Structure

1
State Key Laboratory of Petroleum Resources and Engineering, China University of Petroleum (Beijing), Beijing 102249, China
2
College of Geosciences, China University of Petroleum (Beijing), Beijing 102249, China
*
Authors to whom correspondence should be addressed.
Fractal Fract. 2024, 8(4), 245; https://doi.org/10.3390/fractalfract8040245
Submission received: 25 March 2024 / Revised: 9 April 2024 / Accepted: 17 April 2024 / Published: 22 April 2024

Abstract

:
Thin sections, AIM-SEM, MICP, and nitrogen adsorption were performed on laminated and layered shales to characterize their complex pore and fracture structure. Combining the MICP model with the FHH model, this work proposes a new fractal method for lacustrine shales with complex lamina structure. The fractal characteristics presented four zones, representing the heterogeneity of fractures, macropores, mesopores, and micropores. The pores and fractures of shale have strong heterogeneity. Laminated shale has strong heterogeneity in mesopores and moderate heterogeneity in micropores. Layered shale has strong heterogeneity in fractures and moderate heterogeneity in micropores. The lamina structure and content of organic and mineral composition has a great influence on heterogeneity. The mineral laminae in laminated shale change frequently; lamellation fractures are mainly developed, and the structures are similar. Layered shales develop fractures between layers and structural fractures; the structural differences are significant. Macropores are mostly interparticle pores between quarts with similar structures. The wider lamina thickness of layered shale provides sufficient crystallization space for minerals, so the mesopores of layered shale are more homogeneous. Micropores are less developed, mainly consisting of intraparticle pores between clay minerals, which are complex but similar in structure in the two types of shale. The heterogeneity of mesopores and micropores is not conducive to hydrocarbon migration. Fractures and macropores need to be connected with meso–micropores to form a transport system. So, mesopores and micropores play decisive roles in hydrocarbon migration. Based on the above understanding, this paper points out that hydrocarbon in laminated shale with more carbonate minerals and a high thermal evolution degree has better availability.

1. Introduction

Shale oil refers to the liquid hydrocarbon retained in the reservoir space of organic-rich shale formations, which has the characteristics of in situ or extremely short distance migration and accumulation [1,2,3]. Shale oil reservoirs are dense, with a matrix permeability typically less than 0.001 × 103 μm2 and porosity ranging from 4% to 6%. With the continuous development of oil and gas exploration and the development of technology, shale oil and gas resources have shown enormous potential. China is rich in shale oil and gas resources, with recoverable shale gas reserves of about 20 × 1012 m3 [4] and recoverable shale oil resources of 50 × 108 t [5,6]. At present, good hydrocarbon displays have been obtained in the Fengcheng Formation in Mahu Sag in the Junggar Basin, Yanchang Formation in the Ordos Basin, Qingshankou Formation in the Songliao Basin, and Shahejie Formation in the Bohai Bay Basin [6,7,8,9,10]. China’s shale oil is mainly accumulated in lacustrine shales of the Mesozoic–Cenozoic [11]. The continental shale has a complex mineral composition and strong heterogeneity. Unlike marine shale, which has a high thermal evolution degree and high organic content [12,13,14], the thermal evolution of organic matter in continental shale is low (Ro values of 0.7~1.1%) [13]. The parent material types are complex, mainly type I and type II kerogen, with less development of type III kerogen [5,11,12]. The reservoir space of shale is mainly pores and fractures [15]. The overall distribution characteristics of continental shale exhibit a wide pore size range, with nano–microscale pores and fractures developed [16,17,18,19]. Because the lacustrine plane changes frequently when continental shale is deposited, a large number of shales with a complex lamina structure are formed. Now, according to the development of the lamina structure, shale can be divided into laminated shale, layered shale, and massive shale. At present, abundant hydrocarbon displays have been found in laminated shale and layered shale. However, the complex lamina structure increases the heterogeneity of continental shale. Due to the strong heterogeneity of continental shale [9], the structure of the pore–fracture system of shale is very complicated, and problems such as low recovery efficiency and fast production decline are faced in the mining process. Therefore, it is urgent to conduct in-depth research on the heterogeneity of continental shale reservoir space with complex lamina structure.
Currently, many techniques, such as scanning electron microscopy (SEM), field-emission scanning electron microscopy (FE-SEM), argon ion polishing scanning electron microscopy (AIM-SEM), focused ion beam scanning electron microscopy (FIB-SEM), small-angle neutron scattering (SANS), micro/nano-CT, nuclear magnetic resonance (NMR) [20,21,22,23,24,25,26], mercury intrusion capillary pressure (MICP), and gas adsorption (N2 and CO2) [14,24,27,28,29,30], are commonly used to characterize the pore and fracture structure of shale reservoirs.
There are some defects in these techniques [14,31,32]. The image method can be used to obtain the morphology, size, and distribution of pores in 2D space but cannot obtain the pore size quantitatively [23,33,34]. Mercury intrusion porosity measurement (MICP) can be used to determine pore radius, pore throat distribution, and other parameters but cannot obtain micropore structure parameters due to the limitation of injection pressure [14,18,35]. Parameters such as pore radius and specific surface area can be obtained by the gas adsorption method, but the existence of macropores will increase the measurement error [36]. These methods have limitations in characterizing the pore size range and cannot comprehensively reflect the pore and fracture structural characteristics of shale [33,37,38]. The current research trend is to combine multiple methods to quantitatively characterize the micro–nanoscale pore and fracture systems of shale with full aperture.
In previous studies, FIB-SEM, the gas adsorption method, and MICP were used to analyze the pore type of shale [9,19,33,39], and the micropore structure characteristics and influencing factors of micropores and mesopores were described [24,34,40]. Through the full-aperture characterization of pores, it was found that micropores provide the main specific surface area [4,41]. The above methods can be used to study the characteristics and structure of the pore–fracture system of shale but cannot quantitatively evaluate the degree of heterogeneity. Therefore, it is necessary to introduce fractal theory to study the heterogeneity of the pore–fracture system quantitatively.
Fractal theory originated in the 1970s and 1980s. Mandelbrot proposed the use of fractal dimension D to characterize the scale structure of the surface through metal fracture experiments to study irregular, rough, or broken natural structures [42]. Fractal theory was often used to describe the irregularity and self-similarity of complex objects [42]. In the field of geology, the internal pores of rocks are self-similar, which means that the pore structure is similar in different spatial scales, and the local structure of the pore structure is similar to the overall structure [27,43,44,45,46,47,48,49]. So, the pore structure of the reservoir space can be quantitatively characterized by fractal theory [45,49]. The fractal dimension of pore structure is distributed between 2 and 3; 2 means that the pore surface is absolutely smooth and 3 means that it is absolutely rough [47,48,49,50]. These two conditions are absolutely impossible in the field of actual geology. Generally, the smaller the fractal dimension, the more homogeneous the structure of the pore throat, and the larger the fractal dimension, the more heterogeneous the structure of pore throat, where the pore throat refers to the pores and the narrower throat connecting different pores. The research methods for fractal characteristics mainly focus on image analysis [46,51], constant velocity mercury injection [50], high-pressure mercury injection [27,44], gas adsorption [43,52,53], nuclear magnetic resonance, and so on [19]. Mature fractal mathematical models include the FHH (Frenkel–Halsey–Hill) model [54,55], BET model [43,52,56], Menger sponge model, NK model, capillary bundle model, and thermodynamic model [57]. The applicable conditions of each model are different. Previous research on fractal characteristics mainly focused on the pore structure of coal. At present, fractal studies have been widely used in the pore structure of marine shales, with limited research on the fractal characteristics of full-aperture pore and fracture systems of continental shales. Previous studies have found that marine and continental shales have obvious fractal characteristics through the gas adsorption FHH model and pointed out that the TOC and mineral components are the main factors affecting the fractal dimension [3,15,49,53]. However, in the research process, only a single technique is used to characterize the fractal characteristics of the pore structure, and it is impossible to characterize the heterogeneity of the nano–micron pores and fractures with full aperture.
In this paper, based on thin sections, AIM-SEM, and X-ray diffraction, combined with MICP and nitrogen adsorption techniques, our objectives are to (1) determine the characteristics and differences of the nano–micron pore and fracture system between laminated shale and layered shale in the Paleogene Shahejie Formation in the Dongying Depression; (2) propose a new characterization method for the full-aperture pore and fracture system of continental shale and clarify the fractal interval and the heterogeneity characteristics and differences between laminated shale and layered shale; (3) explore the influencing factors of heterogeneity and its specific effects on porosity and permeability; and (4) propose advantageous lithofacies for shale oil mobility based on the above three aspects. This research result will improve the understanding of the heterogeneity of full-aperture pore–fracture in continental shale and promote the efficient development of shale oil.

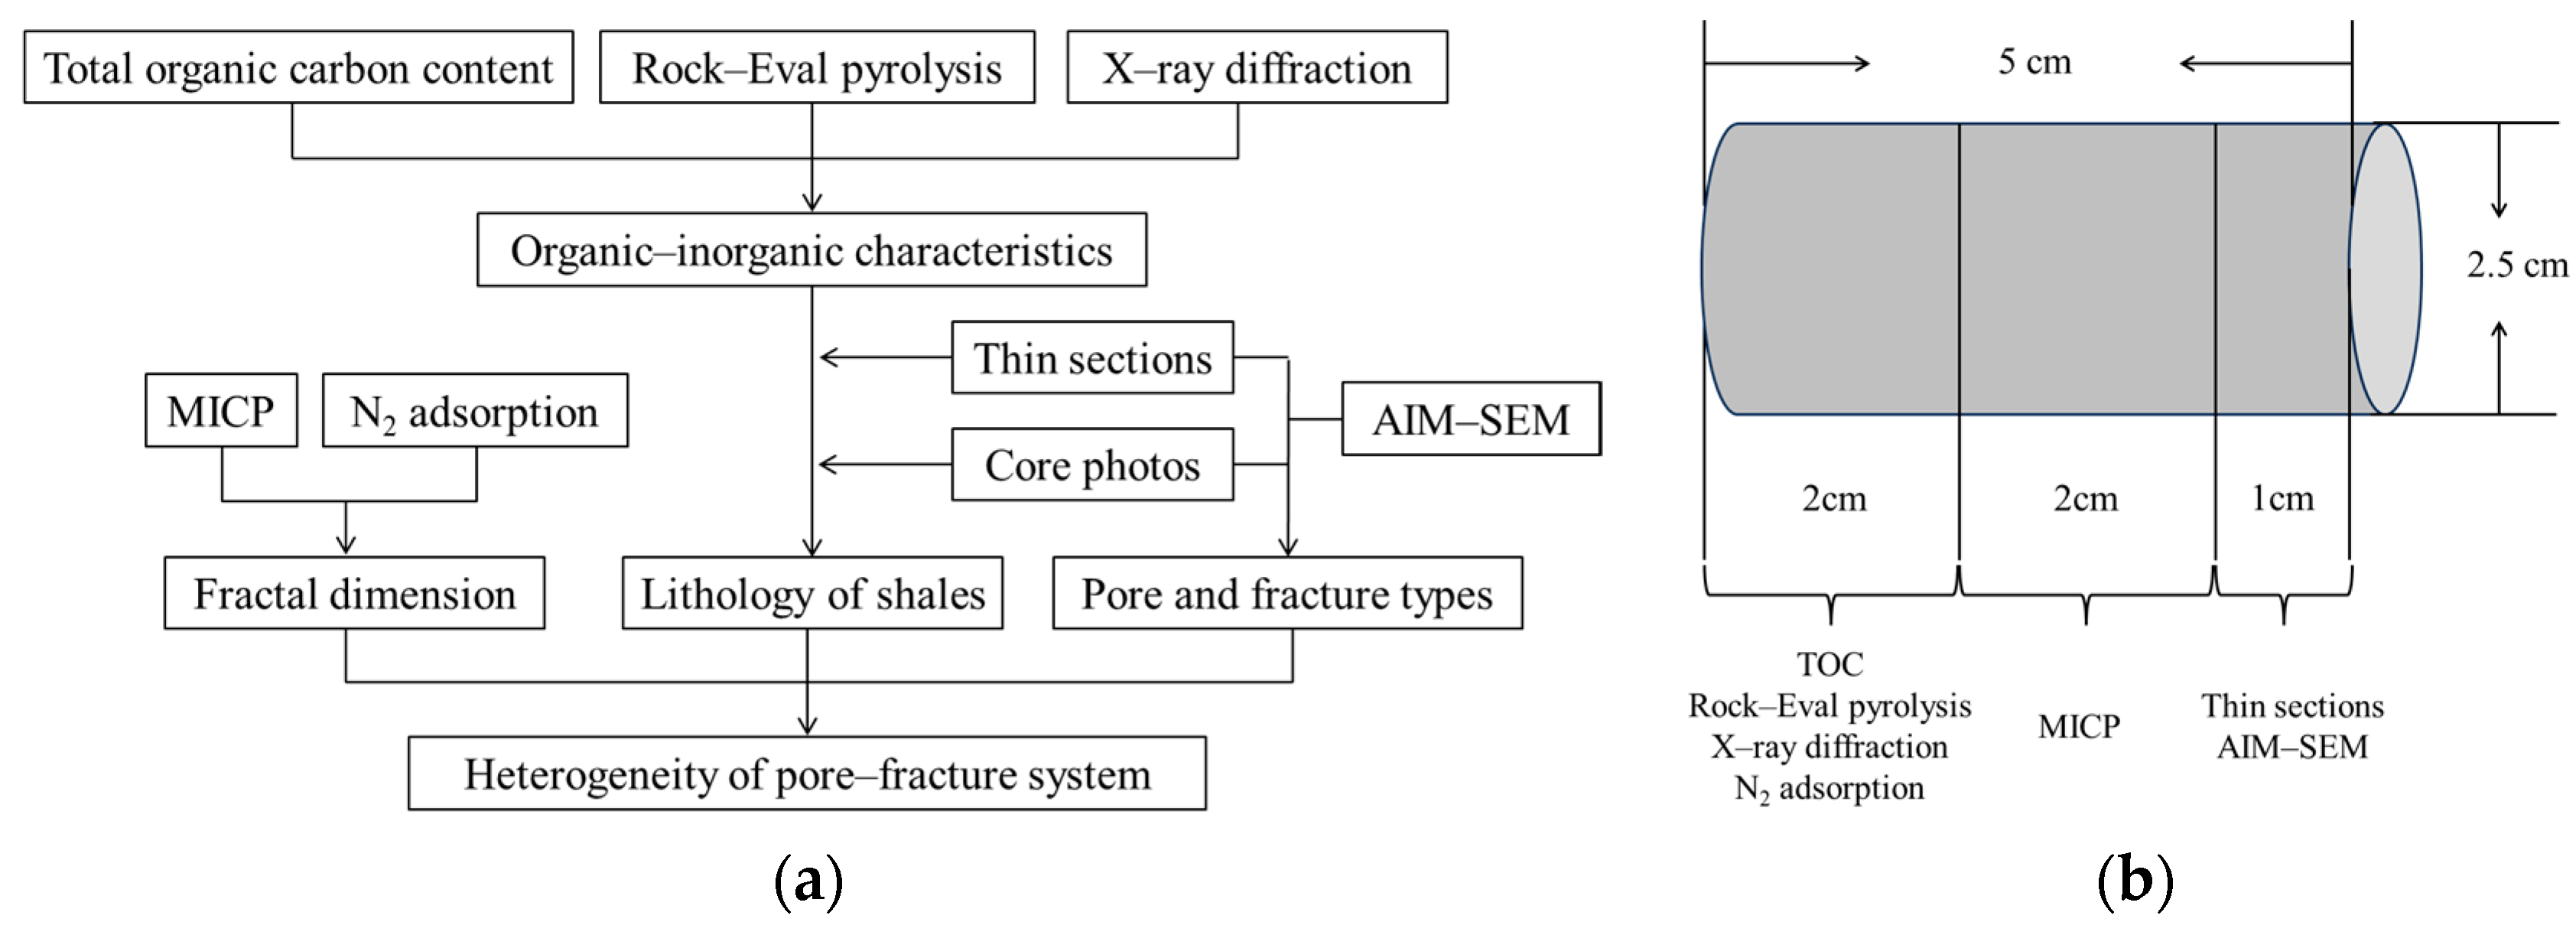
2. Materials and Methods

2.1. Materials

The Bohai Bay Basin, located in eastern China, is a Mesozoic–Cenozoic faulted basin, including seven depressions, such as the Jiyang Depression, Huanghua Depression, and Jizhong Depression. In recent years, great breakthroughs have been made in shale oil exploration in the Bohai Bay Basin, and the shale oil geological resources of the Shahejie Formation alone can reach (20.5–25.4) × 108 t [58,59]. Dongying Sag (DY Sag), located in the southeast of Bohai Bay Basin (Figure 1a), is a Mesozoic–Cenozoic lacustrine basin developed on Paleozoic bedrock. The maximum sedimentary thickness can reach 5000 m, and the Paleogene can be divided into the Kongdian Formation (Ek), Shahejie Formation (Es), and Dongying Formation (Ed) from bottom to top (Figure 1b). The Shahejie Formation from bottom to top can be further subdivided into four members, Es4, Es3, Es2, and Es1 [36,60]. During the sedimentation period of Es4 and Es3, the lake level continued to expand, resulting in a warm and humid deep and semi-deep lake sedimentary environment [6]. Coupled with frequent lake level changes, a shale series with a well-developed lamina structure was formed, which has a rich oil and gas display [13,15]. It is a key research area for the exploration and development of continental shale oil and gas in China.
In this paper, six layered shales and ten laminated shales were collected from the Paleogene Shahejie Formation in Well A, B, C, D, E, and F (Figure 1c) to study the pore–fracture system and fractal characteristics. Cylindrical samples with a size of 2.5 × 5 cm were selected and divided into the following parts: (1) a 2.5 × 2 cm cylinder for the MICP test; (2) a 2.5 × 1 cm cylinder for thin sections and AIM-SEM; and (3) the remaining samples were ground into powder less than 200 mesh, divided into four parts for X-ray diffraction, TOC, pyrolysis testing, and N2 adsorption (Figure 2a,b).
XRD, TOC, and pyrolysis tests were used to analyze the organic–inorganic geochemical characteristics of selected shale. X-ray diffraction was carried out with SmartLab high-resolution X-ray Diffractometer of Rigaku made in Japan to obtain the types and contents of minerals contained in the shale, which provides a basis for the classification of lithofacies [5]. The total organic content was tested by a CS-230HC carbon–sulfur analyzer to determine the total organic matter content in shale. The contents of free hydrocarbon (S1) and pyrolyzed hydrocarbon (S2) and OSA Tmax were measured by a Rock-Eval 6 Pyrolyzer made in France [15,40]. Core photos, thin sections, SEM [29], nitrogen adsorption, and MICP were used to determine the lamina structure and pore and fracture types of the shale [40]. After freeze-drying and dipping [62], a colloidal aqueous emulsion was used to glue a block of shale to a glass slide, and then, it was ground to 0.03 mm. For better identification of calcite, ferrocalcite, and ankerite, half of the samples were stained with Alizarin Red dye and finally observed using a Zeiss Axio Scope 5 made in Germany upright microscope for PPL and XPL. Core photos and thin-section images describe the petrological and fracture characteristics of shale. Shale samples were cut into 1 cm cubes and polished with argon ions. A Quanta 200F scanning made in American electron microscope was used to observe the type and morphology of pores. The instrument used in the nitrogen adsorption experiment was the Micromeritics ASAP2460 surface area and porosity analyzer made in American, which obtains pore structure parameters through adsorption–desorption data. The MICP tests were carried out with Corelab CMS300 made in American and an AutoPore IV 9505 Mercury Porosimeter made in American. Pore distribution curves and capillary pressure curves were obtained by continuously changing the pressure of mercury injection into rocks. Finally, the corresponding fractal model was used to calculate the fractal dimension of nitrogen adsorption and MICP experiments [63] and to investigate the heterogeneity of the full-aperture pores and fractures of shale in DY Sag.

2.2. Fractal Dimension Calculation Method

2.2.1. Calculation Method from MICP

Based on fractal theory, the mathematical model for calculating fractal dimension can be expressed by power law function as follows [27,45]:
N r r D ,
Combining the capillary model, the MICP calculation method can be expressed as follows:
lg S H g = D H g 2 lg p c + C ,
where C is a constant. If the pore fractal feature exists, lg S H g and lg p c have a linear relationship. The fractal dimension D H g is derived from the slope K H g of the fitted curve, where D H g = K H g + 2.
The pore structure of shale is complex and has multifractal characteristics. In practice, when calculating the fractal dimension from MICP tests, it is necessary to partition the log–log intersection of S H g and p c to determine the slope of different fractal intervals and obtain the corresponding fractal dimension.

2.2.2. FHH Model from N2 Adsorption

The FHH model is usually used to calculate the fractal dimension of nitrogen adsorption tests. When p / p 0 < 0.4 (low-pressure stage), the van der Waals force between the solid and the adsorption layer is the main factor, and the adsorption is mainly affected by the roughness of the solid surface [47].
ln V = 1 3 K N 1 ln ln P 0 P + C ,
When p / p 0 > 0.4 (high-pressure stage), the curves of nitrogen adsorption and desorption no longer coincide, forming a hysteresis loop. The surface tension of the adsorption medium is the main factor, and the adsorption is mainly affected by the capillary force [47].
ln V = K N 2 ln ln P 0 P + C ,
where K N 1 is the slope in the low-pressure phase, K N 1 = D N 1 3 ; D N 1 is the fractal dimension in the low-pressure stage, D N 1 = 3 K N 1 + 3. K N 2 is the slope in the high-pressure phase, and K N 2 = D N 2 3 ; D N 2 is the fractal dimension in the high-pressure stage, D N 2 = K N 2 + 3 [43,52].

2.2.3. A New Method Combined with MICP and N2 Adsorption

Limited by the maximum mercury injection pressure and experimental principle, MICP tests cannot characterize the pore structure of pore sizes less than 3.6 nm and pore sizes more than 50 nm. The N2 adsorption experiment is more accurate in characterizing the pores in the range of 2~50 nm, and the experimental error will increase due to the existence of large pores. In previous studies, only one model is usually used to obtain the fractal dimension [45,51,64]. However, the pore structure of lacustrine shales is complex, and pore sizes are widely distributed in the range of micron to nanometer. A single MICP model or FHH model cannot fully and systematically characterize the pores in shale [63,65]. In the actual calculation process, the fractal dimension calculated by the MICP model is large in the micropore region, and some samples appear to be greater than 3. The fractal dimension calculated by the FHH model is generally small in the low-pressure stage, and the D of some samples is less than 2. This is obviously inconsistent with the actual geological situation.
Therefore, in order to avoid the defects of individual models, this paper innovatively combined the MICP model with the FHH model. The FHH model is used to correct the fractal dimension of the micropore region in MICP tests, while the MICP model supplements the inaccuracy of the FHH model in characterizing the fractal dimension of large-pore regions. The MICP model and FHH model are used to systematically characterize the heterogeneity of micron–nanopores in shale.
According to the capillary pressure curve of MICP tests, the log–log coordinates of lg S H g and lg p c are found. The lg S H g and lg p c calculated by the data of the mercury injection process have a good agreement with the mercury injection pressure curve. The aperture distribution curve is superimposed with the fractal dimension fitting curve. According to the morphology of the obtained curves, the fractal dimension fitting curve has the characteristics of four zones. The least square method is used to obtain the slope of the curve and calculate the fractal dimension of different sections. Considering that the MICP tests are affected by the “pore shielding effect”, it cannot accurately distinguish the pore and throat. Therefore, this paper defines the fractal dimension between the four partitions as D H 1 , D H 2 , D H 3 , and D H 4 , representing fractures (>10 μ m ), macropores (1~10 μ m ), mesopores (10 nm~1 μ m ), and micropores (<10 nm).
In the FHH model, according to the experimental data of N2 adsorption, the log–log coordinates of ln V and ln ln P 0 P in the low-pressure and high-pressure stages are drawn. The least square method was used to fit the curves, the slope of the curves of the low-pressure stage and the high-pressure stage were obtained, and the corresponding fractal dimension was calculated. The dominant effect of N2 adsorption in the low-pressure stage is the interlayer van der Waals force, and the fractal dimension D N 1 represents the roughness and heterogeneity of the pore surface of shales. In the high-pressure phase, the capillary force plays a leading role, and the fractal dimension D N 2 indicates the complexity and heterogeneity of the pore structure. The study of heterogeneity is usually intended to characterize the heterogeneity of pore structure, so only the D N 2 is usually selected in the FHH model.
Combining the MICP model and FHH model, D N 2 is substituted for D H 4 of the MICP model. The final quadrangle dimensions used to study heterogeneity are D H 1 , D H 2 , D H 3 , and D H 4 . These parameters can be used to systematically characterize the heterogeneity of the micron–nanopore–fracture system in lacustrine shales.

3. Results

3.1. Geochemical Parameters

The organic geochemical parameters are shown in Table 1. The total organic carbon (TOC) content ranges from 0.69% to 8.60%, with an average of 4.25%. The hydrogen index HI (HI = S2/TOC × 100) [66] versus Tmax plots indicate that the organic matter type is mainly Type II1 (Figure 3). Tmax can judge the maturity of organic matter. Generally, the higher the maturity, the higher the Tmax. The Tmax of shales varies in the range of 436~449 °C, with an average of 441 °C, which indicates that the shales are in the mature stage (Ro ranging between 0.70% and 0.80%, with an average of 0.74%). The HI versus (S1 + S2) plots show that the shales are good and very good source rocks (Figure 4). The shales of the Shahejie Formation are high-quality source rocks and have a high hydrocarbon generation potential [(S1 + S2) is 21.39 mg/g on average]. The Shahejie Formation has good exploration and development prospects.

3.2. Petrology Characteristics and Lithofacies Classification

Table 1 shows that the shales of the Shahejie Formation in DY Sag have complex mineral types and varied mineral contents. The main components are calcite (13.7~72.7%, 33.8% on average), dolomite (0~67.3%, 21.6% on average), clay minerals (7.8~44.5%, 24.8% on average), quartz (4.7~28.7%, 18.4% on average), and a small amount of feldspar (0.9~18.6%, 4.1% on average), pyrite (0.3% to 6.4%, 3.4% on average), and other minerals (about 6.5%). On the whole, it is characterized by high carbonate minerals, high clay minerals, and low felsic minerals.
The morphology of the mineral can be observed by scanning electron microscopy (SEM). Calcite and dolomite are mainly granular (Figure 5a,b). The crystal form of quartz is intact and exists independently from the mineral (Figure 5c). Feldspar usually develops in a tabular form (Figure 5d). Clay minerals are mainly illite, kaolinite, and illite/montmorillonite mixed layers (Figure 5e). Pyrite is produced mostly in the form of pyrite framboids (Figure 5f). According to the mineral composition, the shales of the Shahejie Formation in Dongying Sag can be divided into mixed shale and calcareous shale, while clay shale and siliceous shale are underdeveloped (Figure 6).
Continental shale has a complex lamina structure, which has a significant influence on the nano–micropore and fracture structure. The three end members on the classification triangle chart are carbonate minerals, clay minerals, and felsic minerals. The conventional classification scheme ignores the influence of complex lamina structure on continental shale. In order to accurately describe the lithofacies of shale, the organic matter content and lamina structure should be combined in the classification. Thin-section images show that multi-scale lamina structures are developed in DY Sag, and carbonate lamina (CAL, bright layer), felsic lamina (FL), clay lamina (CL, dark layer), and organic matter lamina (OML) can be identified. Several types of laminae appear alternately and have different combination patterns (Figure 7). According to the thickness of different mineral laminae, the samples are divided into laminated shale (the thickness of the laminae is less than 1 mm), layered shale (the thickness of the laminae ranges between 1 and 3 mm), and massive shale (laminae not developed). Based on the total organic matter content, we can divide the shale into organic-containing shale (TOC < 2%) and organic-rich shale (TOC > 2%) [60,61]. In this paper, the lithology of the shale is named according to the combination model of “TOC–lamina structure–mineral composition”. The corresponding lithology of the shale samples is shown in Table 1. The purpose of this article is to study the heterogeneity of the pore and fracture system of lacustrine shales with a complex lamina structure, so we mainly evaluate the heterogeneity of laminated shale and layered shale quantitatively.

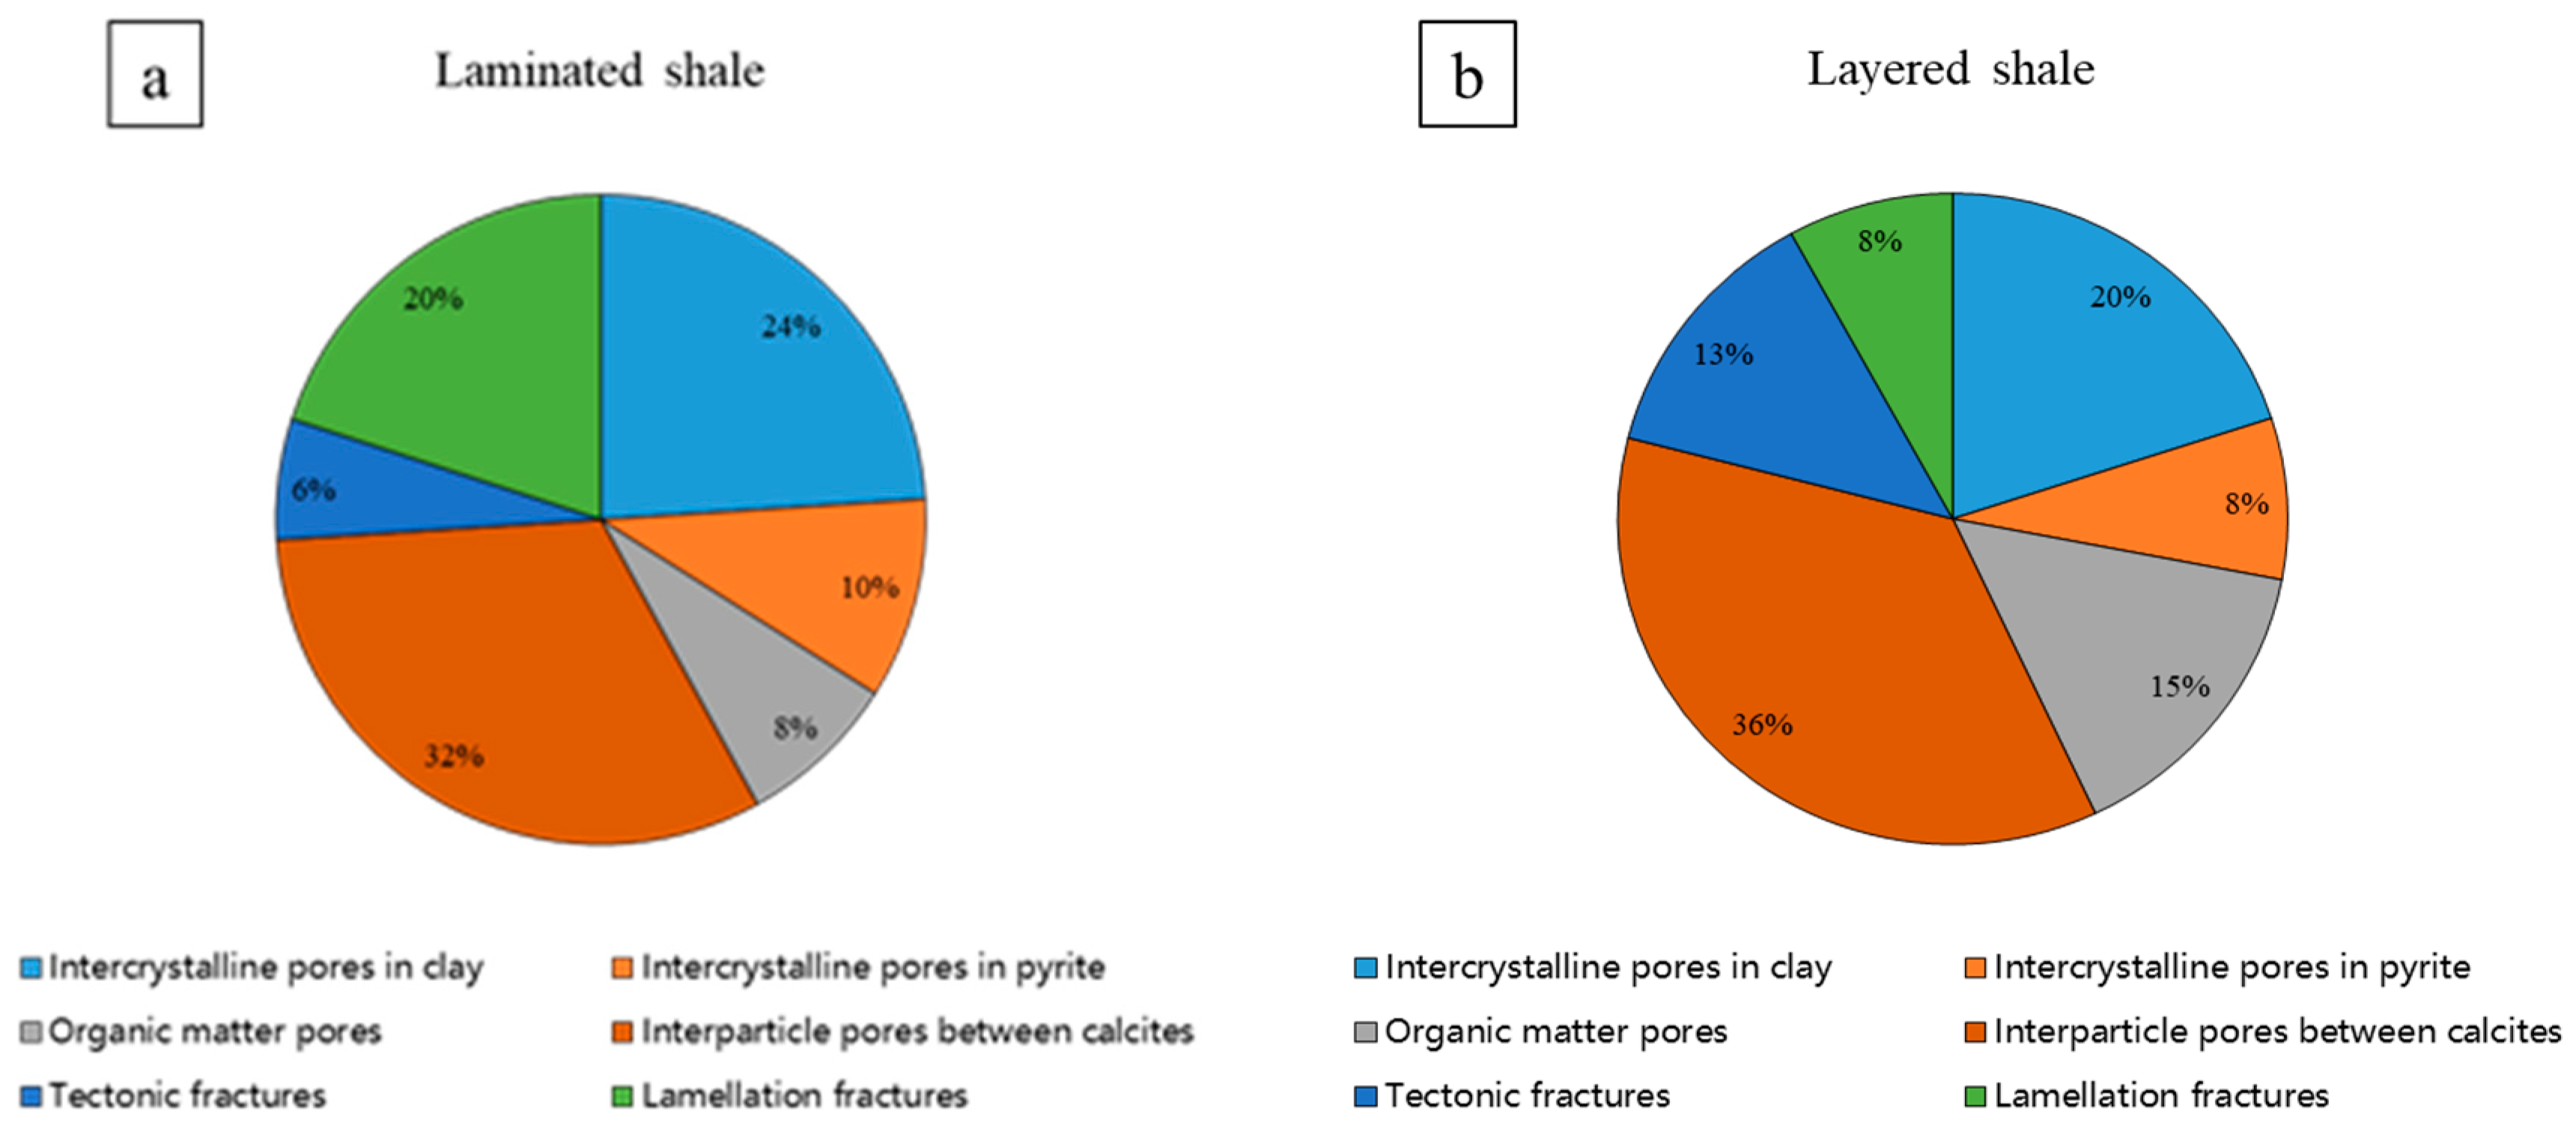
3.3. Pore and Fracture Characteristics

Scanning electron microscopy is an important research method for observing the type and morphology of a shale reservoir [67]. SEM images show that the shale reservoir space in the study area is complex and can be divided into pores and fractures. According to the morphology and development, the observed pores can be divided into interparticle pores, intercrystalline pores, intragranular dissolution pores, and organic matter pores [5,16,17,29]. Among them, interparticle pores and intercrystalline pores are the main pore types [10]. Interparticle pores mainly develop at the contact of brittle minerals such as calcite, dolomite, and quartz. The aperture is large, mainly distributed in a few micrometers (Figure 8a). The intergranular pores mainly include clay mineral intergranular pores and pyrite intergranular pores. The intercrystalline pores of clay minerals usually distribute in a layered and narrow slit shape in the matrix (Figure 8b). The pore size of these pores is small, usually less than 600 nm (Figure 8c). A large amount of pyrite framboids can be observed in the shale samples, with numerous intercrystalline pores developed inside these pyrite crystals; the pore size is usually smaller than 400 nm (Figure 8d). Oil film can be seen between pyrite crystals (Figure 8e). The dissolution pores of the shale samples in the study area are relatively developed. Feldspars are dissolved, and the surface becomes rough. The morphology of the dissolution pores is irregular, and the pore size distribution range is wide (Figure 8f). Controlled by the low degree of thermal evolution in the study area, there are fewer organic matter pores developed. The SEM images show that organic matter is mostly distributed in strips or irregularly dispersed in the matrix in the shale (Figure 8g,h). Circular or elliptical organic matter pores are developed inside organic matter, with smaller pore sizes typically distributed in the tens of nanometers (Figure 8i).
According to the core and thin-section photos, the study area has developed two types of fractures, including structural fractures and micro-fractures (including abnormal pressure fractures, diagenetic contraction fractures, and bedding fractures). Under the influence of regional tectonic stress, the fractures developed in the study area can be divided into high-angle fractures (fracture inclination > 75°) and low-angle fractures. The fractures extend far, and most of the fractures are not filled with minerals (Figure 9a–c). During the sedimentation and diagenesis process of shale, abnormal high pressure caused by the transformation and dehydration of clay minerals, hydrocarbon generation, and hydrothermal activities can all lead to the formation of abnormal pressure fractures (Figure 9d). The content of clay minerals in shale samples in the study area is generally high. During the diagenetic stages, clay minerals were dehydrated and contracted, which can easily form shrinkage joints in the edges of quartz and calcite minerals (Figure 9e). The volume reduction in organic matter in the process of thermal evolution can also form shrinkage joints at the edges of organic matter (Figure 9f).
The mechanical properties of mineral laminae are different, and the laminae with different properties produce lamellation fractures due to extension or contraction. According to the observation of thin sections, the lamellation fractures develop approximately parallel to the stratification direction (Figure 10a). Fractures perpendicular to the stratification often develop between multiple bedding fractures (Figure 10b), which can connect the lamellation fractures together and become a good migration channel for shale oil. The lamellation fractures can be divided into secondary fractures at the end and continue to extend. Two secondary fractures may also merge into a single fracture after extending some distance (Figure 10c). During the extension process, fractures do not pass through mineral particles; instead, they bend and extend along the edges of mineral particles (Figure 10d).
The composition of the pore and fracture system of shales with different lamina structures is different. Laminated shale has frequent alternations in organic matter lamina, felsic lamina, clay lamina, and carbonate lamina. Due to the different mechanical properties of laminae, the lamellation fractures are well developed. The interlaminar thickness of stratified shale is large, and observed under core and thin photos, the development of lamellation fractures is less, while the structural fractures are very developed. Laminated shale mainly develops interparticle pores between calcite crystals, intercrystalline pores between clay minerals, and intercrystalline pores in pyrite. Meanwhile, layered shale develops interparticle pores between calcite crystals, intercrystalline pores between clay minerals, and dissolution pores in feldspars (Figure 11a,b).

4. Discussion

4.1. Heterogeneity of Pore Structure

Superimposing the pore size distribution curve and fractal dimension fitting curve of MICP, we can find that the fractal curves of laminated shale and layered shale in Dongying Sag have the characteristics of four zones. Taking sample F-1 as an example (Figure 12a), with the increase in the mercury injection pressure, mercury first enters the pores which are sized greater than 21.435 μ m and fractures. Subsequently, mercury saturation increased less in the pore size range of 0.268~21.435 μ m , indicating less development of macropores. With a further increase in the mercury injection pressure, mercury saturation increases greatly in the pore size range of 0.009~0.268 μ m , indicating that mesopores are widely developed. Eventually, the mercury enters pores sized smaller than 0.009 μ m . The fitting results of the fractal dimension of nitrogen adsorption at different pressure stages is shown in Figure 13. The fractal dimensions of different zones of selected samples are shown in Table 2.
The fractal dimension (D) of fractures ranges from 2.577 to 2.838, with an average of 2.742. The D of macropores is 2.046~2.192, with an average of 2.092. The D of mesopores is 2.260–2.955, with an average of 2.554. The D of micropores ranges from 2.414 to 2.689, with an average of 2.487. The correlation coefficients (R2) are more than 0.95 (Table 2). The heterogeneity of the shale reservoir space structure is generally strong. Among them, the heterogeneity of fractures is the highest. The heterogeneities of mesopores and micropores are medium, and the pore structures are relatively complex. Macropores are more homogeneous and have a simple structure.

4.2. Heterogeneity of Pore Structure of Shales with Complex Lamina Structure

There is a strong difference in the heterogeneity of the micro–nanopore and fracture system between laminated shale and layered shale. Overall, the heterogeneity of fractures and mesopores is the strongest, micropores have a medium heterogeneity, and the structure of macropores is simple and relatively homogeneous. The heterogeneity of fractures in mixed shale and calcareous shale is similar, with slightly weaker heterogeneity in macropores, significantly stronger heterogeneity in mesopores, and slightly stronger heterogeneity in micropores compared to calcareous shale (Figure 14a). The heterogeneity of macropores and micropores is similar between laminated shale and layered shale. The heterogeneity of fractures in laminated shale is weaker than that in layered shale, but the heterogeneity of mesopores in laminated shale ( D H 3 on average 2.647) is significantly stronger than that in layered shale ( D H 3 on average 2.400) (Figure 14b).
The content of brittle minerals in mixed shale is low, while the content of clay minerals is high. The interparticle pores between brittle minerals are often filled by clay minerals, which leads to a more complex pore structure. The clay mineral content of mixed shale is about twice that of calcareous shale (the average clay mineral content of mixed shale is 31.97%, while that of calcareous shale is 15.67%), but the types of clay minerals are similar, mainly illite, kaolinite, and illite mixed layers. The structure of the intercrystalline pores between clay minerals is relatively similar, mainly in the form of plate-like structures. Due to the frequent alternations between clay and carbonate laminae, the fractures developed in laminated shale are mainly lamellation fractures, with less development of structural fractures. The lamellation fractures developed in laminated shale of the Shahejie Formation are relatively straight, and the characteristics between different lamellation fractures are similar. Occasionally, the lamellation fractures are connected by cross-lamellation fractures, but the length of these fractures is short. Layered shale has fewer lamellation fractures and more structural fractures. The pore size distribution curve and fractal dimension fitting curve reflect that there are few macropores in laminated shale and layered shale. The macropores are mainly dissolution pores, which are similar and relatively homogeneous in the two types of shales. Nitrogen adsorption and MICP experiments show that laminated shale and layered shale mainly develop mesopores, with their pore volume accounting for about 70% of the total pore volume. Mesopores are mainly interparticle pores between carbonate minerals and intercrystalline pores between clay minerals. The laminated shale has a thin laminae thickness and lacks the crystalline space of carbonate minerals. There are significant differences in the morphology and structure of carbonate interparticle pores, while layered shale has sufficient crystalline space and complete interparticle pores. Therefore, the interparticle pores between carbonate minerals developed in laminated shale are more heterogeneous compared to layered shale. Micropores occupy a small proportion of the shale reservoir (pore volume less than 5%). The heterogeneity of micropores is moderate in both laminated shale and layered shale. The pore structure of micropores is very complex and needs further experiments such as CO2 adsorption to characterize.

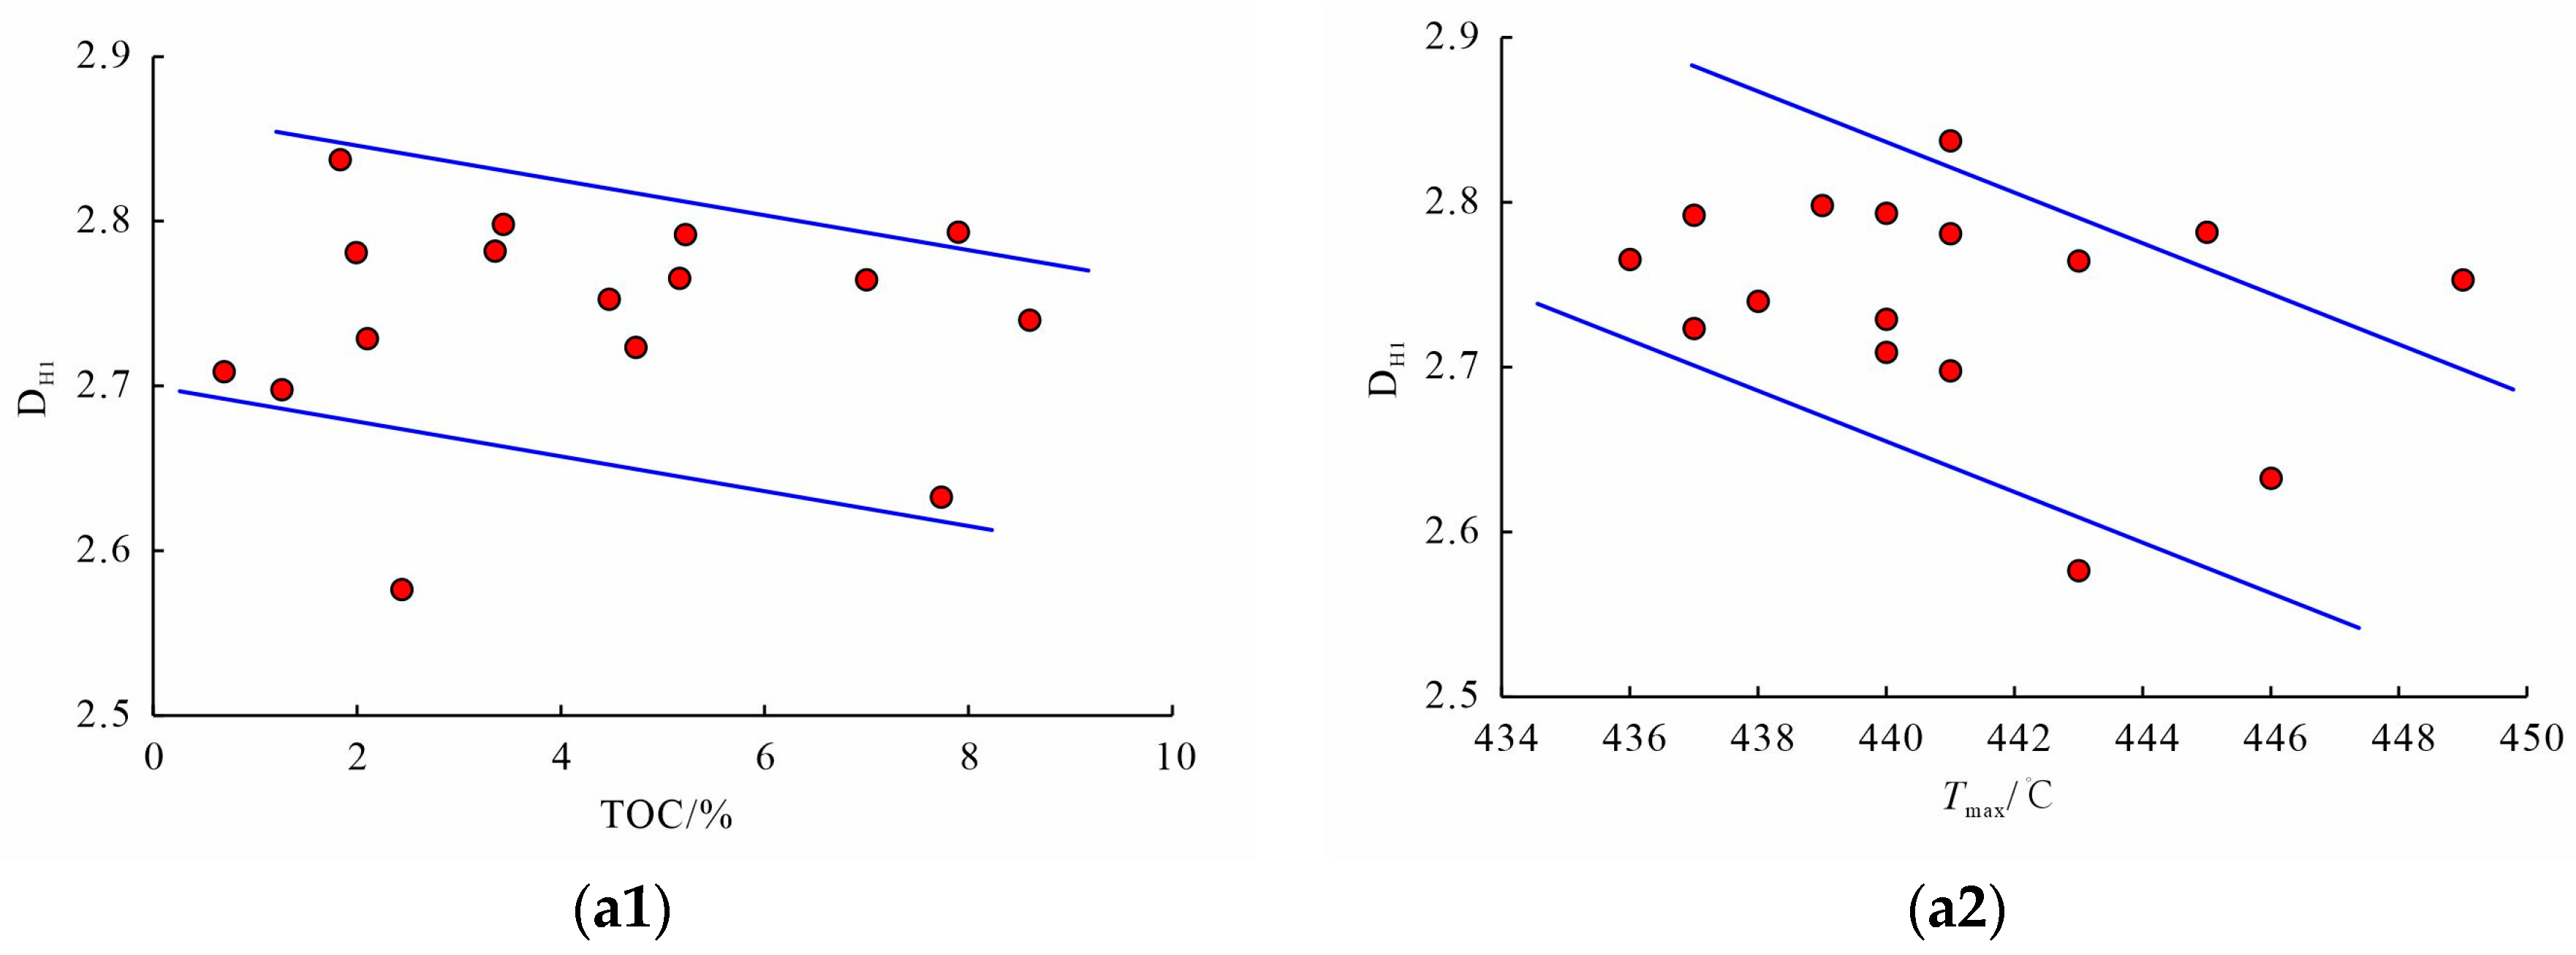
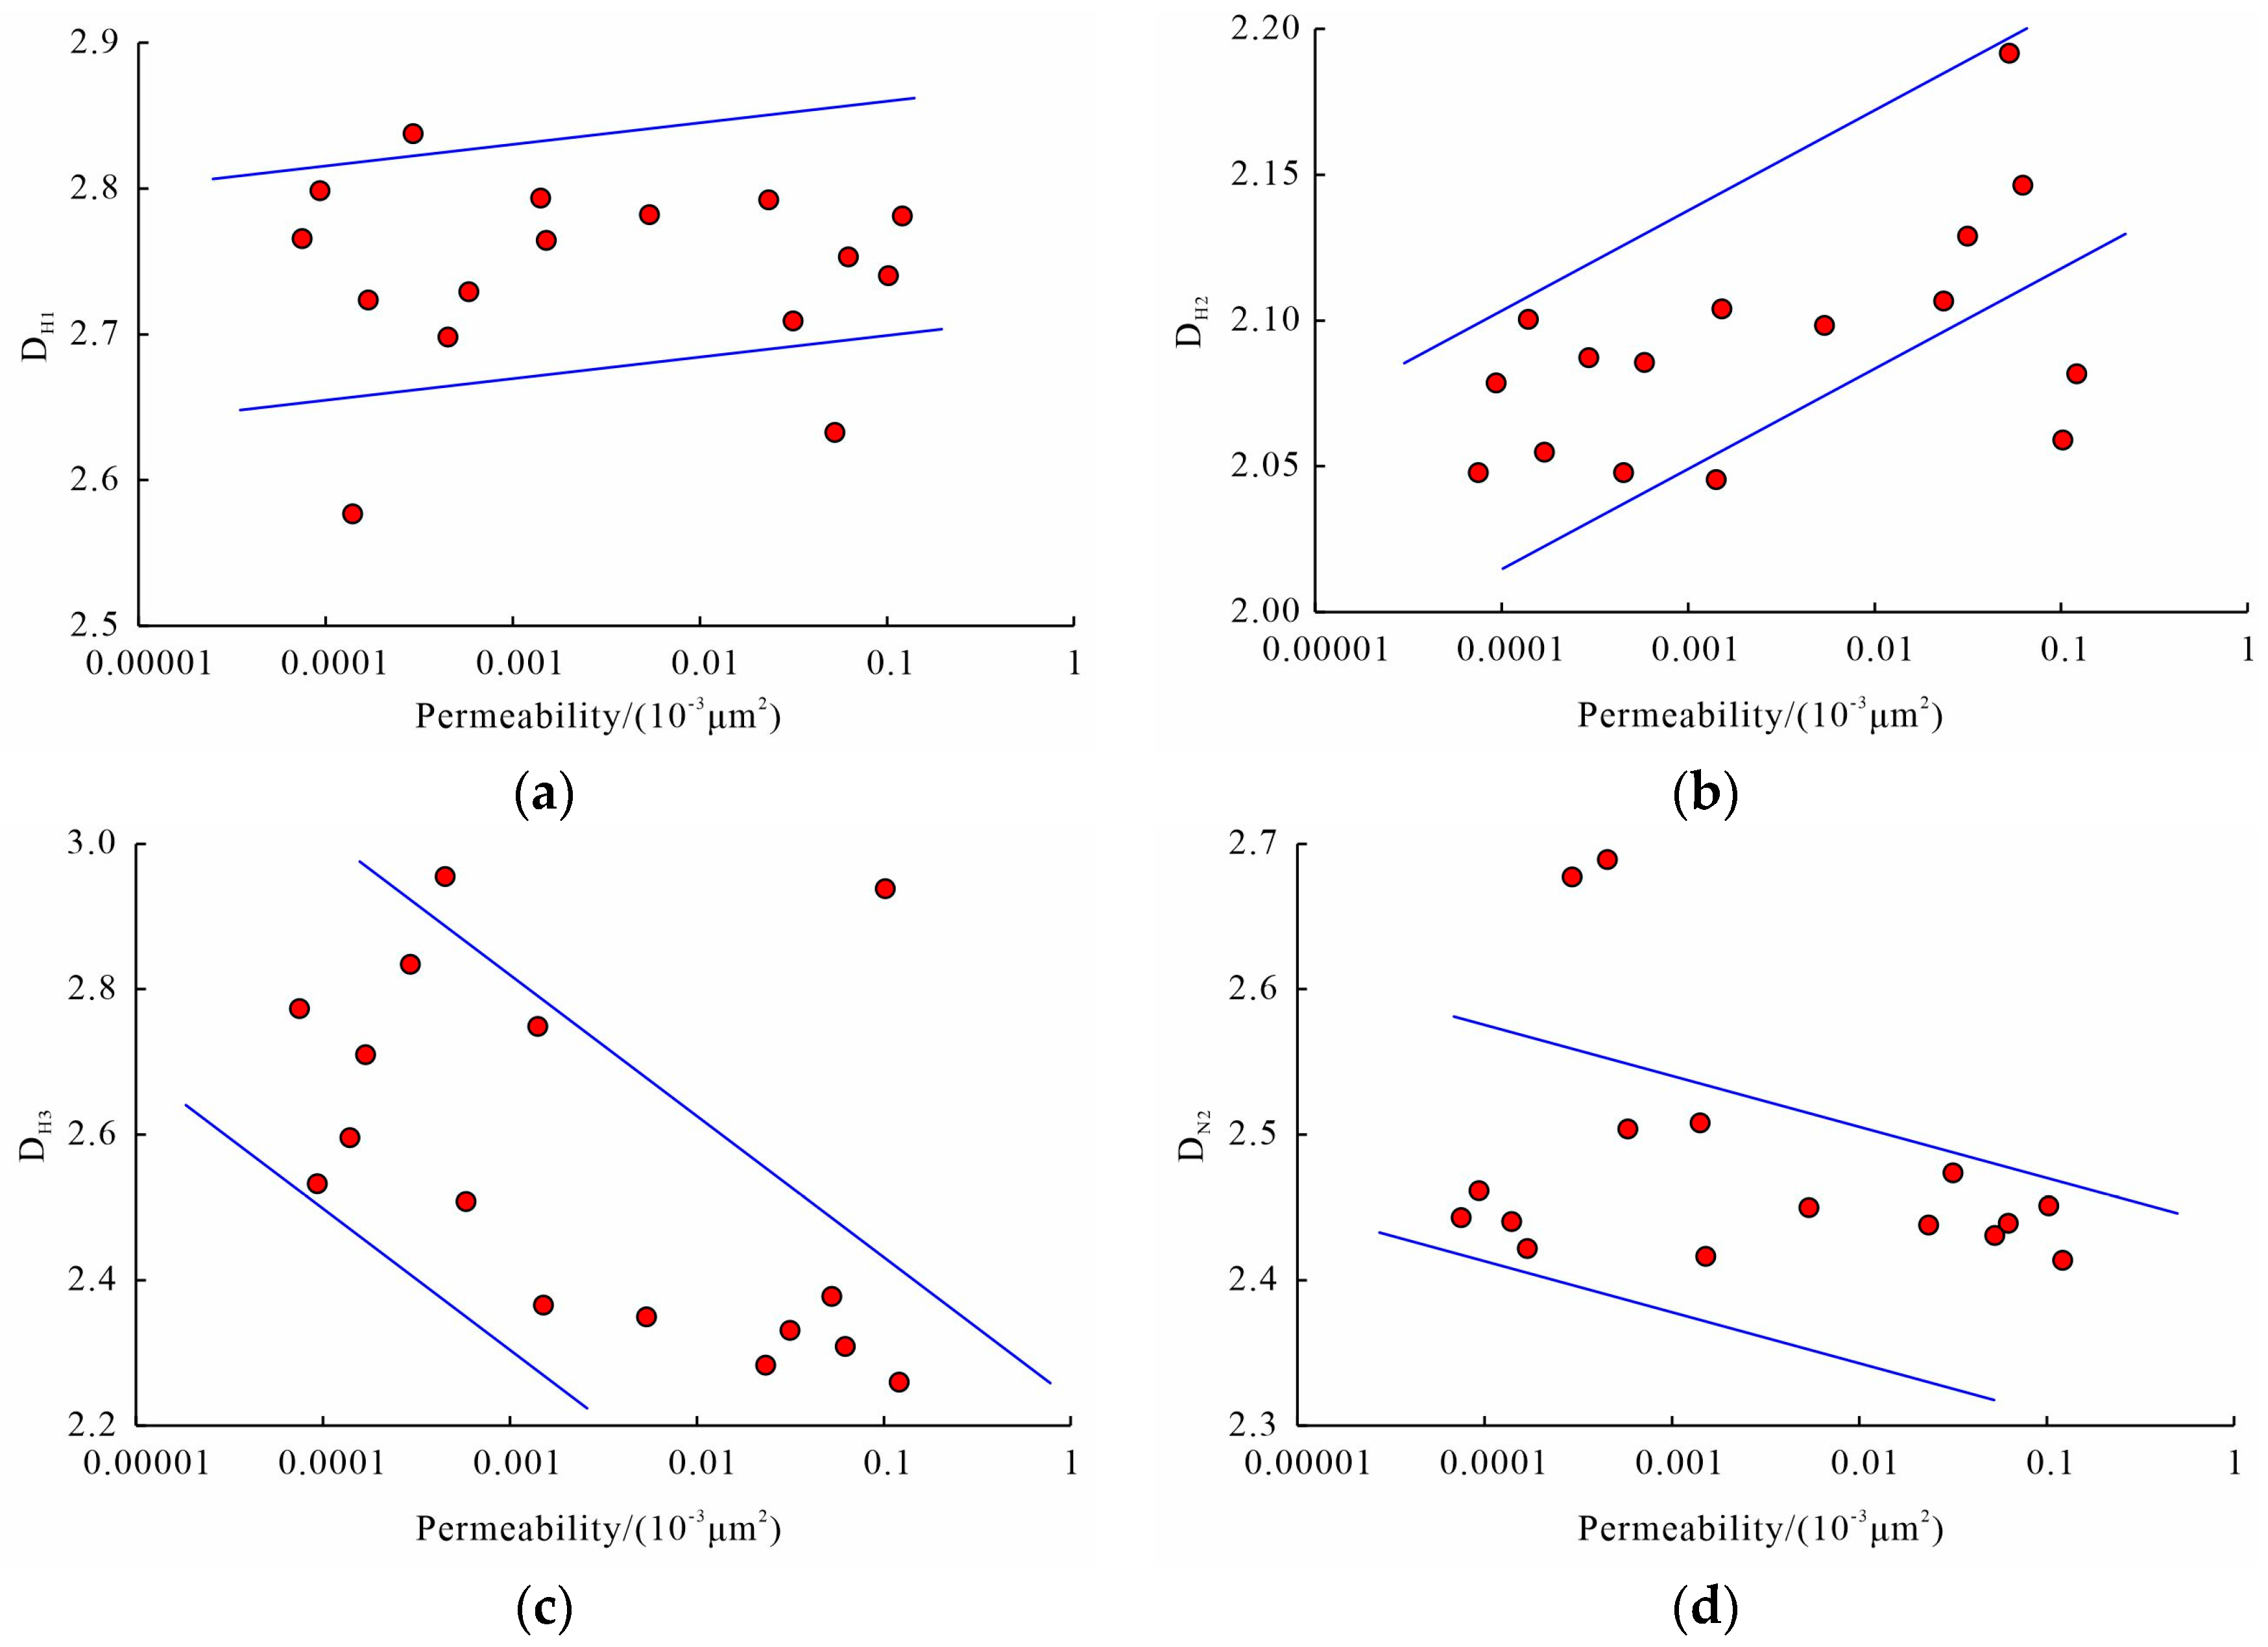
4.3. The Influencing Factors of Heterogeneity and the Effects on Reservoir Properties and Seepage Ability

The content of organic matter and mineral composition are the main factors affecting the types and structures of micro–nanopores and fractures in shale [68]. With the increase in organic matter content and thermal evolution degree, the heterogeneity of fractures, mesopores, and micropores decreases, while the heterogeneity of macropores increases. The shales with a high organic matter content usually develop in the deep depression zones of the basin, with less tectonic activities and a stable sedimentary environment. The shale laminae developed in this environment are relatively straight, and the fractures are mainly composed of lamellation fractures with fewer structural fractures. The lamellation fractures are relatively straight, and the width of the fractures in each position is roughly the same. The structure between the bedding fractures is relatively similar. Owing to the low thermal evolution of organic matter in this study area, the volume shrinkage of organic matter in this stage mainly leads to the formation of larger shrinkage cracks between organic matter and the mineral matrix, while organic matter pores with smaller pore sizes are not yet developed or less developed. Therefore, with the increase in the degree of thermal evolution of organic matter, the heterogeneity of macropores increases, while the heterogeneity of mesopores and micropores decreases (Figure 15).
An increase in feldspars and quartzes will increase the brittleness of shale, which is conducive to the formation of structural fractures, and increase the complexity of fractures (Figure 16(a1)). There is less development of lamellation fractures in shale with high carbonate mineral content, and only a few structural fractures can be observed in core and thin-section photos. The development degree of fractures is relatively low. Clay minerals can increase the toughness of shale, inhibit the development of structural fractures, and block existing fractures, increasing the complexity of fractures (Figure 16(c1)). A higher felsic mineral content is conducive to the development of interparticle pores with larger pore sizes. A change in the carbonate mineral content mainly affects the development of interparticle pores in the mesopore size range. The content of feldspar, quartz, and carbonate minerals increased, and the main control macropores and mesoporous pores showed homogenization characteristics (Figure 16(a2,b3)). This phenomenon confirms that the pore morphology of interparticle pores is regular and the pore structure is relatively uniform. The micropores developed in the shale of Dongying Sag are mainly intercrystalline pores of several nanometers to tens of nanometers between clay minerals. These pores are usually in the form of a closed plate or narrow slit at one end, with a single pore type and low heterogeneity (Figure 16(c4)).
The heterogeneity of pores and fractures directly affects the permeability of shale. An increase in the heterogeneity of fractures and macropores will increase the permeability of the sample (Figure 17a,b). The heterogeneity of mesopores and micropores is not conducive to the seepage of hydrocarbons, and the influence of mesopores is more significant (Figure 17c,d). Although fractures and macropores promote the permeability of shale, they need to be connected with mesopores and micropores. Mesopores and micropores play a decisive role in the flow of oil and gas in shale. The nitrogen adsorption and MICP tests indicate that the pore volume of micropores mainly composed of intercrystalline pores between clay minerals is small, but these micropores occupy the vast majority of the specific surface area of the shale reservoir space, which mainly affects the adsorption of hydrocarbons and has a relatively small impact on the seepage of hydrocarbons. Combined with the previous discussion on the factors affecting the heterogeneity of the pore and fracture system, this paper ultimately points out that the shale with low felsic minerals, low clay minerals, high carbonate minerals, and a high thermal evolution degree is the dominant lithofacies of shale oil accumulation and migration.

5. Conclusions

Through MICP and nitrogen adsorption, combined with fractal theory, this paper researched the heterogeneity of the micro–nanopore and fracture system of lacustrine shales with a complex lamina structure in Dongying Sag. The authors draw the following conclusions:
(1) The laminated shale mainly develops interparticle pores between carbonate minerals, intercrystalline pores in pyrite, intercrystalline pores between clay minerals, and lamellation fractures. Layered shale develops interparticle pores between carbonate minerals, intercrystalline pores between clay minerals, intragranular dissolution pores in feldspar, and structural fractures.
(2) The lacustrine shales with a complex lamina structure have fractal characteristics among four zones, representing the heterogeneity of fractures, macropores, mesopores, and micropores. The overall heterogeneity of the pore and fracture system is strong. The characteristics of laminated shale are relatively homogeneous in fractures with strong heterogeneity in mesopores and moderate heterogeneity in micropores. Meanwhile, in layered shale, the characteristics are strong heterogeneity in fractures, homogeneous in mesopores, and moderate heterogeneity in micropores.
(3) Organic matter and mineral composition are the main factors affecting heterogeneity. An increase in the TOC and the degree of thermal evolution will increase the heterogeneity of macropores. Macropores and mesopores are mainly composed of interparticle pores between felsic minerals and carbonate minerals, and macropores and mesopores tend to be homogeneous with the increase in felsic and carbonate minerals. An increase in clay mineral content will promote the formation of slit or plate-like intercrystalline pores, making the pore structure simple.
(4) The heterogeneity of mesopores plays a decisive role in the flow of shale oil. Shale oil in laminated shale with high carbonate minerals and a high thermal evolution degree has strong mobility.

Author Contributions

Conceptualization, S.L. and J.Q.; Methodology, S.L. and J.Q.; Validation, Y.L. and X.L.; Formal Analysis, J.Q.; Resources, J.Z.; Data Curation, S.L.; Writing—Original Draft, S.L.; Writing—Review and Editing, S.L. and J.Q.; Visualization, S.L., C.L., Y.L., Z.K. and X.L.; Supervision, J.Q. and J.Z.; Funding Acquisition, J.Z. All authors have read and agreed to the published version of the manuscript.

Funding

This research was funded by the National Natural Science Foundation of China, grant number 41972147; the Young Scientists Fund of the National Natural Science Foundation of China, grant number 42302144; the Fundamental Research Funds for the Central Universities, grant number 2462023BJRC012.

Data Availability Statement

The data used to support the findings of this study are available from the corresponding author upon request.

Conflicts of Interest

The authors declare no conflicts of interest.

References

  1. Jarvie, D.M. Shale Resource Systems for Oil and Gas: Part 2—Shale-Oil Resource Systems; American Association of Petroleum Geologists: Tulsa, OK, USA, 2012. [Google Scholar]
  2. Jia, C.; Zheng, M.; Zhang, Y. Unconventional hydrocarbon resources in China and the prospect of exploration and development. Pet. Explor. Dev. 2012, 39, 139–146. [Google Scholar] [CrossRef]
  3. Guan, M.; Liu, X.; Jin, Z.; Lai, J.; Liu, J.; Sun, B.; Liu, T.; Hua, Z.; Xu, W.; Shu, H.; et al. Quantitative characterization of various oil contents and spatial distribution in lacustrine shales: Insight from petroleum compositional characteristics derived from programed pyrolysis. Mar. Pet. Geol. 2022, 138, 105522. [Google Scholar] [CrossRef]
  4. Ma, X.; Xie, J.; Yong, R.; Zhu, Y. Geological characteristics and high production control factors of shale gas reservoirs in Silurian Longmaxi Formation, southern Sichuan Basin, SW China. Pet. Explor. Dev. 2020, 47, 901–915. [Google Scholar] [CrossRef]
  5. Lu, S.; Li, J.; Zhang, P.; Xue, H.; Wang, G.; Zhang, J.; Liu, H.; Li, Z. Classification of microscopic pore-throats and the grading evaluation on shale oil reservoirs. Pet. Explor. Dev. 2018, 45, 436–444. [Google Scholar] [CrossRef]
  6. Zou, C.; Yang, Z.; Cui, J.; Zhu, R.; Hou, L.; Tao, S.; Yuan, X.; Wu, S.; Lin, S.; Wang, L.; et al. Formation mechanism, geological characteristics and development strategy of nonmarine shale oil in China. Pet. Explor. Dev. 2013, 40, 15–27. [Google Scholar] [CrossRef]
  7. Hao, F.; Zou, H.; Lu, Y. Mechanisms of shale gas storage: Implications for shale gas exploration in China. AAPG Bull. 2013, 97, 1325–1346. [Google Scholar] [CrossRef]
  8. Sun, L.; Cui, B.; Zhu, R.; Wang, R.; Feng, Z.; Li, B.; Zhang, J.; Gao, B.; Wang, Q.; Zeng, H.; et al. Shale oil enrichment evaluation and production law in Gulong Sag, Songliao Basin, NE China. Pet. Explor. Dev. 2023, 50, 505–519. [Google Scholar] [CrossRef]
  9. Wang, J.-Y.; Guo, S.-B. Study on the relationship between hydrocarbon generation and pore evolution in continental shale from the Ordos Basin, China. Pet. Sci. 2021, 18, 1305–1322. [Google Scholar] [CrossRef]
  10. Zhang, P.; Lu, S.; Li, J.; Xue, H.; Li, W.; Zhang, P. Characterization of shale pore system: A case study of Paleogene Xin’gouzui Formation in the Jianghan basin, China. Mar. Pet. Geol. 2017, 79, 321–334. [Google Scholar] [CrossRef]
  11. Wang, M.; Ma, R.; Li, J.B.; Lu, S.F.; Li, C.M.; Guo, Z.L.; Li, Z. Occurrence mechanism of lacustrine shale oil in the Paleogene Shahejie Formation of Jiyang Depression, Bohai Bay Basin, China. Pet. Explor. Dev. 2019, 46, 833–846. [Google Scholar] [CrossRef]
  12. Jarvie, D.M. Components and processes affecting producibility and commerciality of shale resource systems. Geol. Acta 2014, 12, 307–325. [Google Scholar] [CrossRef]
  13. Katz, B.; Lin, F. Lacustrine basin unconventional resource plays: Key differences. Mar. Pet. Geol. 2014, 56, 255–265. [Google Scholar] [CrossRef]
  14. Yang, R.; He, S.; Yi, J.; Hu, Q. Nano-scale pore structure and fractal dimension of organic-rich Wufeng-Longmaxi shale from Jiaoshiba area, Sichuan Basin: Investigations using FE-SEM, gas adsorption and helium pycnometry. Mar. Pet. Geol. 2016, 70, 27–45. [Google Scholar] [CrossRef]
  15. Kuang, L.-C.; Hou, L.-H.; Wu, S.-T.; Cui, J.-W.; Tian, H.; Zhang, L.-J.; Zhao, Z.-Y.; Luo, X.; Jiang, X.-H. Organic matter occurrence and pore-forming mechanisms in lacustrine shales in China. Pet. Sci. 2022, 19, 1460–1472. [Google Scholar] [CrossRef]
  16. Li, Z.; Liu, D.; Cai, Y.; Ranjith, P.G.; Yao, Y. Multi-scale quantitative characterization of 3-D pore-fracture networks in bituminous and anthracite coals using FIB-SEM tomography and X-ray μ-CT. Fuel 2017, 209, 43–53. [Google Scholar] [CrossRef]
  17. Loucks, R.G.; Reed, R.M.; Ruppel, S.C.; Hammes, U. Spectrum of pore types and networks in mudrocks and a descriptive classification for matrix-related mudrock pores. AAPG Bull. 2012, 96, 1071–1098. [Google Scholar] [CrossRef]
  18. Zhang, P.; Lu, S.; Li, J.; Zhang, J.; Xue, H.; Chen, C. Comparisons of SEM, Low-Field NMR, and Mercury Intrusion Capillary Pressure in Characterization of the Pore Size Distribution of Lacustrine Shale: A Case Study on the Dongying Depression, Bohai Bay Basin, China. Energy Fuels 2017, 31, 9232–9239. [Google Scholar] [CrossRef]
  19. Zhang, P.; Lu, S.; Li, J.; Chen, C.; Xue, H.; Zhang, J. Petrophysical characterization of oil-bearing shales by low-field nuclear magnetic resonance (NMR). Mar. Pet. Geol. 2018, 89, 775–785. [Google Scholar] [CrossRef]
  20. Bernard, S.; Horsfield, B.; Schulz, H.-M.; Wirth, R.; Schreiber, A.; Sherwood, N. Geochemical evolution of organic-rich shales with increasing maturity: A STXM and TEM study of the Posidonia Shale (Lower Toarcian, northern Germany). Mar. Pet. Geol. 2012, 31, 70–89. [Google Scholar] [CrossRef]
  21. Desbois, G.; Urai, J.; Kukla, P.J.E.D. Morphology of the pore space in claystones–evidence from BIB/FIB ion beam sectioning and cryo-SEM observations. eEarth Discuss. 2009, 4, 15–22. [Google Scholar] [CrossRef]
  22. Dong, T.; Harris, N.B.; Ayranci, K.; Twemlow, C.E.; Nassichuk, B.R. Porosity characteristics of the Devonian Horn River shale, Canada: Insights from lithofacies classification and shale composition. Int. J. Coal Geol. 2015, 141–142, 74–90. [Google Scholar] [CrossRef]
  23. Klaver, J.; Desbois, G.; Littke, R.; Urai, J.L. BIB-SEM characterization of pore space morphology and distribution in postmature to overmature samples from the Haynesville and Bossier Shales. Mar. Pet. Geol. 2015, 59, 451–466. [Google Scholar] [CrossRef]
  24. Clarkson, C.R.; Solano, N.; Bustin, R.M.; Bustin, A.M.M.; Chalmers, G.R.L.; He, L.; Melnichenko, Y.B.; Radliński, A.P.; Blach, T.P. Pore structure characterization of North American shale gas reservoirs using USANS/SANS, gas adsorption, and mercury intrusion. Fuel 2013, 103, 606–616. [Google Scholar] [CrossRef]
  25. Du, F.; Wang, K.; Zhang, G.; Zhang, Y.; Zhang, G.; Wang, G. Damage characteristics of coal under different loading modes based on CT three-dimensional reconstruction. Fuel 2022, 310, 122304. [Google Scholar] [CrossRef]
  26. Zhang, C.; Jiang, F.; Hu, T.; Chen, D.; Huang, L.; Jiang, Z.; Wang, X.; Liu, Z.; Wu, Y.; Lv, J.; et al. Oil occurrence state and quantity in alkaline lacustrine shale using a high-frequency NMR technique. Mar. Pet. Geol. 2023, 154, 106302. [Google Scholar] [CrossRef]
  27. Angulo, R.; Alvarado, V.; Gonzalez, H. Fractal Dimensions from Mercury Intrusion Capillary Tests. In Proceedings of the SPE Latin America Petroleum Engineering Conference, Caracas, Venezuela, 8–11 March 1992. [Google Scholar]
  28. Chalmers, G.R.; Bustin, R.M.; Power, I.M. Characterization of gas shale pore systems by porosimetry, pycnometry, surface area, and field emission scanning electron microscopy/transmission electron microscopy image analyses: Examples from the Barnett, Woodford, Haynesville, Marcellus, and Doig units. AAPG Bull. 2012, 96, 1099–1119. [Google Scholar] [CrossRef]
  29. Hemes, S.; Desbois, G.; Urai, J.L.; De Craen, M.; Honty, M. Variations in the morphology of porosity in the Boom Clay Formation: Insights from 2D high resolution BIB-SEM imaging and Mercury injection Porosimetry. Neth. J. Geosci. Geol. En Mijnb. 2014, 92, 275–300. [Google Scholar] [CrossRef]
  30. Ge, Z.; Shen, Y.; Gu, S. High-temperature selective catalytic reduction of NO with NH3: Optimization of ZrO2 and WO3 complex oxides. Fuel 2022, 310, 122261. [Google Scholar] [CrossRef]
  31. Bustin, R.M.; Bustin, A.M.M.; Cui, X.; Ross, D.J.K.; Pathi, V.S.M. Impact of Shale Properties on Pore Structure and Storage Characteristics. In Proceedings of the SPE Shale Gas Production Conference, Fort Worth, TX, USA, 16–18 November 2008. [Google Scholar]
  32. Lai, J.; Wang, G.; Wang, Z.; Chen, J.; Pang, X.; Wang, S.; Zhou, Z.; He, Z.; Qin, Z.; Fan, X. A review on pore structure characterization in tight sandstones. Earth-Sci. Rev. 2018, 177, 436–457. [Google Scholar] [CrossRef]
  33. Tian, H.; Pan, L.; Xiao, X.; Wilkins, R.W.T.; Meng, Z.; Huang, B. A preliminary study on the pore characterization of Lower Silurian black shales in the Chuandong Thrust Fold Belt, southwestern China using low pressure N2 adsorption and FE-SEM methods. Mar. Pet. Geol. 2013, 48, 8–19. [Google Scholar] [CrossRef]
  34. Xu, J.-G.; Qiu, Z.-S.; Zhao, X.; Zhong, H.-Y.; Li, G.-R.; Huang, W.-A. Synthesis and characterization of shale stabilizer based on polyethylene glycol grafted nano-silica composite in water-based drilling fluids. J. Pet. Sci. Eng. 2018, 163, 371–377. [Google Scholar] [CrossRef]
  35. Wang, G.; Ju, Y. Organic shale micropore and mesopore structure characterization by ultra-low pressure N2 physisorption: Experimental procedure and interpretation model. J. Nat. Gas Sci. Eng. 2015, 27, 452–465. [Google Scholar] [CrossRef]
  36. Zhang, P.; Lu, S.; Li, J. Characterization of pore size distributions of shale oil reservoirs: A case study from Dongying sag, Bohai Bay basin, China. Mar. Pet. Geol. 2019, 100, 297–308. [Google Scholar] [CrossRef]
  37. Ross, D.J.K.; Marc Bustin, R. The importance of shale composition and pore structure upon gas storage potential of shale gas reservoirs. Mar. Pet. Geol. 2009, 26, 916–927. [Google Scholar] [CrossRef]
  38. Zargari, S.; Canter, K.L.; Prasad, M. Porosity evolution in oil-prone source rocks. Fuel 2015, 153, 110–117. [Google Scholar] [CrossRef]
  39. Zou, C.; Ma, F.; Pan, S.; Zhang, X.; Wu, S.; Fu, G.; Wang, H.; Yang, Z. Formation and distribution potential of global shale oil and the developments of continental shale oil theory and technology in China. Earth Sci. Front. 2023, 30, 128–142. [Google Scholar]
  40. Lin, Z.-Z.; Li, J.-Q.; Lu, S.-F.; Hu, Q.-H.; Zhang, P.-F.; Wang, J.-J.; Zhi, Q.; Huang, H.-S.; Yin, N.; Wang, Y.; et al. The occurrence characteristics of oil in shales matrix from organic geochemical screening data and pore structure properties: An experimental study. Pet. Sci. 2023, 21, 1–13. [Google Scholar] [CrossRef]
  41. Jiang, Z.; Tang, X.; Li, Z.; Huang, H.; Yang, P.; Yang, X.; Li, W.; Hao, J. The whole-aperture pore structure characteristics and its effect on gas content of the Longmaxi Formation shale in the southeastern Sichuan basin. Earth Sci. Front. 2016, 23, 126–134. [Google Scholar]
  42. Mandelbrot, B.B. The Fractal Geometry of Nature; WH Freeman: New York, NY, USA, 1983; Volume 1. [Google Scholar]
  43. Avnir, D.; Jaroniec, M.J.L. An isotherm equation for adsorption on fractal surfaces of heterogeneous porous materials. Langmuir 1989, 5, 1431–1433. [Google Scholar] [CrossRef]
  44. Bernal, J.L.P.; Bello, M.A. Fractal geometry and mercury porosimetry—Comparison and application of proposed models on building stones. Appl. Surf. Sci. 2001, 185, 99–107. [Google Scholar] [CrossRef]
  45. Ge, X.; Li, J.; Lu, S.; Chen, F.; Yang, D.; Wang, Q. Fractal characteristics of tight sandstone reservoir using mercury intrusion capillary pressure:a case of tight sandstone reservoir in Jizhong Depression. Lithol. Reserv. 2017, 29, 106–112. [Google Scholar]
  46. Krohn, C.E.J.J.o.G.R.S.E. Fractal measurements of sandstones, shales, and carbonates. J. Geophys. Res. Solid Earth 1988, 93, 3297–3305. [Google Scholar] [CrossRef]
  47. Pfeifer, P.; Wu, Y.J.; Cole, M.W.; Krim, J. Multilayer adsorption on a fractally rough surface. Phys. Rev. Lett. 1989, 62, 1997–2000. [Google Scholar] [CrossRef] [PubMed]
  48. Mahamud, M.M.; Novo, M.F. The use of fractal analysis in the textural characterization of coals. Fuel 2008, 87, 222–231. [Google Scholar] [CrossRef]
  49. Yang, F.; Ning, Z.; Wang, Q.; Kong, D.; Peng, K.; Xiao, L. Fractal Characteristics of Nanopore in Shales. Nat. Gas Geosci. 2014, 25, 618–623. [Google Scholar]
  50. Chen, Y.; Zou, C.; Maria, M.; Zhu, R.; Bai, B.; Yang, Z. Porosity and Fractal Characteristics of Shale across a Maturation Gradient. Nat. Gas Geosci. 2015, 26, 1646–1656. [Google Scholar]
  51. Dathe, A.; Eins, S.; Niemeyer, J.; Gerold, G. The surface fractal dimension of the soil-pore interface as measured by image analysis. Geoderma 2001, 103, 203–229. [Google Scholar] [CrossRef]
  52. Brunauer, S.; Emmett, P.H.; Teller, E. Adsorption of gases in multimolecular layers. J. Am. Chem. Soc. 1938, 60, 309–319. [Google Scholar] [CrossRef]
  53. Sandoval-Díaz, L.-E.; Aragon-Quiroz, J.-A.; Ruíz-Cardona, Y.-S.; Domínguez-Monterroza, A.-R.; Trujillo, C.-A. Fractal analysis at mesopore scale of modified USY zeolites by nitrogen adsorption: A classical thermodynamic approach. Microporous Mesoporous Mater. 2017, 237, 260–267. [Google Scholar] [CrossRef]
  54. Jaroniec, M.J.L. Evaluation of the fractal dimension from a single adsorption isotherm. Langmuir 1995, 11, 2316–2317. [Google Scholar] [CrossRef]
  55. Tatlıer, M.; Erdem-Şenatalar, A.J.T.J.o.P.C.B. Method to evaluate the fractal dimensions of solid adsorbents. J. Phys. Chem. B 1999, 103, 4360–4365. [Google Scholar] [CrossRef]
  56. Rouquerol, J.; Avnir, D.; Fairbridge, C.W.; Everett, D.H.; Haynes, J.; Pernicone, N.; Ramsay, J.D.; Sing, K.S.W.; Unger, K.K.J.P.; Physical Chemistry Division. Recommendations for the characterization of porous solids (Technical Report). Pure Appl. Chem. 1994, 66, 1739–1758. [Google Scholar] [CrossRef]
  57. Wong, P.; Howard, J.; Lin, J.S. Surface roughening and the fractal nature of rocks. Phys. Rev. Lett. 1986, 57, 637–640. [Google Scholar] [CrossRef] [PubMed]
  58. Zou, C.; Yang, Z.; Zhu, R.; Zhang, G.; Hou, L.; Wu, S.; Tao, S.; Yuan, X.; Dong, D.; Wang, Y.; et al. Progress in China’s Unconventional Oil & Gas Exploration and Development and Theoretical Technologies. Acta Geol. Sin. 2015, 89, 979–1007. [Google Scholar]
  59. Zou, C.; Yang, Z.; Zhang, G.; Zhu, R.; Tao, S.; Yuan, X.; Hou, L.; Dong, D.; Guo, Q.; Song, Y.; et al. Theory, Technology and Practice of Unconventional Petroleum Geology. Earth Sci. 2023, 48, 2376–2397. [Google Scholar] [CrossRef]
  60. Li, J.; Lu, S.; Cai, J.; Zhang, P.; Xue, H.; Zhao, X. Adsorbed and Free Oil in Lacustrine Nanoporous Shale: A Theoretical Model and a Case Study. Energy Fuels 2018, 32, 12247–12258. [Google Scholar] [CrossRef]
  61. Zhang, P.; Lu, S.; Li, J.; Wang, J.; Zhang, J. Oil occurrence mechanism in nanoporous shales: A theoretical and experimental study. Mar. Pet. Geol. 2023, 156, 106422. [Google Scholar] [CrossRef]
  62. Brauer, A.; Casanova, J. Chronology and depositional processes of the laminated sediment record from Lac d'Annecy, French Alps. J. Paleolimnol. 2001, 25, 163–177. [Google Scholar] [CrossRef]
  63. Zhang, C.; Guan, P.; Zhang, J.; Liang, X.; Ding, X.; You, Y. A Review of the Progress on Fractal Theory to Characterize the Pore Structure of Unconventional Oil and Gas Reservoirs. Acta Sci. Nat. Univ. Pekin. 2023, 59, 897–908. [Google Scholar]
  64. Wang, X.; Qi, M.; Hu, Y.; Qiu, Y. Analysis of the shale pore structures by the combination of high-pressure mercury injection and fractal theory. Pet. Geol. Oilfield Dev. Daqing 2015, 34, 165–169. [Google Scholar]
  65. Zeng, H.; Wang, F.; Luo, J.; Tao, T.; Wu, S. Characteristics of pore structure of intersalt shale oil reservoir by low temperature nitrogen adsorption and high pressure mercury pressure methods in Qianjiang Sag. Bull. Geol. Sci. Technol. 2021, 40, 242–252. [Google Scholar]
  66. Yu, K.; Cao, Y.; Qiu, L.; Sun, P.; Jia, X.; Wan, M. Geochemical characteristics and origin of sodium carbonates in a closed alkaline basin: The Lower Permian Fengcheng Formation in the Mahu Sag, northwestern Junggar Basin, China. Palaeogeogr. Palaeoclimatol. Palaeoecol. 2018, 511, 506–531. [Google Scholar] [CrossRef]
  67. Kelly, S.; El-Sobky, H.; Torres-Verdín, C.; Balhoff, M.T. Assessing the utility of FIB-SEM images for shale digital rock physics. Adv. Water Resour. 2016, 95, 302–316. [Google Scholar] [CrossRef]
  68. Zhang, S.; Meng, Z.; Guo, Z.; Zhang, M.; Han, C. Characteristics and major controlling factors of shale reservoirsin the Longmaxi Fm, Fuling area, Sichuan Basin. Nat. Gas Ind. 2014, 34, 16–24. [Google Scholar]
Figure 1. Location map of study area. (a) Schematic map of the Bohai Bay Basin and its location in China; (b) geologic structure characteristic map and sampling location of study area; (c) stratigraphic column of study area (modified according to [18,61]).
Fractalfract 08 00245 g001
Figure 2. Sample experiment process (a) and arrangement (b).
Fractalfract 08 00245 g002
Figure 3. Kerogen type and maturity.
Fractalfract 08 00245 g003
Figure 4. HI versus (S1 + S2) plots showing quality of source rocks.
Fractalfract 08 00245 g004
Figure 5. Characteristics of main minerals under SEM. (a) Calcite crystal, Well C, C-14; (b) dolomite crystal, Well C, C-15; (c) quartz grain, Well C, C-1; (d) feldspar, Well C, C-8; (e) flake illite, Well C, C-1; (f) framboidal pyrite, Well C, C-1.
Fractalfract 08 00245 g005
Figure 6. Mineral composition of calcareous shale, clay shale, siliceous shale, and mixed shale.
Fractalfract 08 00245 g006
Figure 7. Lamina structure characteristics. (a) Laminated shale, Well A, A-1; (b) laminated shale, Well C, C-16; (c) layered shale, Well E, E-1; (d) layered shale, Well F, F-1. (CAL is carbonate lamina, FL is felsic lamina, CL is clay lamina, and OML is organic matter lamina).
Fractalfract 08 00245 g007
Figure 8. SEM images of the pores of Shahejie Formation shale. (a) Interparticle pores between calcite crystal, Well C, C-14; (b) layered clay minerals, Well C, C-9; (c) intercrystalline pores between clay minerals, Well C, C-9; (d) intercrystalline pores in pyrite, Well C, C-1; (e) oil film on pyrite particles, Well E, E-1; (f) intragranular dissolution pores in feldspar, Well C, C-14; (g) striped organic matter, Well C, C-15; (h) irregularly dispersed organic matter, Well D, D-1; (i) organic matter pores, Well F, F-1.
Fractalfract 08 00245 g008
Figure 9. Core photos and SEM images of fractures of Shahejie Formation shale. (a) Tectonic fracture, Well C, C-13; (b) tectonic fracture, Well D, D-1; (c) tectonic fracture, Well C, C-1; (d) abnormal pressure fractures, Well B, B-1; (e) shrinkage joint at the edge of quartz particle, Well C, C-1; (f) shrinkage joint at the edge of organic matter, Well C, C-7.
Fractalfract 08 00245 g009
Figure 10. Thin sections show lamellation fracture characteristics of Shahejie Formation shale. (a) Lamellation fractures, Well A, A-3; (b) lamellation fractures, Well A, A-1; (c) lamellation fractures, Well F, F-1; (d) lamellation fractures, Well B, B-1.
Fractalfract 08 00245 g010
Figure 11. Pore and fracture reservoir space composition. (a) Laminated shale; (b) layered shale.
Fractalfract 08 00245 g011
Figure 12. Overlay chart of pore size distribution and fractal dimension fitting curve. (a) F-1, laminated shale; (b) A-3, layered shale.
Fractalfract 08 00245 g012
Figure 13. The fractal dimension fitting curve of N2 adsorption. (a) B-1, laminated shale; (b) C5-1, layered shale.
Fractalfract 08 00245 g013
Figure 14. Columnar graph of four-zone fractal dimension of shales. (a) Different lithology; (b) different lamina structure.
Fractalfract 08 00245 g014
Figure 15. The relationship between TOC, Tmax, and heterogeneity of pores with different sizes. (a1,a2) Fracture; (b1,b2) macropore; (c1,c2) mesopore; (d1,d2) micropore.
Fractalfract 08 00245 g015aFractalfract 08 00245 g015b
Figure 16. The relationship between feldspar and quartz, carbonate minerals, clay minerals, and heterogeneity of pores with different sizes. (a1a4) Feldspar and quartz; (b1b4) carbonate minerals; (c1c4) clay minerals.
Fractalfract 08 00245 g016
Figure 17. The relationship between permeability and heterogeneity of pores with different sizes. (a) Fracture; (b) macropore; (c) mesopore; (d) micropore.
Fractalfract 08 00245 g017
Table 1. Rock-Eval pyrolysis, Ro, and mineral compositions of samples.
WellSample IDDepthLithologyTOCS1S2TmaxRoQuartzFeldsparCalciteDolomiteClayPyrite
(m)(wt.%)(mg/g)(mg/g)(%)(%)(wt.%)(wt.%)(wt.%)(wt.%)(wt.%)(wt.%)
AA-13737.20Organic-containing layered mixed shale1.995.145.554410.8022.7240.5-23.13.60
BB-23216.601.841.487.454410.7422.37.517.5-44.53.50
AA-23637.80Organic-rich layered mixed shale7.005.146.554430.7925.84.319.4-38.66.40
AA-33667.004.4816.8218.484490.7422.33.420.3-34.33.70
CC-73343.90Organic-rich layered calcareous shale5.224.7820.114370.7117.11.149.19.7019.63.40
EE-13784.353.362.249.794450.7610.93.772.73.808.60.30
CC-83334.65Organic-rich laminated calcareous shale3.441.46154390.7218.13.244.18.6022.53.50
CC-93336.255.172.1922.794360.70131.558-19.23.30
DD-13537.107.737.2540.464460.7315.92.545.27.8021.65.80
CC-143609.50Organic-containing laminated calcareous shale2.000.96.434400.734.71.118.567.307.80.60
CC-133335.600.690.421.324400.735.90.922.258.8010.41.80
CC-13347.07Organic-rich laminated mixed shale8.604.2336.084380.7228.73.121.2-413.70
CC-163344.602.440.857.554430.7522.45.535.87.1025.63.60
FF-13087.607.908.1643.54400.7322.65.726.618.8021.44.90
CC-153351.104.742.820.984370.7118.91.635.8-284.90
BB-13442.00Organic-containing laminated mixed shale1.261.594.094410.7422.718.613.712.8031.21.00
Table 2. Fractal dimension and R2 based on MICP and nitrogen adsorption.
Sample IDDH1RH12DH2RH22DH3RH32DH4RH42DN1RN12DN2RN22
A-12.7400.9482.0590.9852.9380.9872.2380.9902.4010.9952.4510.999
B-22.7810.9982.0820.9962.2600.9312.9200.9841.9740.9212.4140.997
A-22.7650.9332.1040.9862.3660.9803.2470.9992.0370.9252.4160.996
A-32.7530.9872.1460.9772.3090.9622.8330.9792.0330.9352.4390.998
C-72.6980.9882.0480.9842.9550.9932.7190.9972.3980.9902.6890.975
E-12.8380.9402.0870.9342.8340.9932.7670.9982.3830.9782.6770.982
C-82.7920.9762.1070.9702.2830.9642.7270.9842.3580.9882.4380.998
C-92.7980.9782.0790.9522.5330.9642.9440.9992.4190.9962.4620.999
D-12.7660.9802.0480.9792.7730.9813.0040.9992.3680.9882.4430.996
C-142.6330.9552.1920.9522.3780.9782.4560.9981.8950.9242.4310.993
C-132.7940.9742.0460.9782.7490.9922.4770.9901.9380.8132.5080.988
C-12.7820.8572.0980.9692.3490.9942.7680.9992.0970.9382.4500.999
C-162.7090.9522.1290.9392.3310.9912.8160.9822.4180.9952.4740.999
F-12.7290.9942.0860.9422.5080.9682.8010.9882.4490.9982.5040.999
C-152.7240.9722.0550.9852.7100.9722.9040.9952.3940.9922.4220.999
B-12.5770.9922.1000.9562.5960.9802.9460.9562.4050.9962.4400.999
Disclaimer/Publisher’s Note: The statements, opinions and data contained in all publications are solely those of the individual author(s) and contributor(s) and not of MDPI and/or the editor(s). MDPI and/or the editor(s) disclaim responsibility for any injury to people or property resulting from any ideas, methods, instructions or products referred to in the content.

