Article

Multi-Scale Research on the Mechanisms of Soil Arching Development and Degradation in Granular Materials with Different Relative Density

1
Institute of Civil Engineering, Hangzhou City University, Hangzhou 310015, China
2
Key Laboratory of Safe Construction and Intelligent Maintenance for Urban Shield Tunnels of Zhejiang Province, Hangzhou City University, Hangzhou 310015, China
3
Department of Civil, Environmental and Geomatic Engineering, University College London, London WC1E 6BT, UK
4
State Key Laboratory of Performance Monitoring Protecting of Rail Transit Infrastructure, East China Jiaotong University, Nanchang 330013, China
5
Research Center of Coastal and Urban Geotechnical Engineering, Zhejiang University, Hangzhou 310012, China
*
Author to whom correspondence should be addressed.
Fractal Fract. 2024, 8(5), 247; https://doi.org/10.3390/fractalfract8050247
Submission received: 2 February 2024 / Revised: 29 March 2024 / Accepted: 9 April 2024 / Published: 24 April 2024
(This article belongs to the Special Issue Fractal and Fractional in Geotechnical Engineering)

Abstract

:
Soil arching is significantly influenced by relative density, while its mechanisms have barely been analyzed. A series of DEM numerical simulations of the classical trapdoor test were carried out to investigate the multi-scale mechanisms of arching development and degradation in granular materials with different relative density. For analysis, the granular assembly was divided into three zones according to the particle vertical displacement normalized by the trapdoor displacement δ. The results show that before the maximum arching state (corresponding to the minimum arching ratio), contact forces between particles in a specific zone (where the vertical displacement of particles is larger than 0.1δ but less than 0.9δ) increase rapidly and robust arched force chains with large particle contact forces are generated. The variation in contact forces and force chains becomes more obvious as the sample porosity decreases. As a result, soil arching generated in a denser particle assembly is stronger, and the minimum value of the arching ratio is increased with the sample porosity. After the maximum arching state, the force chains in this zone are degenerated gradually, leading to a decrease in particle contact forces in microscale and an increase in the arching ratio in macroscale. The recovery of the arching ratio after the minimum value is also more significant in simulations with a larger relative density, as the degeneration of contact force chains is more obvious in denser samples. These results indicate the importance of contact force chain stabilities in specific zones for improving soil arching in engineering practice.

1. Introduction

Soil arching in geotechnical engineering, investigated by Terzaghi [1], has attracted increasing attention in recent years as it is a general phenomenon in sandy soil and other granular materials. Soil arching is developed when a soil mass yields. The shear resistance developed at the interface between the yielded portion and the adjoining stationary portion will result in stress transformation and redistribution. The degree of soil arching can be assessed through the arching ratio (ρ),defined as the ratio of the stress within a certain area to the overburden stress at the same location [2]. The variation in the arching ratio with the increase in relative displacement of soil mass can be described by the ground reaction curve (GRC), as presented in Figure 1 [3]. GRC is very important in describing soil arching because it can clearly illustrate the four stages of soil arching: initial arching, maximum arching, load recovery, and the ultimate state. The applicability of the GRC to describe the load–displacement relationship in a trapdoor test has been investigated by several authors [4,5,6].
Recently, to further analyze the mechanisms of soil arching evolution as shown in GRC, many researchers have also conducted single trapdoor tests [7,8] and multiple trapdoor tests [9,10]. According to these studies, soil arching evolution is related to the progressive development of slip surfaces induced by relative displacement of soil mass. Triangular slip surfaces are observed at the maximum arching stage, while vertical slip surfaces are generally observed at the ultimate state. The test results also show that soil arching evolution is significantly influenced by the relative density (RD), which is defined as:
RD = (nmaxn)/(nmaxnmin),
where nmax, nmin, n represent the maximum porosity, the minimum porosity and the porosity of the granular materials, respectively. In the trapdoor tests with different sample densities, the arching ratio for the test at a lower relative density is higher than that for the test at higher relative density, indicating that soil arching is less mobilized in the backfill at a lower relative density [10]. PIV results of the shear strain field in trapdoor tests show that triangular slip surfaces also cannot be formed when the relative density of soil mass is low [11]. On the other hand, DEM simulation results of the trapdoor test also indicate that the stick–slip behavior of the arching ratio is more obvious for the case with a higher density at a given fill height [12,13], and the failure mechanisms of dense sand and medium dense sand in the trapdoor simulations are different [14]. However, previous studies have not explicitly explained why soil arching shows different development and degradation processes with different soil relative densities. Since soil arching is widely encountered in tunnels, pile-supported embankments, retaining structures, etc., and the relative densities of granular soil in engineering are different from each other, understanding the evolution mechanisms of soil arching in granular materials with different densities is critical for geotechnical engineering practices. Actually, the evolution of soil arching is a macroscopic reflection of the mechanical properties of soil particles in microscale. At present, the load transfer mechanisms [15] and deformation patterns [16,17] of soil arching in macroscale have been well examined. In microscale, the particle–particle interaction during the evolution of soil arching [18,19] has been considered extensively, and some effort has also been made to describe and analyze the particle behaviors in the fill with different particle sizes [20] and particle shapes [21,22], but how the particle behaviors in microscale influence the variation in the arching ratio in macroscale is still largely unknown.
In order to bridge the gap between microscale particle behaviors and macroscale arching effect, mesoscale behaviors related to the force network in soil arching should be quantitatively analyzed, because the force chains always play a key part in load transfer [23]. Recently, significant progress has been made toward developing a better understanding of force networks using a variety of tools [24,25,26,27]. In this paper, we focus on the topological analysis method—persistent homology (PH) [28,29]—for the analysis of mesoscale structures in 2D granular material. Persistent homology is a fractal method that performs multi-scale analysis on fractional complex networks and identifies their topological structures such as clusters, holes and cavities. Such an approach has been used to discuss the mesoscale structure of force networks in granular systems that were compressed [30], vibrated [31,32], sheared [33] and used for the analysis of the yielding of a granular system during pullout of a buried intruder [34]. Therefore, it allows for formulation of simple but informative measures describing the force networks, and for comparison of different networks during the evolution of soil arching.
According to the literature review presented above, a series of 2D DEM simulations of the trapdoor test were conducted to investigate the soil arching development and degradation in granular materials with different porosity. Persistent homology (PH) was adopted in this study to quantitatively analyze the features of force networks at different arching stages that related, in a broad sense, to so-called force chains. The main objects of this paper are: (i) Identifying the different development and degeneration processes of soil arching in granular materials with different relative densities; (ii) Identifying the corresponding particle behaviors in the different processes; (iii) Specifying how the particle behaviors in microscale influence the variation in arching ratio in macroscale.

2. Materials and Methods

PFC2D 5.0 is adopted in this study to simulate the trapdoor test procedure and analyze the multi-scale mechanisms of soil arching. Figure 2 presents the DEM model of the 2D trapdoor test. In this model, the trapdoor is simulated by a rigid wall at the bottom with width B = 0.6 m. The height of the granular sample is denoted as H. The distance between the trapdoor and the two side walls is equal to B. This boundary distance is comparable to that in the literature [12,20,21,35,36] (range from 0.5B to 2B). A wider boundary distance would provide more accurate results. However, it would also increase the simulation time and have little effect on the behaviors of soil arching with different relative densities of granular material.
The particle size of DEM sample is based on the purely two-dimensional trapdoor test conducted by Xu et al. [37], in which Taylor–Schneebeli soil analogues with perfect disk cross-sections were used to simulate soil. Circular disks with three different diameters (3 mm, 4 mm and 5 mm) mixed at a mass ratio of 1:1:1 are randomly rained into the rectangular region (1.8 m × H) with different initial frictional coefficients (μp-p = 0.1, 0.3, 0.5) layer-by-layer using the Grid-Method [38] to generate the simulation sample with different porosity (n = 0.16, 0.18, 0.20). After all particles have been settled down, μp-p is reset as 0.5 and the assembly is cycled to equilibrium for later simulation. During the simulation of trapdoor test, the trapdoor is moved downward and the movement speed is controlled at 1 × 10⁻⁴ m/s so that the simulation process satisfies the quasi-static condition. As listed in Table 1, six simulations with different sample porosity and buried depth ratio (H/B) are planned to be conducted in this study. For example, “H1-n0.16” represents a simulation with H/B =1 and n = 0.16.
The Hertz–Mindlin contact model between particles is adopted in this study. The micromechanical parameters of particles were determined and calibrated from numerical biaxial tests and numerical trapdoor tests. In the numerical biaxial tests, particles were randomly generated and then confined to different confining pressures (50 kPa, 100 kPa, 150 kPa) for biaxial compression test simulation. μp-p is adjusted to different values during the confining process so that the porosity of the particle assembly is controlled at 0.17 before loading. These parameters are totally the same as the model test conducted by Xu et al. [37]. The comparison between the simulation results and test results is presented in Figure 3, with the micromechanical properties listed in Table 2. In general, the numerical results are in good agreement with the experimental results. The maximum deviation between the numerical and test results of deviatoric stress and arching ratio is around 10%. A relatively larger deviation is observed in the comparison of volume strain, but these comparisons show that the micro-mechanical parameters adopted in this study can still capture the basic variation trend of the volume strain during the shear process.

3. Results

3.1. Macroscale Results Analysis

3.1.1. GRCs with Different Sample Porosity

In order to gather insights into the multi-scale mechanisms of soil arching development and degradation, as well as the impacts of different sample porosity (n = 0.16, 0.18 and 0.20) through DEM simulations of this study, the macro phenomena of soil arching, including variation in the arching ratio and the displacement field evolution during the simulations, are firstly analyzed.
In all simulations, the trapdoor is moved downward until δ/B = 0.1 (corresponding to a trapdoor displacement of 60 mm), as 0.1 is recommended as the normalized displacement (δ/B) corresponding to an ultimate arching ratio [6] according to the present trapdoor test results. Figure 4a presents the GRCs of the simulations with H/B = 1. The arching ratio ρ = P/P0 (P is the pressure on the trapdoor and P0 is the overburden stress on the trapdoor) of H1-n0.16 and H1-n0.18 both decrease to the minimum value at around δ/B = 0.02, and then increase to a steady ultimate value with the increase in normalized trapdoor displacement. The minimum values of ρ in H1-n0.16 and H1-n0.18 are 0.55 and 0.62, respectively, while the steady ultimate values of ρ in these two simulations are almost the same (around 0.80). This indicates that the soil arching is initially gradually mobilized by the trapdoor movement, but then degenerated as the trapdoor displacement increases continuously. The minimum arching ratio increases with the increase in sample porosity, meaning that the maximum soil arching is stronger in denser samples. However, the GRC of H1-n0.20 is different. During the whole simulation, ρ continuously decreases to the steady ultimate value that is identical with the ultimate values in the other two simulations. As a result, no significant degradation process of soil arching can be observed in loose samples. This phenomenon indicates the influence of relative density on soil arching. In view of engineering, soil arching is highly correlated with the shear behaviors of soil. For loose soil, no obvious strain softening stage can be observed in the stress–strain curve, and therefore the degradation of soil arching is also insignificant in loose soil.
Figure 4b presents the GRCs of the simulations with H/B = 2. The variation trends of the GRCs in Figure 4b are similar to that in Figure 4a. δ/B corresponding to the minimum arching ratio ρ in the scenario of H/B = 2 is almost identical with that when H/B = 1. This phenomenon means that the relative displacement needed to fully motivate the initial maximum soil arching in particle assemblies with different depths is identical. The soil arching in the simulations with H/B = 2 is observed to be stronger than that in the simulations with H/B = 1, as the minimum arching ratio on the GRCs of H/B = 1 is smaller than that on the GRCs of H/B = 2. Therefore, the relative soil movement required to fully motivate soil arching in the ultimate state when H/B = 2 is larger, so that the normalized trapdoor displacement corresponding to the steady ultimate value of ρ in the scenario of H/B = 2 is quite larger than that in the simulations with H/B = 1.

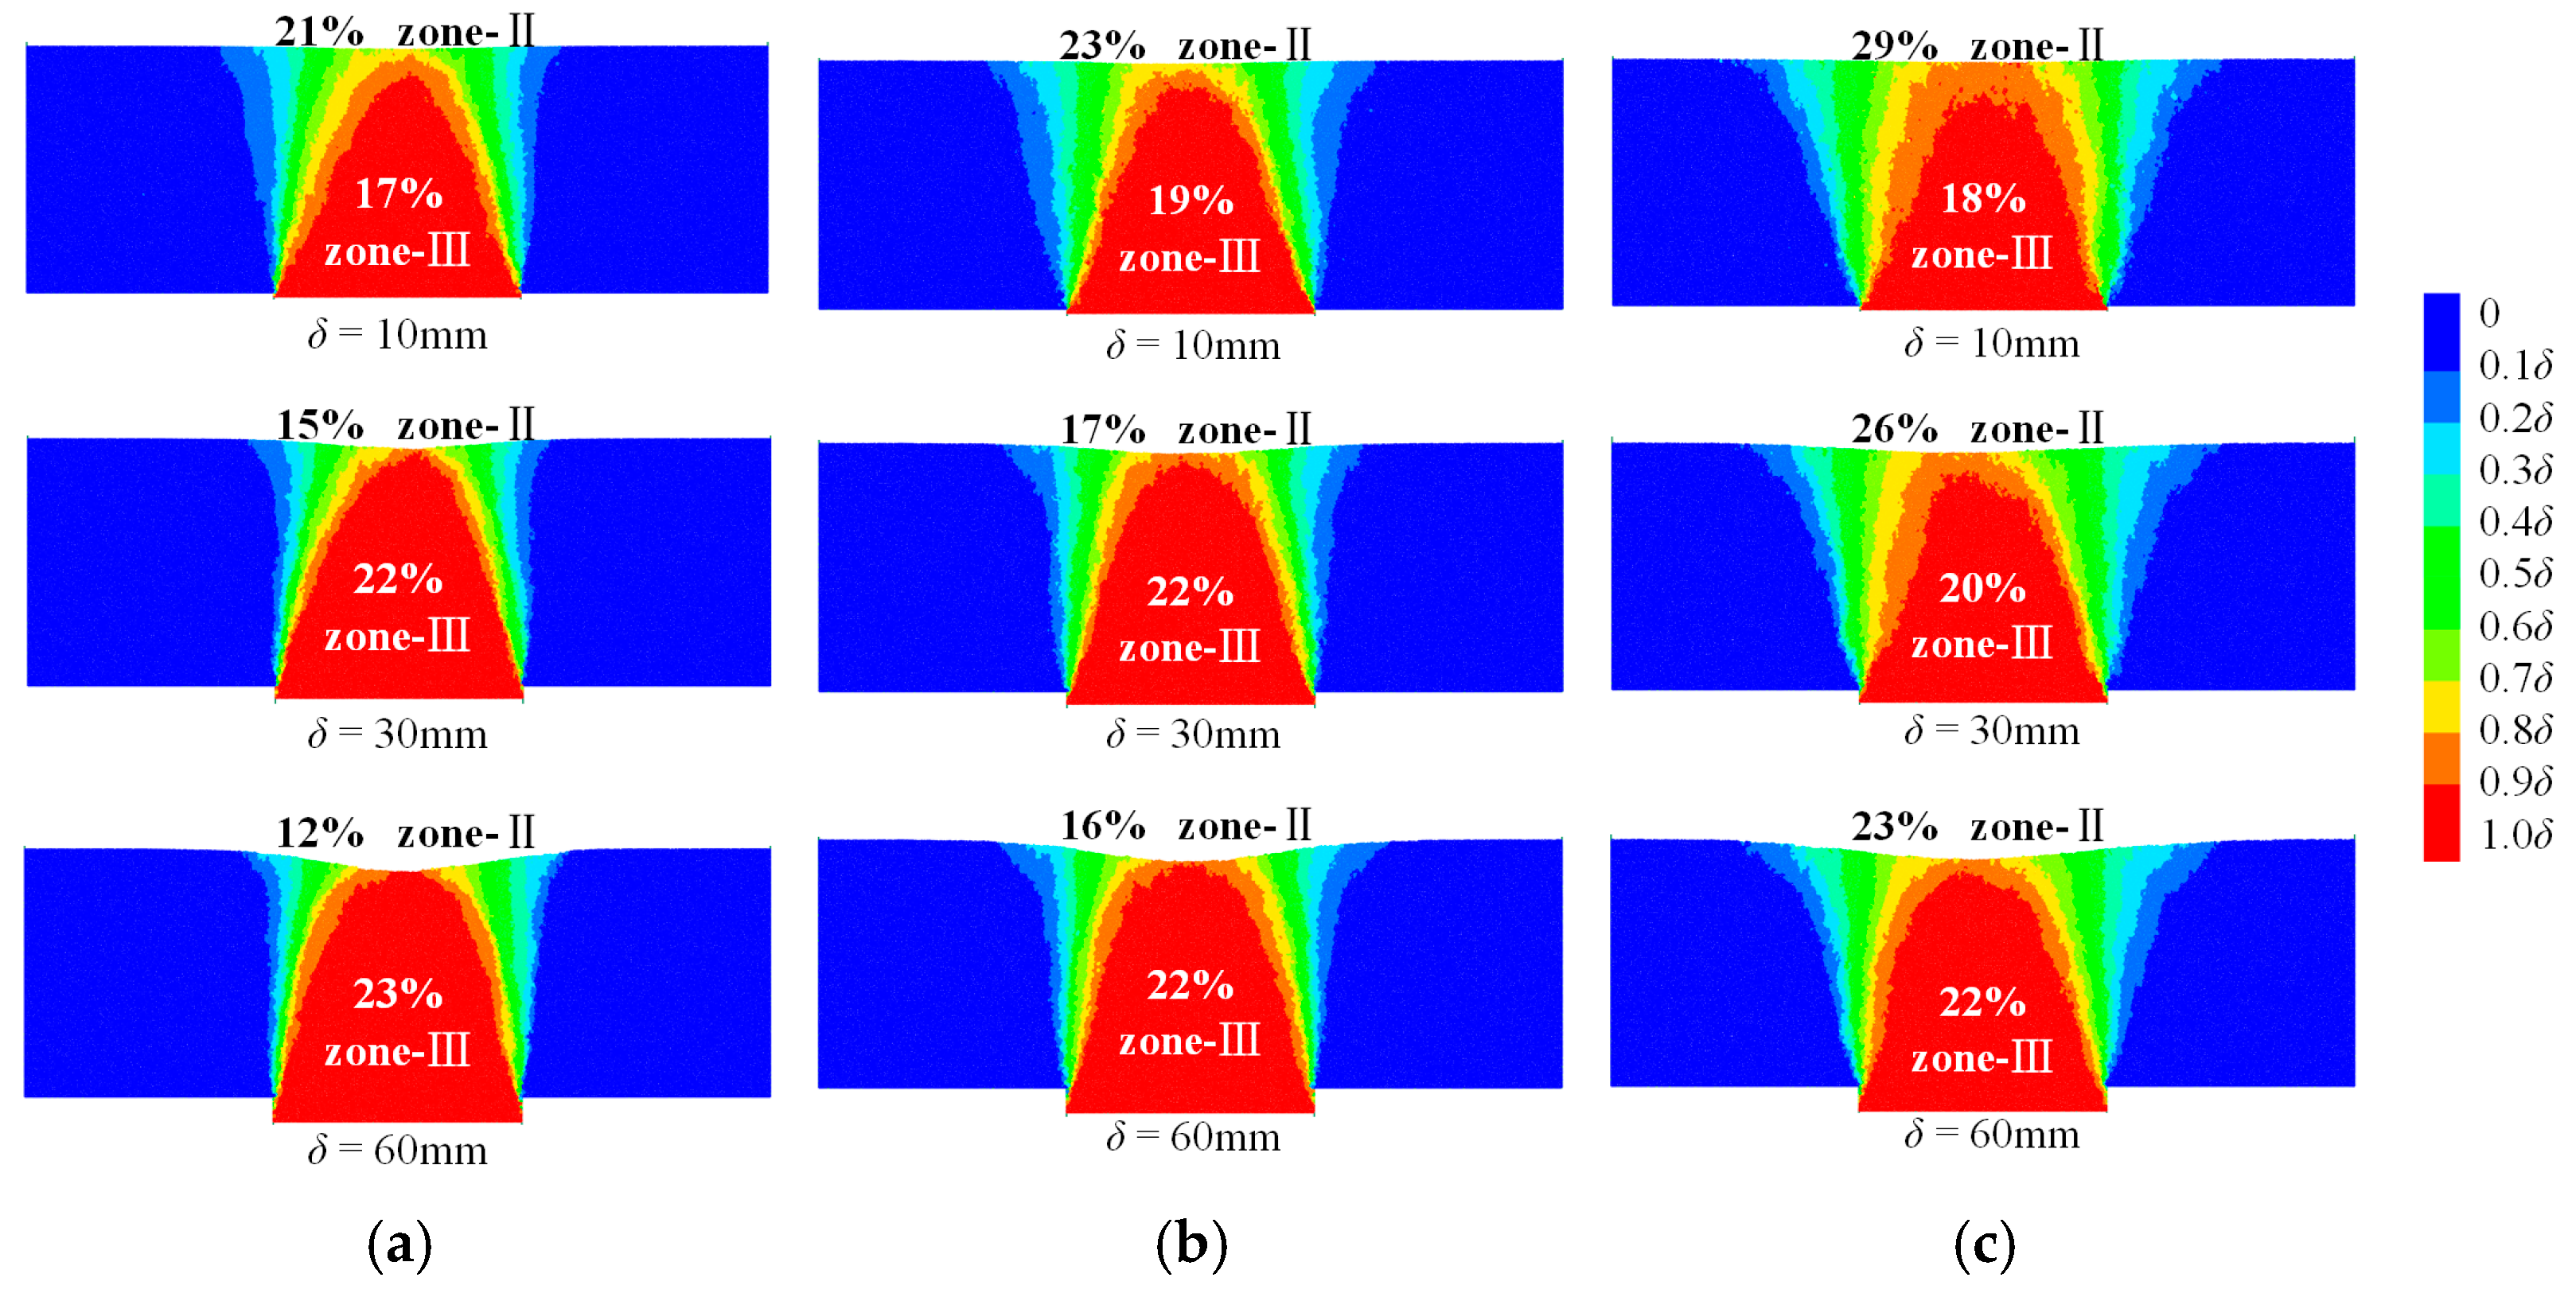
3.1.2. Displacement Field and the Arching Zones

The soil arching development and degradation process as reflected by GRC can be attributed to the gradual transformation of the movement patterns of soil mass within the zone of arching [14]. Although many DEM numerical simulations [21,35,36,39], PIV analyses [7,8,40] and X-ray CT scans [41] have been conducted to investigate the displacement of soil mass in a trapdoor test, the “arching zone” that dominates soil arching has not been clearly defined because the deformation patterns of soil mass at different soil arching stages are complex.
Figure 5 and Figure 6 show the particle vertical displacement fields at different stages of the simulations with H/B = 1 and 2, respectively. The particle displacement is normalized by the trapdoor displacement to compare the displacement field at different stages. For analysis, the DEM sample can be artificially divided into three zones according to the vertical displacement: (a) “Zone-I” (marked as blue) with vertical displacement of particles less than 0.1δ; (b) “Zone-II” with vertical displacement of particles less than 0.9δ but larger than 0.1δ; (c) “Zone-III” (marked as red) with vertical displacement of particles larger than 0.9δ. The area ratios of the different zones denoted in these figures are calculated by dividing the particle area of a certain zone into the whole particle area of the sample. According to Figure 5, the boundaries of zone-III are similar to the triangular slip surfaces observed in the model tests [5,7,9]. The area of zone-III is influenced little by sample porosity, while zone-Ⅰ and zone-Ⅱ are observed to be significantly influenced by sample porosity. The area of zone-II expands with the increase in sample porosity, leading to the reduction in the area of zone-I. On the other hand, the area ratios of zone-I and zone-III are both increased with the increase in trapdoor displacement, while the area of zone-II is decreased. This phenomenon is more obvious when H/B = 2 (Figure 6). In the simulation results of H2-n0.16, the area of zone-II decreases by around 19% when δ increases from 10 mm to 60 mm, while these values in H2-n0.18 and H2-n0.20 are 17% and 13%, respectively. Therefore, significant shear localization is generated in zone-II as the trapdoor displacement increases. According to these results, the shear localization induced by the gradual development of particle motion in zone-II is supposed to have a significant influence on the evolution of soil arching.

3.2. Microscale Results Analysis

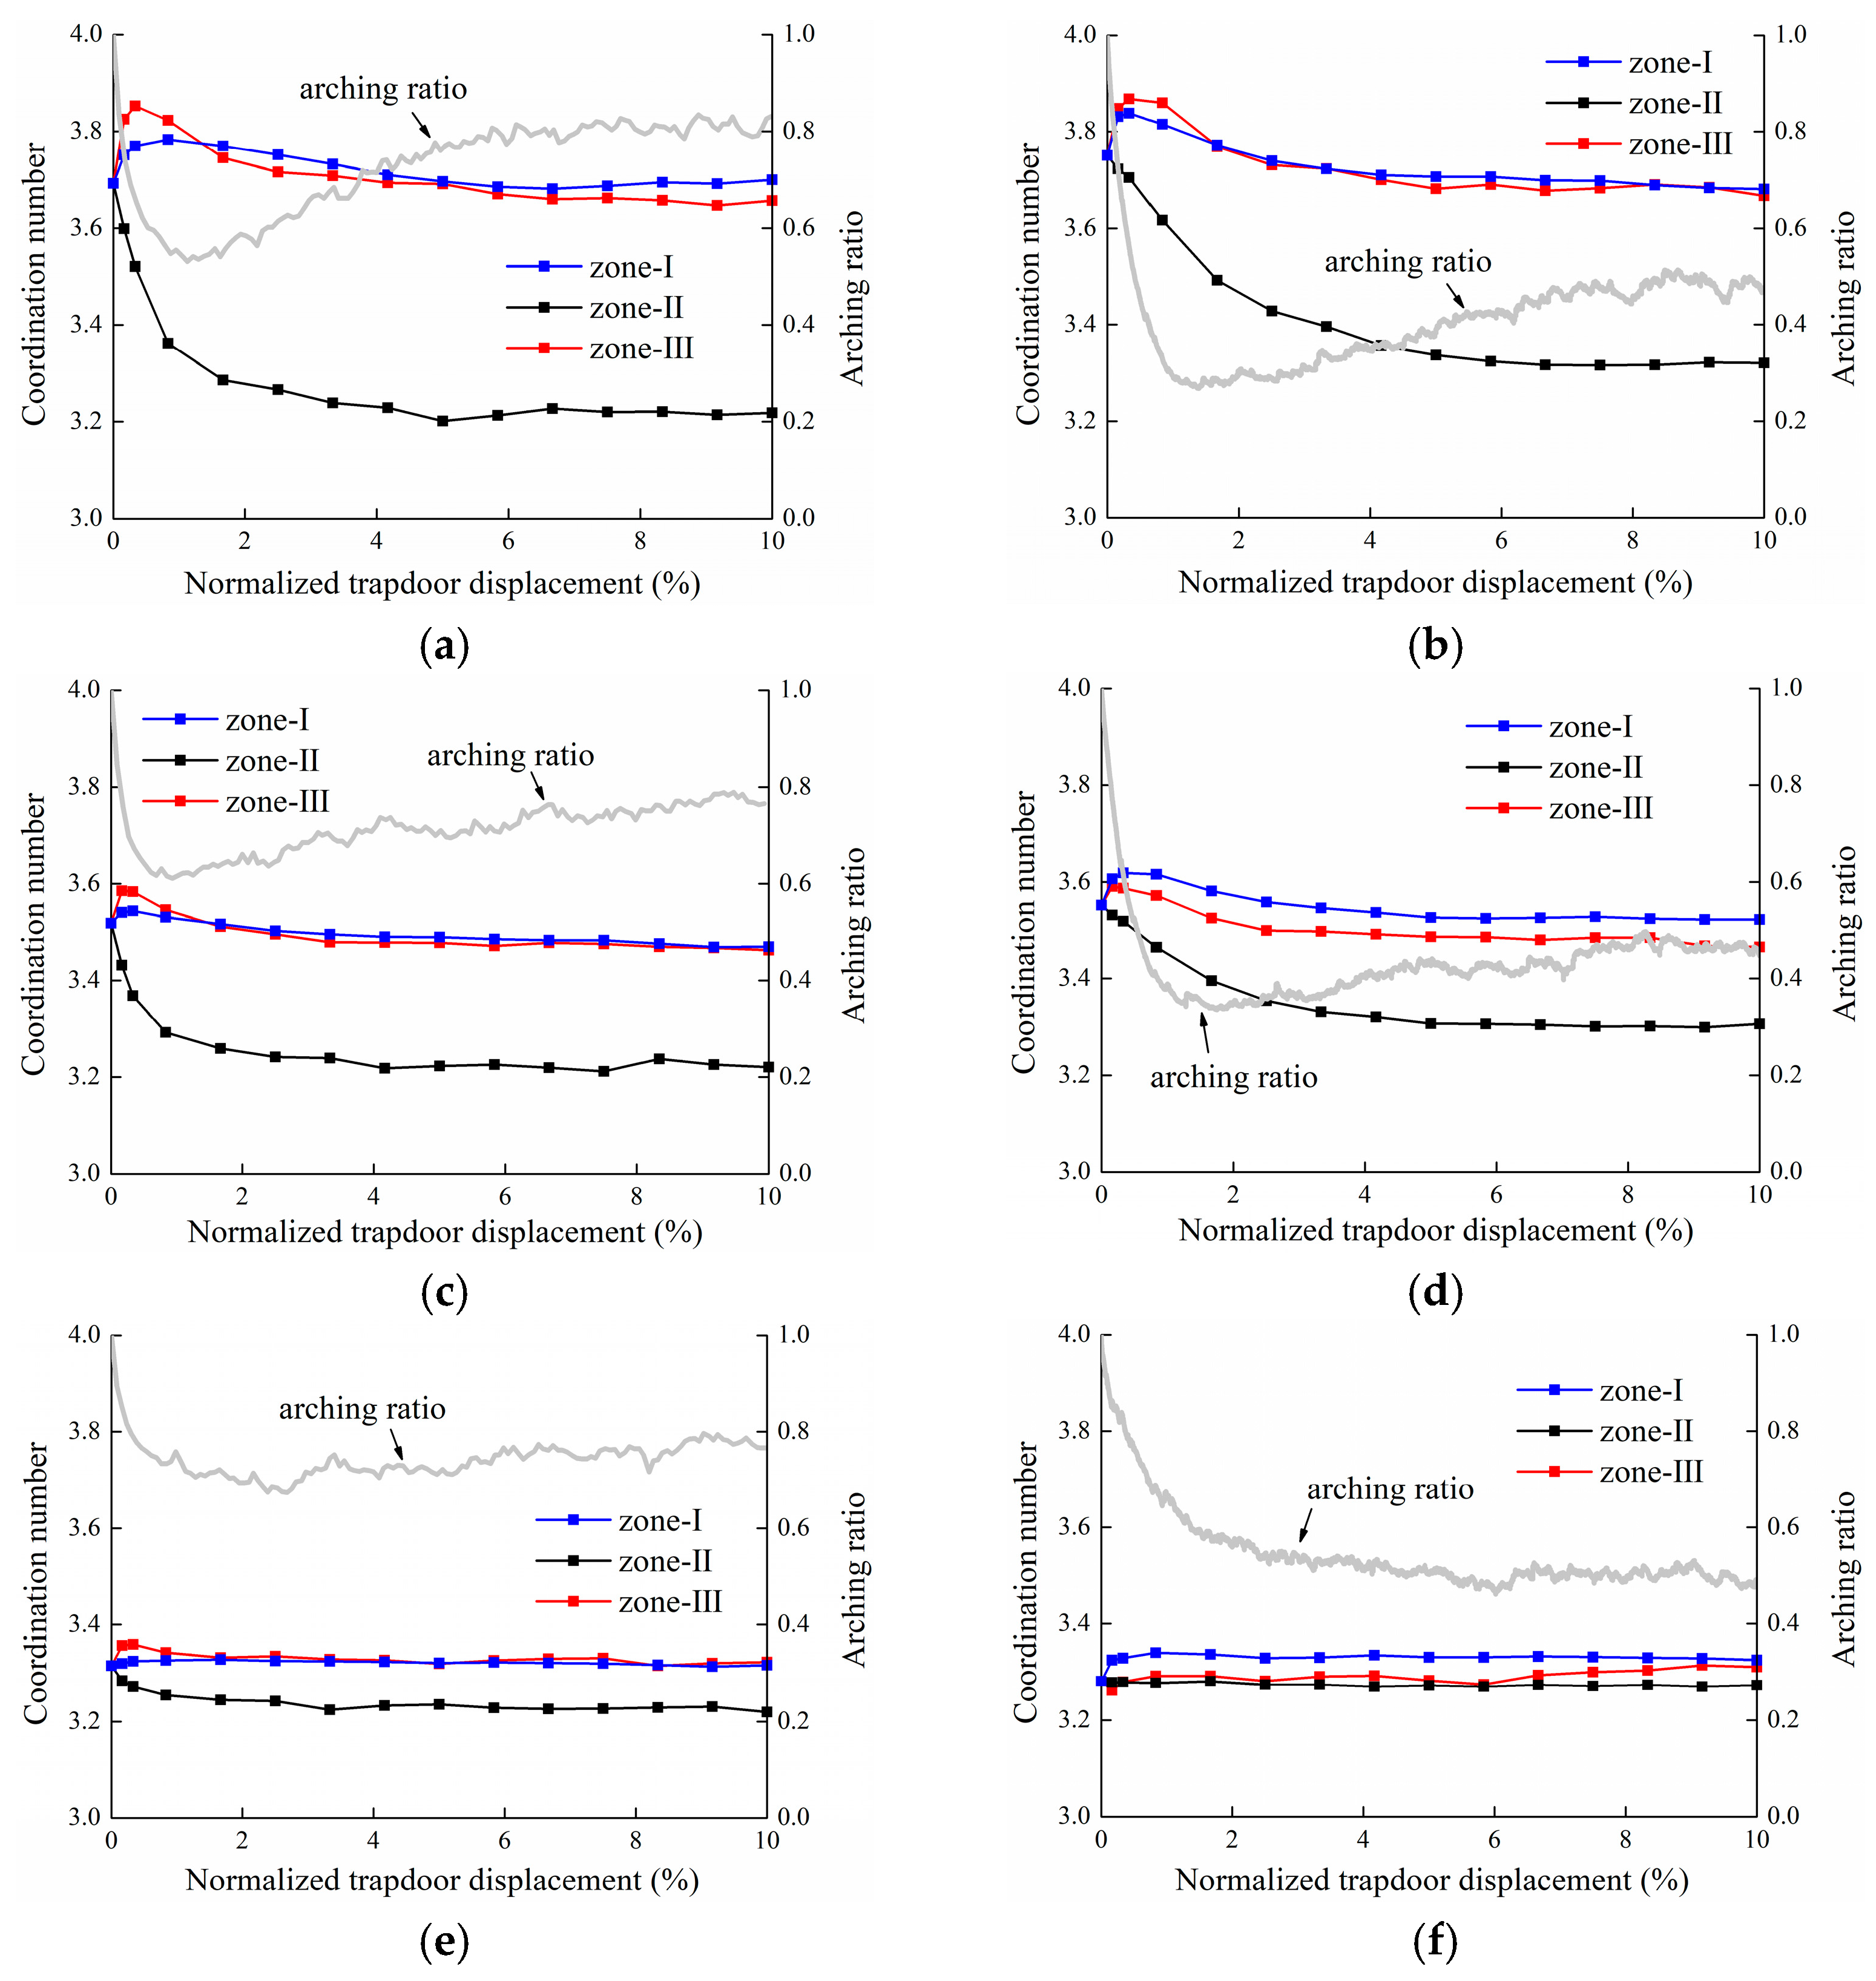
3.2.1. Coordination Number

According to the displacement field analysis, the relative displacement of particle assemblies will lead to a variation in sample porosity. However, precisely calculating the porosity in a zone of a DEM sample is quite difficult. Alternatively, the coordination number is another parameter for evaluating the variation in sample density and the evolution of microstructure in granular materials. The coordination number represents the average number of contacts per particle, and it is highly correlated to the volume strain of granular material and more sensitive than porosity [42]. The coordination number in a zone can be calculated by:
Z = 2C/N,
where C and N are the total contact number, and the particle number in the zone, respectively. Figure 7 shows the variation in Z in different zones during the trapdoor test simulations. According to these figures, variation in Z in zone-II is most significant among the three zones. It decreases with the trapdoor displacement during the whole process of soil arching development and degradation, and finally reaches a constant value at the ultimate state when the arching ratio is no longer varied as trapdoor displacement increases, indicating that the porosity of particle assemblies in zone-II increases continuously during the evolution of soil arching (including development and degradation). According to a previous study on the evolution of the coordination number in simulated granular materials, the reduction in the coordination number is generally induced by shear dilation [43]. Therefore, the decrease in Z in zone-II may be largely attributed to the shear dilation of particle assembly in this zone. As shear dilation is more significant in denser samples, the reduction in Z in zone-II is reduced with sample porosity. Figure 8 shows the comparison of Z in zone-II with different sample porosities. It is observed that although Z in zone-II is initially different in the simulations with different sample porosities, they all decrease to a consistent ultimate value at the end of the simulation. This ultimate constant value of Z when H/B = 2 is a little larger than that in the simulations with H/B = 1 because the stress level of the particle assembly is increased with buried depth so that a lower decrease in Z is induced by shear dilatancy when H/B = 2.
Variation in Z in both zone-I and zone-III is less significant than in zone-II. And, different to zone-II during the whole simulation process, Z values in both these two zones are decreased with the increase in sample porosity. For zone-I, the average coordination number increases during the development process of soil arching, because the upper load is transferred toward zone-I under the arching effect, leading to the compression of particle assembly in zone-I. Therefore, as soil arching is degenerated by the continuous increase in particle relative displacement, it is observed that Z decreases gradually under the lateral unloading effect and finally reaches a constant value. Especially in the simulations of H1-n0.20 and H2-n0.20, no obvious decrease in Z is observed in Figure 7e,f, because the degradation of soil arching in these two simulations is slight. The variation trend of Z in zone-III is similar to that in zone-I. The maximum value of Z in zone-III is observed to be larger than the maximum Z in zone-I because the stress level of the particle assembly in zone-III (at the bottom of the model) is much larger, compared with the stress level in zone-I at the beginning of the simulation. However, at the end of the simulation, the stress level in zone-III is decreased under the influence of soil arching so that the ultimate Z value in zone-III is less than that in zone-I.

3.2.2. Particle Contact Force

Variation in the coordination number of granular assemblies will change the contact state between particles. The particle contact force, f, in microscale can be resolved into two components:
f = fnx + fsy
where fn and fs are the normal contact force and the tangential contact force between particles, respectively. The average values of fn and fs in a certain zone are denoted as <fn> and <fs>, respectively.
Figure 9 shows the variation in <fn> in different zones during the simulation. Since the analysis of tangential contact forces evolution leads to similar results with normal contact forces, it is not discussed here. As we can see in the figures, <fn> in zone-II is supposed to be important in the development and degradation of soil arching. During the initial arching stage, <fn> increases rapidly because of the large particle relative movement and interlocking in zone-II, leading to the sharp decrease in the <fn> in zone-III. Because the arching ratio is correlated with the contact force acting on the trapdoor, a decrease in the arching ratio is observed in this process, indicating the gradual development of soil arching. As a result, the upper load is transferred toward two sides so that the particle contact force in zone-I increases. Then, <fn> in zone-II decreases gradually with δ because of the continuous decrease in the coordination number as indicated in Figure 7. As a result, <fn> in zone-I is also decreased. Meanwhile, a recovery of the arching ratio, representing soil arching degradation, is observed, according to Figure 9. The variation in <fn> in different zones tends to be more significant as the sample porosity decreases, which is coincident with the fact that the development and degradation process of soil arching is much more obvious in granular assemblies with lower porosity. It is also observed that the decrease in <fn> in zone-II after the maximum value when H/B = 1 is more significant than that in the scenario of H/B = 2, and therefore, degradation of soil arching in H1-n0.16 and H1-n0.18 is more obvious than that in H2-n0.16 and H2-n0.18. On the other hand, it is noted that the evolution of <fn> in H2-n0.20 shows a different tendency comparing with other simulations. The <fn> in the three zones all decrease gradually as δ increases. According to Figure 6c, zone-II extends to the rigid boundaries in this simulation. The different evolutionary tendency of <fn> may be attributed to the boundary effect.
The mobilization of friction between two contact particles can be mathematically evaluated by the friction mobilization index Im [44]:
Im = |fs|/(μfn)
where μ is the friction coefficient between particles. When local failure occurred between two particles, Im = 1 and particle sliding occurred at the contact. In this study, sliding is believed to occur when Im is larger than 0.9999, and a slip ratio is defined as the number of sliding points divided by the total contact numbers. Figure 10 presents the slip ratios in different zones. According to the figures, the slip ratios of different zones in different simulations all increase sharply during the same initial stage. Then, they decrease substantially and maintain nearly constant with increases in trapdoor displacement. In all simulations, it is observed that the slip ratio in zone-II is obviously larger than that in the other two zones, and the slip ratios in zone-I and zone-III are generally identical. Therefore, the friction mobilization degree in zone-II is the highest among the three zones. The slip ratio of zone-II increases rapidly during soil arching development, indicating that the friction between particles in zone-II is fully mobilized in this process. Comparing with Figure 9, it is interesting to find that the slip ratio in zone-II reaches the maximum value at a similar trapdoor displacement, corresponding to the maximum value of <fn> and the minimum arching ratio value. Then, as soil arching is degenerated gradually, the slip ratio in zone-II also decreases and reaches a constant value at the end of the simulation. As presented in Figure 11, the maximum sliding ratios in zone-II decreased with the initial porosity. However, they tend to the same residual value at the end of the simulation. The decreases in the sliding ratio in zone-II may be attributed to the continuous decreases in the coordination number. The sliding contact fades away as the porosity increases, leading to particle rearrangement and a decrease in the sliding ratio. On the other hand, it can also be observed that the sliding ratios in zone-I and zone-III also initially increase because of the particle dislocation induced by trapdoor movement, but then they decrease rapidly to a low level (less than 30% of the sliding ratio in zone-II) with soil arching evolution and load redistribution.

3.3. Mesoscale Results Analysis

Variations in particle contact force and the coordination number mean that the mesoscale behaviors related to the force network, spanning roughly 10–15 particles, are also influenced by soil arching. In order to analyze the mesoscale cluster structure of force networks’ evolution during soil arching development and degradation, the topological analysis method—persistent homology (PH) [23,24]—is adopted in this study. PH could be thought of as a tool for describing the weighted force networks between particles in the form of diagrams, so called persistent diagrams (PDs), which are obtained by filtering, or thresholding, the strength of the interactions between the particles. For example, considering a normal contact force network between particles in Figure 12, the numbers in Figure 12a represent the magnitude of particle contact force, and the simplest persistence diagrams in Figure 12b, called PDβ0, encode how distinct connected components in the force network appear and then merge as the threshold θ (denoted the normal contact force value here) decreases. Each point (called a generator) in this diagram has two coordinates: ‘birth’ and ‘death’. A birth in PDβ0 occurs when an edge not connected to any existing edge is added to the contact force network, or a set of all contacts, and a death occurs when a newly added edge connects two existing force networks. Each point (b, d) (where b denotes the birth coordinate and d denotes the death coordinate) in PDβ0 describes a feature of the network, and the lifespan of a point (defined as bd) can be interpreted as the notable degree of the feature. Therefore, PDβ0 can essentially trace how ‘force chains’ appear as the filtration level is decreased, or disappear as two structures merge. The reader is referred to [24] for a more in-depth presentation of this method.
In order to analyze the mesoscale cluster structure of force networks’ evolution during soil arching development, the persistence diagrams of the normalized force networks (all contact forces are normalized by the corresponding <fn> in different zones) are computed. according to the DEM simulation results. Figure 13 and Figure 14 show the corresponding diagrams of the H1-n0.16 and H2-0.16 simulations, respectively. In the analysis of these results, it is important to remember that the points (generators) that are close to the diagonal represent features that persist over only a small range of thresholds and, therefore, are not significant for the purpose of identifying robust features. According to Figure 4, soil arching develops gradually when δ increases from 0 mm to around 10 mm. During this process, a lot of generators with large ‘birth’ coordinates can be observed away from the diagonal of PDβ0, meaning that robust contact force chains with large normal contact force are generated. And these arched force chains are mostly within zone-II. Then, as soil arching is degenerated gradually, the robust cluster structures disappear and the generators in zone-II gradually shrink to the diagonal of PDβ0. This phenomenon can be observed in both Figure 13 and Figure 14.
On the other hand, information about the variations in the contact structure within zone-I and zone-III is not readily available from the point clouds in Figure 13 and Figure 14. Hence, the average lifespans of all points within different zones are then calculated and presented in Figure 15. Generally, long lifespan represents robust force chains in the contact force network. As shown in the figures, in the simulations with n = 0.16 (H1-n0.16 and H2-n0.16), the average lifespan of generators in zone-II increases with trapdoor displacement during the initial arching stage (δ < 10 mm), meaning that robust force chains with large normal contact force are formed in this zone. Under the influence of this arched force chain, the particle contact force acting on the trapdoor is decreased, leading to the decrease in the arching ratio in this process. Then, the average lifespan of generators in zone-II decreases gradually with trapdoor displacement (δ ≥ 10 mm), meaning that the arched structure of the force chain is weakened and destroyed. As a result, load recovery is observed on the GRC.
Similar trends can also be observed in the simulations of n = 0.18 and n = 0.20, but the variation in the average lifespan of the generators tends to be less significant with the increase in sample porosity, which corresponds to the variation in the arching ratio and <fn> in different simulations. Figure 16 presents the comparison of the average lifespan of generators in zone-II of different simulations. The maximum average lifespan value is decreased with the initial porosity, but, similar to the average coordination number and the slip ratio, the residual values of the average lifespan at the end of the simulations with different initial porosities are identical to each other. According to these results, the variation in average lifespan may be attributed to the particle motion with increasing trapdoor displacement. In dense samples, during the initial arching stage, particle contact in zone-II decreases because of sliding and the coordination number decreases sharply, too. With this effect, particle contact force is increased, and arched force chains are formed gradually in this stage so that the average lifespan is increased. Under the shield of these arched force chains, the arching ratio is decreased. Then, as relative displacement between particles in zone-II continues to increase, particles separate with each other gradually, the coordination number continuous decreases and <fn> starts to decrease. As a result, the arched force chains are degenerated, leading to the soil arching degradation. In loose samples, a smaller decrease in the coordination number means that contact particles in zone-II would not separate further. Force chains are gradually formed in zone-II, as indicated by the average lifespan, and no obvious load recovery stage is observed in this case.
On the contrary, the average lifespan of generators in zone-I and zone-III show adverse variation trends. This phenomenon indicates that the force chains in zone-I and zone-III are degenerated when the force chains in zone-II are reinforced during the development of soil arching. Then, the force chains in zone-I and zone-III develop gradually as the force chains in zone-II are degenerated by the decreasing particle contact force when δ ≥ 10 mm.

4. Discussion

In this work, multi-scale analysis on the mechanisms of soil arching development and degradation in granular materials with different relative density was conducted through a series of DEM simulations of the trapdoor test. Analysis of results indicates that the evolution of force chains and particle contact forces in zone-II is important in the development and degradation of soil arching. The main results are summarized in Table 3.
Careful analysis of the mesoscale network structure through PH in this study provides new insight into the development and degeneration of soil arching. According to the analysis results in zone-II, before the maximum arching state (corresponding to the minimum arching ratio), robust arched force chains with large normal contact forces are generated because of the interlocking between particles. As a result, contact forces between particles in zone-II increase rapidly. After the maximum arching state, the arched force chains are degenerated gradually with the continuous increase in trapdoor displacement, leading to the continuous decrease in particle contact forces and an increase in the arching ratio. The arched force chains are more easily generated in denser samples, leading to a stronger maximum arching in the cases with higher density. However, as the slip ratio, the average particle contact force and the average lifespan of the force network all reach the same value at the ultimate state of soil arching, regardless of relative density, the ultimate arching ratio is also little influenced by porosity.
In practical engineering, such as pile embankments, soil arching will be degenerated gradually with the continuous increase in relative settlement between the pile and the sub-soil, leading to the decrease in the pile–soil stress ratio and pile efficacy, which is not favorable to the whole structure. A higher compaction degree can improve the performance of the embankment, but it should also be noticed that soil arching degeneration is more significant in denser fills. According to this study, soil arching development and degradation can be attributed to the evolution of arched force chains in specific zones. Therefore, improvement of the stability of force chains in this specific zone, such as adding geotextiles, is supposed to be considered in the measures to improve the persistence of soil arching and performance of pile-supported embankments. On the other hand, the method and results presented in this study can also provide guidance for studies of soil arching under complex conditions, such as surcharge loading, suffusion influence, etc.
However, it is noted that the DEM simulations in this paper are conducted under 2D conditions with circle particles, so it cannot capture the influence of particle shape and particle size on the multi-scale mechanisms of soil arching development and degradation in real 3D conditions, which also needs further analysis.

5. Conclusions

In this study, two-dimensional DEM numerical analysis was conducted to investigate the multi-scale mechanisms of soil arching development and degradation in granular materials with different relative density. Six DEM simulations, considering two different buried depth ratios of granular assemblies with three different porosities of particle assembly, were conducted. For analysis, the particle sample is artificially divided into three zones according to the normalized vertical displacement field: (a) “Zone-I” with vertical displacement of particles less than 0.1δ; (b) “Zone-II” with vertical displacement of particles less than 0.9δ but larger than 0.1δ; (c) “Zone-III” with vertical displacement of particles larger than 0.9δ. The evolution of the mesoscale structure of contact force networks during the evolution of soil arching is quantitatively analyzed through persistence homology. The influence of force network evolution on the macroscopic and mesoscopic phenomena of soil arching are carefully evaluated. The major conclusions are summarized according to the analysis results:
  • The porosity of particle assembly has a significant influence on the development and degradation of soil arching. According to the ground reaction curves (GRC), soil arching generated in a denser particle assembly is stronger as the minimum value of the arching ratio is increased with the initial porosity. However, the arching ratios at the end of simulations with different initial porosities are identical. The recovery of the arching ratio after the minimum value is more significant in the simulation with a denser particle assembly, which indicates a more obvious degeneration of soil arching. In macroscope, the development and degradation of soil arching can be attributed to the shear localization generated in zone-II at different arching stages according to the normalized vertical displacement fields.
  • According to the microscale analysis accounting for the coordination number and the slip ratio of contact, particle friction is mobilized and dilatancy is generated during the initial arching stage, leading to the rapid development of soil arching in a granular assembly. The granular fills in zone-II undergo the most significant shearing during the simulations. As a result, soil arching is highly correlated to the particle contact forces’ evolution in zone-II. In all cases, the average normal contact forces in zone-II increase during the development of soil arching. Then, they decrease gradually after the maximum arching stage, accompanied with soil arching degradation.
  • Quantitative network analysis results indicate that the force chains show different evolution in simulations with different sample densities. The force chains in zone-II influence both the particle behaviors in microscale and the arching ratio in macroscale. Before the maximum arching state (corresponding to the minimum arching ratio), robust force chains with large normal contact forces are generated in zone-II. Stronger force chains are generated in denser samples at the maximum arching state. After the maximum arching state, the arched force chains are degenerated gradually with relative displacement between particles, leading to the decrease in normal particle contact forces in microscope and the increase in the arching ratio in macroscope. In loose samples, force chains are gradually generated with relative soil displacement until the ultimate state of soil arching, so no obvious degradation of soil arching is observed.
  • The slip ratio, the average particle contact force and the average lifespan of the force network in zone-II undergo similar evolution processes during the development and degradation of soil arching, but all reach the same value at the ultimate state of soil arching regardless of relative density. As a result, the arching ratio at the limit state of soil arching is also independent with the relative density.

Author Contributions

Conceptualization, L.L.; Project administration, X.F.; Software, L.L.; Validation, Y.P.C.; Writing—original draft, L.L.; Writing—review and editing, Z.D. and C.X. All authors have read and agreed to the published version of the manuscript.

Funding

This research was funded by National Key R&D Program of China (No. 2023YFC3009400), Natural Science Foundation of Zhejiang Province of China (No. LQ22E080009, No. LQ23E080002), National Natural Science Foundation of China (No. 52278418, No. 52308379, No. 52238009) and the open fund project of Key Laboratory of Safe Construction and Intelligent Maintenance for Urban Shield Tunnels of Zhejiang Province (No. HZCU-UST-23-07).

Data Availability Statement

The data used to support the findings of this study are available from the corresponding author upon request.

Conflicts of Interest

The authors declare no conflicts of interest.

References

  1. Terzaghi, K. Theoretical Soil Mechanics; John Wiley and Sons: New York, NY, USA, 1943. [Google Scholar]
  2. Han, J.; Gabr, M.A. Numerical analysis of geosynthetic-reinforced and pile-supported earth platforms over soft soil. J. Geotech. Geoenviron. Eng. 2002, 128, 44–53. [Google Scholar] [CrossRef]
  3. Iglesia, G.R. Trapdoor Experiments on the Centrifuge: A Study of Arching in Geomaterials and Similitude in Geotechnical Models. Ph.D. Thesis, Massachusetts Institute of Technology, Cambridge, MA, USA, 1991. [Google Scholar]
  4. Chevalier, B.; Combe, G.; Villard, P. Experimental and discrete element modeling studies of the trapdoor problem: Influence of the macro-mechanical frictional parameters. Acta Geotech. 2012, 7, 15–39. [Google Scholar] [CrossRef]
  5. Iglesia, G.R.; Einstein, H.H.; Whitman, R.V. Investigation of soil arching with centrifuge tests. J. Geotech. Geoenviron. Eng. 2014, 140, 04013005. [Google Scholar] [CrossRef]
  6. Han, J.; Wang, F.; Al-Naddaf, M.; Xu, C. Progressive development of two-dimensional soil arching with displacement. Int. J. Geomech. 2017, 17, 04017112. [Google Scholar] [CrossRef]
  7. Liang, L.J.; Xu, C.J.; Chen, Q.Z.; Chen, Q.S. Experimental and theoretical investigations on evolution of soil-arching effect in 2D trapdoor problem. Int. J. Geomech. 2020, 20, 06020007. [Google Scholar] [CrossRef]
  8. Burke, T.S.; Elshafie, M.Z.E.B. Arching in granular soils: Experimental observations of deformation mechanisms. Géotechnique 2021, 71, 866–878. [Google Scholar] [CrossRef]
  9. Rui, R.; van Tol, A.F.; Xia, Y.Y.; van Eekelen, S.J.M.; Hu, G. Investigation of soil-arching development in dense sand by 2D model tests. Geotech. Test. J. 2016, 39, 415–430. [Google Scholar] [CrossRef]
  10. Tao, F.J.; Xu, Y.; Zhang, Z.; Ye, G.B.; Han, J.; Cheng, B.N.; Liu, L.; Yang, T.L. Progressive development of soil arching based on multiple-trapdoor tests. Acta Geotech. 2023, 18, 3061–3076. [Google Scholar] [CrossRef]
  11. Xu, C.J.; Liang, L.J.; Chen, Q.Z.; Luo, W.J.; Chen, Y.F. Experimental study of soil arching effect under seepage condition. Acta Geotech. 2019, 14, 2031–2044. [Google Scholar] [CrossRef]
  12. Bao, N.; Wei, J.; Chen, J.F.; Wei, P. 2D and 3D discrete numerical modelling of soil arching. J. Zhejiang Univ.-Sci. A 2020, 21, 350–365. [Google Scholar] [CrossRef]
  13. Liu, Q.W.; Wang, H.L.; Chen, R.P.; Yin, Z.Y.; Lin, X.T.; Wu, H.N. Effect of relative density of 2D granular materials on the arching effect through numerical trapdoor tests. Comput. Geotech. 2022, 141, 104553. [Google Scholar] [CrossRef]
  14. Badakhshan, E.; Noorzad, A.; Bouazza, A.; Dafalias, Y.F.; Zameni, S.; King, L. Load recovery mechanism of arching within piled embankments using discrete element method and small scale tests. Powder Technol. 2020, 359, 59–75. [Google Scholar] [CrossRef]
  15. Jenck, O.; Dias, D.; Kastner, R. Discrete element modelling of a granular platform supported by piles in soft soil—Validation on a small scale model test and comparison to a numerical analysis in continuum. Comput. Geotech. 2009, 36, 917–927. [Google Scholar] [CrossRef]
  16. Rui, R.; Han, J.; van Eekelen, S.J.M.; Wan, Y. Experimental investigation of soil-arching development in unreinforced and geosynthetic-reinforced pile-supported embankments. J. Geotech. Geoenviron. Eng. 2019, 145, 04018103. [Google Scholar] [CrossRef]
  17. Rui, R.; Zhai, Y.X.; Han, J.; van Eekelen, S.J.M.; Chen, C. Deformations in trapdoor tests and piled embankments. Geosynth. Int. 2020, 27, 219–235. [Google Scholar] [CrossRef]
  18. Lai, H.J.; Zheng, J.J.; Zhang, J.; Zhang, R.J.; Cui, L. DEM analysis of ‘‘soil’’-arching within geogrid-reinforced and unreinforced pile-supported embankments. Comput. Geotech. 2014, 61, 13–23. [Google Scholar] [CrossRef]
  19. Xiong, H.; Qiu, Y.Y.; Lin, X.T.; Chen, X.S.; Huang, D.W. Multiple arching in cohesion–friction soils: Insights from deformation behavior and failure mechanisms using FEM-SPH approach. Comput. Geotech. 2023, 154, 105146. [Google Scholar] [CrossRef]
  20. Liang, L.J.; Cheng, Y.P.; Xu, C.J.; Wei, G.; Ding, Z. Microscopic mechanisms of particle size effect on 2D arching effect development and degradation in granular materials. Int. J. Multiscale Com. Eng. 2024, 22, 91–108. [Google Scholar] [CrossRef]
  21. Chen, R.P.; Liu, Q.W.; Wu, H.N.; Wang, H.L.; Meng, F.Y. Effect of particle shape on the development of 2D soil arching. Comput. Geotech. 2020, 125, 103662. [Google Scholar] [CrossRef]
  22. Liu, Q.W.; Chen, R.P.; Wang, H.L.; Yin, Z.Y.; Wu, H.N. Effect of particle shape on soil arching in the pile-supported embankment by 3D discrete-element method simulation. Int. J. Geomech. 2022, 22, 04022027. [Google Scholar] [CrossRef]
  23. Tordesillas, A.; Walker, D.M.; Liu, Q. Force cycles and force chains. Phys. Rev. E 2010, 81, 011302. [Google Scholar] [CrossRef]
  24. Snoeijer, J.H.; Vlugt, T.J.H.; van Hecke, M.; van Saarloos, W. Force network ensemble: A new approach to static granular matter. Phys. Rev. Lett. 2004, 92, 054302. [Google Scholar] [CrossRef]
  25. Bao, X.G.; Ma, W.Y.; Li, X. Controllability of fractional complex networks. Fractal. Fract. 2024, 8, 43. [Google Scholar] [CrossRef]
  26. Babič, M.; Marinković, D.; Kovačič, M.; Šter, M.; Calì, M. A new method of quantifying the complexity of fractal networks. Fractal. Fract. 2022, 6, 282. [Google Scholar] [CrossRef]
  27. Arévalo, R.; Pugnaloni, L.A.; Zuriguel, I.; Maza, D. Contact network topology in tapped granular media. Phys. Rev. E 2013, 87, 022203. [Google Scholar] [CrossRef]
  28. Kramár, M.; Goullet, A.; Kondic, L.; Mischaikow, K. Evolution of force networks in dense particulate media. Phys. Rev. E 2014, 90, 052203. [Google Scholar] [CrossRef]
  29. Kramár, M.; Goullet, A.; Kondic, L.; Mischaikow, K. Quantifying force networks in particulate systems. Phys. D Nonlinear Phenom. 2014, 283, 37–55. [Google Scholar] [CrossRef]
  30. Kramár, M.; Goullet, A.; Kondic, L.; Mischaikow, K. Persistence of force networks in compressed granular media. Phys. Rev. E 2013, 87, 042207. [Google Scholar] [CrossRef]
  31. Pugnaloni, L.; Carlevaro, C.; Kramár, M.; Mischaikow, K.; Kondic, L. Structure of force networks in tapped particulate systems of disks and pentagons. I. Clusters and loops. Phys. Rev. E 2016, 93, 062902. [Google Scholar] [CrossRef]
  32. Kong, B.W.; Dai, C.X.; Hu, H.B.; Xia, J.Z.; He, S.H. The fractal characteristics of soft soil under cyclic loading based on SEM. Persistence analysis. Fractal. Fract. 2022, 6, 423. [Google Scholar] [CrossRef]
  33. Gameiro, M.; Singh, A.; Kondic, L.; Mischaikow, K.; Morris, J.F. Interaction network analysis in shear thickening suspensions. Phys. Rev. Fluids 2020, 5, 034307. [Google Scholar] [CrossRef]
  34. Shah, S.; Cheng, C.; Jalali, P.; Kondic, L. Failure of confined granular media due to pullout of an intruder: From force networks to a system wide response. Soft Matter 2020, 16, 7685–7695. [Google Scholar] [CrossRef]
  35. Lai, H.J.; Zheng, J.J.; Cui, M.J.; Chu, J. “Soil arching” for piled embankments: Insights from stress redistribution behaviour of DEM modelling. Acta Geotech. 2020, 15, 2117–2136. [Google Scholar] [CrossRef]
  36. Rui, R.; van Tol, A.F.; Xia, X.L.; van Eekelen, S.J.M.; Hu, G.; Xia, Y.Y. Evolution of soil arching; 2D DEM simulations. Comput. Geotech. 2016, 73, 199–209. [Google Scholar] [CrossRef]
  37. Xu, C.; Zhang, X.Y.; Han, J.; Yang, Y. Two-dimensional soil-arching behaviour under static and cyclic loading. Int. J. Geomech. 2019, 19, 04019091. [Google Scholar] [CrossRef]
  38. Duan, N.; Cheng, Y.P.; Liu, J.W. DEM Analysis of Pile Installation Effect: Comparing a Bored and a Driven Pile. Granul. Matter 2018, 20, 36. [Google Scholar] [CrossRef]
  39. Liang, L.J.; Xu, C.J. Numerical and theoretical research on stress distribution in the loosening zone of the trapdoor problem. Int. J. Numer. Anal. Met. 2019, 43, 1426–1447. [Google Scholar] [CrossRef]
  40. Rui, R.; van Tol, A.F.; Xia, Y.Y.; van Eekelen, S.J.M.; Hu, G. Evolution of Soil Arching: 2D Analytical Models. Int. J. Geomech. 2018, 18, 04018056. [Google Scholar] [CrossRef]
  41. King, L.; Bouazza, A.; Dubsky, S.; Rowe, R.K.; Gniel, J.; Bui, H.H. Kinematics of soil arching in piled embankments. Géotechnique 2019, 69, 941–958. [Google Scholar] [CrossRef]
  42. Zhao, S.; Evans, T.M.; Zhou, X.; Zhou, S. Discrete element method investigation on thermally induced shakedown of granular materials. Granul. Matter. 2017, 19, 11. [Google Scholar] [CrossRef]
  43. Rothenburg, L.; Kruyt, N.P. Critical state and evolution of coordination number in simulated granular materials. Int. J. Solids. Struct. 2004, 41, 5763–5774. [Google Scholar] [CrossRef]
  44. Xu, D.S.; Tang, J.Y.; Zou, Y.; Rui, R.; Liu, H.B. Macro and micro investigation of gravel content on simple shear behavior of sand-gravel mixture. Constr. Build. Mater. 2019, 221, 730–744. [Google Scholar] [CrossRef]
Figure 1. General ground reaction curve (GRC).
Fractalfract 08 00247 g001
Figure 2. Schematic representation of the DEM model.
Fractalfract 08 00247 g002
Figure 3. Comparison between the simulation results and test results [33]: (a) Deviatoric stress in biaxial compression test; (b) Volume strain in biaxial compression test; (c) Arching ratio in trapdoor test.
Fractalfract 08 00247 g003
Figure 4. GRCs in different simulations: (a) H/B = 1; (b) H/B = 2.
Fractalfract 08 00247 g004
Figure 5. Normalized vertical displacement field of granular assemblies with H/B = 1: (a) n = 0.16; (b) n = 0.18; (c) n = 0.20.
Fractalfract 08 00247 g005
Figure 6. Normalized vertical displacement field of granular assemblies with H/B = 2: (a) n = 0.16; (b) n = 0.18; (c) n = 0.20.
Fractalfract 08 00247 g006
Figure 7. Evolution of average coordination number against trapdoor displacement: (a) H1-n0.16; (b) H2-n0.16; (c) H1-n0.18; (d) H2-n0.18; (e) H1-n0.20; (f) H2-n0.20.
Fractalfract 08 00247 g007
Figure 8. Comparison of average coordination number in zone-II of different simulations: (a) H/B = 1; (b) H/B = 2.
Fractalfract 08 00247 g008
Figure 9. Evolution of the average normal contact force against the trapdoor displacement: (a) H1-n0.16; (b) H2-n0.16; (c) H1-n0.18; (d) H2-n0.18; (e) H1-n0.20; (f) H2-n0.20.
Fractalfract 08 00247 g009
Figure 10. Evolution of slip ratio against trapdoor displacement: (a) H1-n0.16; (b) H2-n0.16; (c) H1-n0.18; (d) H2-n0.18; (e) H1-n0.20; (f) H2-n0.20.
Fractalfract 08 00247 g010
Figure 11. Comparison of sliding ratio in zone-II of different simulations: (a) H/B = 1; (b) H/B = 2.
Fractalfract 08 00247 g011
Figure 12. Toy example illustrating contact force network and persistence diagrams: (a) Normal contact force network; (b) Persistence diagrams PDβ0.
Fractalfract 08 00247 g012
Figure 13. PDβ0 of the contact force networks in different zones (H1-n0.16): (a) δ = 0 mm (K0 condition); (b) δ = 5 mm; (c) δ = 10 mm (maximum arching); (d) δ = 20 mm; (e) δ = 40 mm; (f) δ = 60 mm.
Fractalfract 08 00247 g013
Figure 14. PDβ0 of the contact force networks in different zones (H2-n0.16): (a) δ = 0 mm (K0 condition); (b) δ = 5 mm; (c) δ = 10 mm (maximum arching); (d) δ = 20 mm; (e) δ = 40 mm; (f) δ = 60 mm.
Fractalfract 08 00247 g014
Figure 15. Variation in average lifespan of PDβ0 in different zones during the simulations: (a) H1-n0.16; (b) H2-n0.16; (c) H1-n0.18; (d) H2-n0.18; (e) H1-n0.20; (f) H2-n0.20.
Fractalfract 08 00247 g015
Figure 16. Comparison of average lifespan in zone-II of different simulations: (a) H/B = 1; (b) H/B = 2.
Fractalfract 08 00247 g016
Table 1. General configuration of DEM simulation.
Simulation NameH1-n0.16H1-n0.18H1-n0.20H2-n0.16H2-n0.18H2-n0.20
H/B111222
n0.160.180.200.160.180.20
Particle number82,00080,00078,000164,000160,000156,000
Table 2. Micro-mechanical parameters used in DEM analyses.
ParametersValues
Particle density, ρp2650 kg/m3
Particle shear modulus, G2.5 × 1010 N/m2
Particle Poisson’s ratio, ν0.3
Friction coefficient between particles, μp-p0.5
Friction coefficient between walls and particles, μp-w0.0
Sample porosity, n0.16, 0.18, 0.20
Table 3. Summary of the main analysis results.
FactorsArching StateInfluence of Relative Density
DevelopmentDegradationUltimate State
Arching ratioSharply decreasedSlowly increasedConstant valueThe minimum value is increased with density, while the ultimate value is little influenced by density
Coordination number in zone-IISharply decreasedSlowly decreasedConstant valueThe variation is more significant in denser samples, while the ultimate value is little influenced by density
Average particle contact force in zone-IISharply increasedSlowly decreasedConstant valueThe variation is more significant in denser samples, while the ultimate value is little influenced by density
Slip ratio in zone-IISharply increasedSlowly decreasedConstant valueThe maximum value is increased with density, while the ultimate value is little influenced by density
Average lifespan of force network in zone-IISharply increasedSlowly decreasedConstant valueThe maximum value is increased with density, while the ultimate value is little influenced by density
Disclaimer/Publisher’s Note: The statements, opinions and data contained in all publications are solely those of the individual author(s) and contributor(s) and not of MDPI and/or the editor(s). MDPI and/or the editor(s) disclaim responsibility for any injury to people or property resulting from any ideas, methods, instructions or products referred to in the content.

