Real-Time QCM Measurements of Rolling Circle Amplification Products †
by
Narayanan Madaboosi
1,‡, 
Felix Neumann
1,‡,
Iván Hernández-Neuta
1,
Jeanpierre Salas
1,
Vasile Mecea
2 and
Mats Nilsson
1,* 1
Science for Life Laboratory, Department of Biochemistry and Biophysics, Stockholm University, SE-171 65 Solna, Sweden
2
QCM Laboratory, Järfälla, Sweden
*
Author to whom correspondence should be addressed.
†
Presented at the Eurosensors 2017 Conference, Paris, France, 3–6 September 2017.
Proceedings 2017, 1(4), 509; https://doi.org/10.3390/proceedings1040509
Published: 9 August 2017
(This article belongs to the Proceedings of Proceedings of Eurosensors 2017, Paris, France, 3–6 September 2017)
Abstract
:We demonstrate real-time experimental evidence for mass underestimation, to analyse high molecular weight biomolecules while using Quartz Crystal Microbalance (QCM) platform. For this, we present an experimental evidence with an assay consisting of an aptamer-antibody sandwich model with norovirus-like particles (NoVLPs). We combine this with the proximity ligation assay to generate bulky rolling circle products on a gold spot centralized quartz resonator surface. Real-time monitoring of the assay build-up reflects that bulky NoVLPs and amplified oligonucleotides generate fluctuating signals during measurement using a microfluidic QCM sensor. Such an understanding of mass underestimation for heavier molecules becomes indispensable to get deeper insights into molecular interactions in biotechnology studied using QCM devices.
1. Introduction
Quartz Crystal Microbalance (QCM) technology, allowing ultra-sensitive, label-free and real-time read-out of binding events by measuring the resonant frequency changes, has been widely used for the measurement of atoms and molecules of low to average molecular weight, about a few kilodaltons [1]. However, when QCM is used for measuring biomolecules of heavy molecular weight, there accompanies an inherent mass underestimation. Such a mass underestimation is associated when a frequency decrease is accompanied by an increase in dissipation or motional resistance [2]; thus, the viscoelastic film is vibrating with an exponentially decaying amplitude from the quartz resonator interface [3]. This physical effect of ‘missing mass’ [4] of biological samples in liquid phase measurements has been demanding experimental support in QCM arena.
We highlight this concept by providing an experimental proof, generating bulky rolling circle products (RCPs) using proximity ligation assay (PLA) [5] on a localized QCM (LQCM) platform, which possesses a mega-gravity field and thus enhanced sensitivity [3,6]. We use NoVLPs as analyte and demonstrate the build-up of a sandwich assay in a real-time manner by reading the resonant frequency. NoVLP-specific aptamers and antibodies were used for the capture of analyte, in turn used to generate highly specific RCPs [7] with bulky mass, around several thousands of kilodaltons on the surface.
2. Materials and Methods
Quartz crystals, as well as tubing and cartridge were cleaned by 15 min sonication in 1% Hellmanex II solution (Hellma Analytics, Müllheim, Germany), followed by a rinse in Milli-Q water and two subsequent ultrasonication steps in fresh Milli-Q water for 15 min each.
Label-free detection of NoVLPs in continuous flow was realized by a QCM setup from QCMLabs AB, Sweden, connected to a syringe pump (NE-1000, New Era Pump Systems, Inc., USA). The biosensor used in this study was a 10 MHz TC-cut quartz crystal with a 100 nm thick gold layer deposited onto a 60 nm adhesive titanium layer. TC cut is a slightly modified AC-cut with a different angle of cut, appropriate for less temperature sensitive measurements in liquids. The QCM crystal had a diameter of 14 mm, where the gold electrode had an active area of 1 mm2.
100 μg mL−1 thiolated aptamers, having high affinity to NoVLPs, were heat activated for 1 min at 90 °C and immobilized for 30 min on the gold substrate followed by a 30 min blocking step with blocking reagent from the PLA kit (Duolink In situ PLA probe anti-mouse PLUS and MINUS, Sigma-Aldrich, Germany). Subsequently, 1 μg mL−1 of a primary antibody (Anti-Norovirus GII.4 antibody, Abcam, UK) binds to an epitope of the VLP (30 min incubation) and allows the 1:4 diluted PLA probes to bind to it in close proximity to one another. The connector oligonucleotides hybridize in a circular way to the short DNA stretches that are conjugated to the PLA antibodies (60 min incubation). This circularization, enabled by a 30 min incubation of 55 U mL−1 ligase, facilitates RCA to generate micrometer-sized RCPs. The reaction mixture for amplification (Duolink In situ detection reagent orange, Sigma-Aldrich, Germany) contains, among others, 75 U mL−1 Φ29 polymerase and fluorescence-conjugated oligonucleotides that bind to repeated sequences of the RCP to enable optical imaging under a fluorescence microscope (Axio Imager II, Zeiss, Germany) (Figure 2).
Each assay step consisted of priming the tubing and flow cell at a flow rate of 10 μL min−1 before changing it to 1 μL min−1 which set the starting point of each incubation step. The entire assay was performed at a constant temperature of 37 °C and each assay step was followed by a 10 min washing step; 20 min after blocking and ligation. 10 mM PBS was used as washing buffer except for the ligation and amplification step which needed the kit wash buffers A and B, respectively.
3. Results
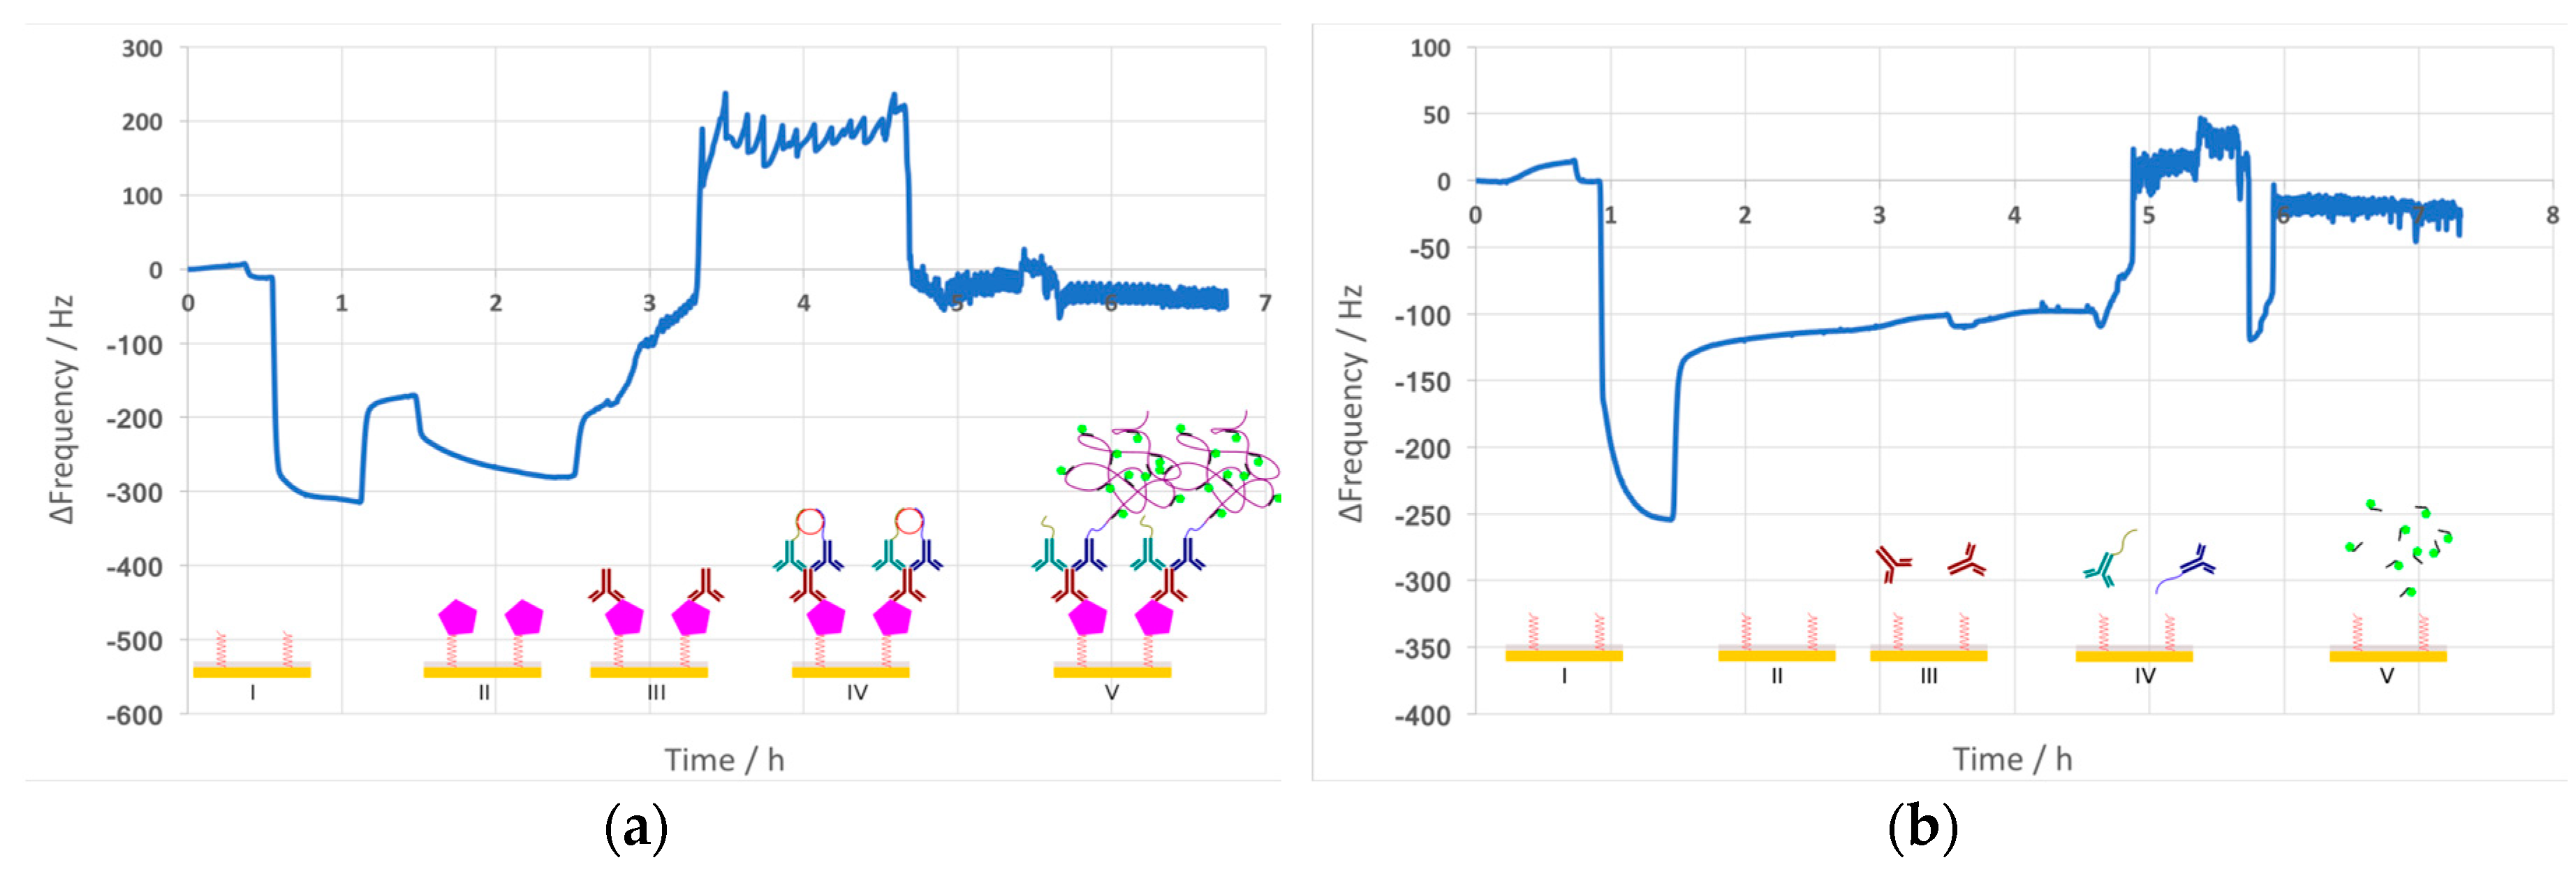
The results obtained from reading the resonant frequency of the sandwich-type PLA are illustrated in Figure 3. While both sensograms (Figure 3a,b) show similar frequency shifts for blocking, the subsequently observed frequency readings are different. The negative control maintains a steady baseline until the PLA probes are introduced, whereas the sensogram with NoVLPs shows frequency changes already during the NoVLP step and also for the following primary antibody incubation. Introducing primary antibody to the positive control results in an increased fluctuating resonant frequency. The negative control’s sensogram shows similar behavior only after the ligation step.
Besides label-free detection, QCM crystals were imaged under a fluorescence microscope to optically co-validate the observed frequency reads. The results show the presence of fluorescent RCPs for the NoVLP sample; however, the negative control, although significantly less, also revealed the presence of fluorescent RCPs (data not shown).
4. Discussion
The two sensograms obtained clearly differ, relating to the mass bound to the crystal surface. The NoVLP-containing run gets out-of-range already after introducing the primary antibody to the system. This fluctuation of resonant frequency is due to the high entities (heavy antibody molecules and RCPs) that are being built on the localized QCM crystal. Furthermore, the components of the sandwich structure are wobbly rather than rigid, and therefore cannot continue to follow the massive acceleration at the attachment point, 106 g compared to 1 g gravitational acceleration.
The negative control faces a similar fluctuation after PLA probe ligation. This can be explained by unspecific binding events to the crystal surface which might have resulted in the formation of few RCPs. Seemingly, these RCPs (together or independent of the assay components) were already bulky enough to result in vibrational energy loss. Due to such energy dissipation, the amplitude of vibration is not uniform inside the entities and thus the acceleration (field intensity) is also not uniform. As a consequence, mass sensitivity is smaller, resulting in mass underestimation.
5. Conclusions
Our results show that the build-up of bulky, viscoelastic mass on a quartz resonator leads to an unstable system where the frequency shift is unrelated to the actual deposited mass, thus explaining the mass underestimation or missing mass problem in QCM measurements for biotechnology. One of the most important aspects is the nature of molecule one wants to measure, in terms of size, weight and density. This gains utmost importance in biological systems, in which analytes may weigh thousands of Daltons and precise mass measurements require atom vibrations exactly at the same amplitude as that of the quartz resonator.
Here, we demonstrated that the entity of mass deposited on a quartz crystal can become so large that it cannot follow the acceleration of the vibrating quartz resonator resulting in a high loss of vibration energy by dissipation. Therefore, such studies to understand the mass underestimation issue become unavoidable while using QCM devices as biological sensors for detecting nucleic acid and protein biomarkers in order to get accurate and deeper insights into biological systems.
Acknowledgments
F. Neumann acknowledges the European Union’s Horizon 2020 research and innovation programme “New Diagnostics for Infectious Diseases” (ND4ID) under the Marie Skłodowska-Curie grant agreement No. 675412. The authors thank the EU FP-7 project ‘Norosensor’ and ‘BioBridges’ project under the Formas Strong Research Environment No. 221-2011-1692.
Conflicts of Interest
The authors declare no conflict of interest.
References
- Speight, R.E.; Cooper, M.A. A Survey of the 2010 Quartz Crystal Microbalance Literature. J. Mol. Recognit. 2012, 25, 451–473. [Google Scholar] [CrossRef] [PubMed]
- Mecea, V.M. Is quartz crystal microbalance really a mass sensor? Sens. Actuators A 2006, 128, 270–277. [Google Scholar] [CrossRef]
- Mecea, V.M. From Quartz Crystal Microbalance to Fundamental Principles of Mass Measurements. Anal. Lett. 2005, 38, 753–767. [Google Scholar] [CrossRef]
- Voinova, M.V.; Jonson, M.; Kasemo, B. ‘Missing mass’ effect in biosensor’s QCM applications. Biosens. Bioelectron. 2002, 17, 835–841. [Google Scholar] [CrossRef]
- Fredriksson, S.; Gullberg, M.; Jarvius, J.; Olsson, C.; Pietras, K.; Gústafsdóttir, S.M.; Ostman, A.; Landegren, U. Protein detection using proximity-dependent DNA ligation assays. Nat. Biotechnol. 2002, 20, 473–477. [Google Scholar] [CrossRef]
- Cumpson, P.J.; Seah, M.P. The quartz crystal microbalance; radial/polar dependence of mass sensitivity both on and off the electrodes. Meas. Sci. Technol. 1990, 1, 544–555. [Google Scholar] [CrossRef]
- Banér, J.; Nilsson, M.; Mendel-Hartvig, M.; Landegren, U. Signal amplification of padlock probes by rolling circle amplification. Nucleic Acids Res. 1998, 26, 5073–5078. [Google Scholar] [CrossRef]
- Kanazawa, K.; Gordon, J.G. The oscillation frequency of a quartz resonator in contact with a liquid. Anal. Chim. Acta 1985, 175, 99–105. [Google Scholar] [CrossRef]
Figure 1.
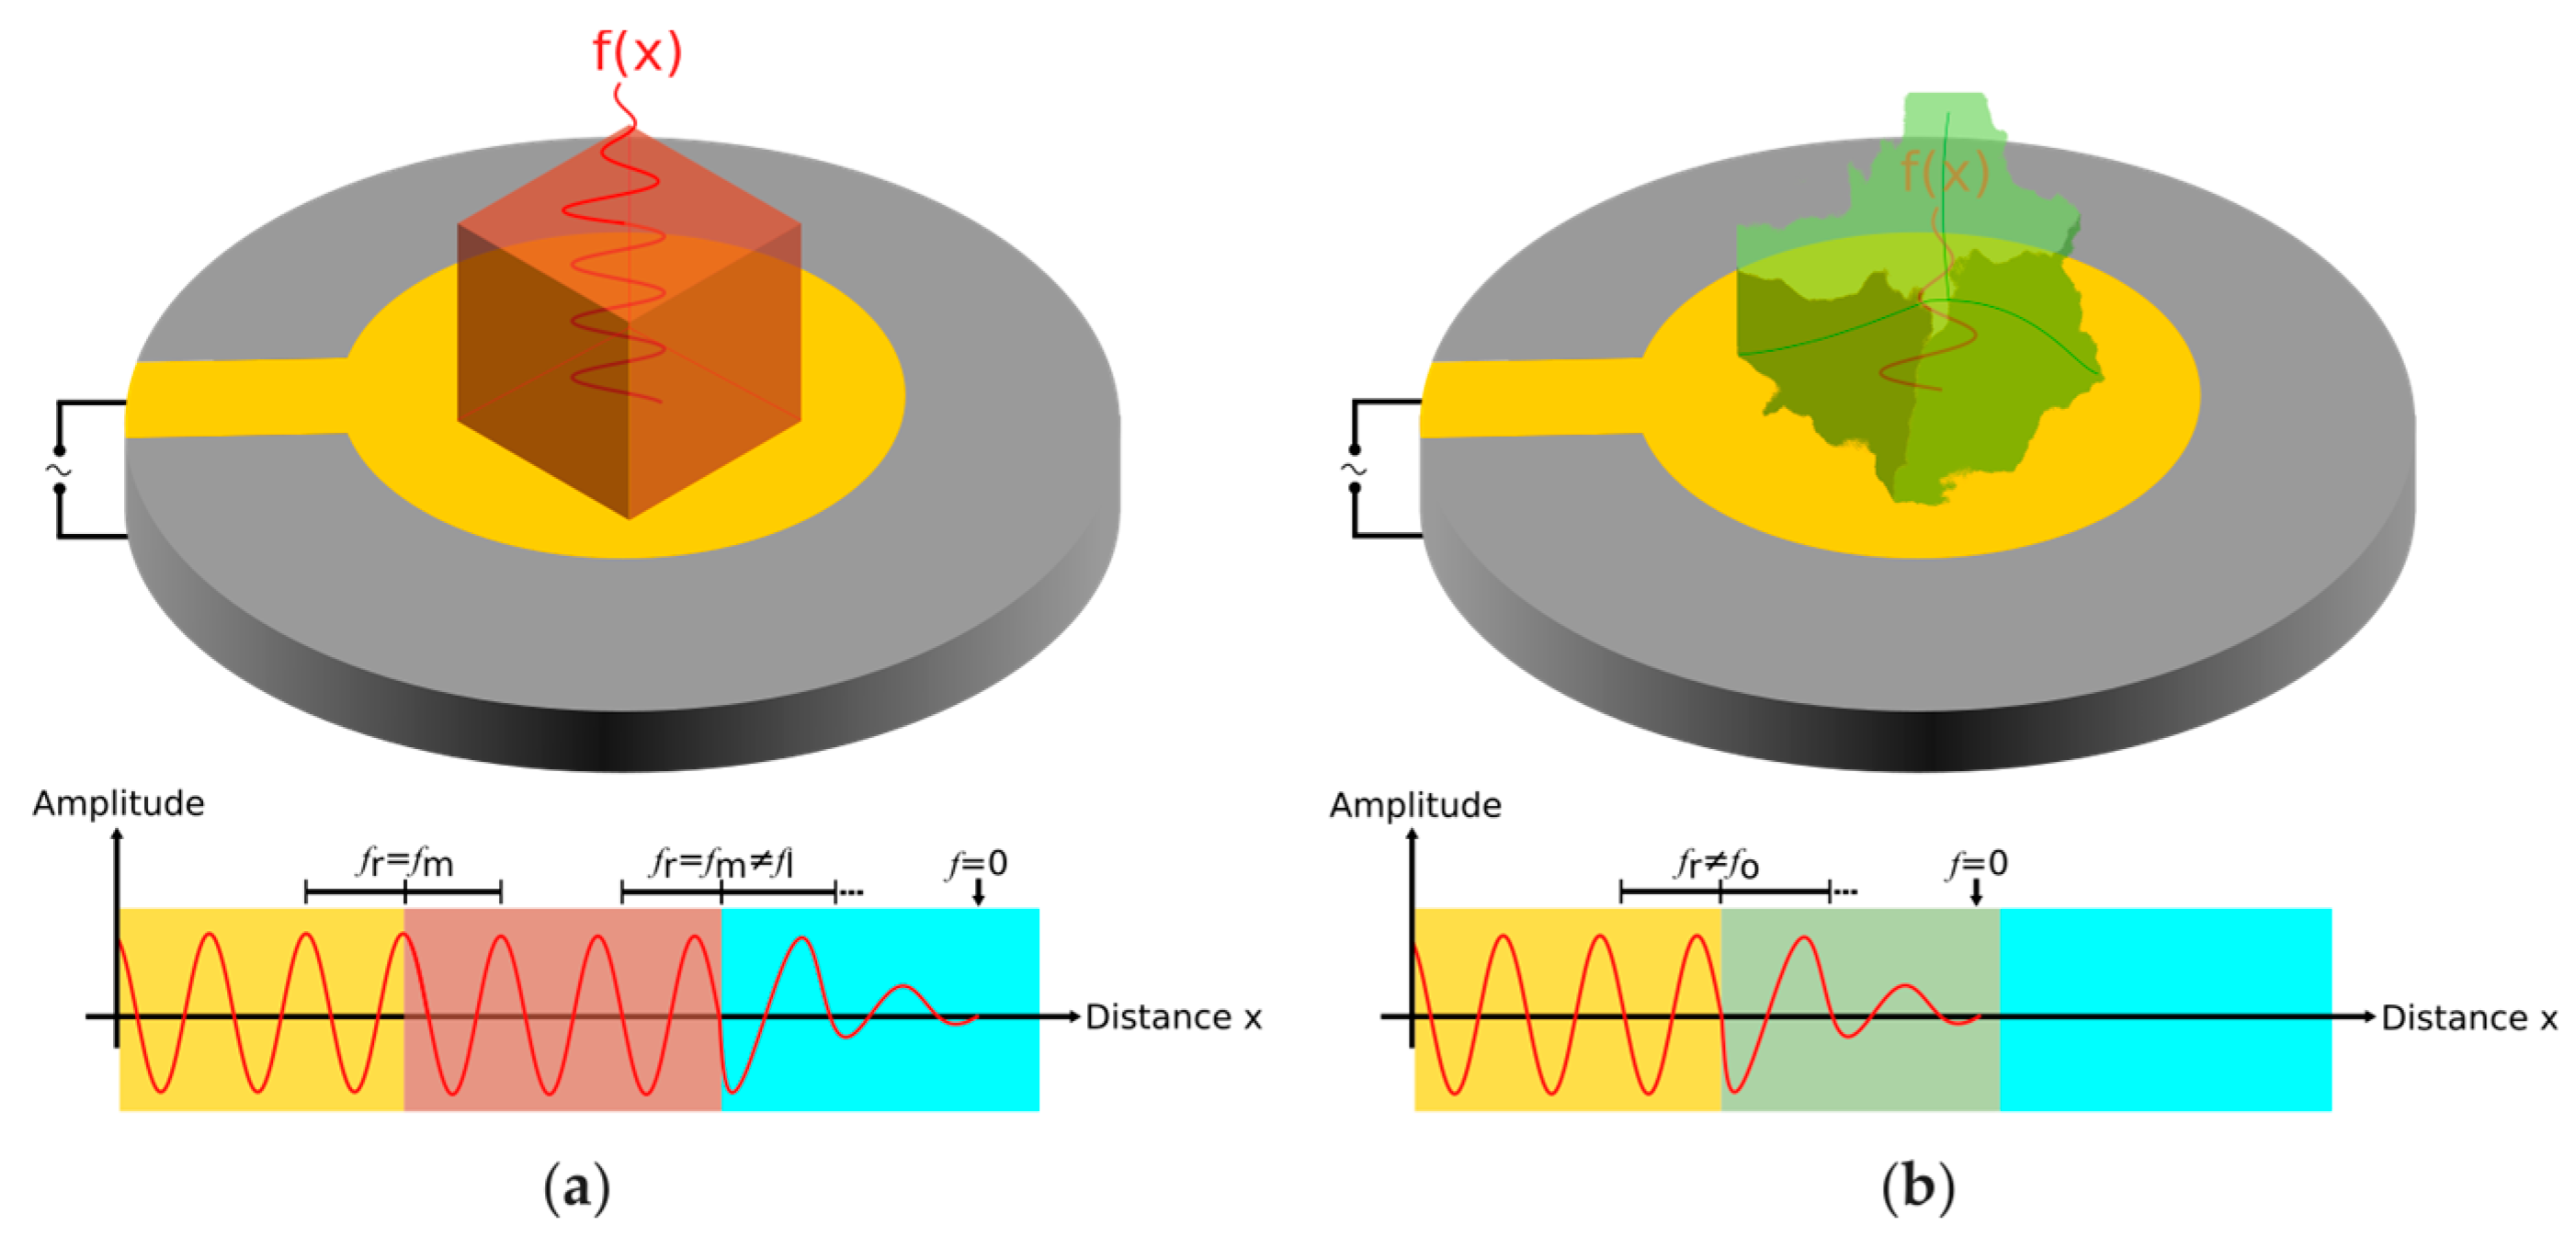
QCM working principle for rigid and viscoelastic masses. The upper part of the figure shows a quartz resonator surface with a deposited mass. For (a) this mass is rigid and therefore vibrates in the same resonant frequency as the quartz itself. In (b) the deposited mass is viscoelastic, thus cannot follow the vibrational acceleration which results in energy dissipation, and subsequently in mass underestimation. The plots illustrate the frequency amplitude versus distance from the quartz resonator surface (yellow), where fr: resonant frequency, fm: frequency of rigid mass, fl: frequency in liquid phase, and fo: frequency of viscoelastic mass. In (a), a depletion can only be seen when the wave leaves the rigid mass (brown) and hits liquid (blue). Due to the viscoelastic mass in (b), the decay length is much shorter and the vibrational wave cannot penetrate the entire mass (decay length typically 250 nm [8]).
Figure 1.
QCM working principle for rigid and viscoelastic masses. The upper part of the figure shows a quartz resonator surface with a deposited mass. For (a) this mass is rigid and therefore vibrates in the same resonant frequency as the quartz itself. In (b) the deposited mass is viscoelastic, thus cannot follow the vibrational acceleration which results in energy dissipation, and subsequently in mass underestimation. The plots illustrate the frequency amplitude versus distance from the quartz resonator surface (yellow), where fr: resonant frequency, fm: frequency of rigid mass, fl: frequency in liquid phase, and fo: frequency of viscoelastic mass. In (a), a depletion can only be seen when the wave leaves the rigid mass (brown) and hits liquid (blue). Due to the viscoelastic mass in (b), the decay length is much shorter and the vibrational wave cannot penetrate the entire mass (decay length typically 250 nm [8]).

Figure 2.
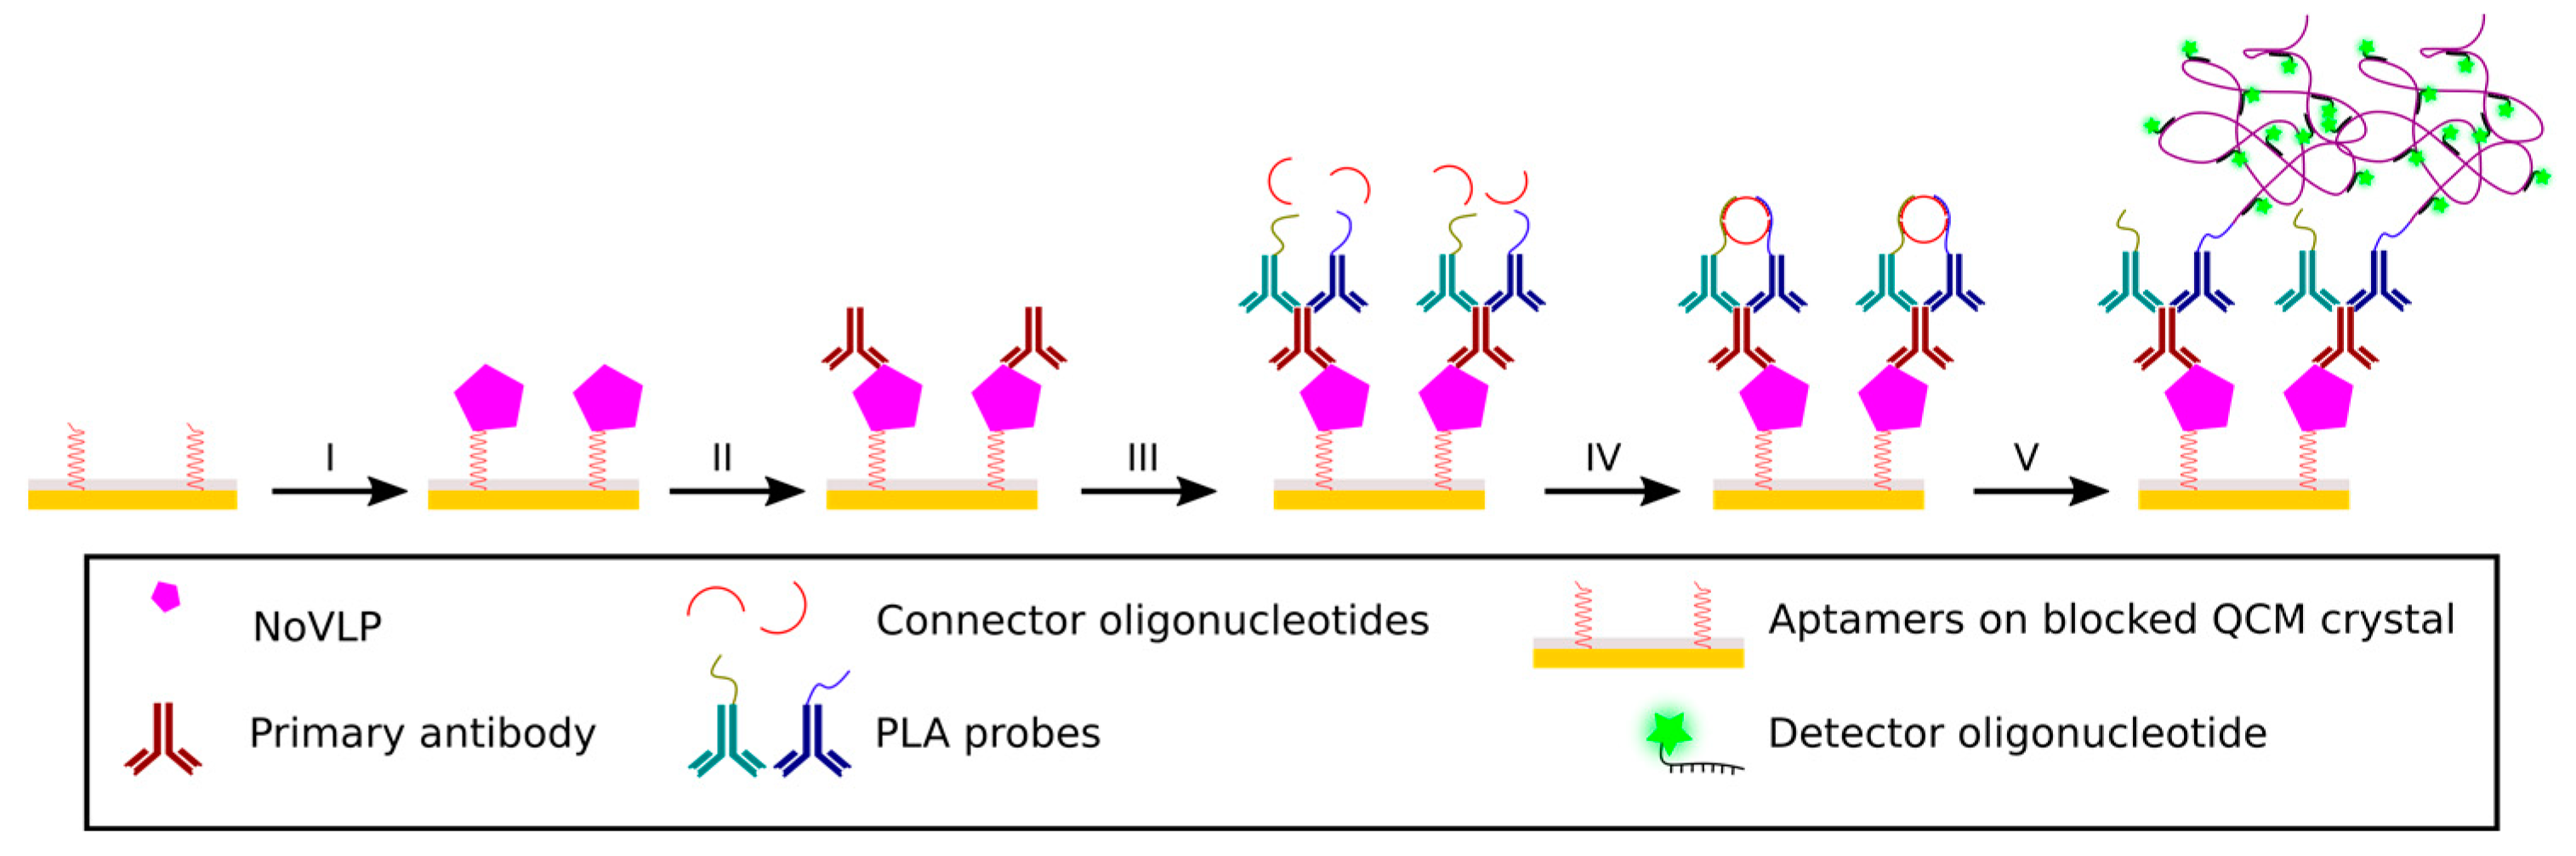
Principle of the sandwich-type PLA. An aptamer-based capture of NoVLPs on QCM surface (I—aptamer functionalization & blocking), followed by binding of mouse monoclonal antibodies (II—primary Ab) and anti-mouse antibodies conjugated to short oligonucleotides (III—PLA probes) form the basis of assay design. Only when the PLA probes are in close proximity (IV—ligation), amplification occurs and thus, signal generated (V—amplification) [5].
Figure 2.
Principle of the sandwich-type PLA. An aptamer-based capture of NoVLPs on QCM surface (I—aptamer functionalization & blocking), followed by binding of mouse monoclonal antibodies (II—primary Ab) and anti-mouse antibodies conjugated to short oligonucleotides (III—PLA probes) form the basis of assay design. Only when the PLA probes are in close proximity (IV—ligation), amplification occurs and thus, signal generated (V—amplification) [5].

Figure 3.
Sensograms of sandwich-type PLA in continuous flow. The inset figures depict the actual assay step, corresponding to the sensogram part. I—aptamer functionalization & blocking, II—NoVLPs or PBS, III—primary Ab, IV—PLA probes & ligation, and V—amplification. (a) Sensogram of the assay with 4.7 nM NoVLPs in order to perform the sandwich PLA to achieve bulky RCPs; (b) Sensogram of the assay without introducing any NoVLPs into the system (negative control with PBS).

Publisher’s Note: MDPI stays neutral with regard to jurisdictional claims in published maps and institutional affiliations. |
© 2017 by the authors. Licensee MDPI, Basel, Switzerland. This article is an open access article distributed under the terms and conditions of the Creative Commons Attribution (CC BY) license (https://creativecommons.org/licenses/by/4.0/).
Share and Cite
MDPI and ACS Style
Madaboosi, N.; Neumann, F.; Hernández-Neuta, I.; Salas, J.; Mecea, V.; Nilsson, M. Real-Time QCM Measurements of Rolling Circle Amplification Products. Proceedings 2017, 1, 509. https://doi.org/10.3390/proceedings1040509
AMA Style
Madaboosi N, Neumann F, Hernández-Neuta I, Salas J, Mecea V, Nilsson M. Real-Time QCM Measurements of Rolling Circle Amplification Products. Proceedings. 2017; 1(4):509. https://doi.org/10.3390/proceedings1040509
Chicago/Turabian StyleMadaboosi, Narayanan, Felix Neumann, Iván Hernández-Neuta, Jeanpierre Salas, Vasile Mecea, and Mats Nilsson. 2017. "Real-Time QCM Measurements of Rolling Circle Amplification Products" Proceedings 1, no. 4: 509. https://doi.org/10.3390/proceedings1040509