Proceeding Paper

The Porous–Permeable Zones in Heterogeneous Carbonate Reservoirs: A Case Study from Amara Oilfield, Iraq †

by
Namam M. Salih
1,*,
Shireen Mansour Al-Majmaie
1 and
Zana Abdulla Muhammad
2
1
Petroleum Engineering Department, Engineering Faculty, Soran University, Soran 44008, Iraq
2
APEX Refinery, Refinery Unit Operator, Erbil 44001, Iraq
*
Author to whom correspondence should be addressed.
Presented at the 4th International Electronic Conference on Geosciences, 1–15 December 2022; Available online: https://sciforum.net/event/IECG2022.
Proceedings 2023, 87(1), 35; https://doi.org/10.3390/IECG2022-13965
Published: 2 February 2023
(This article belongs to the Proceedings of The 4th International Electronic Conference on Geosciences)

Abstract

:
The nature of carbonate rock’s heterogeneity under subsurface conditions is still under debate due to significant variations in mineral composition and changes in rock texture during/after diagenesis. However, several studies have utilized facies analysis and conventional sets of logs to develop a detailed description of reservoir rocks. This paper presents the design of a precise model for cretaceous carbonate reservoir characterization through micro and macro porous media and permeable zones and integrates lithological variation with more than 1800 measurements of porosity/permeability values along two bore wells in Amara Oilfield. This paper presents a detailed description of lithological and reservoir characterization in the Am1 and Am3 borewells form west to east, respectively. In the west, plugged samples were obtained from Mishrif formations, while in the east, the samples were obtained from the Khasib, Mishrif, and Yamama formations. The porosity and permeability distribution in the subsurface settings was divided into three porous–permeable zones in Am1 and Am3. Am1 in the west shows a greater porous–permeable zone than Am3 in the east of Amara Oilfield. The permeability and porosity in Am1 measured up to 591 md and 29.6%, while in Am3, values up to 352 md and 24.2% were recorded, respectively. Therefore, the porous–permeable subsurface distributions and their petrophysical mapping for different kinds of reservoirs reveal that the porosity and permeability measurements decreased from west to east; however, there were a few fluctuations corresponding to increases and decreases in the porosity and permeability values that were mostly controlled by the involvement of diagenetic fluids, which were resulted from the heterogeneity of carbonate rocks.

1. Introduction

Porosity and Permeability are two of the important quality factors that govern fluid transport and storage. Several scholars have studied the petrophysical parameters of sedimentary rocks and the correlations between different kinds of sections (e.g., [1]). Pore size distribution, permeability, and mercury intrusion porosity have all been determined, and the bulk and particle densities of rocks have also been calculated. Porosity and permeability are strongly associated in a direct proportional connection, i.e., as porosity grows, so does permeability; other rock features, such as the number of open and closed pores in a sample and pore size and distribution, impact this connection [2]. Therefore, to investigate the petrophysical features of sedimentary rocks, a comprehensive examination of rocks and their potential use in engineering structures and the restoration of ancient monuments is required [2]. Understanding the porosity–permeability relationship is crucial subject to estimate reservoir behavior and determine the nature of decomposition [1]. Several factors affect porosity and permeability, including grain size, packing, compaction, and solution/dissolution processes, which can increase the differences or similarities between porosity and permeability [3]. Dolomite and limestone are the main components of carbonate rocks, and they contain different amounts of impurities and an Mg-rich/-poor composition [4]; these compositional differences will impact the petrophysical properties of carbonate rocks [5]. Authors have added that there is a wide range of vertical and horizontal heterogeneity in carbonate reservoirs because of the effect of minerals’ dissolution and replacement by other minerals and other factors such as recrystallization after deposition [4].
The heterogeneity of carbonate rocks is associated with hydrothermal/hot fluids under subsurface conditions, renders systems more complicated and causes them to mainly produce significant vugs and zebra-like textures (e.g., [4,6]). Thus, the porosity–permeability relationship in the South German Molasse Basin’s carbonate reservoir has shown a wide range of porosity (0.3% to 19.2%) and permeability (10−4 to 102 md, millidarcy), thus indicating the great heterogeneity of carbonate reservoir [7]. The heterogeneity of a carbonate reservoir is the critical factor in estimating porosity and permeability, especially where there is a significant number of fractures or vugy pores within the recent subsurface sections. A new empirical model has been used to facilitate permeability estimation with an uncertainty value up to 10 md based on different types of lithofacies; thus, permeability has been technically difficult to estimate because of the lack of relevant data with respect to, for example, mud-supported limestone, which has microscopic permeability that can negatively impact permeability, if compared to porosity [7].
Therefore, the current work will compare the porosity and permeability of two oil wells (1 and 3) within three subsurface formations from the Amara oilfield (Figure 1) and link the petrophysical parameters to micro-scalic observations in order to ascertain how the alteration of carbonate reservoirs influences these parameters. Finally, a conceptual model will be used to illustrate the porosity–permeability relationship with respect to depth and lithofacies changes vertically and horizontally (from west to east).

2. Method and Materials

The rock plugs (samples) were cut to a size of 1.1 to 2 inches and then washed using chloroform to remove the hydrocarbons that were originally present in the rock voids. For this purpose, a Soxhlet extractor was used to dry the samples in an oven at a temperature of 70 °C for a period of no less than six hours in order to prepare them for measurement. Helium porosity was measured for all the plugs, and the following equation was used for all measurements:
Φ = V p × 100 V p + V g
where Φ = porosity, Vp = volume of porosity, and Vg = volume of grains
A micro-permeameter was utilized to measure the entirety of the plugs and later to determine Klinkenberg-corrected permeability (see Tables S1 and S2 in the Supplementary). In addition, the following equation was used to calculate air permeability
K a = 2000 U P 1 2 P 2 2 × P a   Q L A
where K = air permeability (md), Pa = atm pressure (atm), P1 = in let pressure (atm), P2 = out let pressure (atm), U = Gas viscousity (CP.), L = Length (cm), A = cross sectional area (cm2), and Q = gas flowrate CC/Se.
The measured data were analyzed using sophisticated software in order to develop for the first-ever mapping distribution of the reservoir properties in the vertical (concerning burial depth) and spatial directions (from west to east). Surfer program was used to render the three-dimensional figures and contour map illustrating the porous–permeable zones, while the Grapher program was used to display the data as a group of populated data. In addition, the MATLAB program was utilized to draw the plots in 2D and 3D.

3. Results

The porosity and permeability of more than 900 core samples were analyzed in two wells (Am1 and Am3) in the Yamama, Mishrif, and Khasib formations in the Amara oilfield in Iraq (for details see Tables S1 and S2). Although depth controls the porosity and permeability parameters, the heterogeneity composition of carbonate rock must also be considered in addition to fractures and vugs and whether they were filled with cement. Regarding Am1 (see Table S1), the porosity and permeability were measured for 430 samples at every 50 cm thickness of the following formations:
  • Mishrif Formation (2880–3271) m: The upper part of this formation consists of limestone with a white to grey coloration that contains fractures and vugs and some types of stylolites with broken shells of some fossils, while the lower part is characterized by a semi-brown limestone that contains a fragment of fossilized shells such as foraminifera.
Regarding Am3 (see Table S2), the porosity and permeability of 495 samples were measured in every 50 cm thickness of the following formations:
  • Khasib Formation (2852.1–2908.2) m;
  • Mishrif Formation (2920.1–2999.8) m;
  • Yamama Formation (4404.3–4404.3) m.
The measurements of the samples from Am1 represent three porous–permeable zones: the first porous–permeable zone is located between 2880 and 2911 m, the second porous–permeable zone is distributed at a depth of 2920 to 3012 m, and the third porous–permeable zone is located between 3030 and 3067 m. The highest amount of permeability was recorded at the first porous–permeable zone (591 md, millidarcy), while the highest and most populated porosity was concentrated in the second zone followed by the third zone. The measurements of the Am3 well samples in all three formations (the Khasib, Mishrif, and Yamam formations) also concern three porous–permeable zones. The Am1 and Am3 reservoir core samples were characterized by different carbonate textures and compositions. Generally, they were composed of limestone and dolomitic limestone, while the color of the carbonate rocks ranged from dark to grey. The diagenetic process left traces of large vugs/open spaces and fractures; in places, the compacted grains of carbonate rocks—both limestone and dolomite—were present in the reservoir carbonate core samples.

4. Discussion

Several researchers have studied reservoir characterization using facies analysis through sets of well logs plots (Figure 2), with the corresponding well log data including gamma ray, sonic, neutron, and bulk density data [8]. However, the use of well logs alone is insufficient for determining complex porosity–permeability systems under subsurface conditions. The high-resolution observation of core rocks, the study of the textural properties of carbonate rocks, and the use of numerical data on porosity–permeability are important methods of mapping the reservoir properties and porous media from micro- to macro-scale zones and tracking the heterogeneity of carbonate reservoir in shallow and deep burial settings in two- and three-dimensional forms. Therefore, this paper used around 860 and 990 porosity and permeability measurements taken from Am1 and Am3, respectively. These data, taken from three formations and two subsurface wells, were analyzed to scan and understand the mapping distribution regarding porosity–permeability under subsurface conditions. The data ranged from 1.8 to 29.6% for porosity in Am1 and 0.5 to 24.2% for porosity in Am3 and from 0 to 591 md for permeability in Am1 and 0 to 352 md for permeability in Am3 from west to east borewells in the Amara Oilfield (Figure 2 and Figure 3).
The populations of porosity—permeability measurements are grouped into three porous–permeable zones in both wells (Am1 and Am3; see Figure 3 and Figure 4). All the porosity–permeability measurements in Am1 correspond to the Mishrif Formation, while those in Am3 correspond to the Khasib, Mishrif, and Yamama Formations. The highest porous–permeable zone (Zone I) in Am1 is located between 2880 and 2920 m. The highest amounts of permeability and porosity in Zone I are 591 md and 26.9%, respectively, whereas values of 0 md and 2.2% were recorded as the lowest values in Zone II and Zone III. The higher values of porosity and permeability in Zone I could be linked to dissolution and opening of the system, which are characterized by the dominant presence of vugs and pore spaces in the carbonate rock. The frequent appearance of vugs and open spaces has been reported in NE Iraq within Cretaceous reservoir rocks due to the dissolution of hot fluids in subsurface and surface settings [4,6]. However, in places, the porosity and permeability measurements did not follow the same trends, which was most likely due to the complicated system of the carbonate rocks under subsurface conditions.
The second porous–permeable zone ranged between 12–20% and up to 80 md. The porosity and permeability in this zone are greater than those in the first and third zones. Thus, the significant variation in porous media is not related to the burial depth of the boreholes. Mechanical compaction under subsurface conditions is probably the main reason behind this decrease in the permeability value; again, the occasional actions of complex opening and closing systems are also possible reasons [4]. This type of compaction usually occurs under low mechanical stress and is controlled by the mineralogy of sedimentary rocks. The populated values in Zone III correspond to core sample values from deeper zones than Zones I and II. The mean value of porosity in Zone III is lower than that in Zone II; however, the geothermal gradient and pressure should increase the prevalence of porous media.
Optical and experimental observations have revealed that fluid–rock interactions are the main processes decreasing permeability in carbonates [8]. The highest values of porosity (29.6%) and permeability (591 md) were found at 2957.82 and 2893.87 m, respectively. On the other hand, the lowest values of porosity and permeability (~0 md) were recorded at a deeper burial zone (Zone III). These variations could be connected to the complicated carbonate system, wherein packing, dissolution, compaction, and cementation play the main roles in this regard.
The main characteristics of and reasons for the heterogeneity of the Khasib Formation have been reported in [9]. In this study, it was determined that the best oil-bearing zones showed a porosity value of up to 21% based on neutron logs, and the reservoir characterization of the Khasib Formation, and was determined via lateral and vertical facies changes, which are sensitive to reservoir characterizations. Such studies have been helpful for our study, but the petrophysical, in addition to the huge numerical measurements presented in this paper provided better mapping for understanding subsurface reservoir characterizations and establishing a conceptual model consisting of micro- to macro-scale mapping throughout the Amara Oilfield (Figure 5 and Figure 6).
In well Am3, porous–permeable values once again populated the three zones (Figure 4), with the highest populated values grouped in Zones II and III. These zones mostly represented the lower part of the Mishrif Formation and the Yamama Formation. The lowest values corresponded to Zone I, which was mostly represented by Khasib Formation samples.
In the Khasib Formation, the first porous–permeable zone is located between 2850 and 2870 m. The highest and lowest porosity measurements varied from (15 to 22.8%) and (8.8 to 15%), respectively, while permeability ranged between 0 and 2.5%. The second porous–permeable region started at 2899 m and ended at 2907 m. The highest and lowest porosity and permeability ranges were 2.2 to 23.8% and 0 to 3.5, respectively. A comparison of the porosity values in the Khasib Formation to those of the Mishrif and Yamama formations demonstrates that the first formation has the most porous zone. The increase in the amount of the porous zone is probably related to the less compacted grains within the sedimentary rocks. However, the permeability values are lower compared to this porous zone. The effective porous zone could be linked to the secondary characteristics of the reservoir rocks (e.g., packing, grain distribution, and the shape of the grain). In carbonate rocks, the main reservoir patterns of the pores are inter-particle, intra-particle, and moldic pores. Lacking effective porosity and pore throats, moldic pores reduce permeability values [10].
In the Mishrif Formation, there was a considerably wide range of porosity and permeability. Comparing the permeability measurements taken in the Mishrif formation to those from Khasib, the latter reported higher values. Through the dissolution and alternation of carbonate rocks, these values could be the main reason behind this increase in permeability values. Similar cases have been reported in [8,10,11].
According to the burial depth of the current analysis’s samples, Zone I was contained within the Yamama Formation, starting at 4404 and 4419 m and ending at a depth of 4494 and 4599 m. Both the highest (up to 350 md) and lowest permeability values were recorded in Zone I. With increasing depth, the porosity and permeably increase, especially at a depth of 4534.62 m, where the highest value of porosity was as much as 24.2% and that of permeability was as much 352 md and where carbonate rock was significantly exposed to alteration and diagenesis; however, the lowest values of porosity and permeability were identified at this maximum depth (0.5% and 0 md), where the rocks are more compacted. These two significant differences in porosity and permeability values suggest that the lithology in Am1 and Am2 is the main contributory factor controlling the lowest and highest distribution values of reservoir characterization among the other factors (Figure 7). Figure 7 presents the 3D distribution model used to track the potential reservoir rocks in vertical (burial) and spatial directions (from west to east).

5. Conclusions and Recommendations

This study integrated lithological data and measurements of more than 1800 values that were obtained from porosity and permeability plug samples, resulting in the following findings:
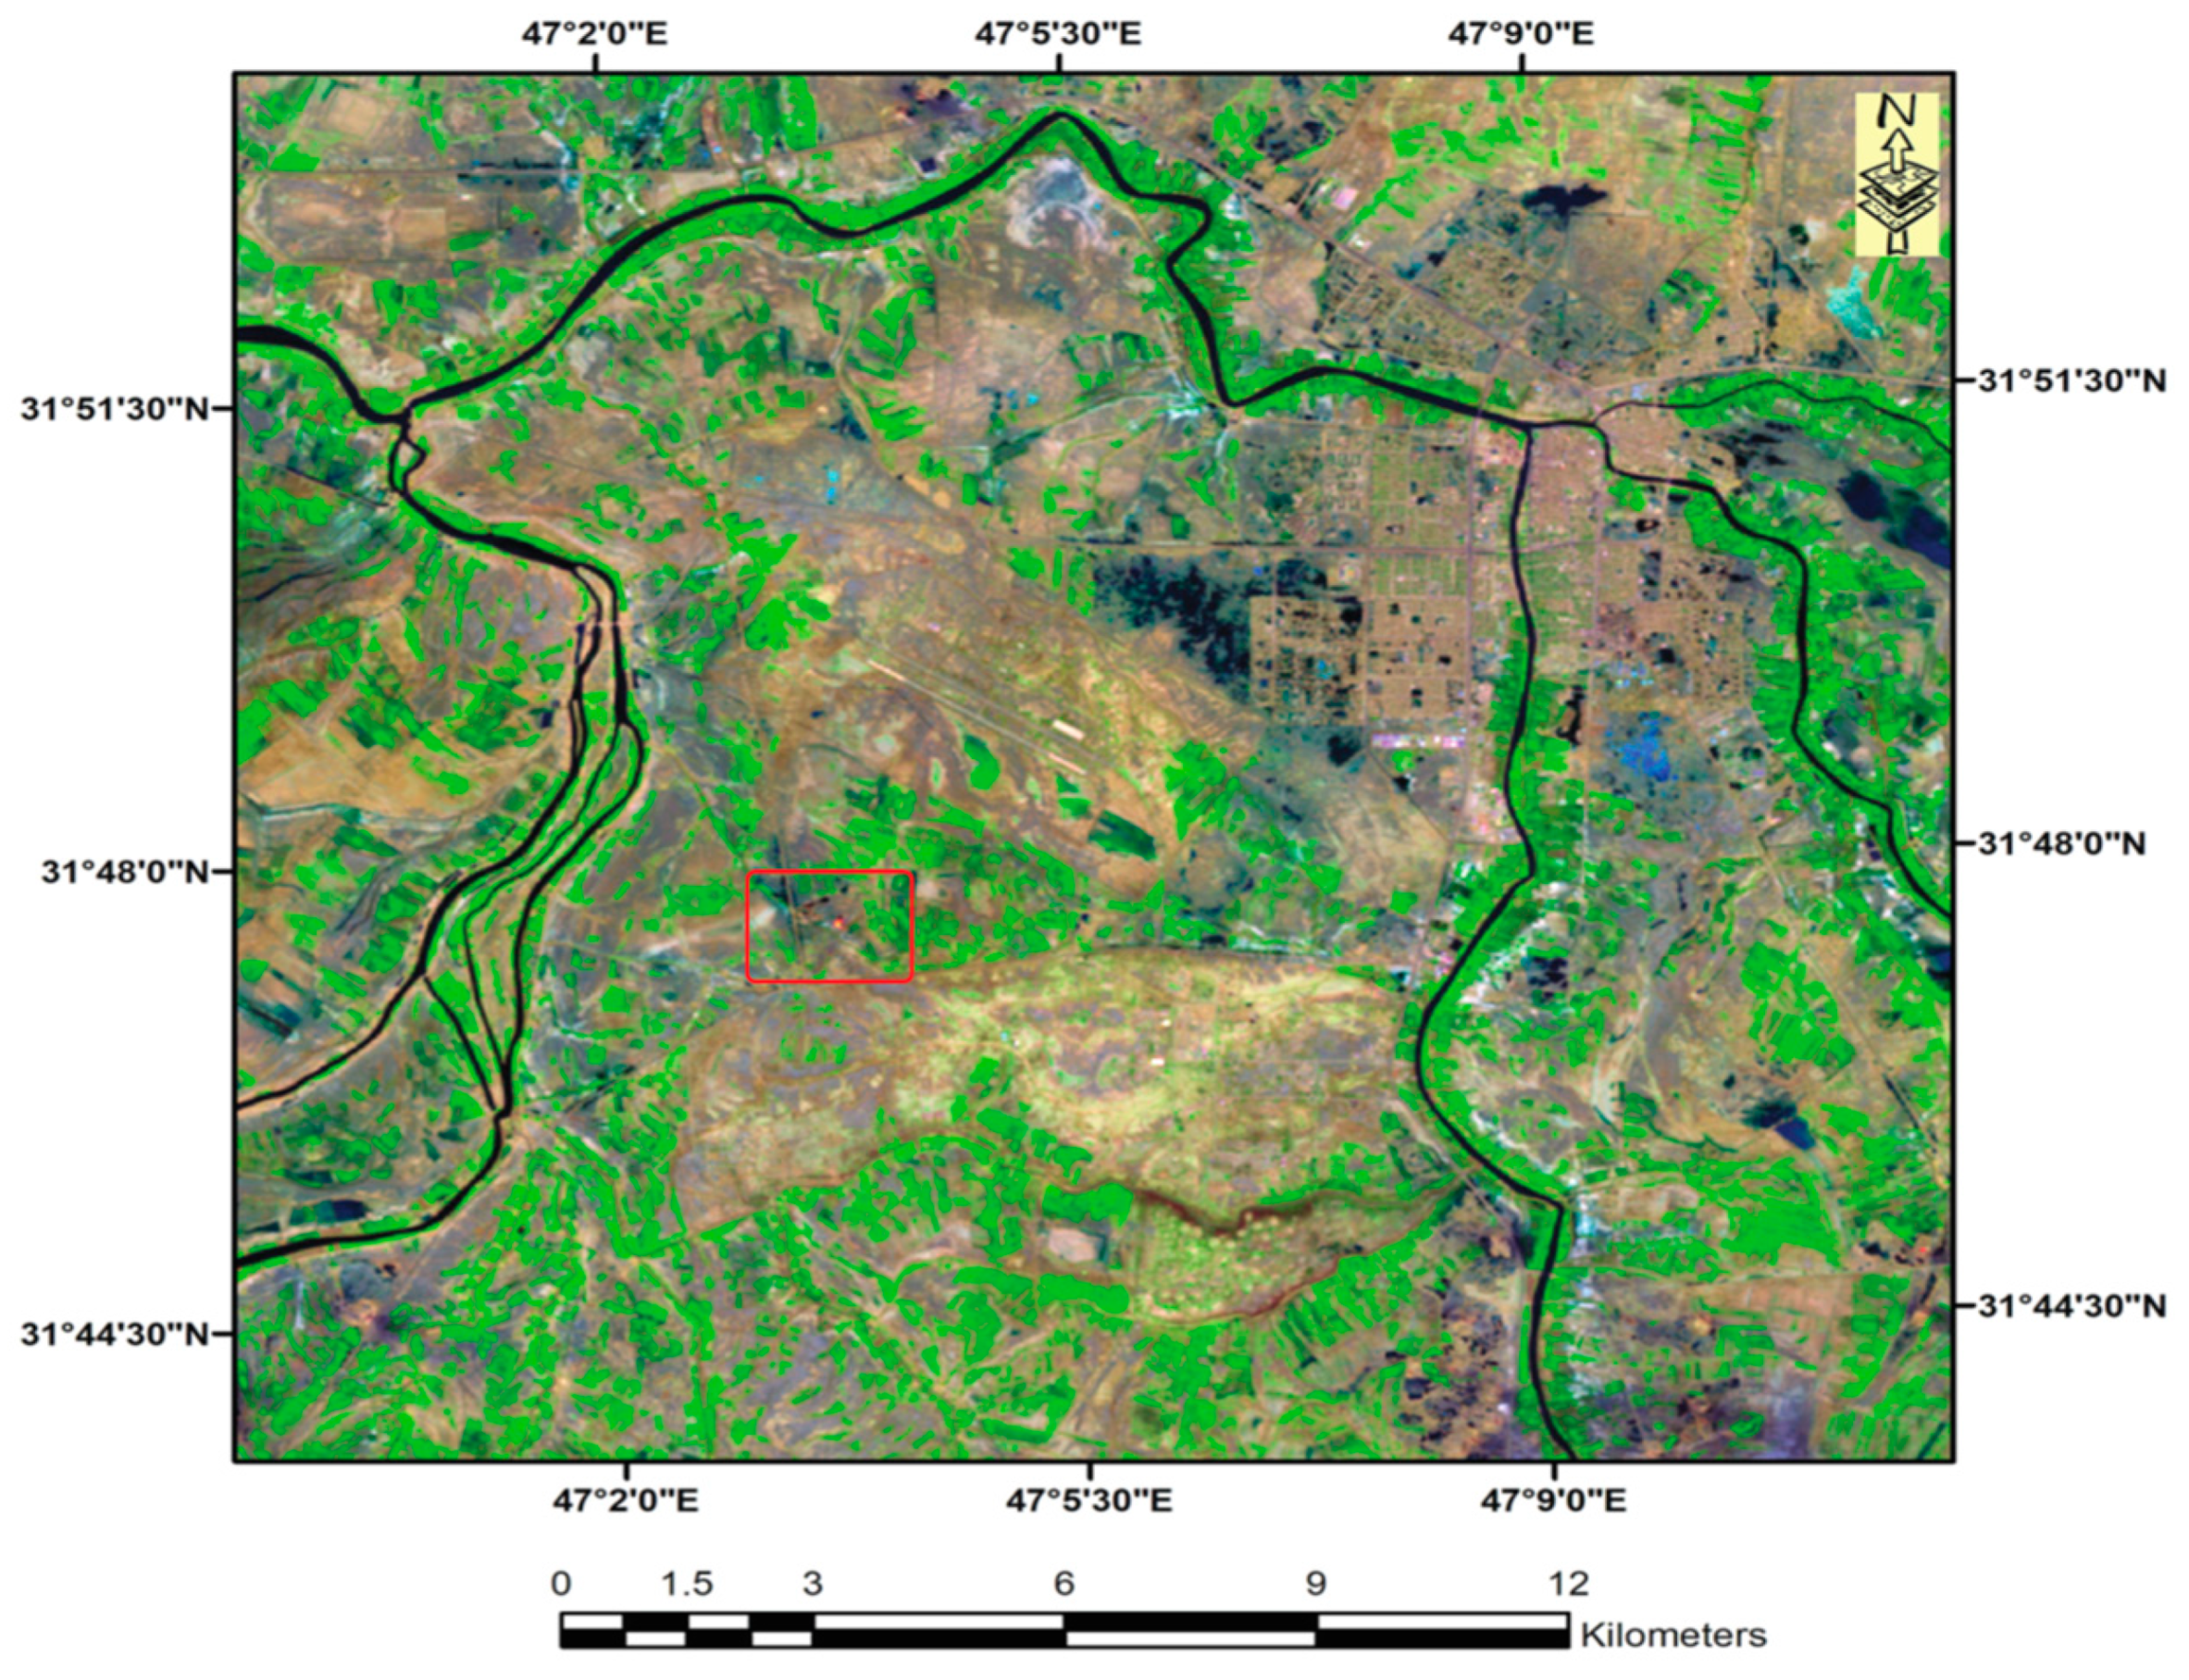
  • The two borewells from the Amara oilfield, Am1 in the west and Am3 in the east, were studied in detail using helium porosity and a micro-permeameter based on the lithology of core samples.
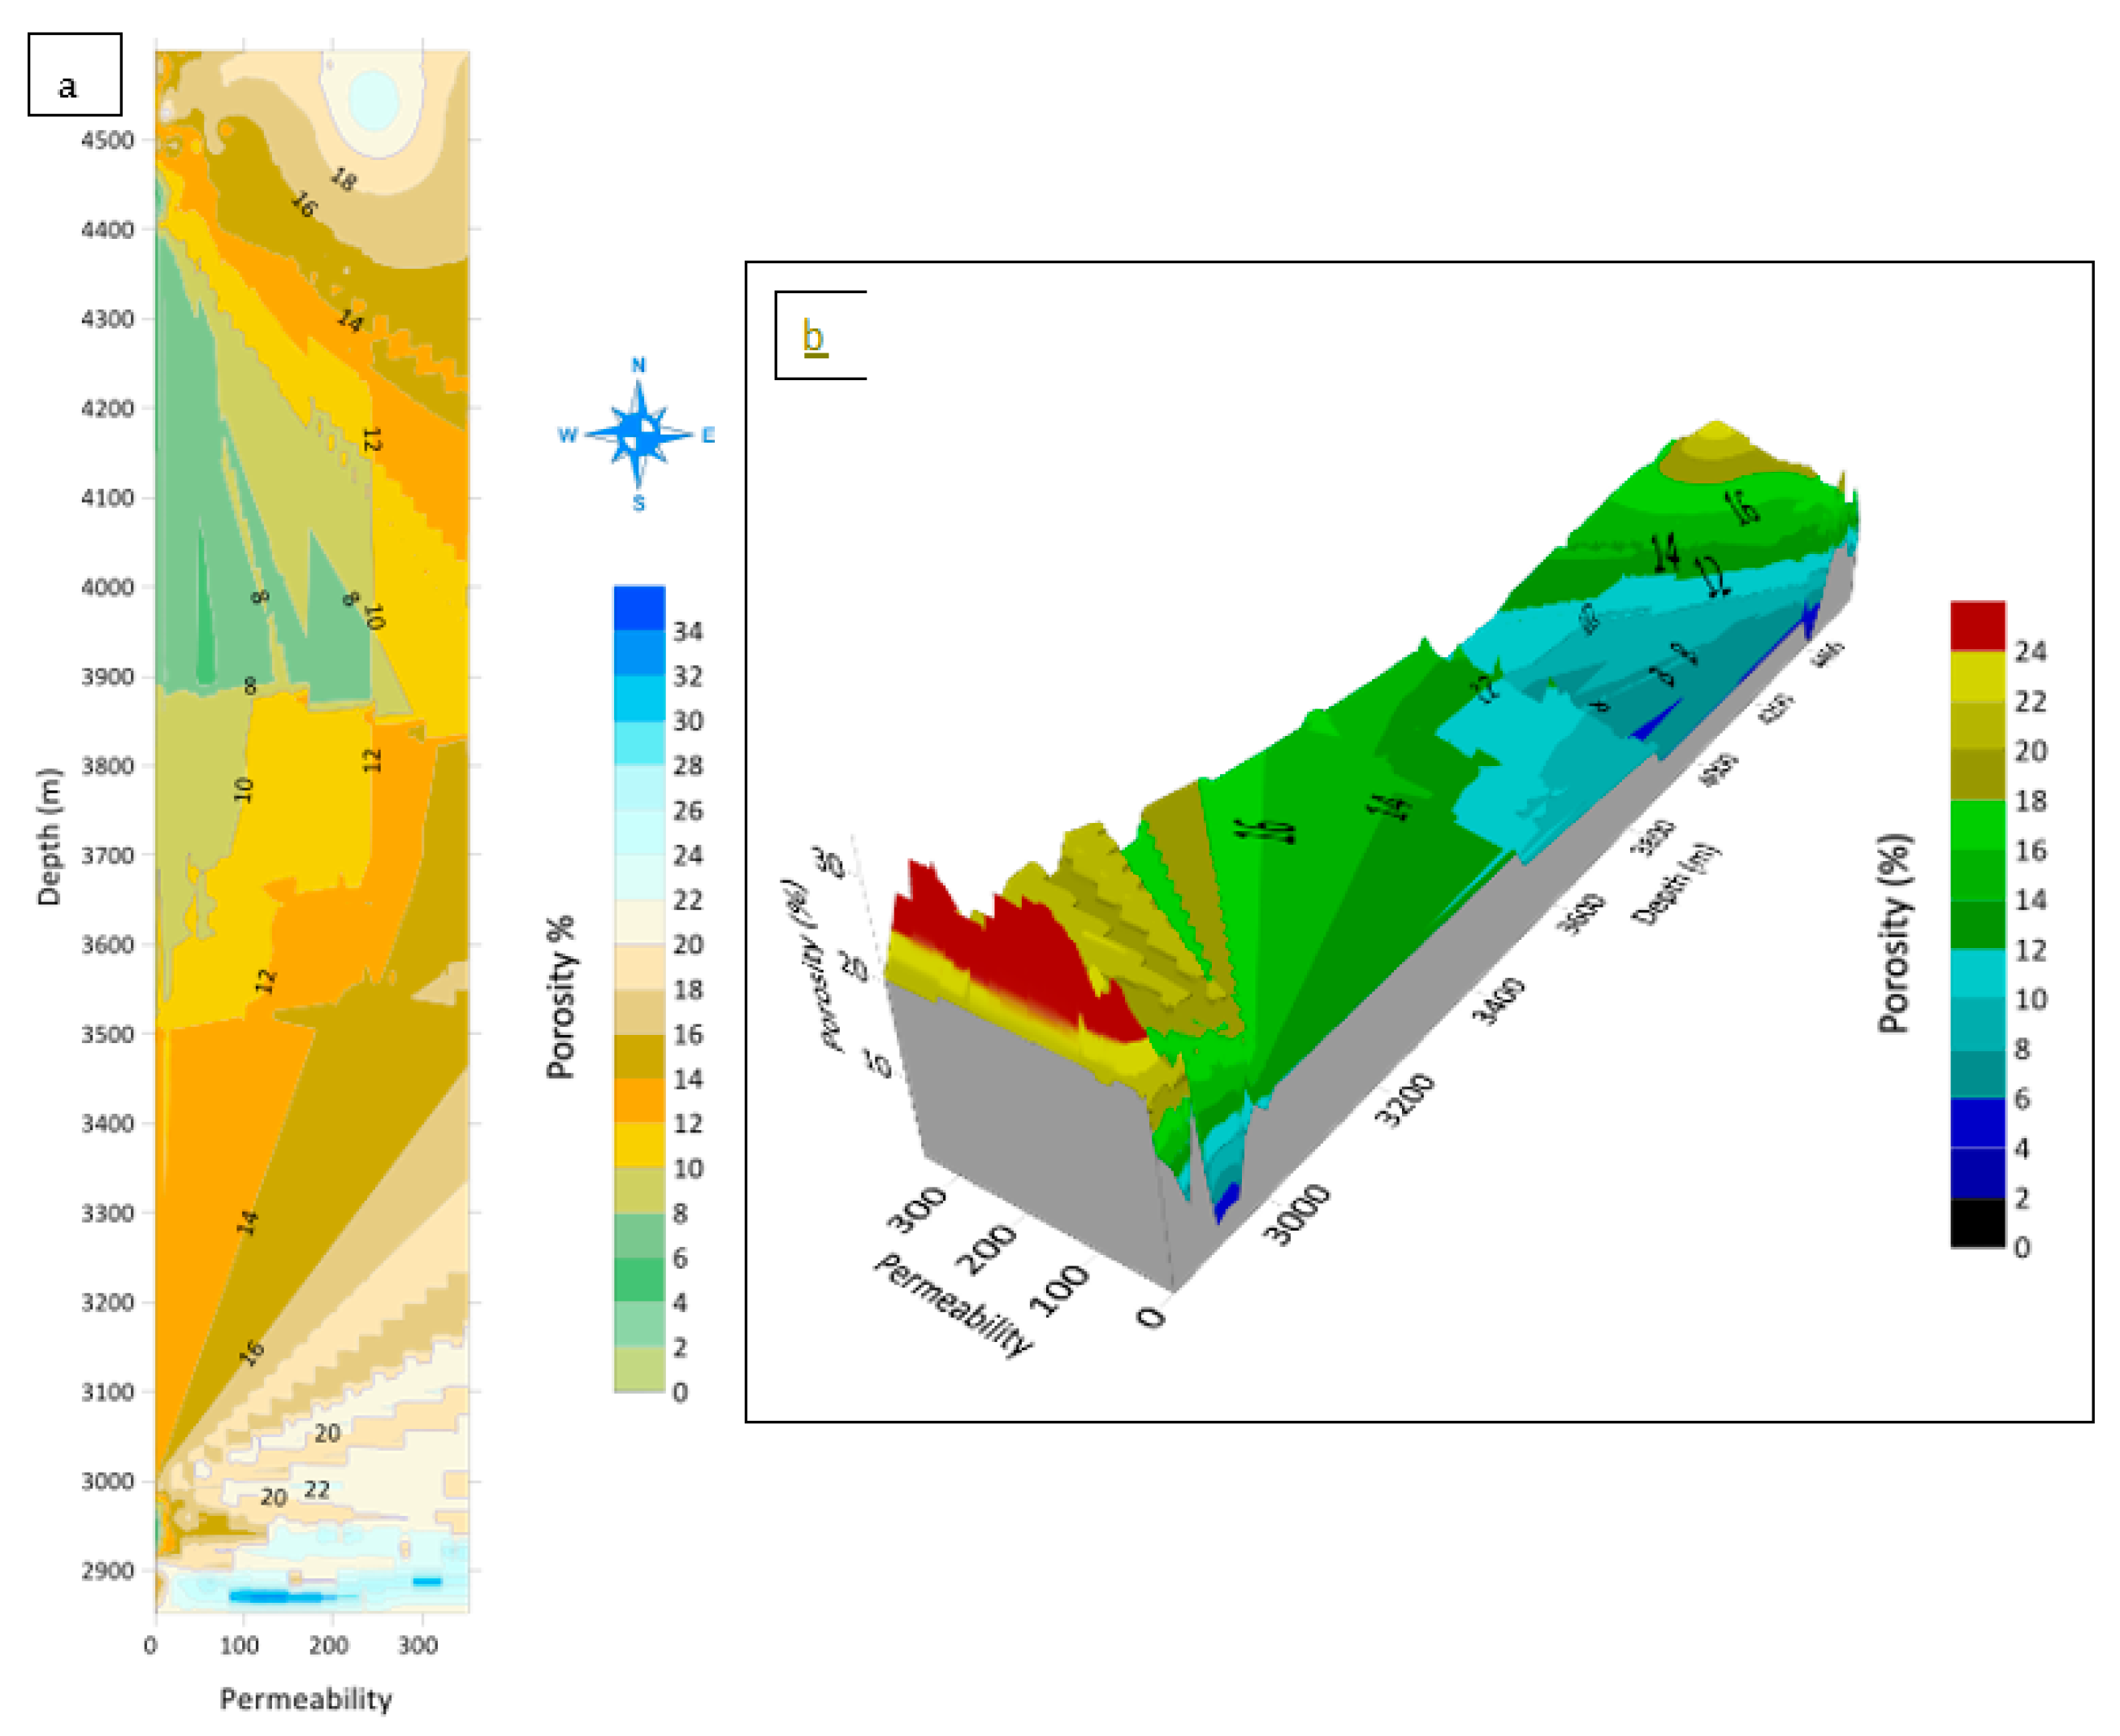
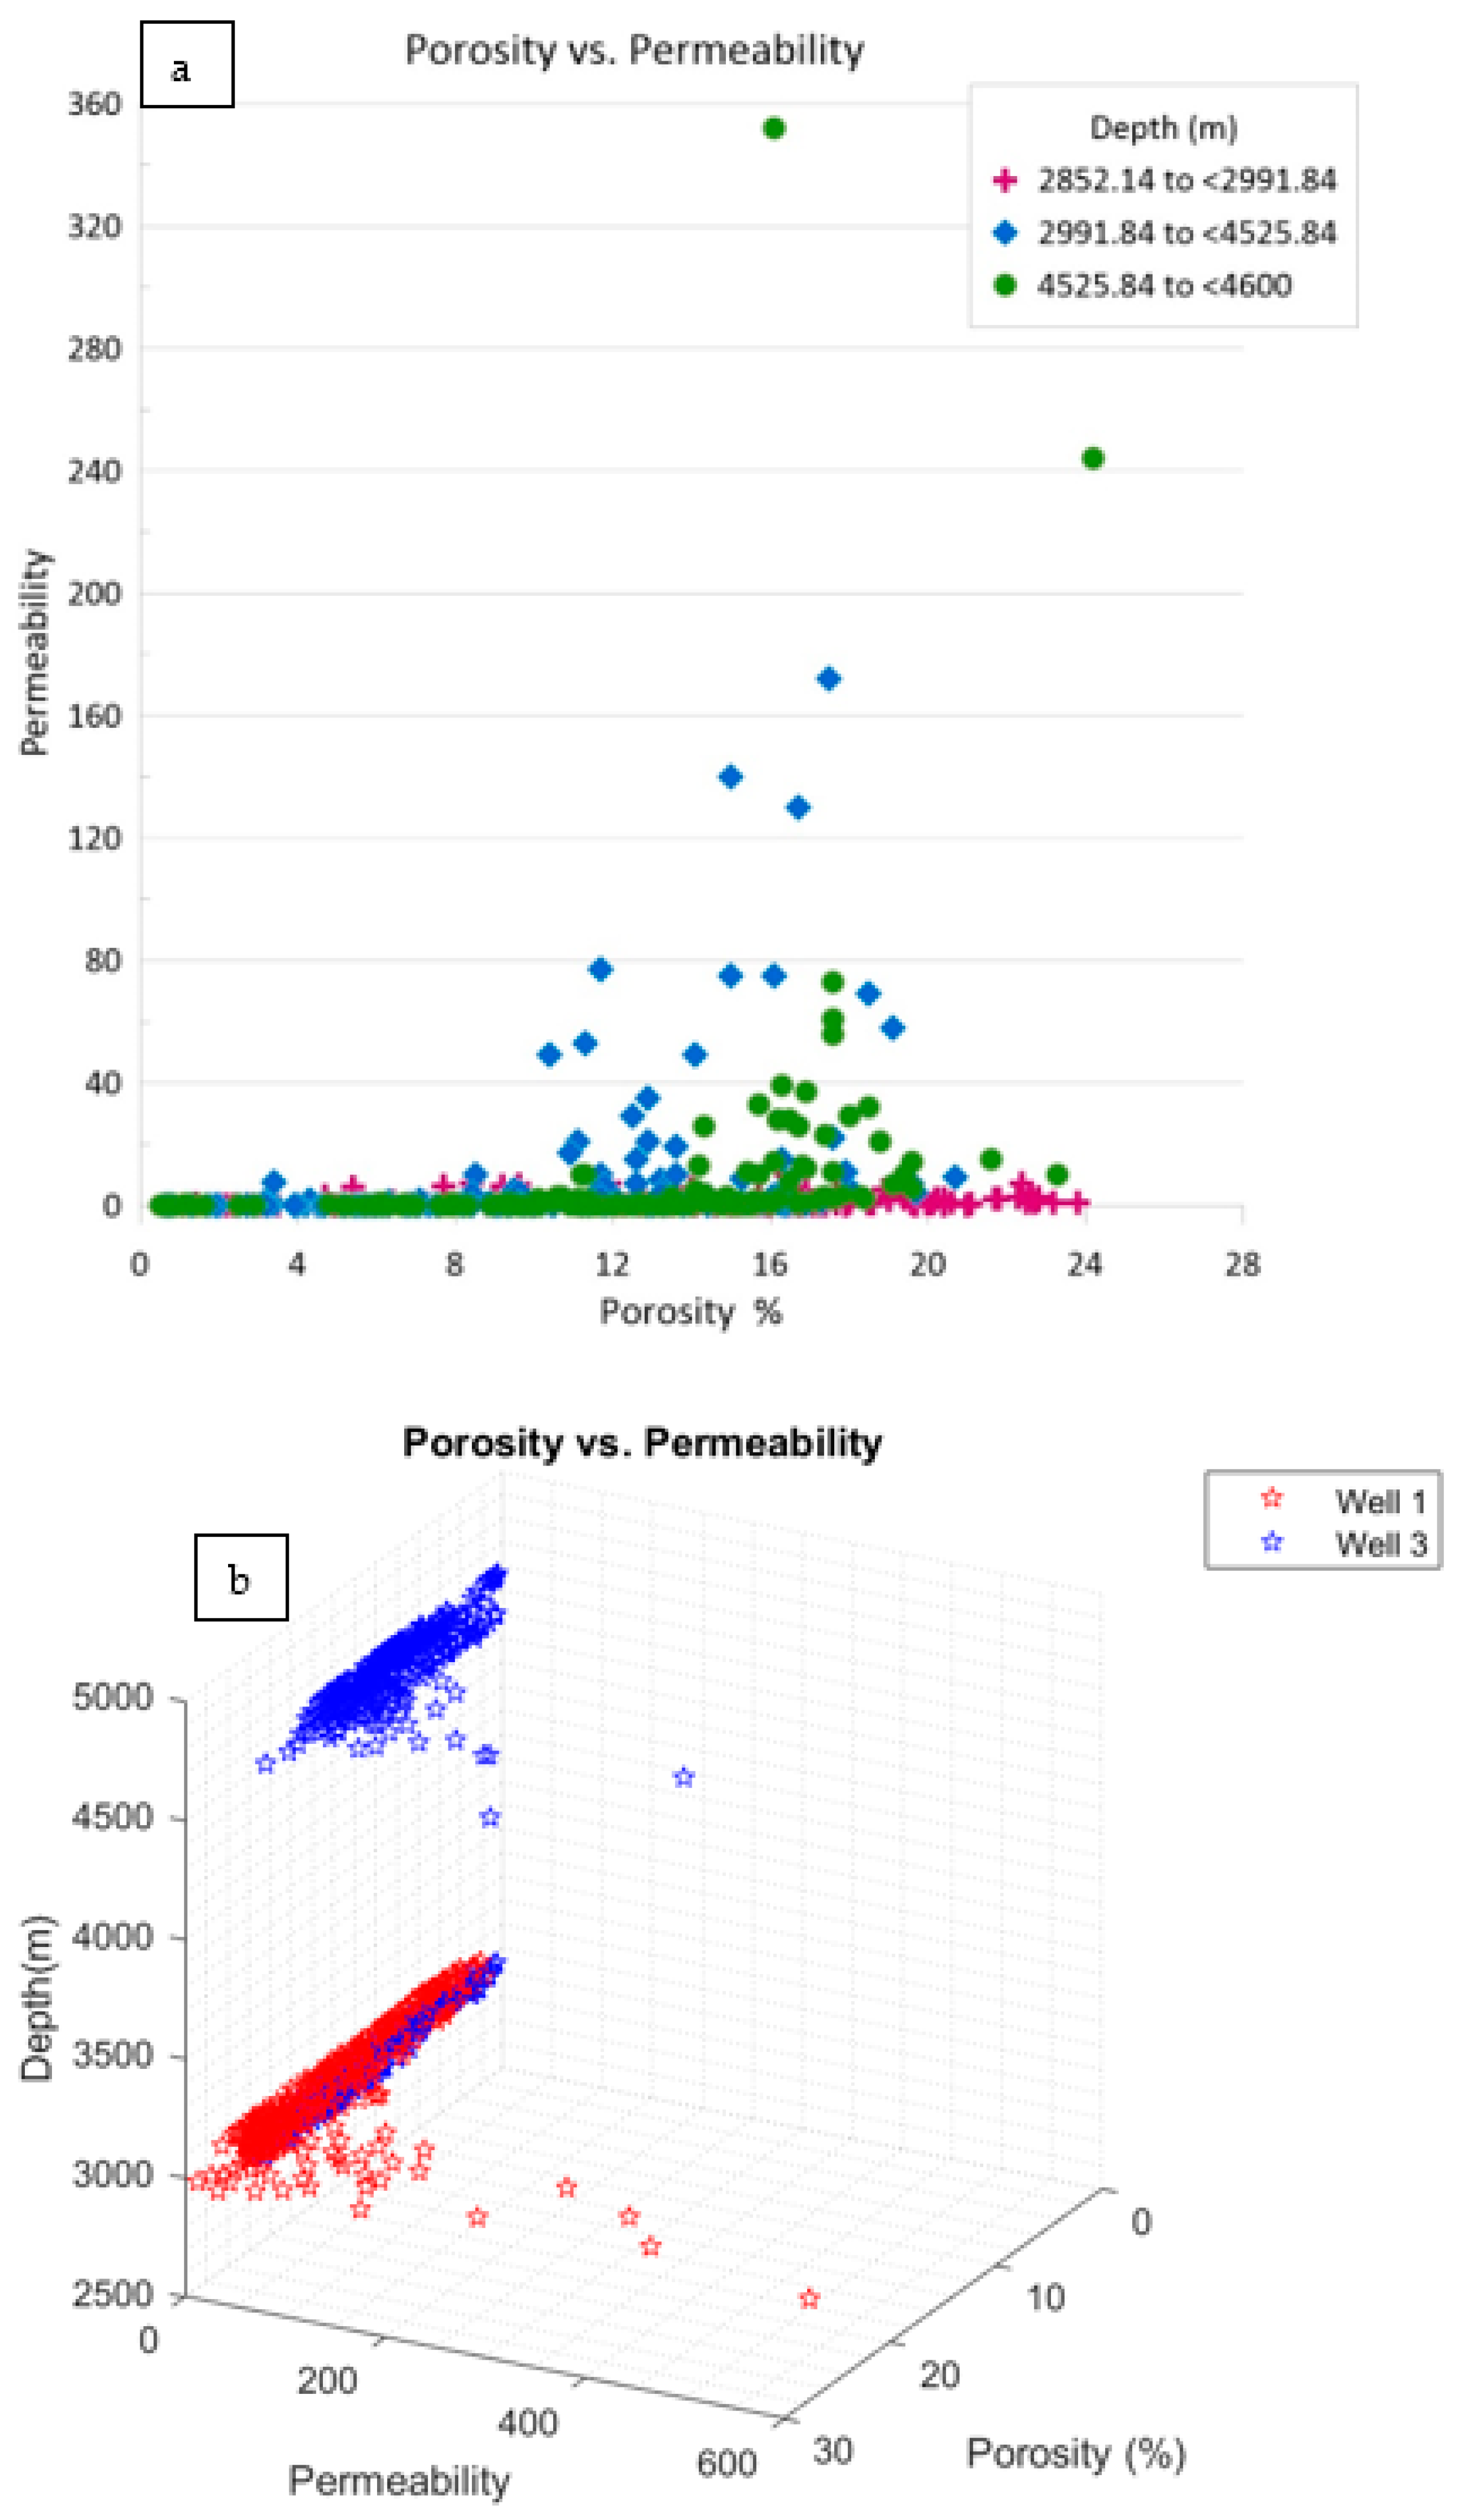
  • More than 1800 measurements of porosity and permeability processed through three software products (Surfer, Grapher, and MATLAB) were used to perform vertical and horizontal reservoir characterization in two- and three-dimensional forms.
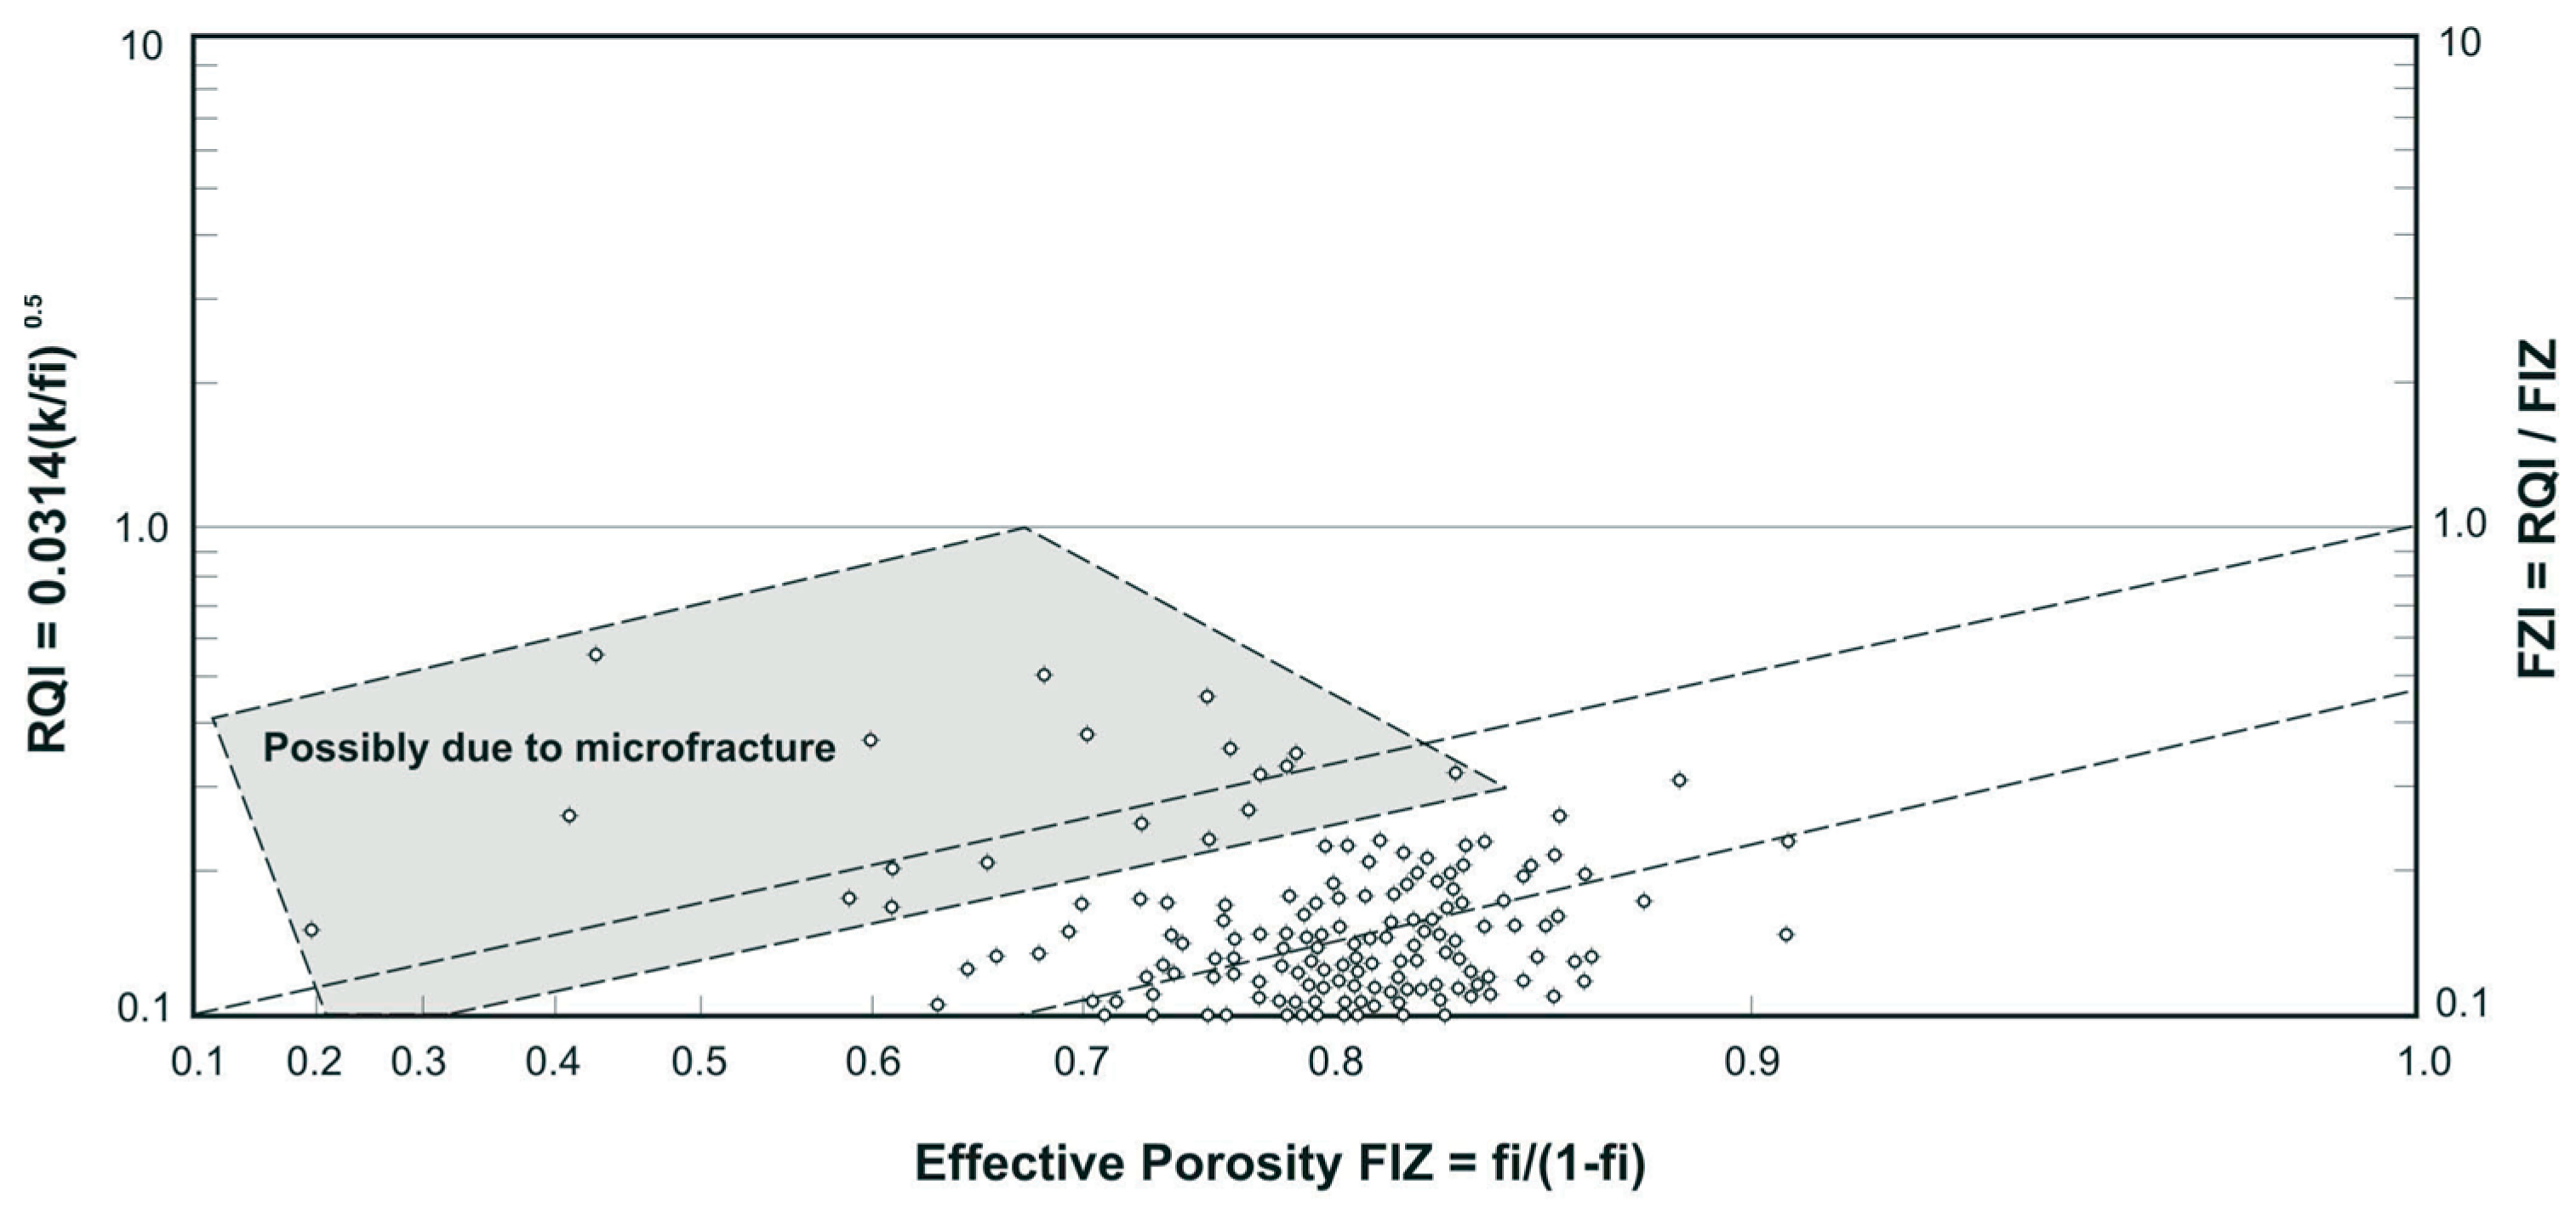
  • The data regarding the porosity–permeability relationship show three porous–permeable zones in Am1 and Am3.
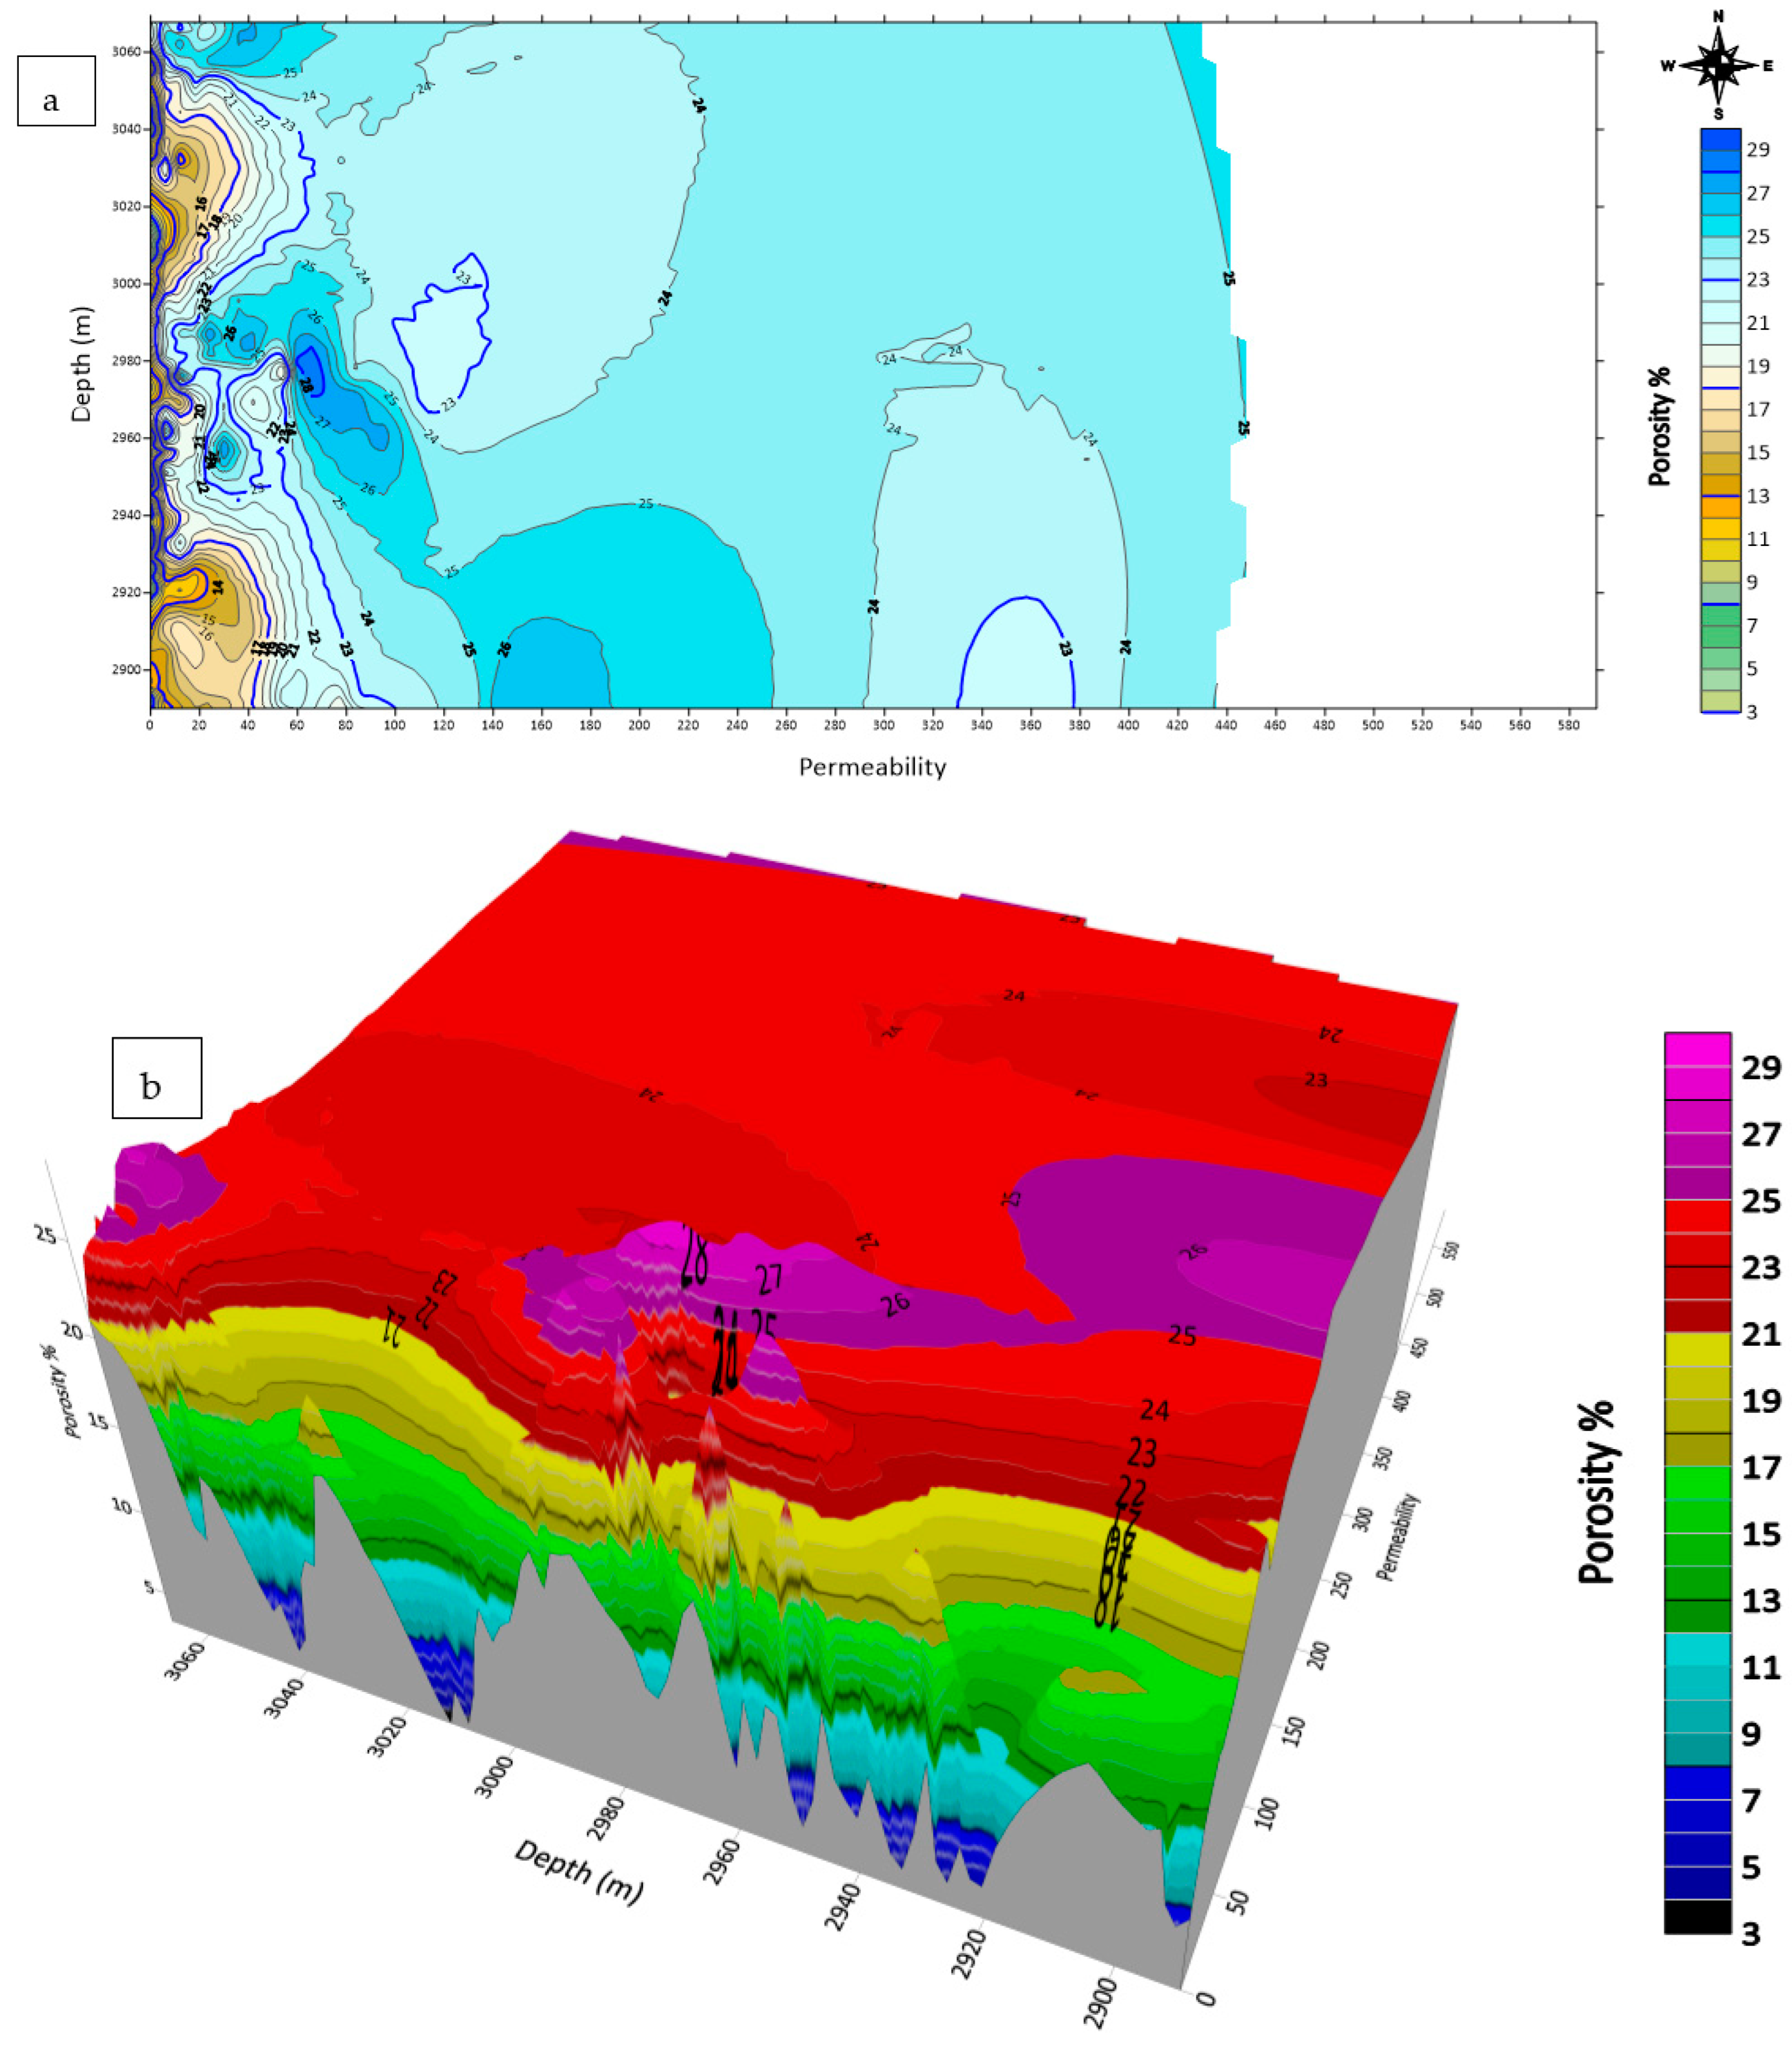
  • The porosity–permeability information from the Am1 data was obtained from the Mishrif Formation, while the porosity–permeability information from the Am3 data was obtained from the Khasib, Mishrif, and Yamama formations.
  • The reservoirs in the studied subsurface wells were significantly dominated by heterogenous carbonate rocks, where the lithologically controlled porosity–permeability zones were the main parameters used to model the reservoir characteristics from the western to eastern regions of the Amara oilfield.
  • The values of porosity (29.6%) and permeability (591 md) in Am1 from the west were higher than those of Am3 from the east (where porosity is as much as 24.2% and permeability as much as 352 md). This finding is linked to dissolution and the opening system due to the extensive prevalence of vugs and pore spaces in carbonate reservoir rocks.
  • The appearance of vugs and open spaces due to dissolution and especially diagenesis are the main reasons for the reductions and increments in the distribution of porous–permeable media under subsurface conditions.
  • The conceptual modelling of the Amara oilfield from east to west based on two- and three-dimensional lattice settings shows that the reservoir characterization and porous–permeable zone in Am1 presented higher porous–permeable values than Am3 in the west of the Amara oilfield. Therefore, the porosity–permeability zones decrease from east to west; however, few fluctuations in the rising and falling of the porosity and permeability values were mostly controlled by a diagenetic open system or the heterogeneity of carbonate rocks in the area.
  • The data reported herein confirm that the use of packages of logs and facies analysis to perform reservoir characterization in the previous studies was insufficient without a detailed study of carbonate heterogeneity using an optical microscope and other laboratory measurements.
  • A recommendation for future studies on subsurface reservoir rock is to develop a higher-resolution model for reservoir characterization by utilizing the most sophisticated and micro-scaled tools, such as SEM, EDX, and ICP-M.

Supplementary Materials

The following supporting information can be downloaded at: https://www.mdpi.com/article/10.3390/IECG2022-13965/s1, Table S1: The detailed results of porosity and permeability in well AM1, in addition to core numbers and depth of each measurement sample; Table S2: The detailed results of porosity and permeability in well AM3, in addition to core numbers and depth of each measurement sample.

Author Contributions

Writing and preparation the original draft, N.M.S.; review and editing, N.M.S.; S.M.A.-M.; Methodology and software, N.M.S., S.M.A.-M. and Z.A.M. All authors have read and agreed to the published version of the manuscript.

Funding

This research received no external funding.

Institutional Review Board Statement

Not applicable.

Informed Consent Statement

Not applicable.

Data Availability Statement

Not applicable.

Conflicts of Interest

The authors declare no conflict of interest.

References

  1. Akbar, M.N.A. New approaches of porosity-permeability estimations and quality factor Q characterization based on sonic velocity, critical porosity, and rock typing. In Proceedings of the SPE Annual Technical Conference and Exhibition. Society of Petroleum Engineers (SPE), Calgary, AB, Canada, 30 September–2 October 2019. [Google Scholar]
  2. Rahmouni, A.; Boulanouar, A.; Sebbani, J. Relationships between porosity and permeability of calcarenite rocks based on laboratory measurements. J. Mater. Environ. Sci. 2014, 5, 931–936. [Google Scholar]
  3. Ma, S.; Morrow, N.R. Relationships between porosity and permeability for porous rocks. In Proceedings of the International symposium of the Society of Core Analysts, Laramie, WY, USA, 8–10 September 1996; pp. 8–10. [Google Scholar]
  4. Salih, N.; Mansurbeg, H.; Kolo, K.; Préat, A. Hydrothermal carbonate mineralization, calcretization, and microbial diagenesis associated with multiple sedimentary phases in the upper cretaceous bekhme formation, Kurdistan region Iraq. Geosciences 2019, 9, 459. [Google Scholar] [CrossRef]
  5. Ehrenberg, S.N.; Eberli, G.P.; Keramati, M.; Moallemi, S.A. Porosity-permeability relationships in interlayered limestone-dolostone reservoirs. Am. Assoc. Pet. Geol. Bull. 2006, 90, 91–114. [Google Scholar] [CrossRef]
  6. Salih, N.; Mansurbeg, H.; Kolo, K.; Gerdes, A.; Préat, A. In situ U-Pb dating of hydrothermal diagenesis in tectonically controlled fracturing in the Upper Cretaceous Bekhme Formation, Kurdistan Region-Iraq. Int. Geol. Rev. 2020, 62, 2261–2279. [Google Scholar] [CrossRef]
  7. Bohnsack, D.; Potten, M.; Pfrang, D.; Wolpert, P.; Zosseder, K. Porosity–permeability relationship derived from Upper Jurassic carbonate rock cores to assess the regional hydraulic matrix properties of the Malm reservoir in the South German Molasse Basin. Geotherm. Energy 2020, 8, 12. [Google Scholar] [CrossRef]
  8. Croizé, D.; Renard, F.; Gratier, J.P. Compaction and Porosity Reduction in Carbonates: A Review of Observations, Theory, and Experiments. In Advances in Geophysics; Academic Press Inc.: Cambridge, MA, USA, 2013; pp. 181–238. [Google Scholar] [CrossRef]
  9. Sadooni, F.N. Stratigraphy, depositional setting and reservoir characteristics of Turonian—Campanian carbonates in central Iraq. J. Pet. Geol. 2004, 27, 357–371. [Google Scholar] [CrossRef]
  10. He, L.; Zhao, L.; Li, J.; Ma, J.; Lui, R.; Wang, S.; Zhao, W. Complex relationship between porosity and permeability of carbonate reservoirs and its controlling factors: A case study of platform facies in Pre-Caspian Basin. Pet. Explor. Dev. 2014, 41, 225–234. [Google Scholar] [CrossRef]
  11. Iscan, A.G.; Kok, M.V. Porosity and permeability determinations in sandstone and limestone rocks using thin section analysis approach. Energy Sources Part A Recovery Util. Environ. Eff. 2009, 31, 568–575. [Google Scholar] [CrossRef]
Figure 1. Location of the studied area with magnification provided in the red rectangle, illustrating the area of the Amara Oilfield.
Proceedings 87 00035 g001
Figure 2. Log–log plot of the Reservoir Quality Index (RQI) versus effective porosity of the Khasib Formation. Data were obtained from wells in the East Baghdad field [9].
Proceedings 87 00035 g002
Figure 3. (a) Porosity–permeability relationship shown through a magnified image of the three porous–permeable zones; (b) 3D lattice form showing the porosity–permeability–depth relationship in Am1. Depth is provided in meters (m), porosity is given as a percentage (%), and permeability is presented in millidarcies (md).
Proceedings 87 00035 g003
Figure 4. (a) Porosity–permeability relationship shown through a magnified image of the three porous–permeable zones; (b) 3D lattice showing the porosity–permeability–depth relationship in Am3. Depth is provided in meters (m), porosity is given as a percentage (%), and permeability is presented in millidarcies (md).
Proceedings 87 00035 g004
Figure 5. Subsurface distribution map for porosity and permeability range zones in (a) 2D and (b) 3D. Depth is provided in meters (m), porosity is given as a percentage (%), and permeability is presented in millidarcies (md).
Proceedings 87 00035 g005
Figure 6. Subsurface distribution map for porosity and permeability range zones in (a) 2D and (b) 3D. Depth is provided in meters (m), porosity is given as a percentage (%), and permeability is presented in millidarcies (md).
Proceedings 87 00035 g006
Figure 7. Subsurface distribution map for (a) porosity–permeability relationship and (b) porosity–permeability–depth in 3D form for Am1 and Am2. Depth is provided in meters (m), porosity is given as a percentage (%), and permeability is presented in millidarcies (md).
Proceedings 87 00035 g007
Disclaimer/Publisher’s Note: The statements, opinions and data contained in all publications are solely those of the individual author(s) and contributor(s) and not of MDPI and/or the editor(s). MDPI and/or the editor(s) disclaim responsibility for any injury to people or property resulting from any ideas, methods, instructions or products referred to in the content.

