Development and Testing of a Low-Cost Instrumentation Platform for Fixed-Wing UAV Performance Analysis


Department of Electrical Engineering, Federal University of Rio Grande do Sul, Porto Alegre, RS 90035-190, Brazil
*
Author to whom correspondence should be addressed.
Drones 2018, 2(2), 19; https://doi.org/10.3390/drones2020019
Submission received: 22 April 2018
/
Revised: 16 May 2018
/
Accepted: 17 May 2018
/
Published: 21 May 2018
Abstract
:The flight data of a fixed-wing Unmanned Aerial Vehicle (UAV) can be evaluated by its designers in order to analyze its performance, to validate the project criteria and to make new decisions based on the data analyses. In this paper, the authors propose the development of a low-cost instrumentation platform capable of collecting the following data: airspeed, orientation and altitude of the airplane, and the current drained by the electric system. Moreover, this paper presents the use of a telemetry system in order to display the flight conditions to the pilot. The system contains a variety of sensors, which were chosen based on their price, applicability and ease of use. After a test flight had been performed, the collected measurements were plotted and analyzed. Having the flight data, a set of flight characteristics might be observed.
1. Introduction
The design of an aircraft is a challenging process that requires intelligent use of aerodynamic knowledge and involves making a large number of decisions [1]. Ground-based methods, such as wind tunnels, simulators and software models, although useful, are limited in their ability to fully model the dynamic and true nature of an actual flight [2]. Moreover, Stoliker [2] points out that flight test data are essential to both improve and validate the accuracy of models and simulations.
The purpose of this work is to provide a cost-effective method to gather important information of a flight for project validation. Because some of the data need to be gathered at a particular condition, it is desirable that the flight is constantly monitored in order to help the pilot to achieve a specified condition, e.g., altitude. In addition, this study is focused on providing an affordable tool for students participating in SAE AeroDesign competition [3].
Roskam and Lan [4] and Ojha [5] point out that the airspeed, orientation, and altitude are fundamental information in order to analyze critical conditions of a flight. In a UAV, the current drained by the electric system is important to specify battery and wire sizes. Further, the current measurement could also be used to trace a relation between the torque applied to a servo and the flight control surface attached to it. To sum up, this work aims to build a platform responsible for collecting airspeed, orientation and altitude of a fixed-wing UAV flight, and current drained by the radio receiver and the servo actuators. In addition, the low-cost instrumentation system should be capable of acquiring, storing and transmitting these relevant flight parameters to a ground control station.
Besides this introduction, the paper is structured as follows: Section 2 presents some related works to this paper. Section 3 discusses the requirements for each measurement. Section 4 presents the conception of the instrumentation systems, reviewing important concepts used in its development. Section 5 describes and discusses the acquired results, while Section 6 concludes the paper, providing also directions for future work.
2. Related Works
A portable and low-cost hardware for flight testing in commercial aircraft was proposed by Kish et al. [6]. The developed instrumentation system was capable of collecting airspeed, pressure, altitude, and ambient temperature, among other measurements. The authors considered that the platform has shown promising potential to perform flight test measurements and would be useful as a primary flight reference system for home-built aircraft.
An instrumentation system might be needed for many applications and rather exclusively aircraft’s projects evaluation. For instance, Kugler and Holzapfel [7] proposed the use of flight data for implementing automatic take-off maneuver for a fixed-wing UAV and Lesprier et al. [8] presented a robust nonlinear control of a fixed-wing UAV. Moreover, Bryson and Sukkarieh [9] described the use of this information for building large-scale 3D terrain reconstructions.
In order to collect, process and store important flight data, Rodriguez et al. [10] presented an acquisition platform for experimental UAV research. The proposal was collecting UAV’s flight data (e.g., airspeed, ground speed, position, altitude, angle of attack and sideslip) focused on providing accurate and synchronized timestamps to all measurements. Complementary to those studies analyzed above, other studies (see for example [11,12,13,14]) described alternative methods of estimating attitude and position during a UAV’s flight performing data fusion algorithms.
3. Project Requirements’ Specification
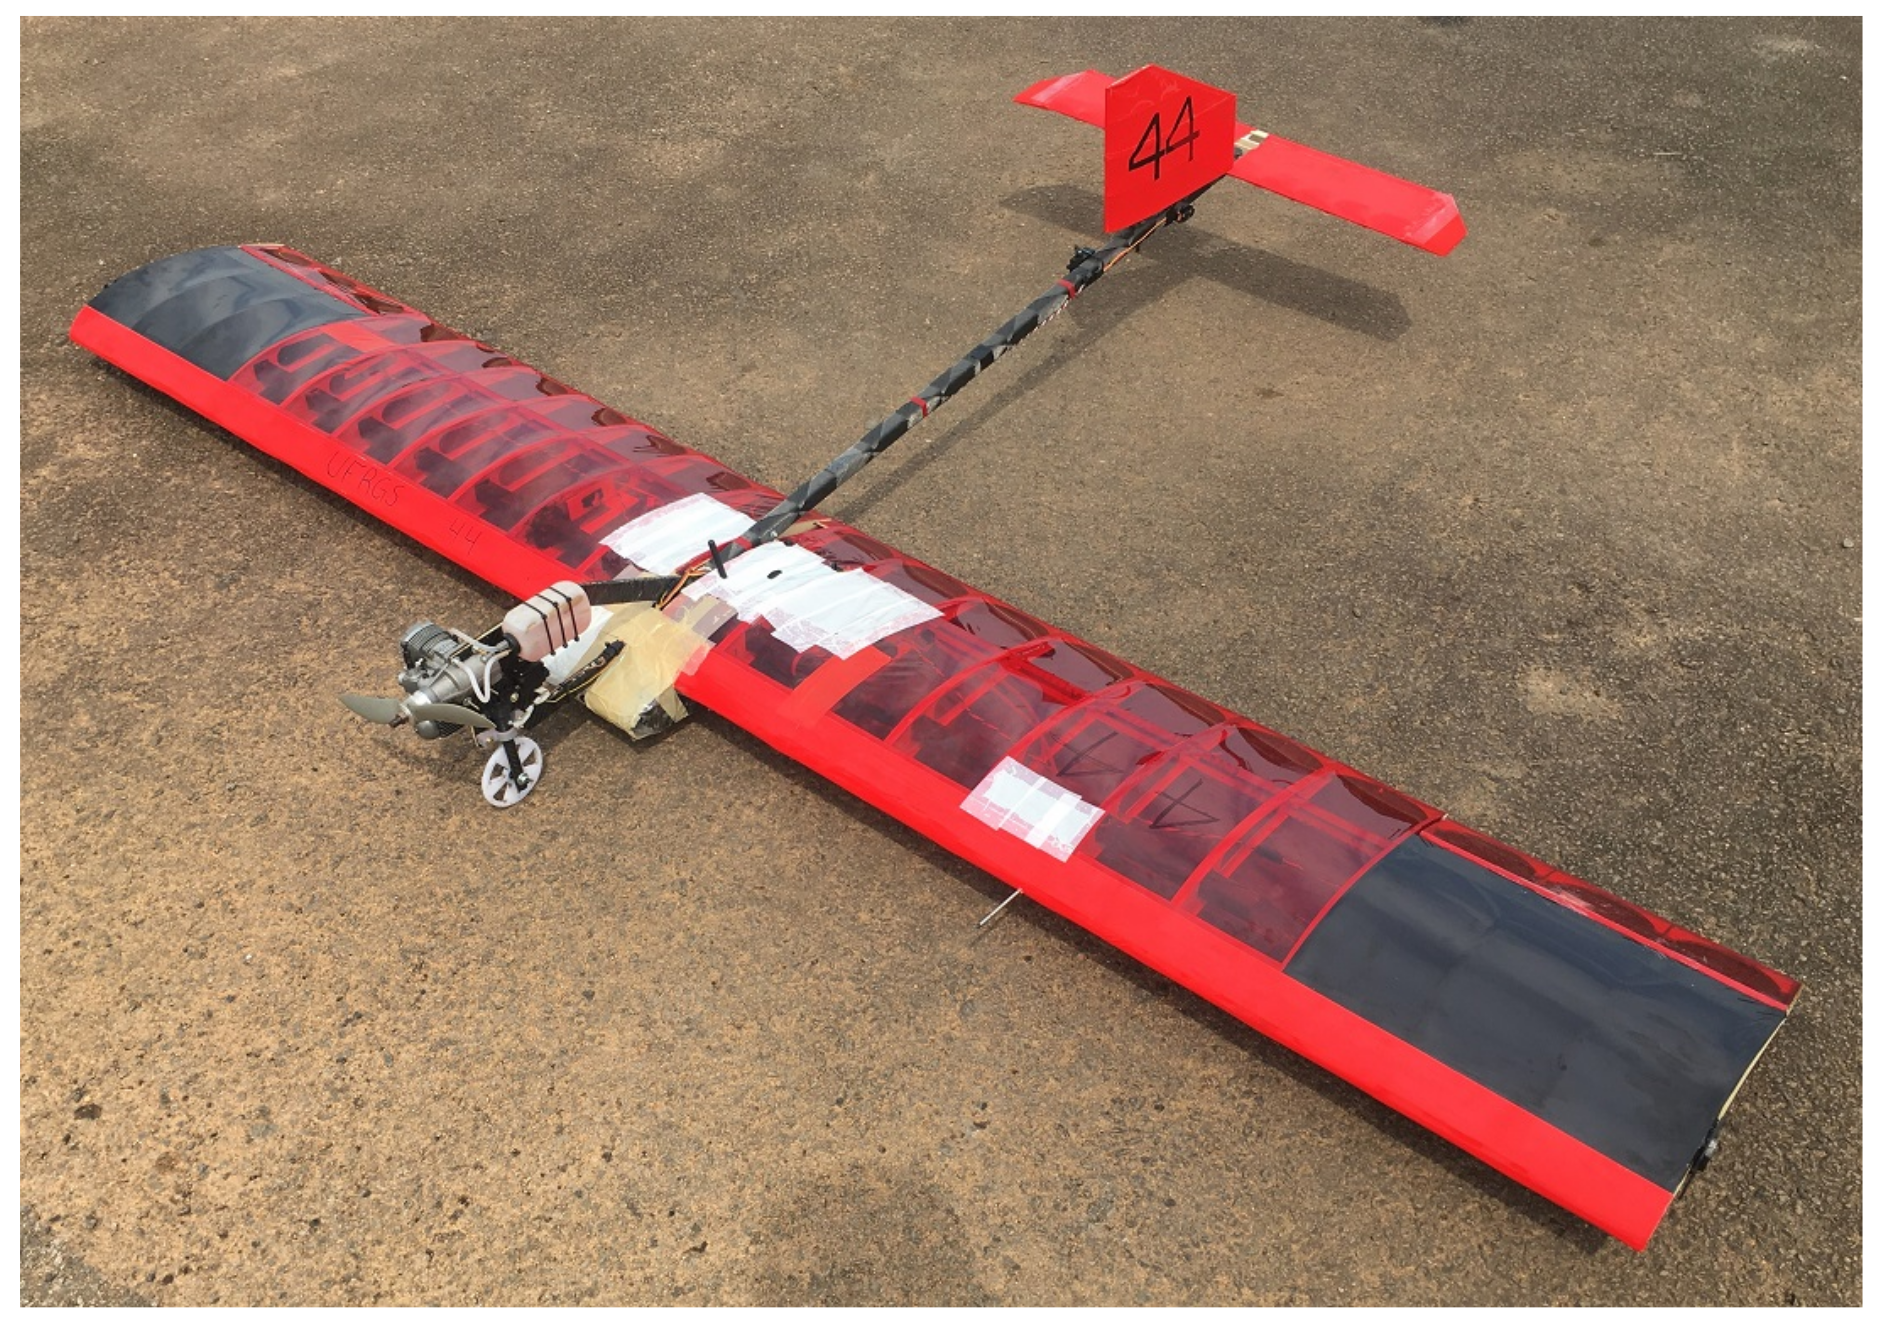
As a starting point for this proposed work, a study about the target UAV platform was performed. Based on this study, the requirements for the desired instrumentation systems were defined. The fixed-wing UAV named “JF-01”, developed by Pampa AeroDesign UFRGS, was taken as a reference platform, which is depicted in Figure 1. Then, the desired range and accuracy of each measurement was specified to facilitate the determination of the sensors and the methods to be used.
Aiming to address the UAV’s requirements proposed by the SAE Aerodesign competition, the airspeed below 10 m/s is not interesting, because the airplane would not be able to carry enough load. For structural reasons, the UAV is not capable of flying over 20 m/s. Thus, the measuring range should be 10 m/s up to 20 m/s. The maximum permissible error is m/s.
The orientation might be used to verify the rolling criteria in a fixed-wing UAV project. The JF-01 was projected to reach 30° in s. In order to collect at least 10 points of this movement, the sample period needs to be up to 70 ms. The maximum permissible error is °.
In the flight testing location, the altitude reached by the UAV would not pass 300 m above sea level. For this measurement, the maximum permissible error is m.
In addition, the platform should be able to measure the maximum current drawn by the electric system. The maximum permissible error is 50 mA.
4. Materials and Methods
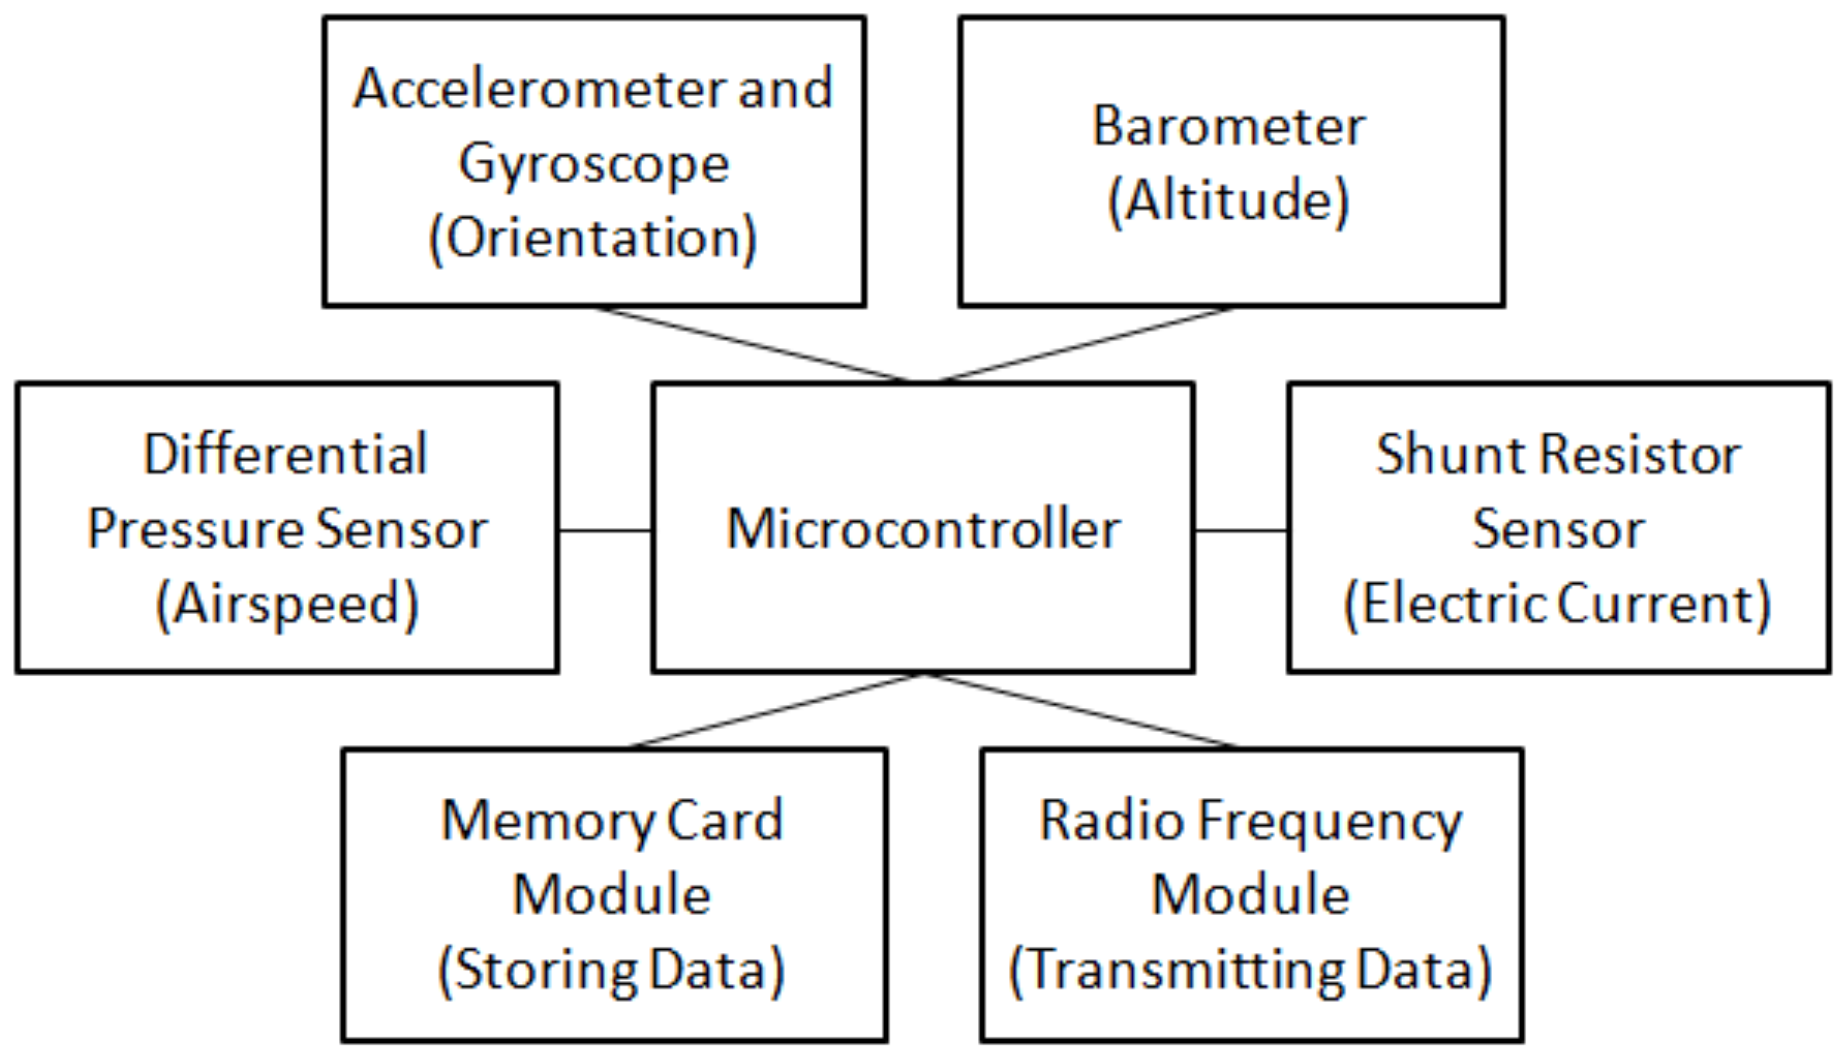
As an overview, Figure 2 depicts the sensors considered in this work. As can be seen, there are six components attached to the main microcontroller: two of them are responsible for storing and transmitting the data, and the other four are sensors responsible for taking single measurements. In this section, each of these six components will be presented with a discussion of its choice instead of others available on the market.
4.1. Microcontroller
In order to implement the airplane instrumentation system, an Arduino prototype platform was chosen to be used due to its low price, ease of use and ease of programming. Another important feature analyzed to decide the platform, was its size and weight, so that not too much weight had to be added to the airplane. Thus, among the available Arduino models, the Arduino Nano is a small board having similar technical specifications to the well-known Arduino Uno. Hence, the Arduino Nano was chosen.
An important parameter to be considered of the chosen platform is the quantization step size. This parameter, represented by , is the resolution of an analog-to-digital converter (ADC), i.e., variations in the analog signal up to might not cause a change in the digital value converted. The quantization step size can be calculated by the number of bits n and the full-scale voltage range .
The ATmega328, which is the microcontroller used in Arduino Nano, contains an ADC with a resolution of 10 bits and a full-scale voltage range of 5 V. Using the Equation (1), the quantization step size is mV.
4.2. Airspeed
Nowadays, airspeed measurement is performed using a Pitot tube. In this instrument, two pressure measurements are taken through flat holes: one is facing into the fluid flow, called stagnation pressure, and other is perpendicular to the direction of fluid flow, called static pressure [5]. The dynamic pressure, which is the difference between the stagnation pressure and the static pressure, can be finally used to determine the airspeed of an aircraft.
For the measurement of the differential pressure, some sensors were searched in the market. The sensor MPX7002DP, manufactured by Freescale, is a passive element which takes two pressure measurements and converts the difference from kPa up to 2 kPa to an output from V up to V. Having that, the sensitivity of the sensor is 1 V/kPa and the desired measurement range, in pressure terms, is from 0 Pa up to 245 Pa, then the desired measurement range, in voltage terms, is from V up to V.
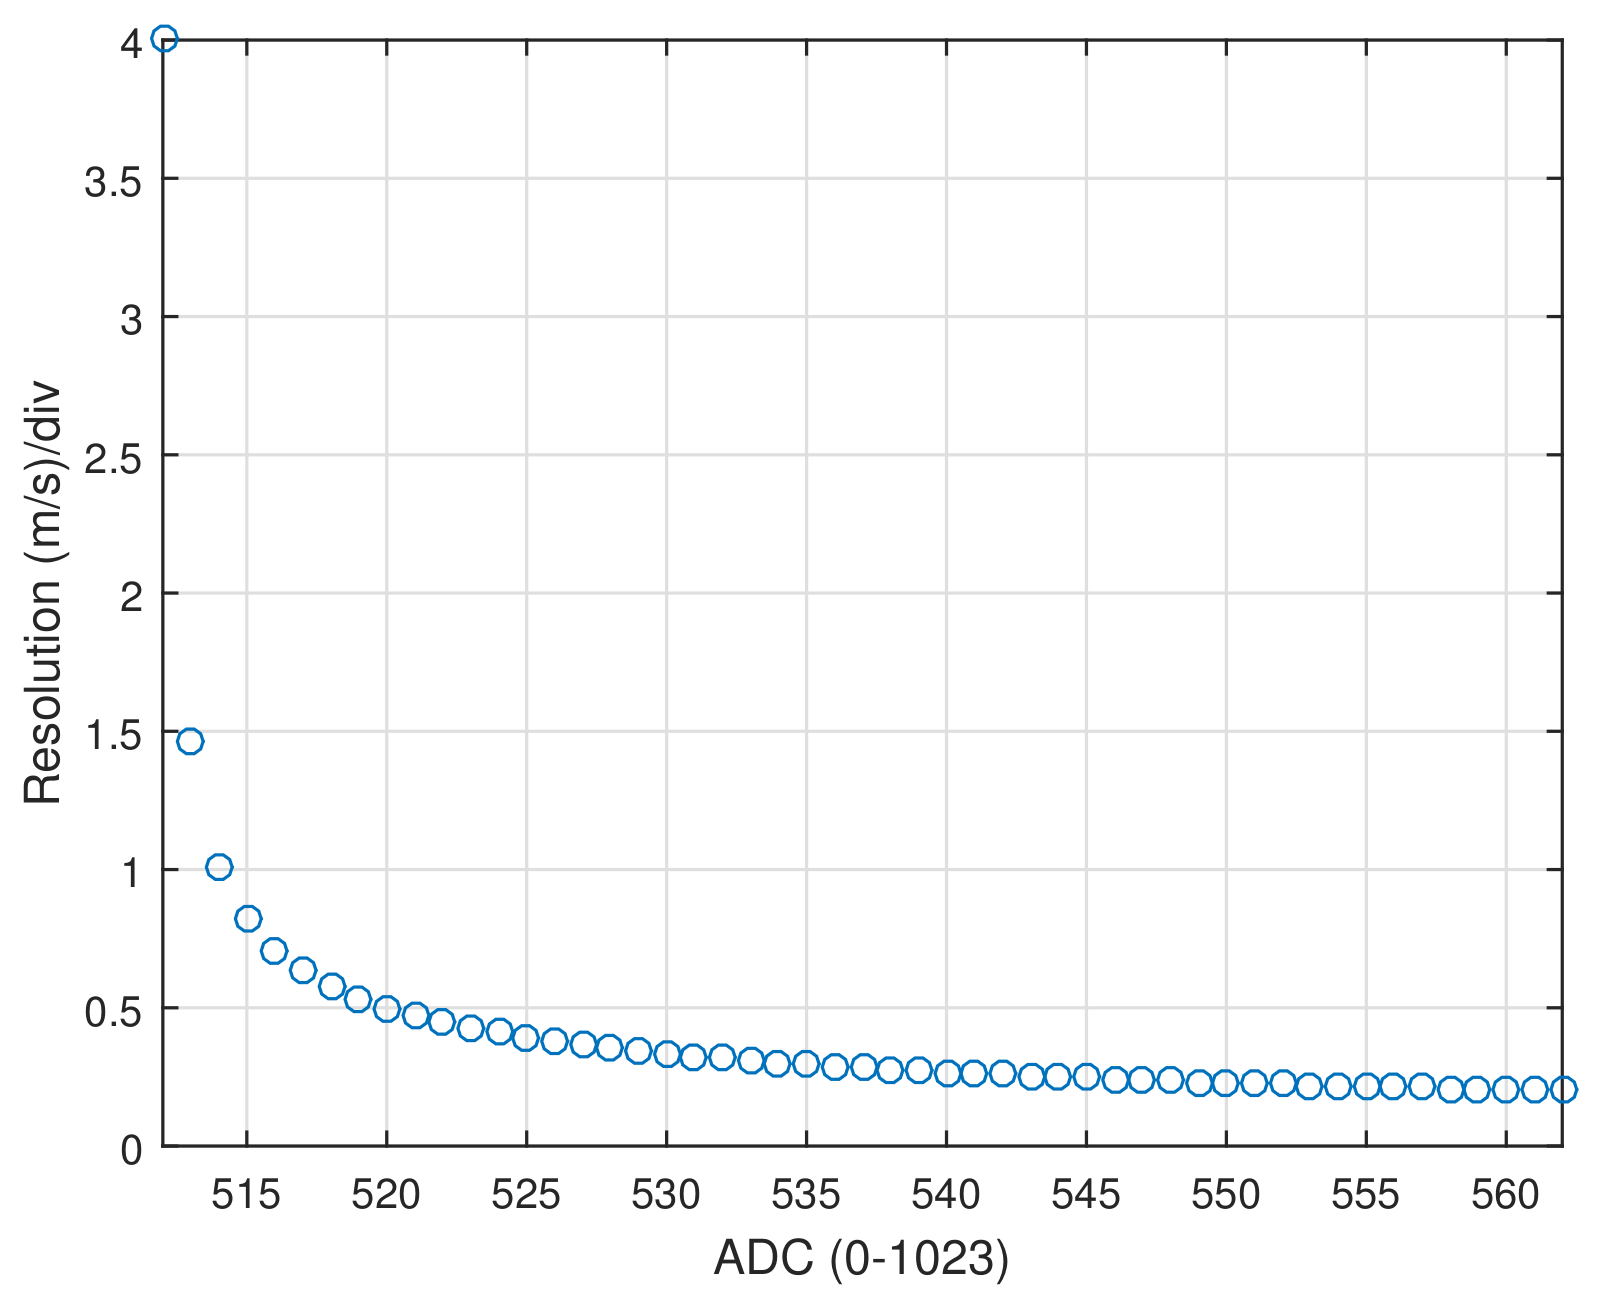
Having the quantization step size , the ADC values can be evaluated. Due to the quadratic relation between the differential pressure and the airspeed, the greater the airspeed, the smaller the difference between two digital values, i.e., the resolution. The Figure 3 depicts the measurement resolution per division in function of the real airspeed. As can be seen, having the real airspeed up to 8 m/s, the resolution is greater than and might achieve 4 .
The component MPXV7002DP is a low-cost differential pressure sensor which is easily found in the market. However, the manufacturer points out that the measurement error might achieve %, equivalent to 250 Pa, when the offset is not adjusted. Performing this adjustment and guaranteeing temperature lower than 5 °C, the maximum measurement error reduces to %, equivalent to 100 Pa. Considering a measurement error of % and real airspeed value of 8 m/s, the sensor might still indicate a measurement error up to 7 m/s.
The differential pressure sensor 4515DO-DS3BK002DPL, manufactured by TE Connectivity, is commonly chosen to be used in recent flight controller boards, replacing the MPXV7002DP. That sensor provides a range from 0 Pa up to 500 Pa, having greater sensibility than the low-cost mentioned. Others sensor, such as the SDP510, manufactured by Sensirion, and the LMIS500BB3S, manufactured by First-Sensor, are also indicated, due to their reliability and 0–500 Pa range. All those mentioned sensors are more expensive than the MPXV7002DP. For that reason, a set of experiments were performed using the MPXV7002DP, in order to evaluate repeatability and accuracy of the sensor measurements.
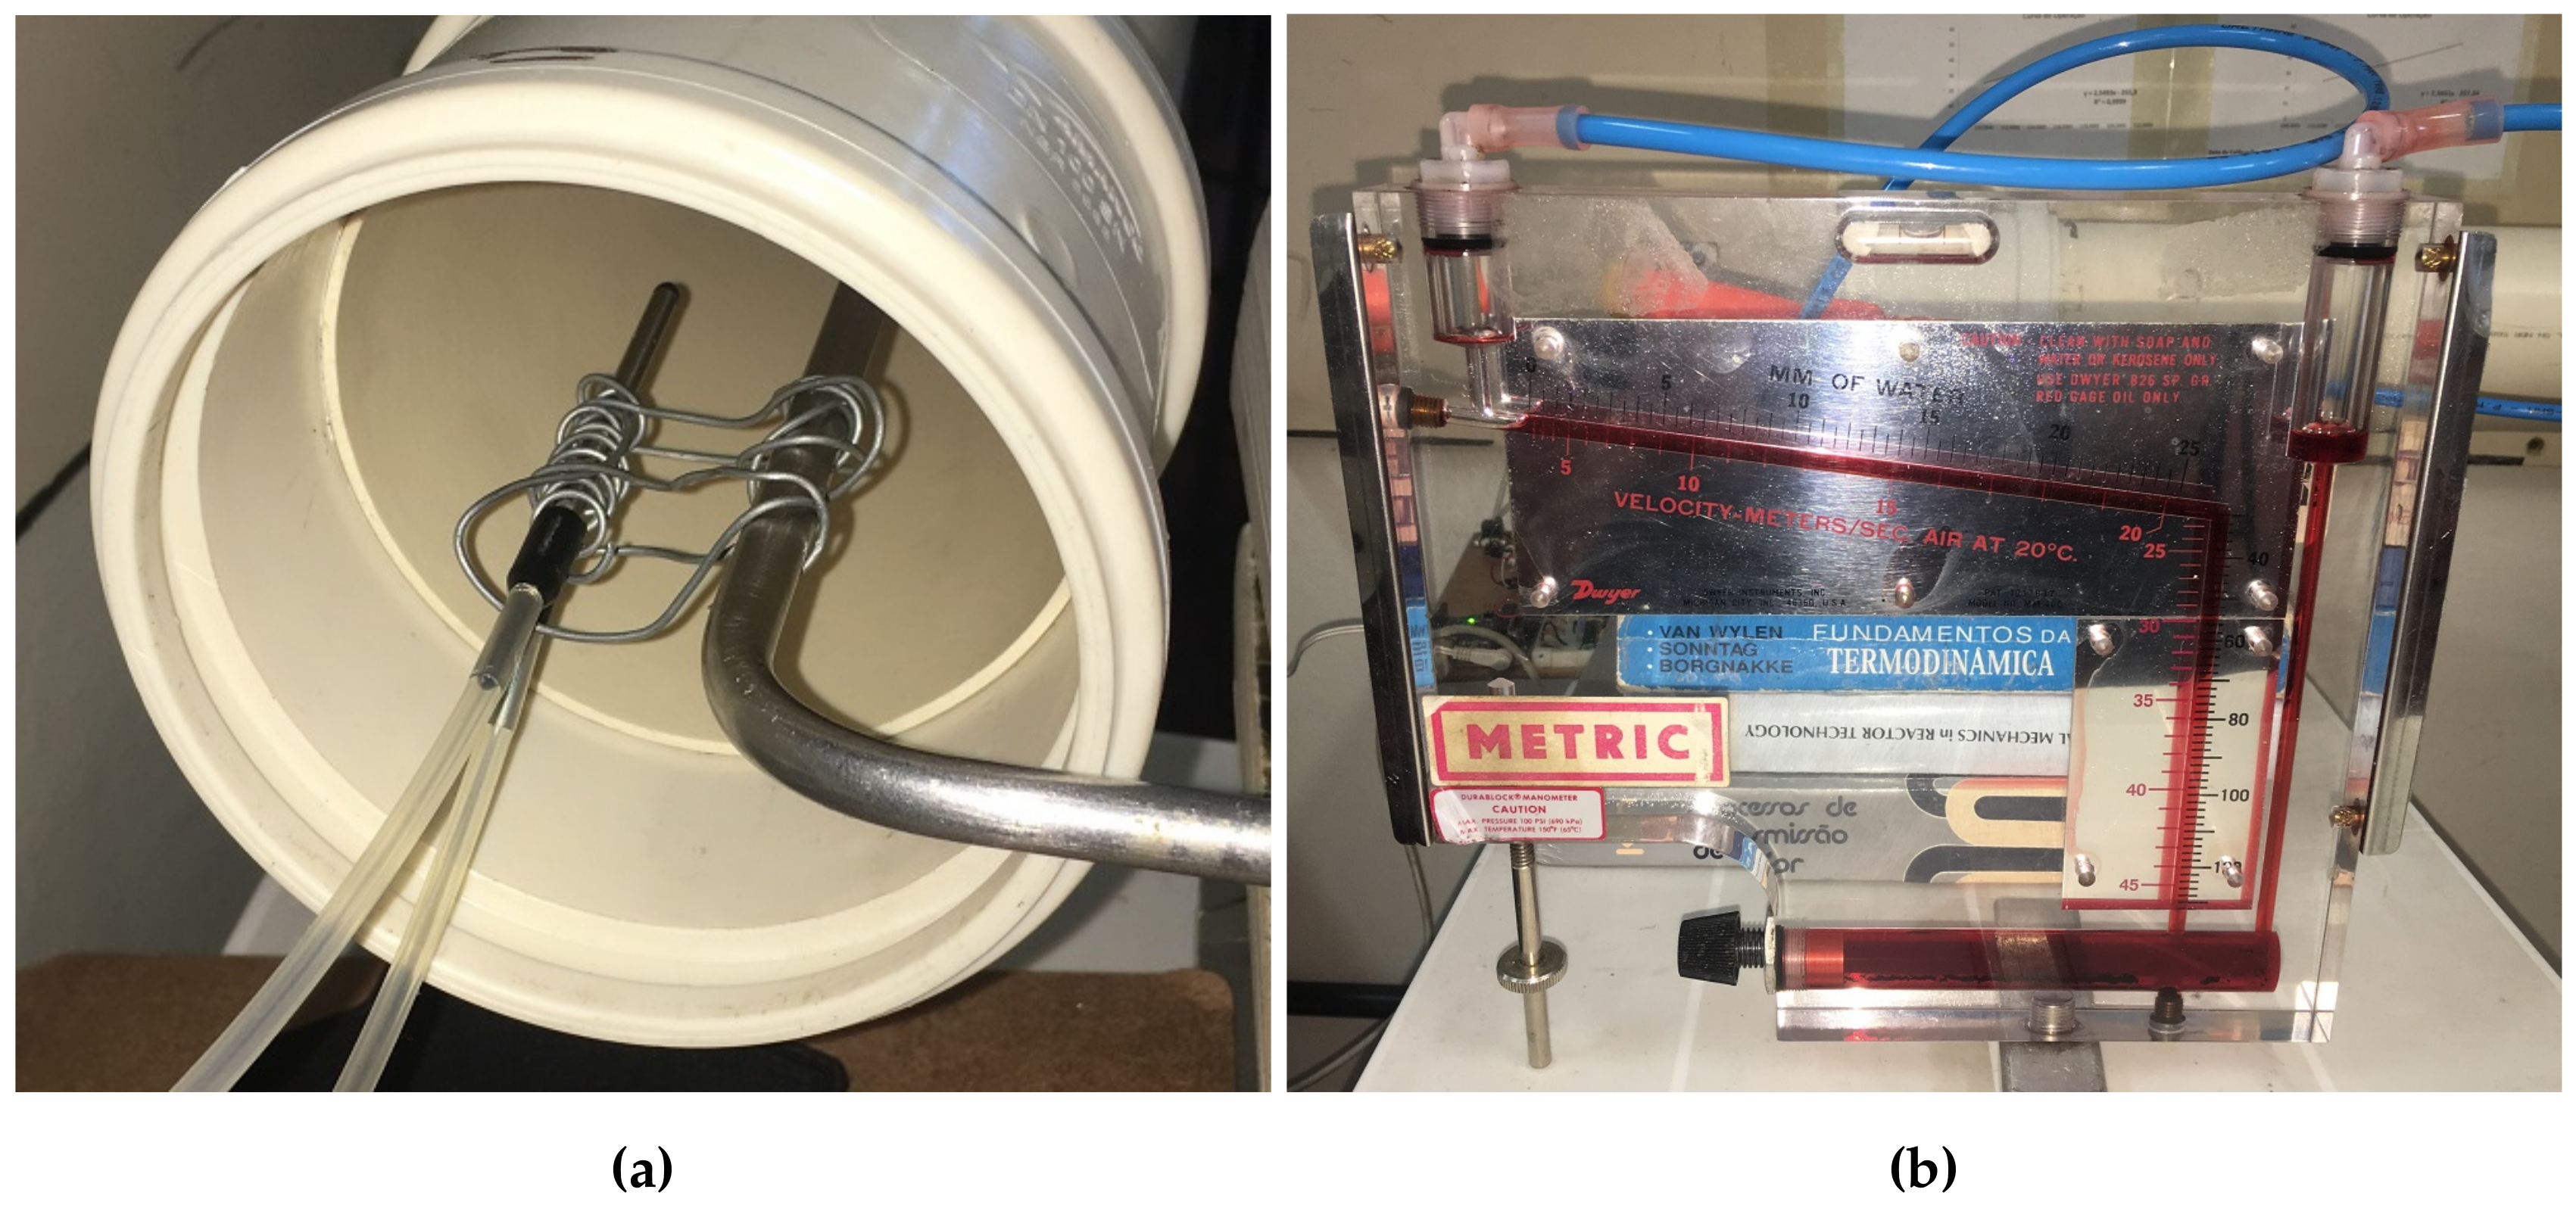
Experiments were performed in order to evaluate the MPX7002DP responses. As a reference instrument, a Pitot tube attached to a differential pressure manometer was used. The Pitot tube attached to the sensor and the Pitot tube for reference measurements were placed side-by-side, as shown in Figure 4a. The differential pressure manometer presented in Figure 4b already has airspeed marks used as reference values for the calibration of the MPX7002DP.
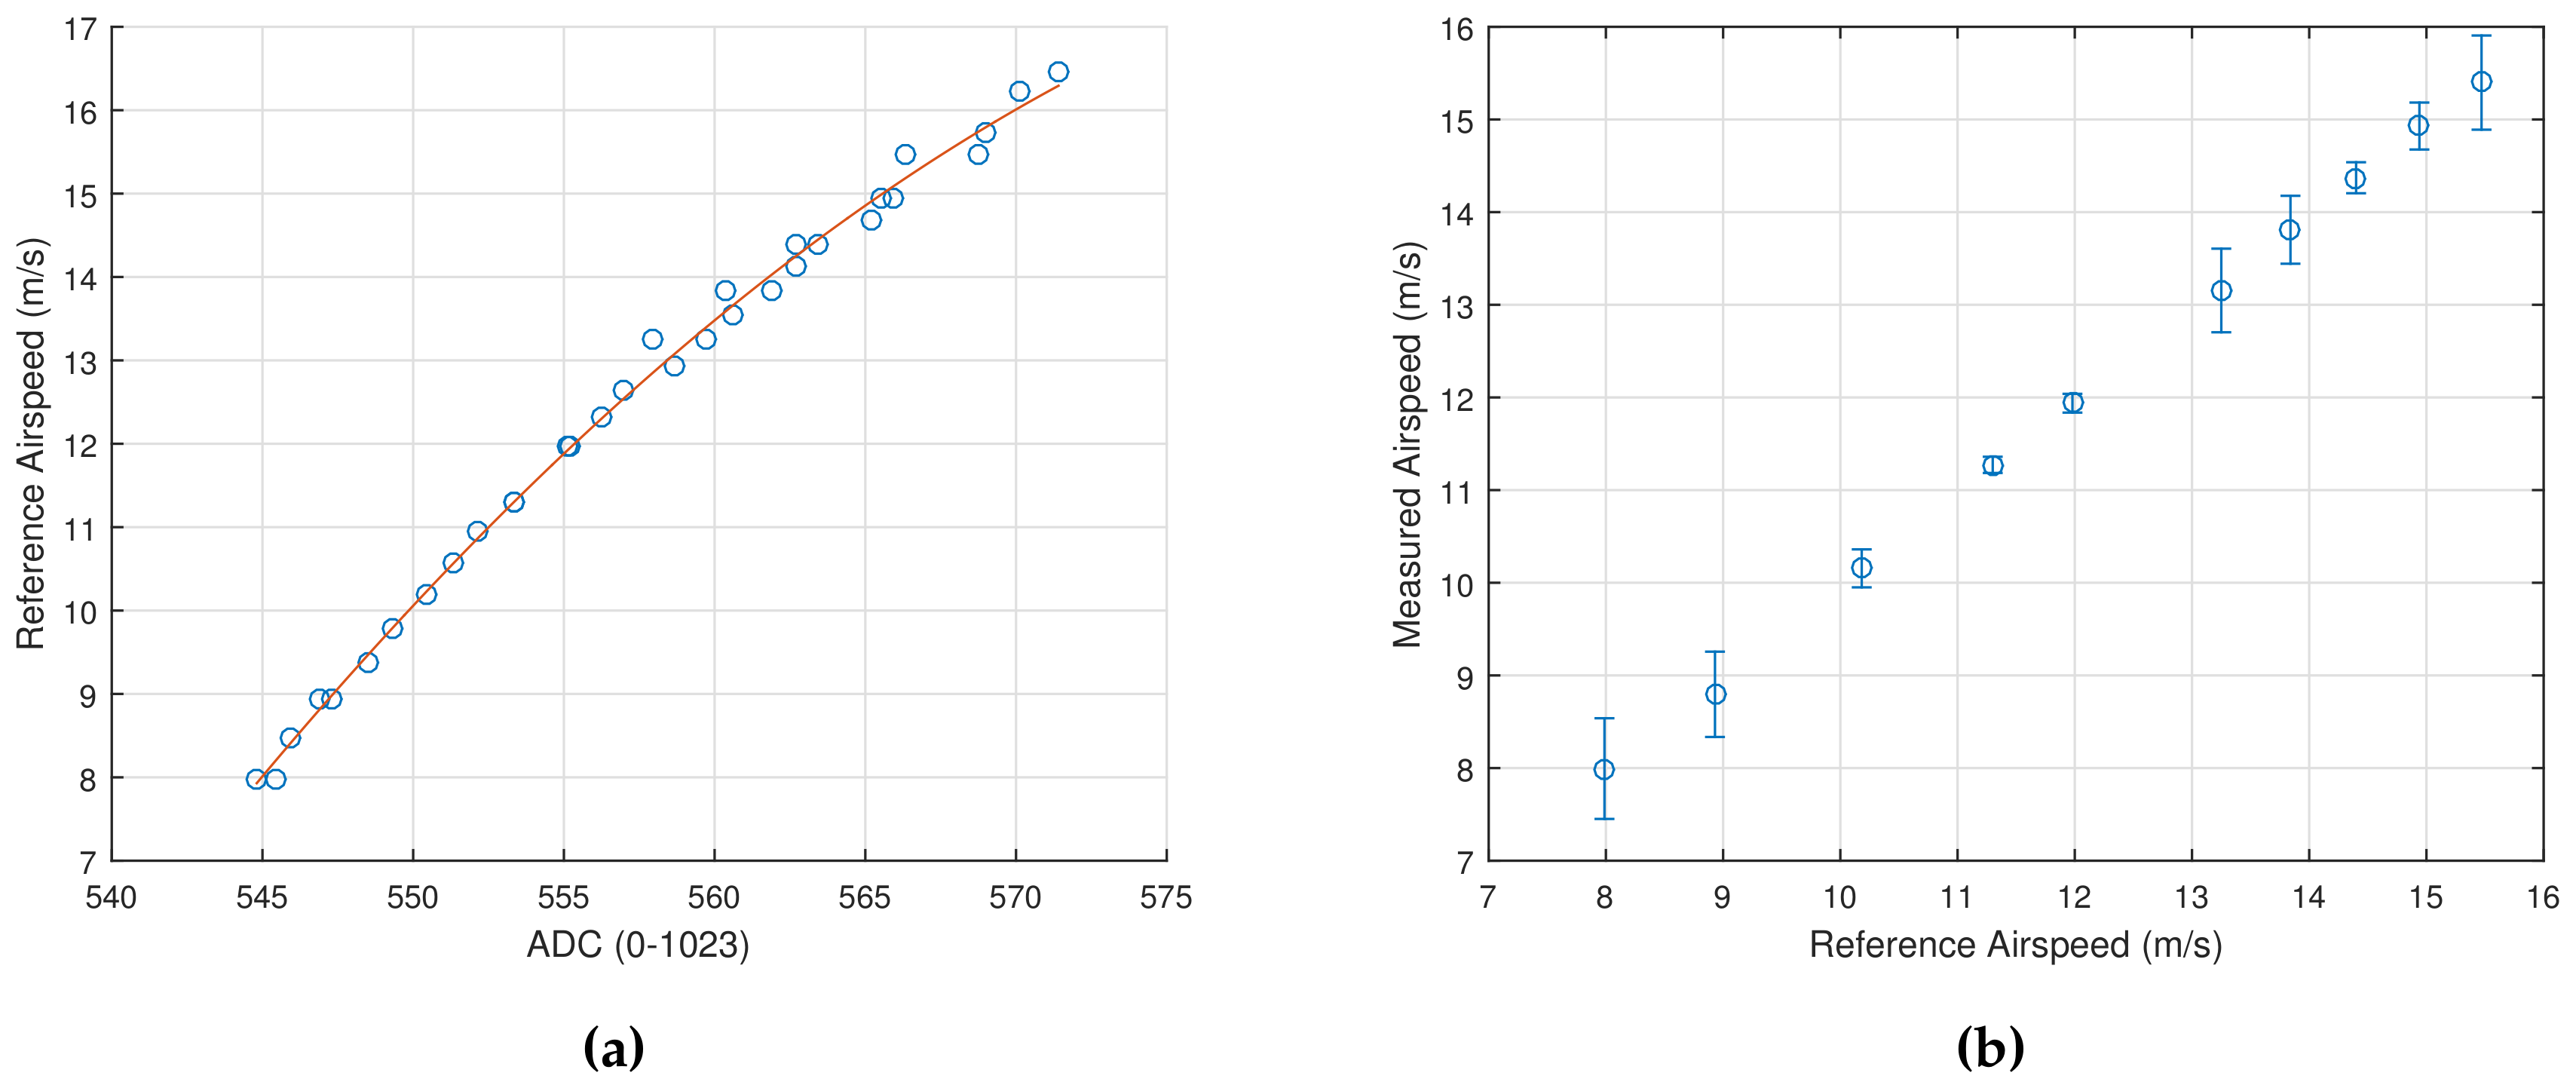
The Figure 5a depicts the 2th-order calibration curve drawn based on 30 points collected from 8 m/s up to 16 m/s. In order to test the sensor repeatability, i.e., the capability of providing responses closed to each other, five measurements airspeed were taken for each reference value. For each set of measurements, the mean and standard deviation where calculated. Thus, the confidence interval on the mean based on 95% confidence interval, using a t-Student distribution, was performed. The Figure 5b depicts the analysis in which dots represents the population mean and the lines represent the confidence interval on the mean.
As can be seen in Figure 5b, the instrument response is acceptable in terms of measurement repeatability. The values did not pass through m/s considering 95% confidence interval. Moreover, the instrument resulted in a great accuracy capability, as a result of the mean values being closed to the reference.
4.3. Orientation and Altitude
Readings of an accelerometer and a gyroscope are essential for determining the UAV orientation. Barometric pressure sensing is fundamental for having the altitude data. In the market, the following components were found in order to obtain these measurements: GY-80, GY-87, and GY-91. The Table 1 shows the sensors contained in each model.
One of the pros of the GY-87 and the GY-91 is their sensor specification of acceleration and angular speed. The MPU6050 contains an internal processor able to estimate position without the need for external data processing.
The barometers of the three models are able to measure from 300 hPa up to 1100 hPa, equivalent to 9000 m and m related to ground. According to the manufacturer, the BMP085 might have a maximum measuring error of hPa, equivalent to 4 m. The BMP180 and the BMP280 are better than the other, having a maximum measuring error of hPa, equivalent to m.
Due to the pressure sensor specification, price, market availability and the internal processor of the MPU6050, the GY-87 was selected to be used in this work. In order to collect orientation data, the authors used the open-source library published by Rowberg [15]. This library facilitates the acquisition of the orientation information by establishing a communication with the internal processor contained in the MPU6050.
4.4. Electric Current
In order to obtain the electric current measurement needed for this application, two types of sensors were taken into account. One of them is based on the Hall effect to find the current passing through it and the other one has a shunt resistor as the sensor.
The ACS712-ELCTR-05B-T is an electric current sensor, which uses the Hall effect in order to measure from A up to 5 A with a sensibility of 185 mV/A. Having the quantization step size of mV, the resolution is mA/div. Considering the manufacturer specification, the sensor might have a maximum absolute error of % of full scale.
A second option would be using a measurement instrument which uses a shunt resistor as the sensor. The chip INA219 measures the electric voltage in the resistor, realizes the analog-digital conversion, converts to electric current unit and transmits that value using I2C protocol. The range of this sensor is from A up to 3 A and the quantization step size is 10 V. According to the manufacturer, the maximum absolute error is % of full scale, equivalent to 16 mA.
The time needed to perform the reading using the IC INA219 is longer than performing an A/D conversion using the ACS712. In addition, the INA219 is more expensive than the ACS712. However, the INA219 is an instrument which is already calibrated from the manufacturer. For that reason, this sensor was chosen.
4.5. Radio Frequency Module
As mentioned in Section 1, there is a need for establishing a communication between the instrumentation platform and a ground station. A MATLAB interface was developed in order to display the flight data and send a set of user commands to the platform. This linkage will be established through radio frequency modules. In this section, two modules are presented: one is manufactured by XBee and the other by 3DR.
The XBee radios are radio frequency modules which use ZigBee protocol in order to communicate themselves using the industrial, scientific and medical (ISM) radio bands. Due to the ZigBee protocol, the communication is well-established, protected against external interferences, and allows more than 64,000 devices attached.
The manufacturer 3DR offers low-cost radio frequency modules. The company uses the open-source firmware SiK developed by ArduPilot [16]. As a consequence, the communication is supported with a message corrector (able to reconstruct 25% of defective bits) and uses the concept of Frequency-Hopping Spread Spectrum (FHSS). The FHSS is a method of transmitting signals that changes the carrier among many frequency channels. As a consequence, the communication is also highly resistant to external interferences.
In this work, there is no need for multiple devices. Furthermore, the price for the acquisition of an XBee device is considerably greater than a package of transmitter and receiver from the manufacturer 3DR. Thus, the 3DR radio frequency modules were chosen to be used.
According to the manufacturer 3DR, the voltage source for the modules must be able to provide from V to 6 V and up to 500 mA. The Arduino Nano contains the IC AMS1117 as the voltage regulator, which is able to provide up to 800 mA. Considering the fact that the voltage regulator contained in the Arduino Nano has to be able to power the internal circuit and all other components in the acquisition board, then a dedicated voltage regulator circuit for the RF module was developed. In this circuit, the low-cost chip LM7805 was used. This IC should be powered by a 7–20 V power source and can provide from V up to V and up to 1 A.
4.6. Data Acquisition Board
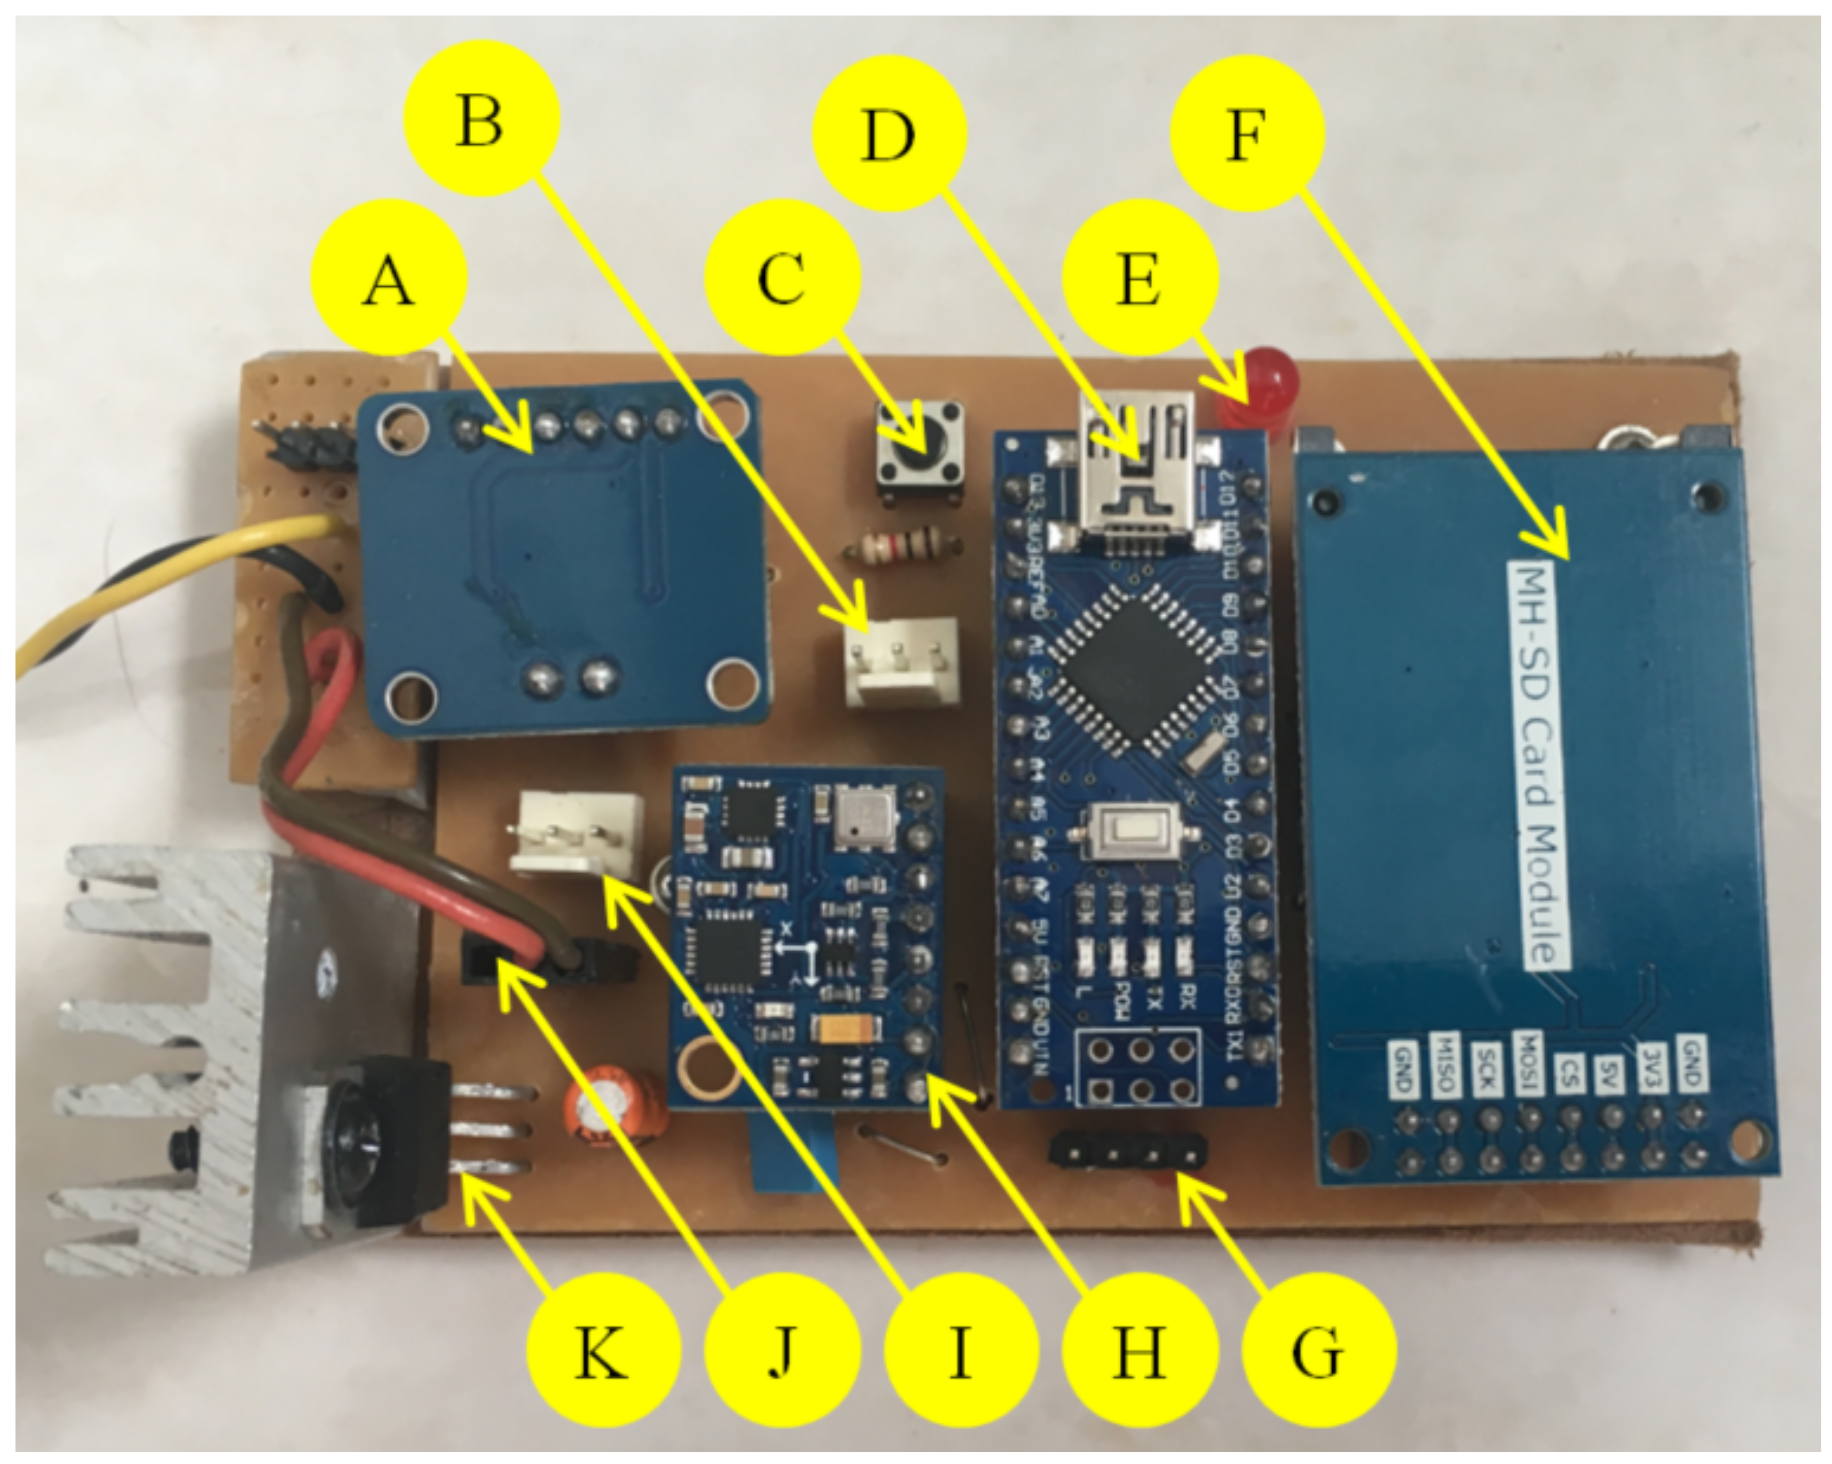
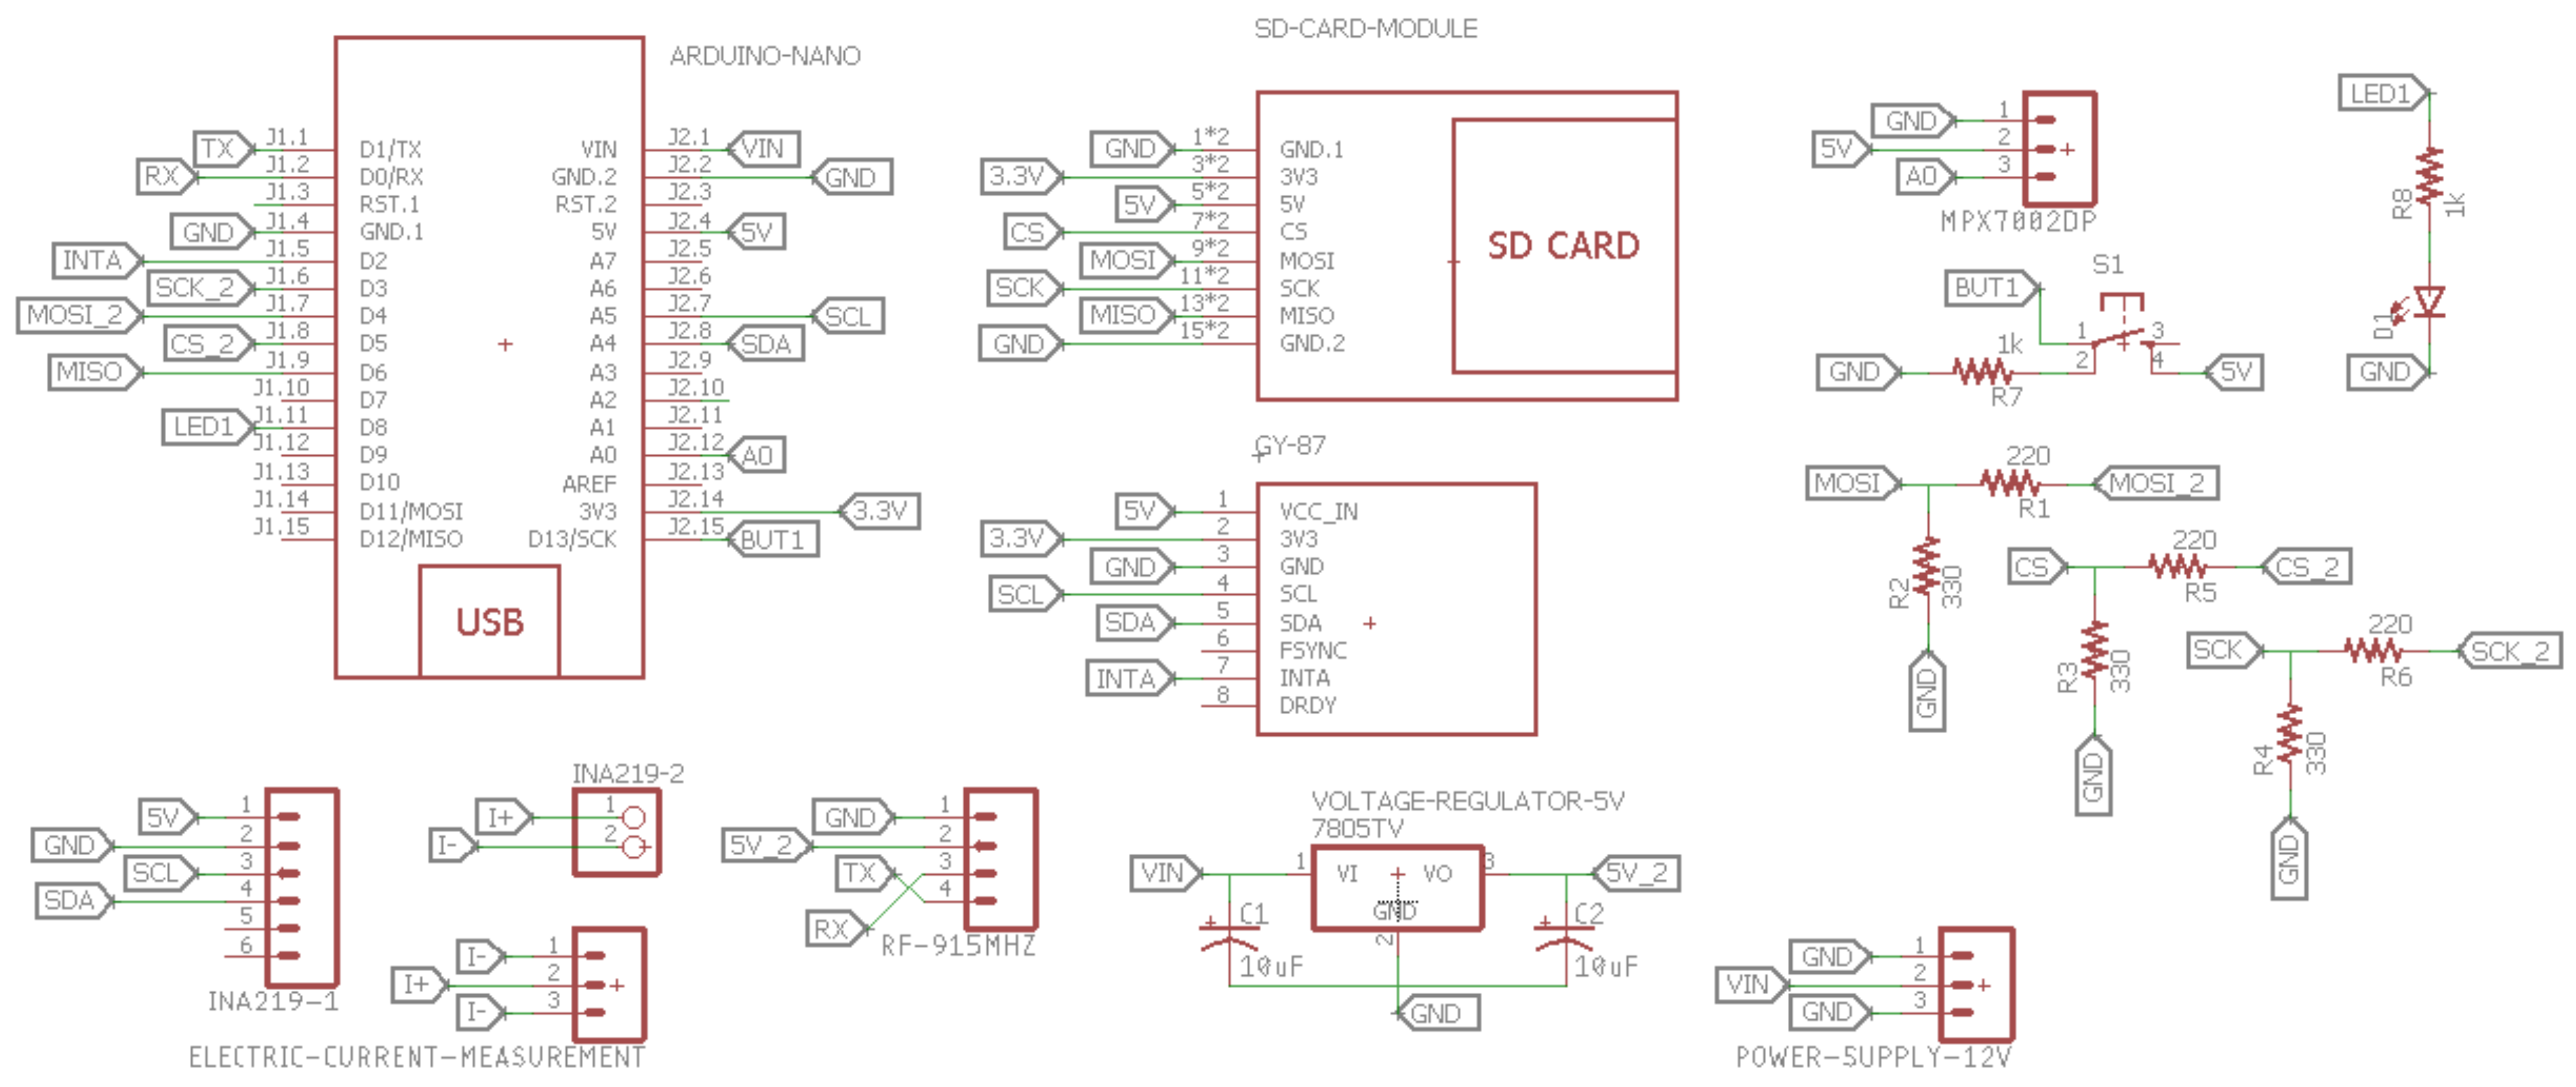
A data acquisition board was built in order to integrate the selected components which were presented in the previous sections. The Figure A1 contains the electric diagram developed in order to design a PCB layout, having the items listed in Table 2. The Figure 6 presents the built data acquisition board. In this figure, the components are indicated through the legends of Table 2.
4.7. Communication Protocol
The devices chosen to be used in this work use different sorts of communication standards. Among them, there are the UART protocol, SPI, and I2C.
The UART protocol is an asynchronous serial communication. In the case of non-use of the flow control, the communication is established using two unidirectional channels: one for transmitting and other for receiving data, called TX and RX.
The SPI protocol is a synchronous serial communication. As a consequence, there is a dedicated channel to the clock signal in order to provide the synchronism in all the devices. The SPI communication uses the Master-Slave concept, in which the Master is able to select the Slave through the SS channel. For that reason, the Master must have a dedicated digital output for each Slave attached to the network. In addition, there are the MOSI and MISO channels. They are bi-directional channels responsible for transmitting data in Master-Slave and Slave-Master direction. In this work, the SPI protocol is used to store the data on the memory card. The library SdFat published by Greiman [17] was used in order to perform the communication task.
Similar to the SPI protocol, the I2C protocol is a synchronous serial communication based on the Master-Slave concept. In order to establish the communication, the SDA and SCL channels are used. Through the SCL channel, the Master is capable of setting the clock. Through the SDA channel, the data is transmitted in Master-Slave and Slave-Master direction. In order to be able of sharing a same data transmission channel, the devices are identified with an individual address. The I2C protocol is used by the microcontroller to communicate with the BMP180, the MPU6050, and the INA219. For each of them, there is a specific library being used: the BMP180 published by Sminghub [18], the Adafruit-INA219 published by Adafruit [19] and the Wire which belongs to the Arduino’s native library.
4.8. Data Acquisition Firmware
A firmware contains a sequence of routines implemented in a microcontroller aimed to perform a set of tasks demanded by an application. The Table 3 presents the main tasks needed for the present work, as well as the time needed for each of them.
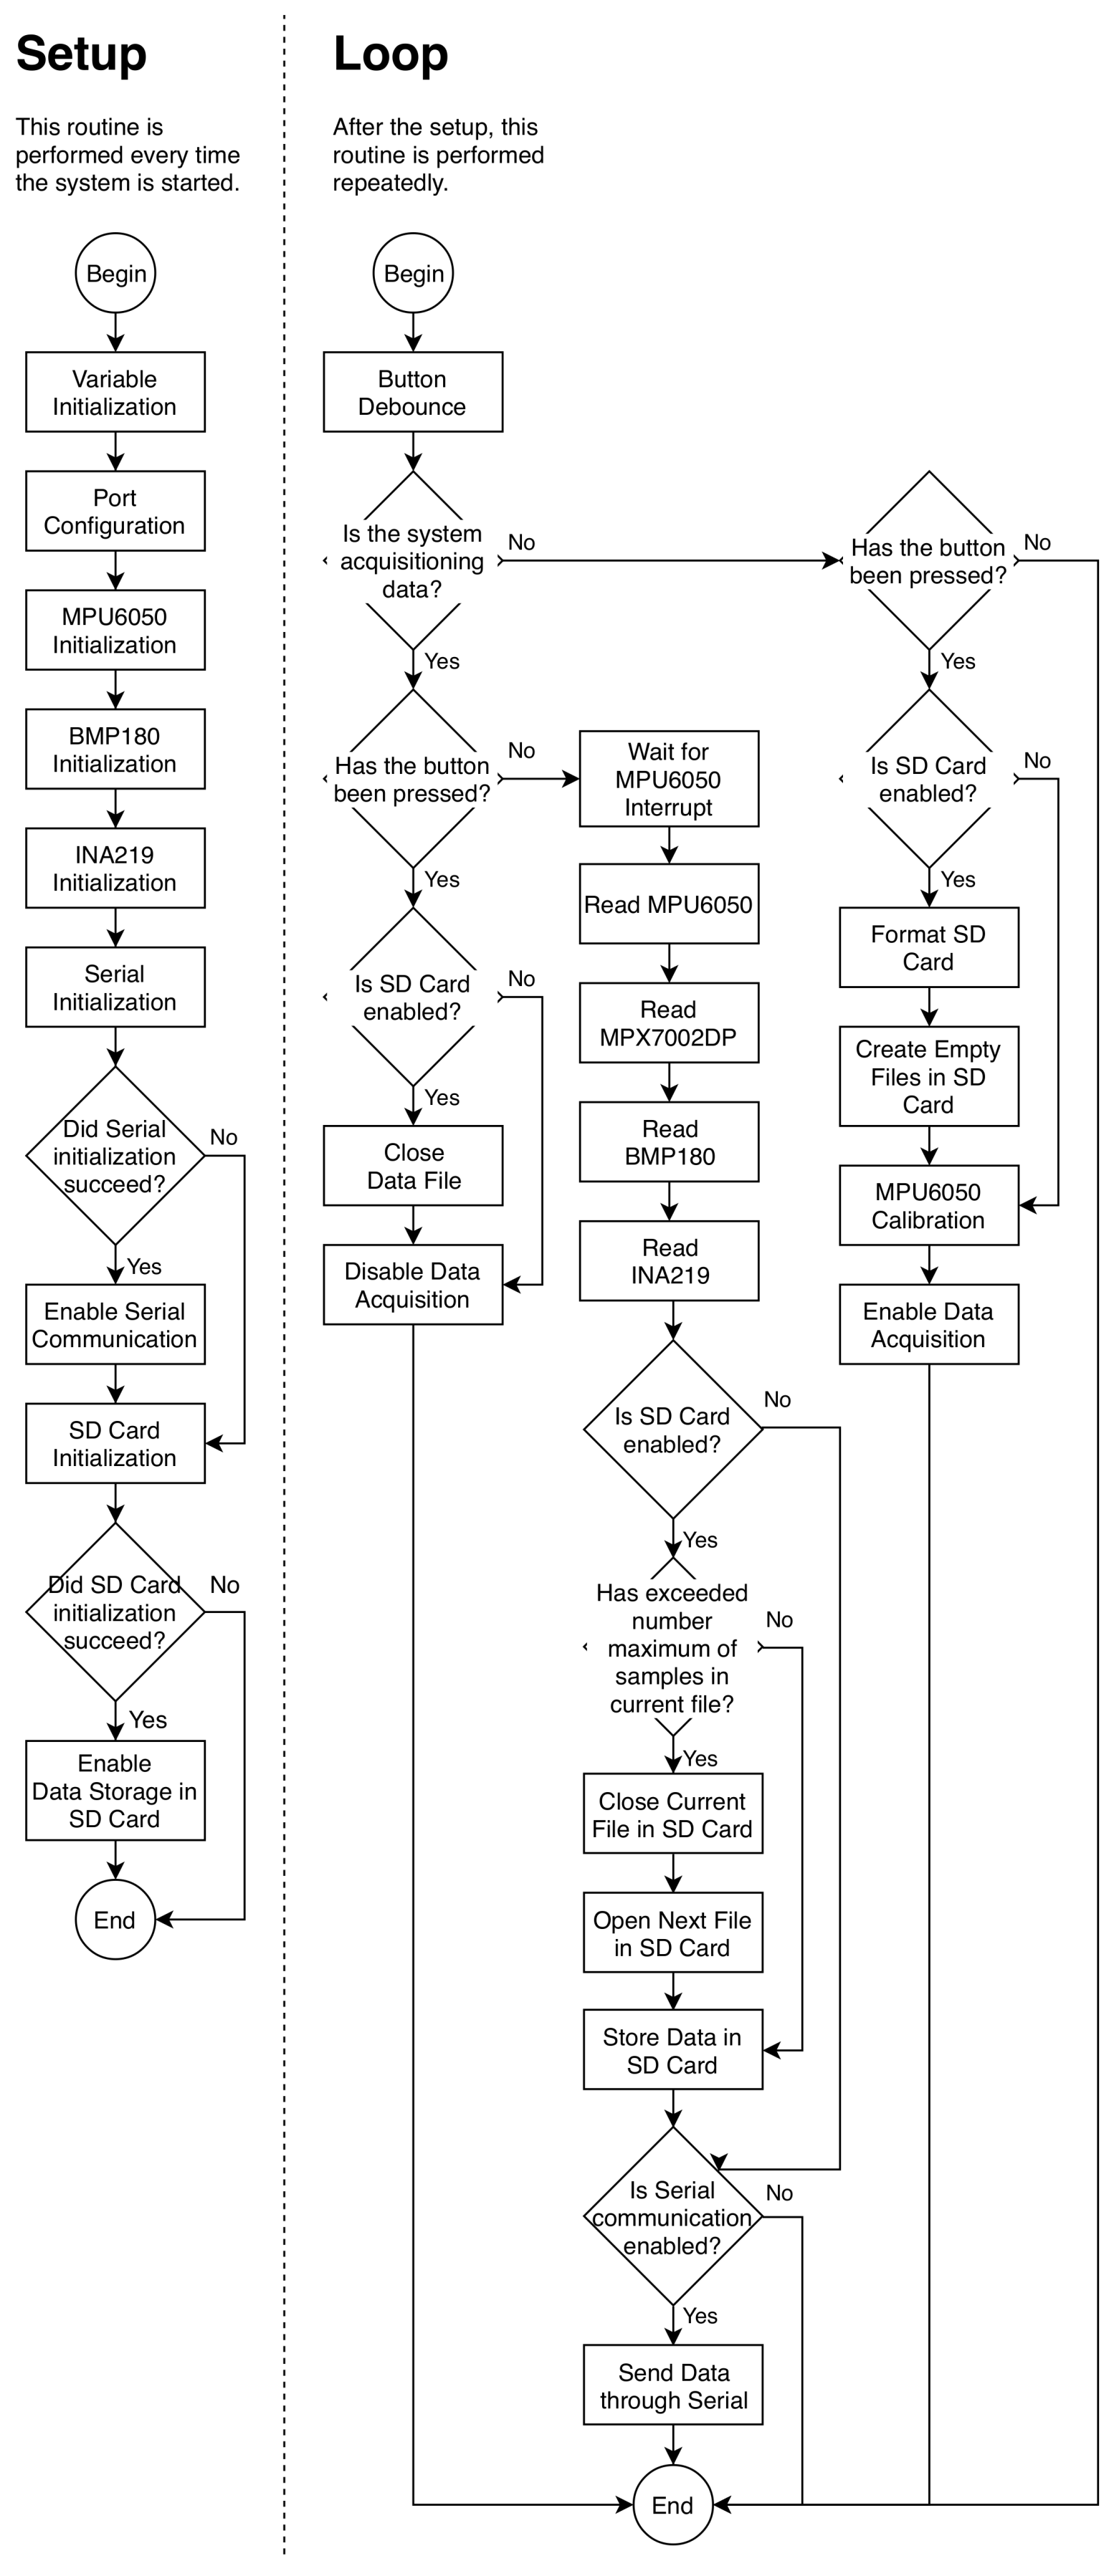
Firstly in the firmware sequence, the setup of the variable and the initialization of the components attached to the microcontroller is performed. Soon after, the acquisition and transmission of the data are started. The system erases the memory card and creates a fixed number of files. In the next iterations, the system collects the sensors information, transmits all the gathered data to a ground station and store these data on a memory card. The transmission and storage of the data occur at 15 Hz. The Figure A2 presents a flowchart describing in detail the sequence implemented.
4.9. Installing the Components in a Fixed-Wing UAV
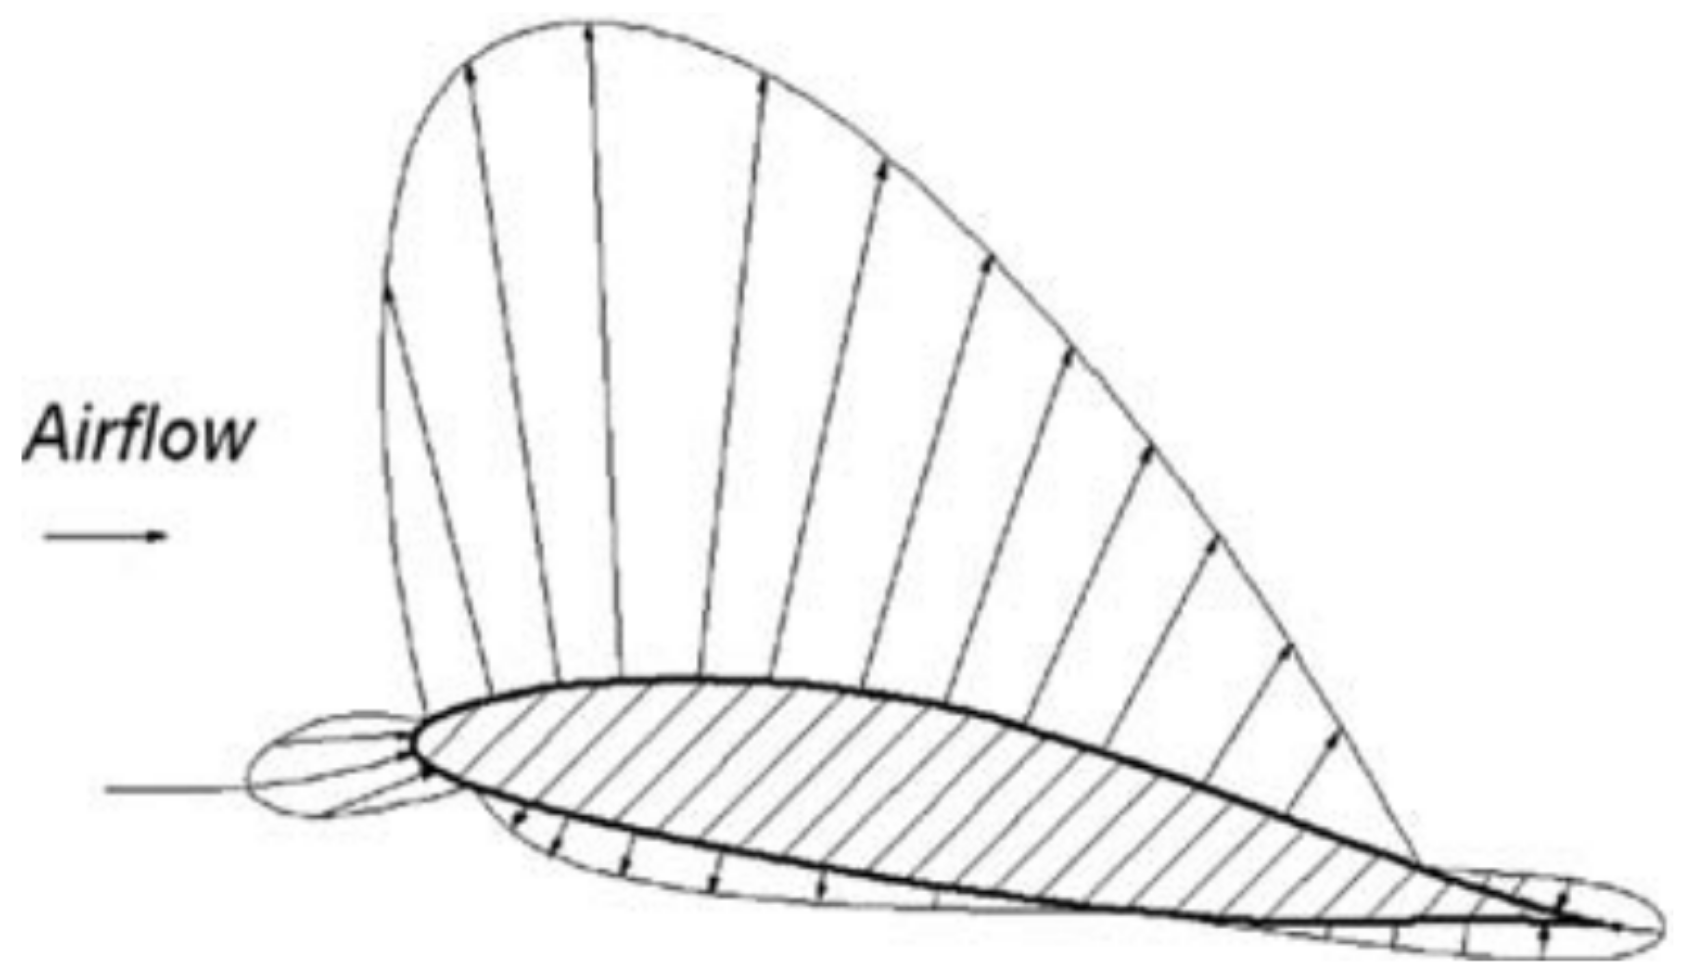
In order to have the Pitot tube positioned in a fixed-wing UAV, studies in flow dynamics around an airfoil were performed. The Figure 7 depicts the pressure field distribution around a generic airfoil. As can be seen, the pressure varies according to the flow compressibility during its movement. Actually, the difference between the atmospheric pressure and the altered pressure provide the acceleration or the deceleration of the air around the airfoil.
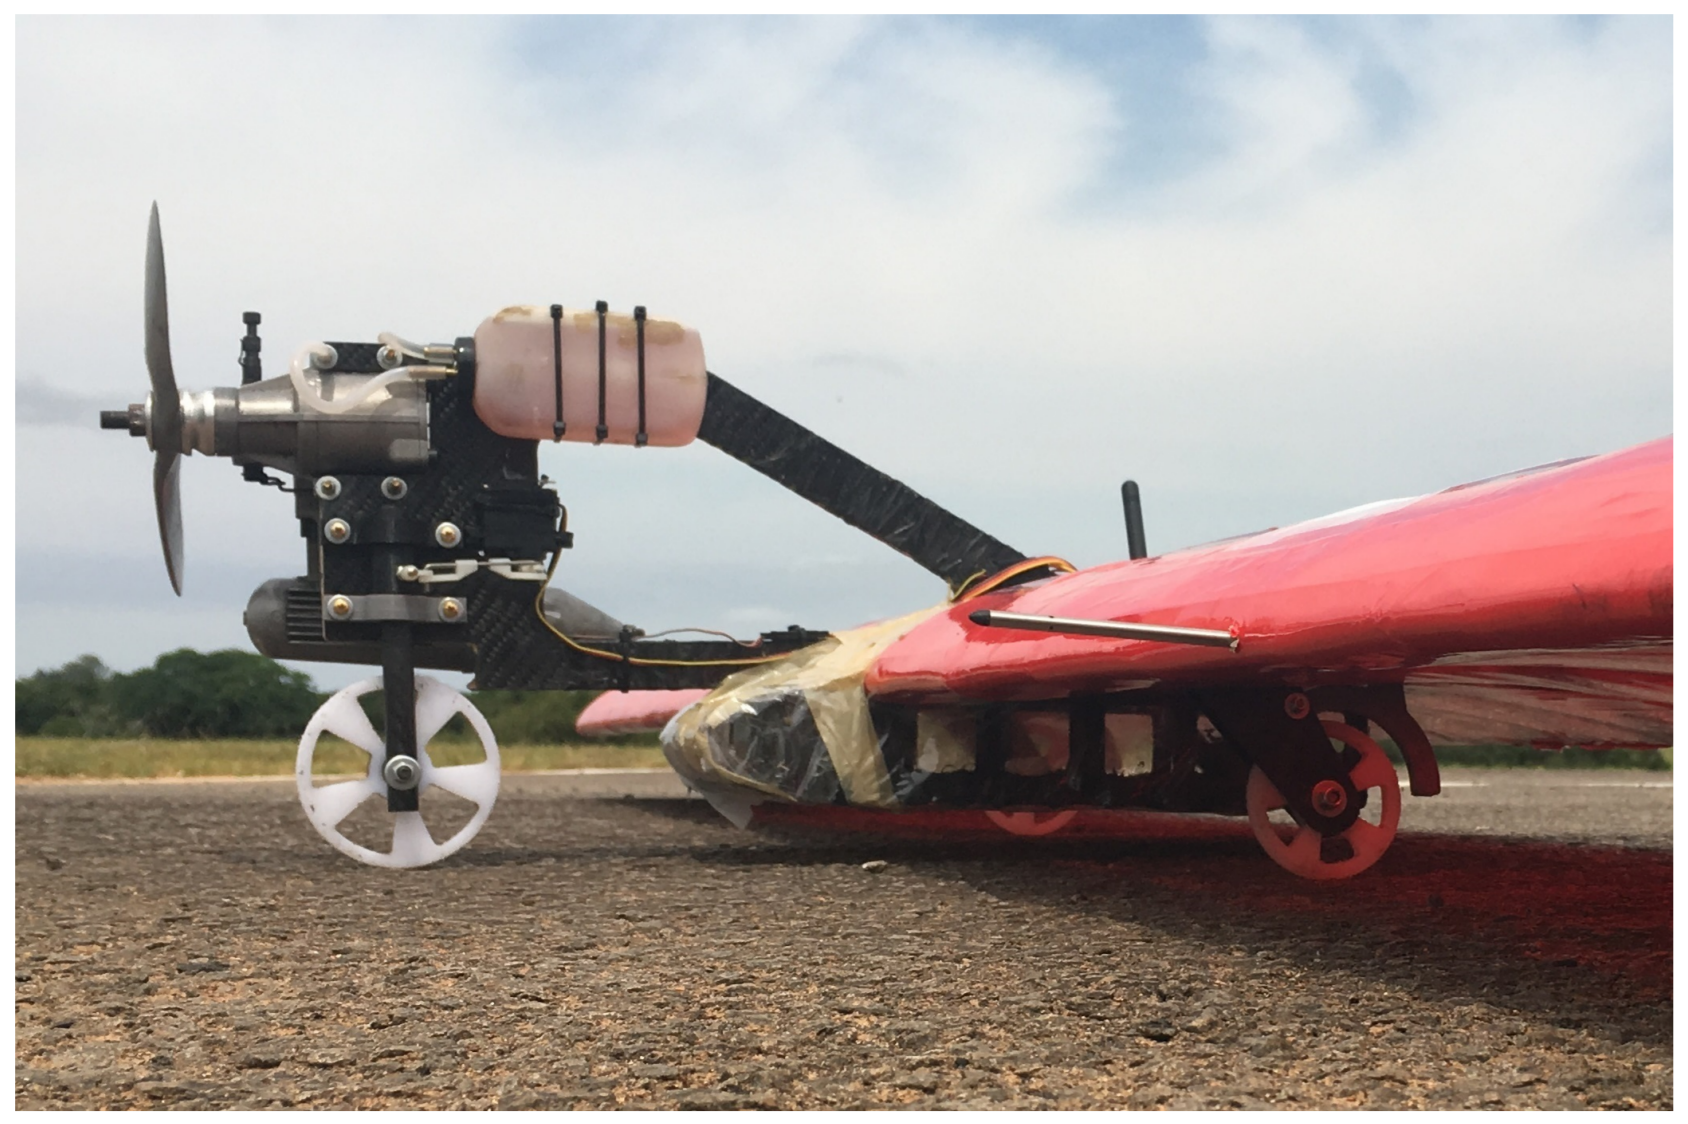
As a result of the pressure field distribution around a generic airfoil shown in Figure 7, the best position for the Pitot tube would be ahead and under the leading edge. However, the fixed-wing UAV used in the test is a low wing aircraft, at 7 cm to the ground. For that reason, the Pitot tube was placed ahead of the leading edge, in order to reduce the influence of the airflow around the wing, and avoid its impact with the ground. Moreover, the Pitot tube was placed as far as possible from the wing root in order to avoid the influence of the motor in the air flow. The Pitot tube can be seen in Figure 8.
5. Results and Discussion
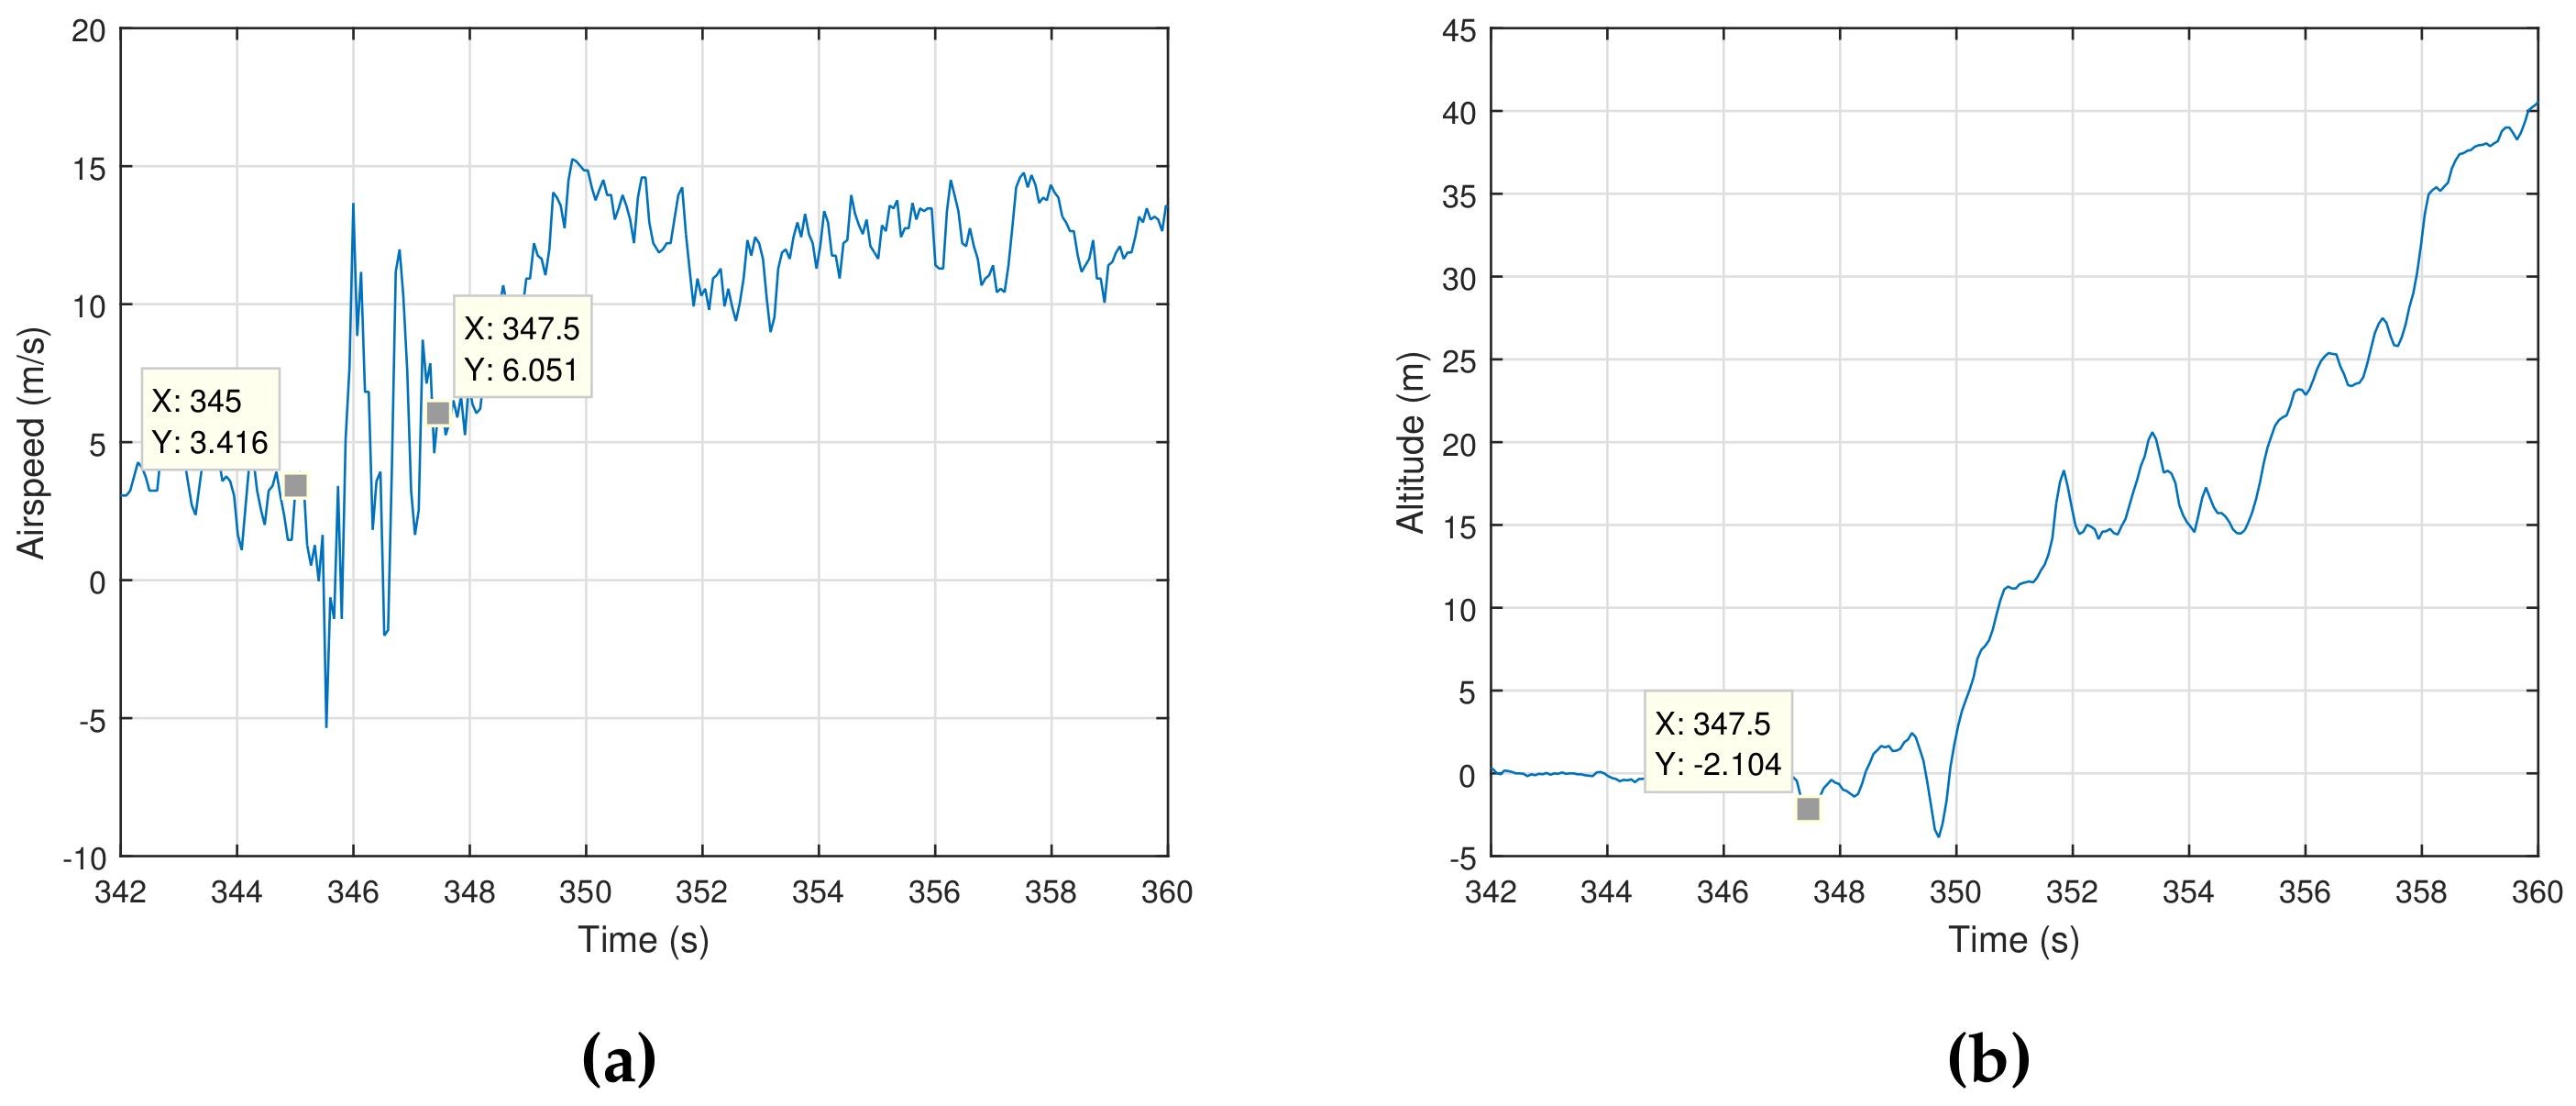
Figure 9a,b present the graphs corresponding to the aircraft airspeed and altitude, respectively, during take off. A moving average using three values was performed before plotting these results. This filter was considered adequate to the response time of the system, as it is the mean from the last approximate 130 ms.
As shown in Figure 9a, the data present an oscillatory behavior between 345 s and s. This can be explained by the structural vibration during takeoff, whilst the aircraft is still in contact with the ground. As a consequence, the effective takeoff occurs at s. At this point in time, a slight increase in altitude and airspeed occurs, when there is no friction between the landing gears and the ground. Even though the instrument measurement of 6 m/s is out of the calibrated range between 8 and m/s, the results are matching to the expected airspeed estimated during its project phase.
In Figure 9b, the measurement of the altitude can be evaluated. As can be seen, the instrument measured 2 m below the ground at time stand of s. At this point, the absolute error passes over the desired maximum error of m. From this point forward, the aircraft altitude is consistent with the flight, even though the measuring is not in accord with the work objectives.
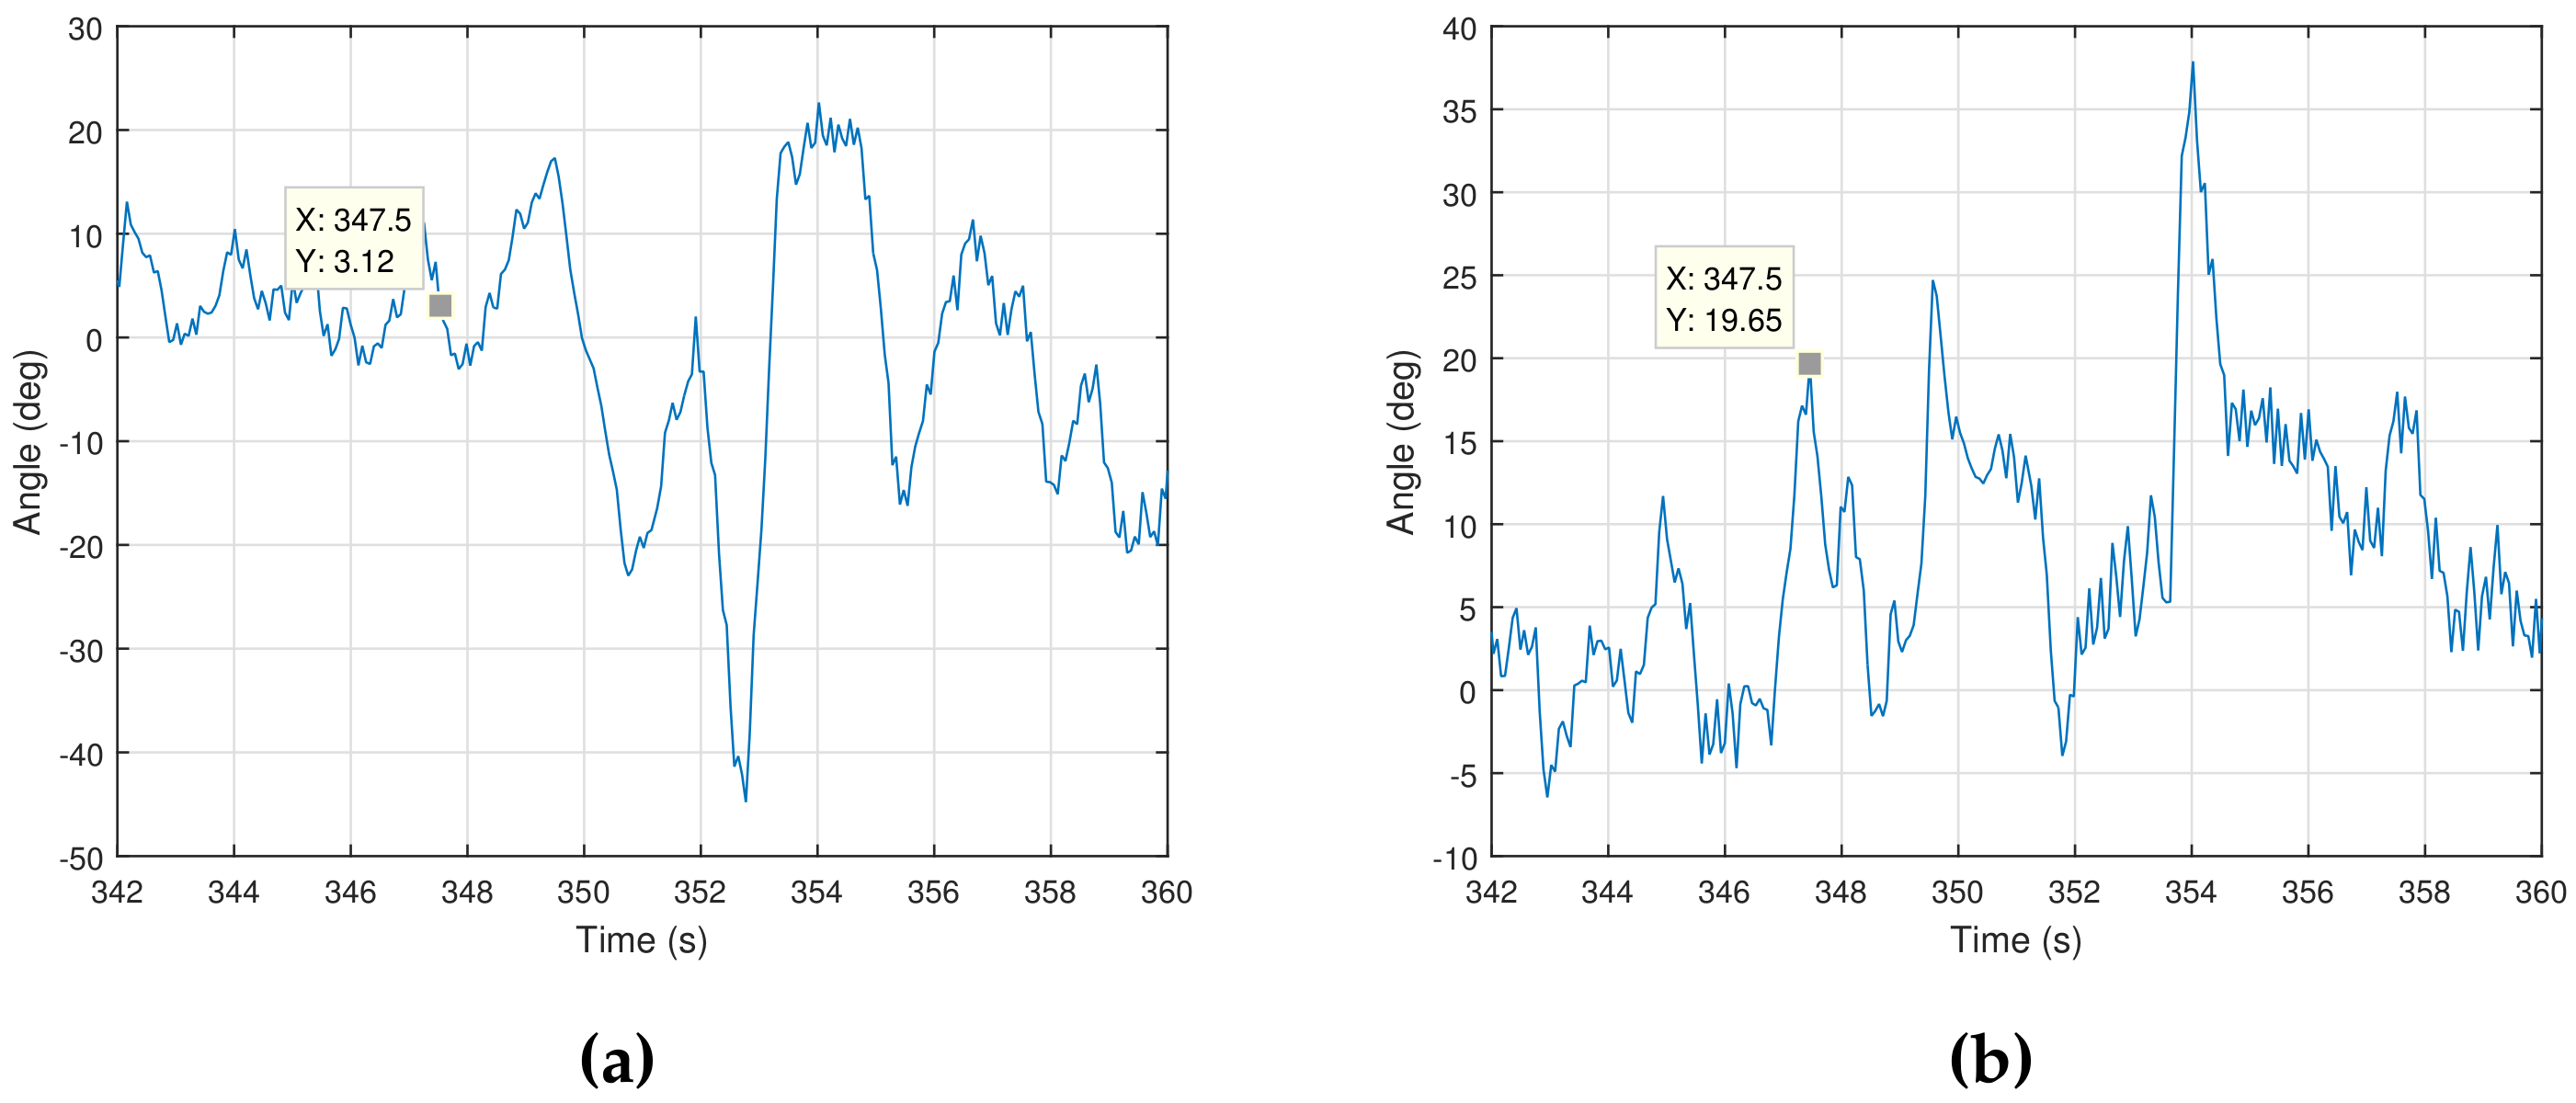
Figure 10a,b show the values of roll angle and pitch angle, respectively, during takeoff. As can be seen in Figure 10a, the roll angle variations increases after take off, since the aircraft is no longer supported by the landing gear, being capable of maneuvering and being affected by gust winds. Even though the aircraft is designed to have a fast rolling response, it proved higher than expected, possibly due to the low payload used during the test flight.
The pitch angle response during flight test, shown in Figure 10b, allows the analysis of the aircraft response to horizontal stabilizer deflection, as well as the aircraft’s pitch stability. Soon after the takeoff, a sharp increase in pitch angle can be noted, followed by a slow decrease. In parallel, a slight decrease in airspeed and an increase in altitude occurs, as expected from an ascent maneuver. This can also be noted from 352 s forward, when the aircraft holds a stable positive pitch angle, gaining altitude at a constant speed.
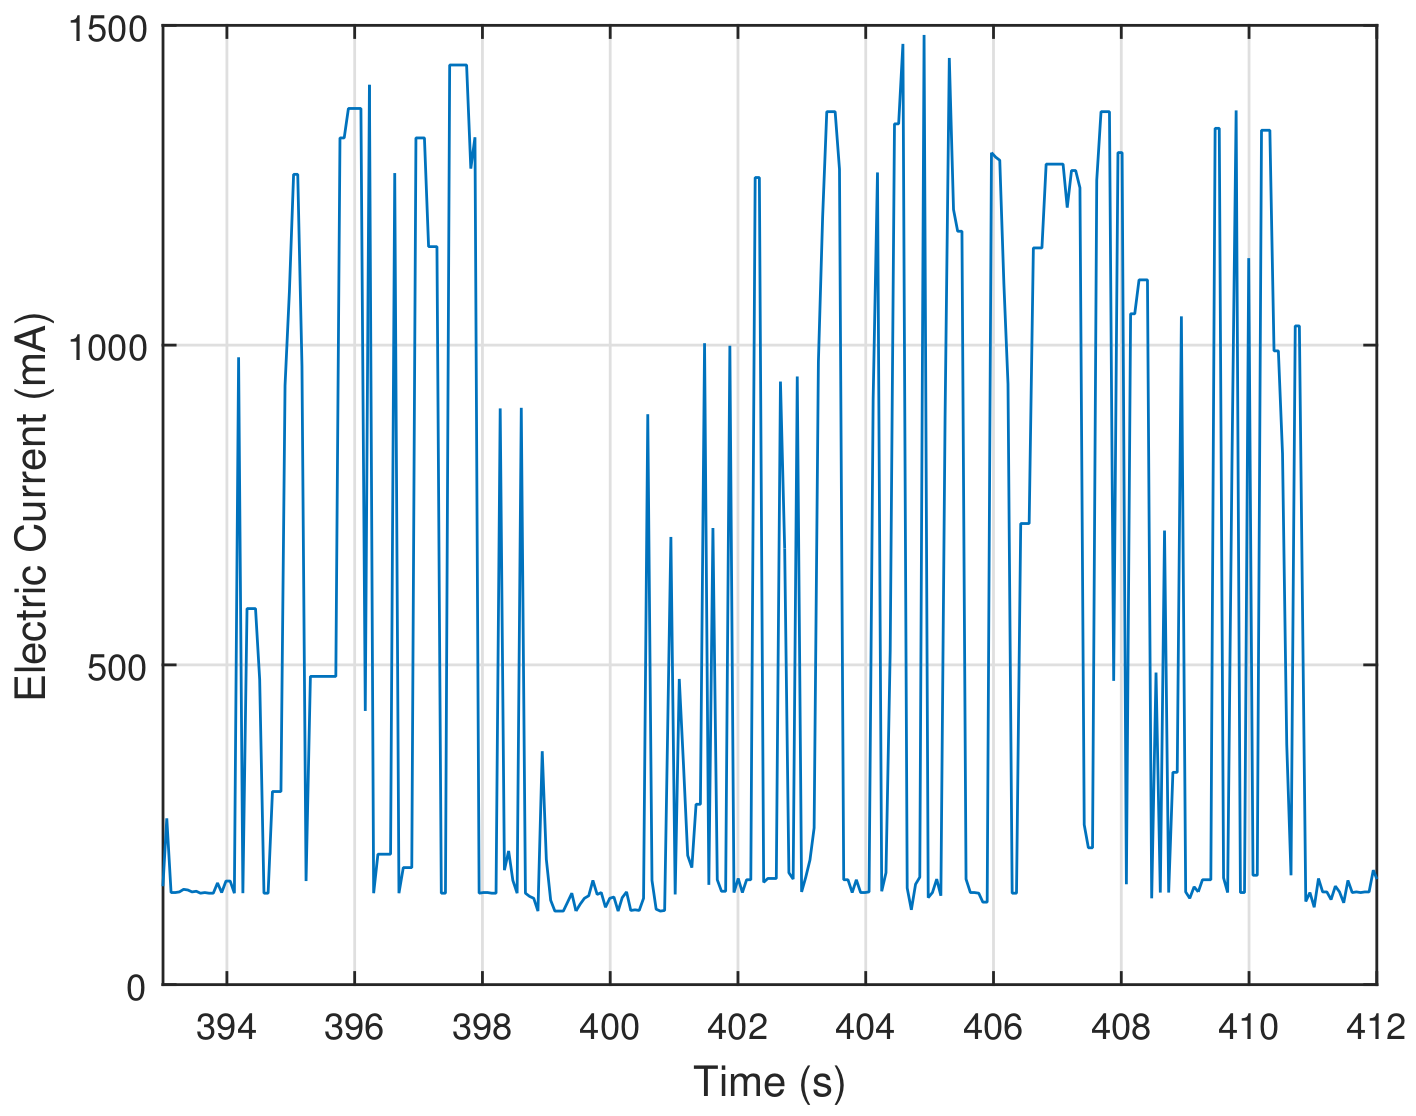
Using the electric current sensor INA219 installed between the battery and the electrical system, the Figure 11 shows the electric current provided by the battery. The results presented in the graph shows that the electric current drained is up to A.
6. Conclusions
The developed platform performed extremely well, not presenting any problems in recording or transmission of the data. The data acquired allows analyzing quantitatively and qualitatively the aircraft’s performance during the flight test. However, a few concerns and suggestions should be presented in order to guide possible future work.
There is a considerable influence of engine vibration on the data acquired. The aircraft structure and, therefore, the Pitot tube, is under mechanical vibrations generated by the engine’s rotation, which varies from 58 to 210 Hz. In order to analyze signals of frequencies lower than 210 Hz, a test is proposed in order to acquire the differential pressure sensor’s signal at a frequency higher than 420 Hz. This test would allow the identification of noises, so a proper filtering system could be developed to attenuate it. In order to perform this test, the sample rate can be increased using a data buffer. The authors suggest that a remote signal from the user should start the acquisition of samples for a fixed period and, after finishing, the data should be stored on the memory card.
After the vibration test, the authors suggest that an analog filter should be included in the sensor’s response. Digital filters could also be used, but only if the sampling frequency is twice as the filter’s cutoff frequency. Moreover, the sensor’s manufacturer suggests that a moving average should be applied with at least eight samples, reducing random errors.
Future studies are proposed to study the influence of temperature in the differential pressure sensor MPX7002DP. The maximum measuring error is established by the manufacturer considering variations of 5 °C. Knowledge of the temperatures’ influence would enable further systematic error reduction, increasing the sensor’s accuracy.
The Pitot tube positioning can also cause variances in the sensor’s response due to the influence of the aircraft’s structure in the air flow. The authors suggest a new experiment in a wind test tunnel with the Pitot tube installed in a wing. This would allow a comparison between the sensor’s response with and without the wing’s aerodynamic influence.
In order to analyze the error in orientation and altitude, the authors propose the use of a commercial flight controller to have reference measurements. The use of these data would allow the comparison of the results and the determination of the maximum error obtained by the developed platform.
Author Contributions
Conceptualization, T.D.S. and E.P.d.F.; Formal analysis, T.D.S.; Methodology, T.D.S.; Software, T.D.S.; Validation, T.D.S. and V.C.; Visualization, T.D.S.; Writing–original draft, T.D.S.; Writing–review & editing, T.D.S., E.P.d.F. and V.C.
Acknowledgments
The authors thank the financial support by the Brazilian Research Support Agencies CAPES and CNPq to develop this work. In addition, the authors thank the members of the team Pampa AeroDesign UFRGS who provided expertise that greatly assisted the research and flight time in a fixed-wing UAV.
Conflicts of Interest
The authors declare no conflict of interest.
Abbreviations
The following abbreviations are used in this manuscript:
| ADC | Analog-to-digital converter |
| FHSS | Frequency-Hopping Spread Spectrum |
| I2C | Inter-Integrated Circuit |
| IC | Integrated Circuit |
| ISM | Industrial, Scientific and Medical |
| MDPI | Multidisciplinary Digital Publishing Institute |
| MISO | Master Input Slave Output |
| MOSI | Master Output Slave Input |
| SCL | Serial Clock |
| SDA | Serial Data |
| SPI | Serial Peripheral Interface |
| SS | Slave Select |
| UART | Universal Asynchronous Receiver-Transmitter |
| UAV | Unmanned aerial vehicle |
Appendix A
Figure A1.
Electric Diagram of the Data Acquisition Board.

Figure A2.
Flowchart of the Data Acquisition Firmware.

References
- Kundu, A.K. Aircraft Design. In Aircraft Design; Shyy, W., Rycroft, M.J., Eds.; Cambridge University Press: New York, NY, USA, 2010; p. i. [Google Scholar]
- Stoliker, F.N. Pre-Flight Tests. In Introduction to Flight Test Engineering; RTO/NATO: Neuilly-sur-Seine, France, 2005; Volume 14, p. 5. [Google Scholar]
- International, S. SAE for Students. Available online: https://www.sae.org/students/ (accessed on 11 March 2018).
- Roskam, J.; Lan, C.T.E. Maneuvering and the Flight Envelope. In Airplane Aerodynamics and Performance; DARcorporation: Lawrence, KS, USA, 1997; pp. 581–585. [Google Scholar]
- Ojha, S.K. Altitudes, Airspeeds, and Wind Speeds. In Flight Performance of Aircraft; Przemieniecki, J.S., Ed.; American Institute of Aeronautics and Astronautics: Washington, DC, USA, 1995; pp. 175–185. [Google Scholar]
- Kish, B.A.; Rhoney, M.; Kimberlin, R.D.; Vuckovic, K.; Attarian, E. Wing Bug: A portable, low-cost flight test instrumentation system. In Proceedings of the 2017 IEEE Aerospace Conference, Big Sky, MT, USA, 4–11 March 2017; pp. 1–8. [Google Scholar]
- Kügler, M.E.; Holzapfel, F. Designing a safe and robust automatic take-off maneuver for a fixed-wing UAV. In Proceedings of the 2016 14th International Conference on Control, Automation, Robotics and Vision (ICARCV), Phuket, Thailand, 13–15 November 2016; pp. 1–6. [Google Scholar]
- Lesprier, J.; Biannic, J.M.; Roos, C. Modeling and robust nonlinear control of a fixed-wing UAV. In Proceedings of the 2015 IEEE Conference on Control Applications (CCA), Sydney, Australia, 21–23 September 2015; pp. 1334–1339. [Google Scholar]
- Bryson, M.; Sukkarieh, S. A comparison of feature and pose-based mapping using vision, inertial and GPS on a UAV. In Proceedings of the 2011 IEEE/RSJ International Conference on Intelligent Robots and Systems, San Francisco, CA, USA, 25–30 September 2011; pp. 4256–4262. [Google Scholar]
- Rodriguez, A.L.; Parrilla, L.M.; Simon-Muela, A.; Prats, M.M.; Querejeta, C.; de Blanes, F.G. Real time sensor acquisition platform for experimental UAV research. In Proceedings of the Digital Avionics Systems Conference, Orlando, FL, USA, 23–29 October 2009; pp. 5.C.5-1–5.C.5-10. [Google Scholar]
- Schmitz, G.; Alves, T.; Henriques, R.; Freitas, E.; El’Youssef, E. A simplified approach to motion estimation in a UAV using two filters. IFAC PapersOnLine 2016, 49, 325–330. [Google Scholar] [CrossRef]
- Goncalves, E.S.; Rosa, P.F.F. Sensor fusion with cointegration analysis for IMU in a simulated fixed-wing UAV. In Proceedings of the 2017 International Conference on Military Technologies (ICMT), Brno, Czech Republic, 31 May–2 June 2017; pp. 493–499. [Google Scholar]
- Tang, H.; Shen, Z. An attitude estimate method for fixed-wing UAV s using MEMS/GPS data fusion. In Proceedings of the 2017 First International Conference on Electronics Instrumentation Information Systems (EIIS), Harbin, China, 3–5 June 2017; pp. 1–5. [Google Scholar]
- Marantos, P.; Koveos, Y.; Kyriakopoulos, K.J. UAV State Estimation Using Adaptive Complementary Filters. IEEE Trans. Control Syst. Technol. 2016, 24, 1214–1226. [Google Scholar] [CrossRef]
- Rowberg, J. MPU6050 Library Repository. Available online: https://github.com/jrowberg/i2cdevlib/tree/master/Arduino/MPU6050 (accessed on 25 August 2017).
- ArduPilot. SiK Library Repository. Available online: https://github.com/ArduPilot/SiK (accessed on 25 November 2017).
- Greiman, B. SdFat Library Repository. Available online: https://github.com/greiman/SdFat (accessed on 2 October 2017).
- Sminghub. BMP180 Library Repository. Available online: https://github.com/SmingHub/SmingRTOS/tree/master/sming/libraries/BMP180 (accessed on 10 May 2017).
- Adafruit. Adafruit-INA219 Library Repository. Available online: https://github.com/adafruit/AdafruitINA219 (accessed on 10 October 2017).
Figure 1.
Fixed-wing UAV used as a reference to the project requirements’ specification.

Figure 2.
Principal components attached to the main microcontroller.

Figure 3.
Resolution of the airspeed measurement using the sensor MPXV7002DP and microcontroller ATmega328.
Figure 3.
Resolution of the airspeed measurement using the sensor MPXV7002DP and microcontroller ATmega328.

Figure 4.
(a) Pitot tube (in the left) attached to the MPX7002DP differential pressure sensor. Pitot tube (in the right) attached to the differential pressure manometer used as reference. (b) Differential pressure manometer based on fluid mechanisms having airspeed marks.
Figure 4.
(a) Pitot tube (in the left) attached to the MPX7002DP differential pressure sensor. Pitot tube (in the right) attached to the differential pressure manometer used as reference. (b) Differential pressure manometer based on fluid mechanisms having airspeed marks.

Figure 5.
(a) Calibration curve of the airspeed measurement using the sensor MPXV7002DP and microcontroller ATmega328. (b) Confidence interval on the mean based on 95% confidence interval, using a t-Student distribution.
Figure 5.
(a) Calibration curve of the airspeed measurement using the sensor MPXV7002DP and microcontroller ATmega328. (b) Confidence interval on the mean based on 95% confidence interval, using a t-Student distribution.

Figure 6.
Data Acquisition Board.

Figure 7.
Pressure field distribution around a generic airfoil [1].
Figure 7.
Pressure field distribution around a generic airfoil [1].

Figure 8.
The fixed-wing UAV used for testing with a Pitot tube installed ahead of the leading edge.
Figure 8.
The fixed-wing UAV used for testing with a Pitot tube installed ahead of the leading edge.

Figure 9.
(a) Airspeed of the fixed-wing UAV during the takeoff. (b) Altitude of the fixed-wing UAV during the takeoff.
Figure 9.
(a) Airspeed of the fixed-wing UAV during the takeoff. (b) Altitude of the fixed-wing UAV during the takeoff.

Figure 10.
(a) Roll angle of the fixed-wing UAV during the takeoff. (b) Pitch angle of the fixed-wing UAV during the takeoff.
Figure 10.
(a) Roll angle of the fixed-wing UAV during the takeoff. (b) Pitch angle of the fixed-wing UAV during the takeoff.

Figure 11.
Electric current provided by the battery during the flight.


Table 1.
Sensors contained in each module.
| GY-80 | GY-87 | GY-91 | |
|---|---|---|---|
| Accelerometer | ADXL345 | MPU6050 | MPU6500 |
| Gyroscope | L3G4200D | MPU6050 | MPU6500 |
| Magnetometer | HMC5883L | HMC5883L | AK8963 |
| Barometer | BMP085 | BMP180 | BMP280 |
Table 2.
List of components included in PAD.
| Legend | Component |
|---|---|
| A | Electric Current Sensor (INA219) |
| B | Conector for Differential Pressure Sensor (MPX7002DP) |
| C | Auxiliar Button |
| D | Arduino Nano |
| E | Sinalization LED |
| F | SD Card Reader and Writter Module |
| G | Conector for Radio Frequence Module |
| H | Module GY-87 (BMP180 and MPU6050) |
| I | Conector for Measuring Electric Current |
| J | Conector for Power Supply |
| K | Voltage Regulator for Radio Frequency Module |
Table 3.
Time of tasks performing
| Task | Time (s) |
|---|---|
| Readings of Pitch and Roll from MPU6050 | 784 |
| Readings of Differential Pressure from MPX7002DP | 116 |
| Readings of Absolute Pressure from BMP180 | 15,428 |
| Readings of Electric Current from INA219 | 2032 |
| Storing Data on a SD Card | 3032 |
| Transmitting Data through RF | 1744 |
| Creating a new file on a SD Card | 512,100 |
| Closing a file on a SD Card | 22,792 |
© 2018 by the authors. Licensee MDPI, Basel, Switzerland. This article is an open access article distributed under the terms and conditions of the Creative Commons Attribution (CC BY) license (http://creativecommons.org/licenses/by/4.0/).
Share and Cite
MDPI and ACS Style
Dapper e Silva, T.; Cabreira, V.; De Freitas, E.P. Development and Testing of a Low-Cost Instrumentation Platform for Fixed-Wing UAV Performance Analysis. Drones 2018, 2, 19. https://doi.org/10.3390/drones2020019
AMA Style
Dapper e Silva T, Cabreira V, De Freitas EP. Development and Testing of a Low-Cost Instrumentation Platform for Fixed-Wing UAV Performance Analysis. Drones. 2018; 2(2):19. https://doi.org/10.3390/drones2020019
Chicago/Turabian StyleDapper e Silva, Tulio, Vinicius Cabreira, and Edison Pignaton De Freitas. 2018. "Development and Testing of a Low-Cost Instrumentation Platform for Fixed-Wing UAV Performance Analysis" Drones 2, no. 2: 19. https://doi.org/10.3390/drones2020019