Article

Tensile Properties, Fracture Mechanics Properties and Toughening Mechanisms of Epoxy Systems Modified with Soft Block Copolymers, Rigid TiO2 Nanoparticles and Their Hybrids

Institut für Verbundwerkstoffe GmbH (IVW), University of Kaiserslautern, Erwin-Schrödinger-Strasse, Building 58, 67663 Kaiserslautern, Germany
*
Author to whom correspondence should be addressed.
Current address: Bordeaux INP, University of Bordeaux, CNRS, Laboratoire de Chimie des Polymères Organiques (LCPO), UMR 5629, ENSCBP, 16 Avenue Pey-Berland, F-33607 Pessac CEDEX, France.
J. Compos. Sci. 2018, 2(4), 72; https://doi.org/10.3390/jcs2040072
Submission received: 31 October 2018 / Revised: 10 December 2018 / Accepted: 13 December 2018 / Published: 18 December 2018

Abstract

:
The effect of the hybridization of a triblock copolymer and a rigid TiO2 nanofiller on the tensile, fracture mechanics and thermo-mechanical properties of bisphenol F based epoxy resin were studied. The self-assembling block copolymer, constituted of a center block of poly (butyl acrylate) and two side blocks of poly (methyl) methacrylate-co-polar co-monomer was used as a soft filler, and TiO2 nanoparticles were employed as rigid modifiers. Toughening solely by block copolymers (BCP’s) led to the highest fracture toughness and fracture energy in the study, KIc = 2.18 MPa·m1/2 and GIc = 1.58 kJ/m2. This corresponds to a 4- and 16-fold improvement, respectively, over the neat reference epoxy system. However, a reduction of 15% of the tensile strength was observed. The hybrid nanocomposites, containing the same absolute amounts of modifiers, showed a maximum value of KIc = 1.72 MPa·m1/2 and GIc = 0.90 kJ/m2. Yet, only a minor reduction of 4% of the tensile strength was observed. The fracture toughness and fracture energy were co-related to the plastic zone size for all the modified systems. Finally, the analysis of the fracture surfaces revealed the toughening mechanisms of the nanocomposites.

1. Introduction

Epoxy resins are a class of highly cross-linked thermoset polymers used in a wide range of applications, e.g. automotive, aerospace, electronics, adhesives. They exhibit a very good high-temperature performance, high strength, high modulus, and low creep. At the same time, the high crosslink density makes them inherently brittle materials as they are unable to resist crack initiation and propagation effectively, i.e. epoxies have a low fracture toughness.
The fracture energy can be increased by adding different modifiers to the epoxy resin, e.g. carboxyl-terminated butadiene acrylonitrile (CTBN), which can phase separate in micron-sized domains into the epoxy and increase its toughness, however with a loss of strength and a deterioration of the thermal properties [1,2]. Nevertheless, these materials are unfavorable to strength and thermo-mechanical properties of epoxy, especially, the glass transition temperature Tg [3]. A newer generation of modifiers were preformed core-shell rubber particles (CSR). They consist of a rubbery core and a resin suited shell material, which is only a few nanometers thick. These modifiers incorporate the toughening mechanisms of rubber based modifiers, e.g. cavitation, plastic void growth and subsequent shear yielding [4] together with a good adherence to the matrix, due to a modified shell material [5]. The newest generation of adaptable modifiers are block copolymers (BCP) [6]. They can be termed as an improved type of CSR and are made of at least two chemically different constituents that form tailored, e.g. diblock, triblock, and alternating copolymers [7]. The modification of epoxy by BCP can benefit from the ability to obtain a variety of different nano-sized structures, such as spherical and cylindrical micelles, vesicles and other different types of morphologies [7,8], without using any kind of special dispersion processes. BCPs, thermodynamically driven, self-assemble into the epoxy resin either prior to curing [9,10], during the curing process, due to a reaction induced phase separation mechanism [11,12,13], or in combinations therefrom [14,15]. Dean et al. [16] investigated the toughening effect of diblock copolymers in bisphenol A based epoxy resin cured by a tetrafunctional aromatic amine. They reported nano-sized spherical BCP micelles and vesicles as dominating second phases. The obtained phases remarkably increase the fracture toughness, even at low BCP concentrations. In contrast, totally different structures of triblock copolymer (ABA) toughened bisphenol A based epoxy in the nano-range were reported by Kishi et al. [17], who quantified the morphology and respective fracture mechanics properties. Spherical micelles, cylindrical micelles and curved lamellae were generated, and the highest fracture toughness was obtained by cylindrical structures. These studies show the variability of the nanostructures of epoxy BCP composites and the related fracture toughness. Various studies explained that the BCP morphology, and thus the fracture mechanics properties of epoxy BCP systems depends on the BCP-block composition [18], the molecular weight of the immiscible block [9], the length of the BCP [10,19], the curing agent [20], and the curing process [21]. By controlling these variables, the epoxy modified BCP composite microstructure, and further the fracture mechanics properties, can be modified [16,18,19,22,23,24,25,26].
The addition of rigid fillers like multiwall carbon nanotubes (MWCNT’s) [24], TiO2 [27], Al2O3 [28], Glass beads [29], and SiO2 [30,31,32] can improve the strength and modulus of epoxy nanocomposites, while also increasing fracture toughness, yet without affecting the glass transition temperature of the nanocomposites. However, the toughening effect is moderate as compared to liquid rubber. The hybrid toughening was first adapted by Kinloch et al. [33] while trying to restore the lost stiffness caused by the application of rubber modification. Since then, several researchers have started examining many combinations of different sized particles for hybrid toughening and in some cases synergies were found between two different modifiers [22,31,32,34], and in some cases no synergy was observed [24].
It can be inferred that much work was reported for fracture mechanics and toughening mechanisms of block copolymers with a bisphenol A based epoxy system. However, limited work was reported for the modification of bisphenol F with block copolymers. The main motivation behind selecting a bisphenol F based epoxy resin is due to their slightly higher functionality, which led to more reaction sites, ultimately resulting in a high crosslink density and dense three-dimensional network formations after curing with a suitable hardener system [35]. Moreover, due to the absence of the methyl group, the viscosity of the bisphenol F based epoxy resins is lower than that of bisphenol A based epoxy resins [35,36], hence enabling the system to handle higher filler loadings. The following key research questions are addressed in this study: (a) To which extent can the bisphenol F based epoxy system be toughened by block copolymers, TiO2 nanoparticles and their hybrids? (b) To which extent and in which way do BCP, TiO2, and their hybrids affect or alter other mechanical properties e.g., stiffness, strength, and viscoelastic properties of the epoxy system? (c) Which tangible relationships between matrix toughness, other mechanical properties and the material’s structural features (morphology) can be derived for nanocomposites? To answer these questions the following steps were taken: (i) Detailed examinations of mechanical, fracture mechanical, thermal and visco-elastic properties of the epoxy matrix modified with BCP’s, TiO2 and their hybrids. (ii) Systematic variations of BCPs and TiO2 particles’ concentrations will be performed for gaining insight into mechanical and fracture performance. (iii) Characterization of material properties and morphologies.

2. Materials and Methods

In the present work, Epikote Resin 862 (diglycidyl ether of bisphenol F) liquid epoxy resin produced by Hexion Inc (Columbus, OH, USA), a low viscosity, liquid epoxy resin manufactured from epichlorohydrin and bisphenol F was used [36], which has an epoxy equivalent weight (EEW) of 169 g·eq−1. The curing agent used was Ethacure 100, an aromatic amine supplied by Albemarle (Charlotte, NC, USA). The resin and hardener were used in the ratio of 100:27. The poly [(methyl methacrylate-co-polar comonomer]-b-poly (butyl acrylate] (PMMA-b-PBuA-b-PMMA) tri-block copolymer (BCP) M52N was supplied as powder by Arkema (Colombes, France). The BCP concentration was varied systematically from 2 to 12 wt %. The second toughening agent was titanium dioxide (TiO2, type Aeroxide P25, Evonik, Essen, Germany) which possesses a primary particle diameter of ca. 21 nm, a density of 4.23 g/cm3, and a specific surface area of 35–65 m2/gm [37]. The interfacial area may influence the properties of nanocomposites, so it is necessary to ensure the proper distribution of nano titanium dioxide and to avoid agglomerates in the epoxy resin. This was performed by utilizing machines traditionally used for lacquer processing (Torus Mill, Figure 1a). A Dissolver provides high shear forces to break up the agglomerates in the liquid epoxy/agglomerate mixture by the rotation of teeth vested metal discs [38] (Figure 1b). A masterbatch was produced containing a high weight fraction of nanofillers (25 wt %).
After dispersing, the masterbatch was thinned down by neat epoxy resin in order to systematically gain nanocomposites with varying nanoparticle contents ranging from 3 to 7 wt %. Preparation of BCP nanocomposites takes fewer efforts compared to those containing inorganic nanoparticles. Firstly, the required amount of BCP was mixed gently with preheated epoxy resin and the mixture was dispersed (Dispermat, Getzmann GmbH, Reichshof, Germany) at 90 °C until a transparent mixture was obtained ensuring complete melting of BCP in the epoxy as shown in Figure 1c. After that, the modified epoxy was cooled down to 55 °C and mixed with a stoichiometric amount of curing agent by stirring for 5–10 min at 350 rpm. For preparing hybrid mixtures, the masterbatch containing nano TiO2 (25 wt %) was thinned down and stirred at 650 rpm for 50 min at 80 °C while removing entrapped air by vacuum. Then, the calculated amount of BCP was added and mixed for 30 min at 350 rpm.
Finally, the stoichiometric amount of curing agent was added, and the mixture was stirred thoroughly for 5–10 min at 350 rpm. The mixture was then casted into glass molds to produce tensile samples and into steel molds for compact tension (CT) specimens, respectively. The samples were cured in two steps at 80 °C for 4 h and at 120 °C for 18 h.
A total number of 13 different systems were prepared as shown in Table 1. In notation (EP_x Y) EP denotes the reference bisphenol F based epoxy system cured with amine hardener, and x represents the wt % used, and Y represents modifier (BCP or TiO2 or both).

2.1. Differential Scanning Calorimetry

Differential scanning calorimetry (DSC) was performed on a Mettler-Toledo DSC1 STAR® system (Giessen, Germany) to determine the glass transition temperature (Tg) of the epoxy systems. Firstly, the cured sample material was weighed (~7–13 mg) and placed in a crucible. In the first cycle, the sample was heated from room temperature up to 200 °C, then, after cooling the sample down to room temperature, heated up again in a second cycle to 200 °C with a heating rate of 10 °C/min.

2.2. Rheometric Measurement

Rheological measurements were performed in the temperature range 40–100 °C on a Rheometric Scientific ARES parallel plate rheometer (TA Instruments, New Castle, DE, USA) using a dynamic temperature ramp test at a ramp rate of 5 °C/min, a frequency of 62.8 rad/s and 45 mm diameter parallel plates separated at a distance of 0.6 mm. The sample was equilibrated for 1 min of time at 100 °C to ensure temperature uniformity in the material.

2.3. Dynamic-Mechanical Thermal Analysis

In the present study, the storage modulus, the loss modulus, and the mechanical damping tan δ of all the bulk samples were measured by dynamic mechanical thermal analysis using a Q800 V7.5 Build 127 DMTA machine from TA Instruments in a 3 point bending mode operating at a frequency of 1 Hz, on specimens with dimensions of 60 mm in length, 10 mm in width, and 4 mm in thickness. The glass transition temperature Tg of the bulk epoxy samples was determined by the peak value of tan δ. The temperature range was set from −120 °C to 200 °C with a heating rate of 2 °C/min.

2.4. Mechanical Properties
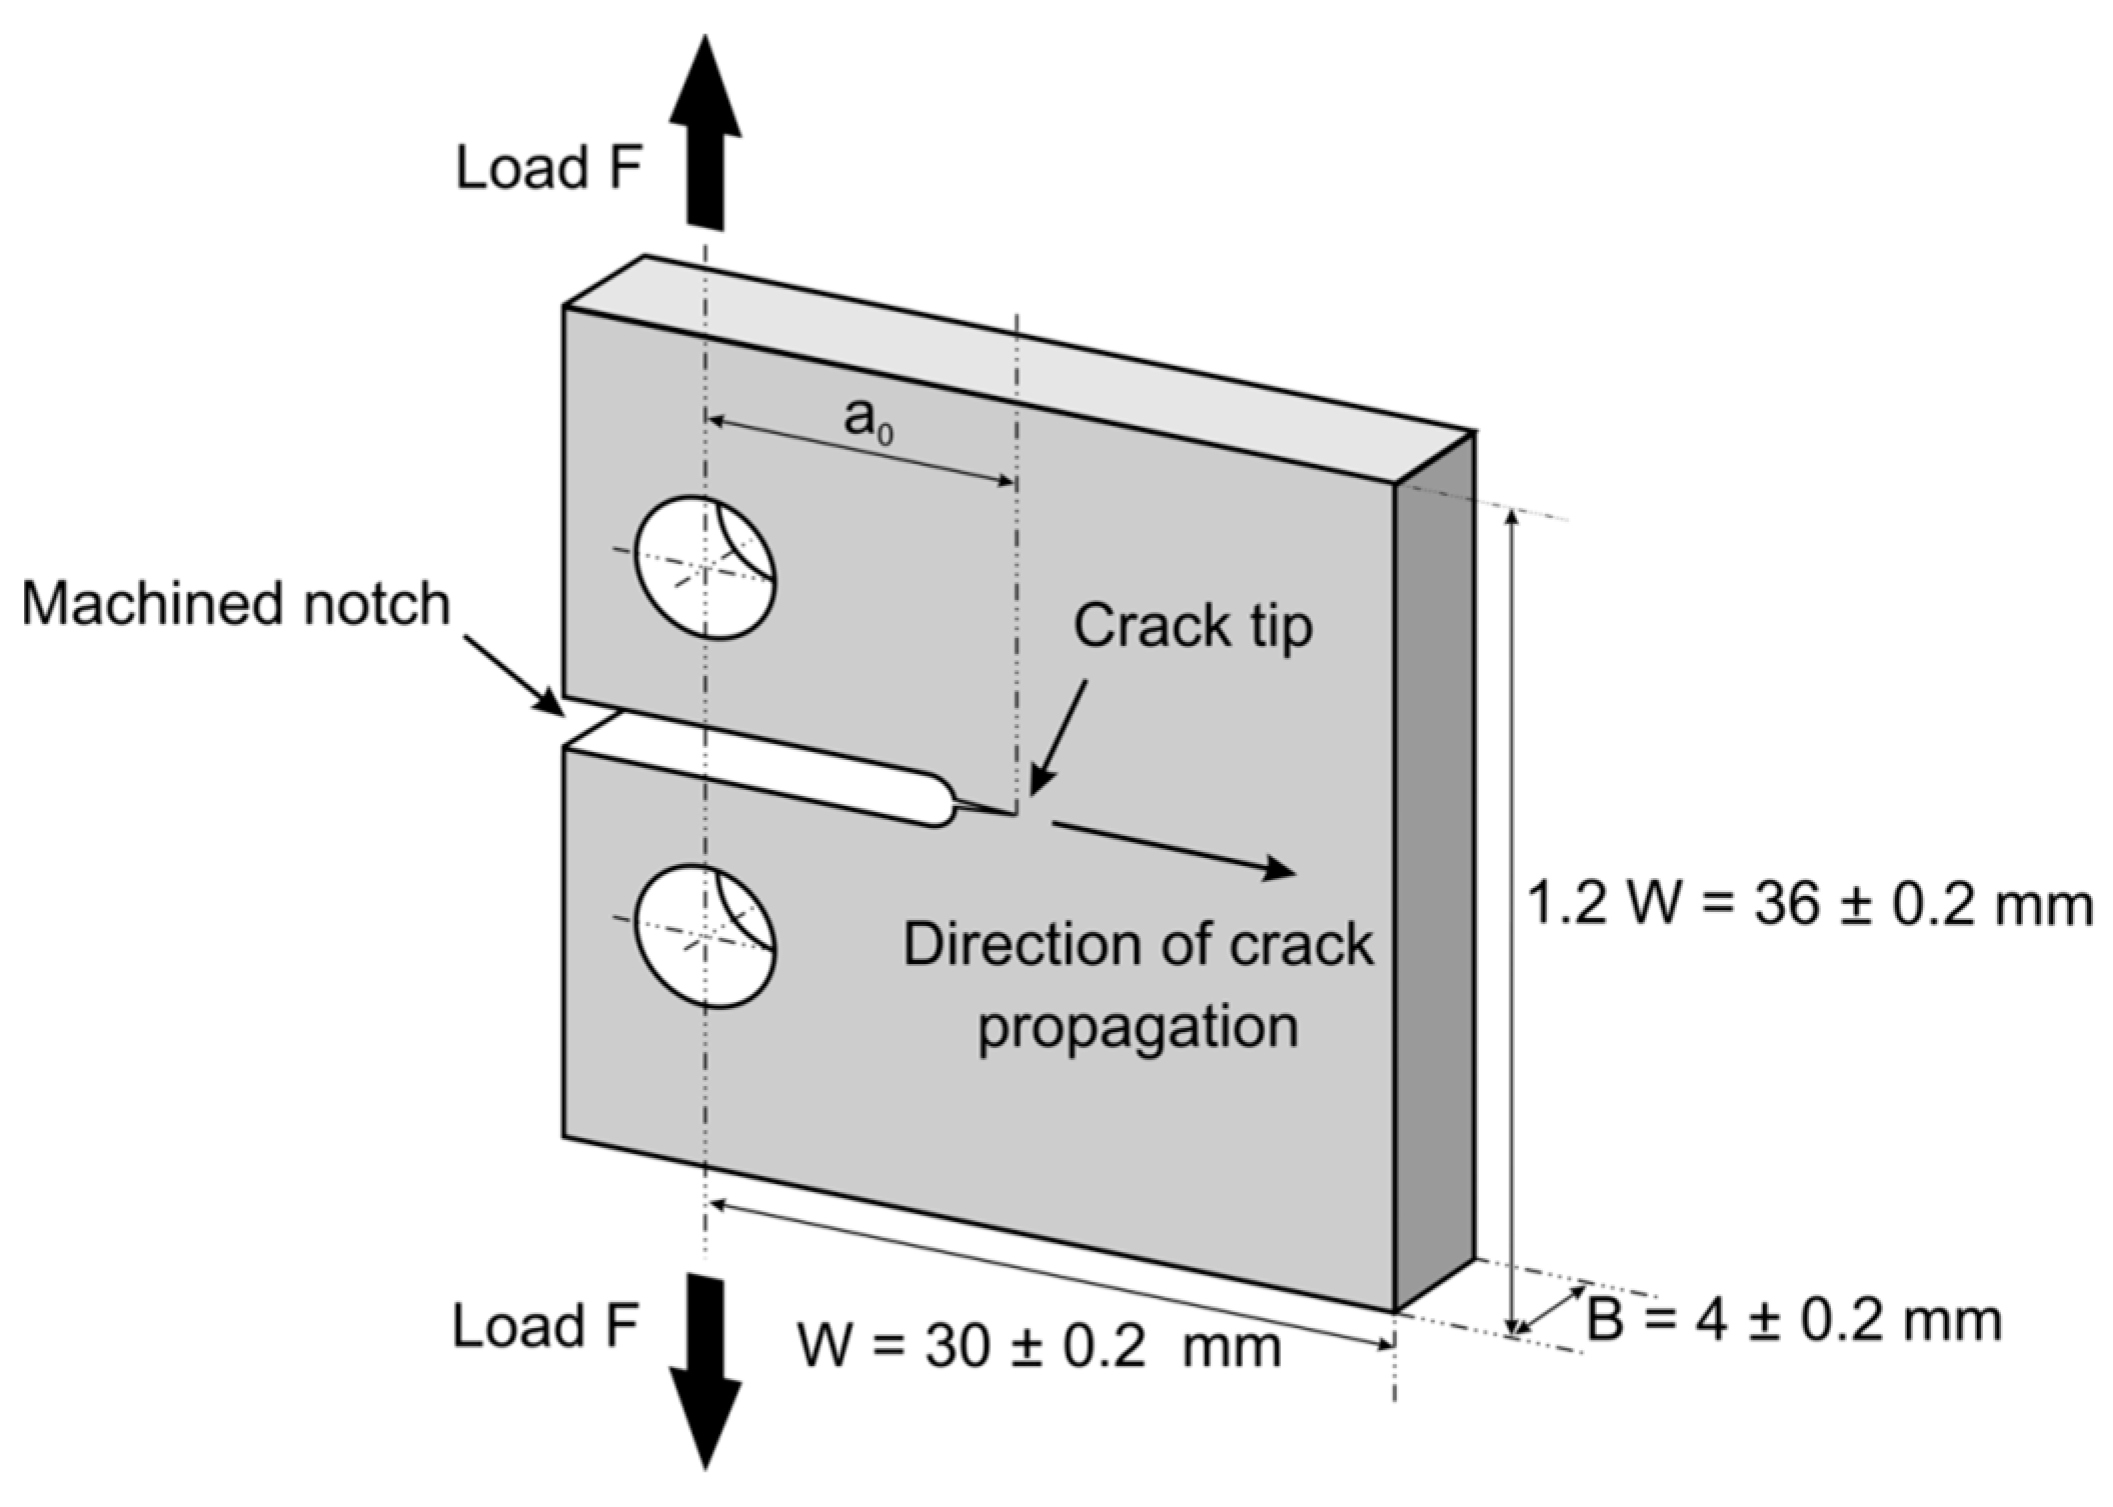
Tensile tests were conducted at 23 °C on a universal testing machine (Zwick 1474, Zwick Roell AG, Ulm, Germany) in a tensile configuration according to standard DIN EN ISO 527-2. Dog-bone shape (ISO 527-2 type 1B) machined samples were used. The testing speed was chosen to be 2 mm/min with a 10 kN load cell, a precision sensor-arm extensometer was used to determine the specimen strain.

2.5. Fracture Test

Linear elastic fracture mechanics (LEFM) allows measuring the intrinsic fracture toughness of brittle solids [40]. Independent of the specimen geometry LEFM provides information about the initiation of cracks in epoxy nanocomposites. The plane strain fracture toughness (KIc) of the composites was determined experimentally at 23 °C by using compact tension (CT) samples (Figure 2) under tensile loading conditions according to the ISO 13586 and at strain rate of 0.2 mm/min. The thickness B and the width W of specimens were chosen to be 4 and 30 mm, respectively. These samples were tested in a universal testing machine (Zwick 1474, Zwick Roell AG, Ulm, Germany). Prior to testing, a notch was machined and then sharpened by tapping a fresh razor blade into the material, so that a sharp crack was initiated with a length ao (0.45·Wao ≤ 0.55·W). The fracture toughness KIc was then calculated by Equation (1), where F is the maximum force observed in the load-displacement curve, and ao is the initial crack length for calculating α = a/W and f(a/W) as follows [41]
K I c =   F B W   · f ( a / W )
f ( a W ) = f ( α ) =   ( 2 + α )   ( 1 α ) 3 / 2   · ( 0.866 + 4.64 α 13.32 α 2 +   14.72 α 3   5.60 α 4 )
The knowledge of the critical stress intensity factor KIc, the elastic modulus Et and Poisson’s ratio ν (~0.35) [42] allows calculating the critical energy release rate GIc
G I c = K I c 2 ( 1   υ 2 ) E t

2.6. Microscopy Studies

The fractured surfaces of the CT tested nanocomposites were studied with the help of a field emission scanning electron microscope (SEM SUPRATM 40 VP, Carl Zeiss NTS GmbH, Oberkochen, Germany). Before scanning, the surfaces of the samples were sputtered with a thin layer of gold and platinum for 70 sec using a sputtering device (SCD-050, Oerlikon Balzers, Bingen, Germany). An atomic force microscope (AFM) was used to determine the morphology of the bulk material. In the present work, Multimode AFM (MMAFM-2)/Serial nos. 7410 with Nanoscope 3a controller and Nanoscope® 3a software version 5.31R1 from Digital instruments/ Hysitron (Minneapolis, MN, USA) was used which has a lateral resolution of 2 nm, vertical resolution of 2 nm, a x/y scan range of 0.3–120 μm and a z scan range of 0–5 μm. In the present work, AFM was performed in tapping mode to obtain the morphology of epoxy nanocomposites. A smooth surface of the samples was obtained using power microtome. The phase and height images were captured at 512 × 512-pixel resolution and scan speed of 1 Hz was selected.

2.7. White Light Profilometry

A white light profilometer (FRT MicroProf, FRT GmbH, Bergisch Gladbach, Germany) was employed to measure the surface roughness of fractured compact tension samples in non-contact mode. It had a lateral resolution of 1 μm, the vertical resolution of 3 nm, x/y scan range of 100 × 100 mm and z-scan range of 3 mm.

3. Results and Discussion

3.1. Glass Transition Temperature and Viscoelastic Properties
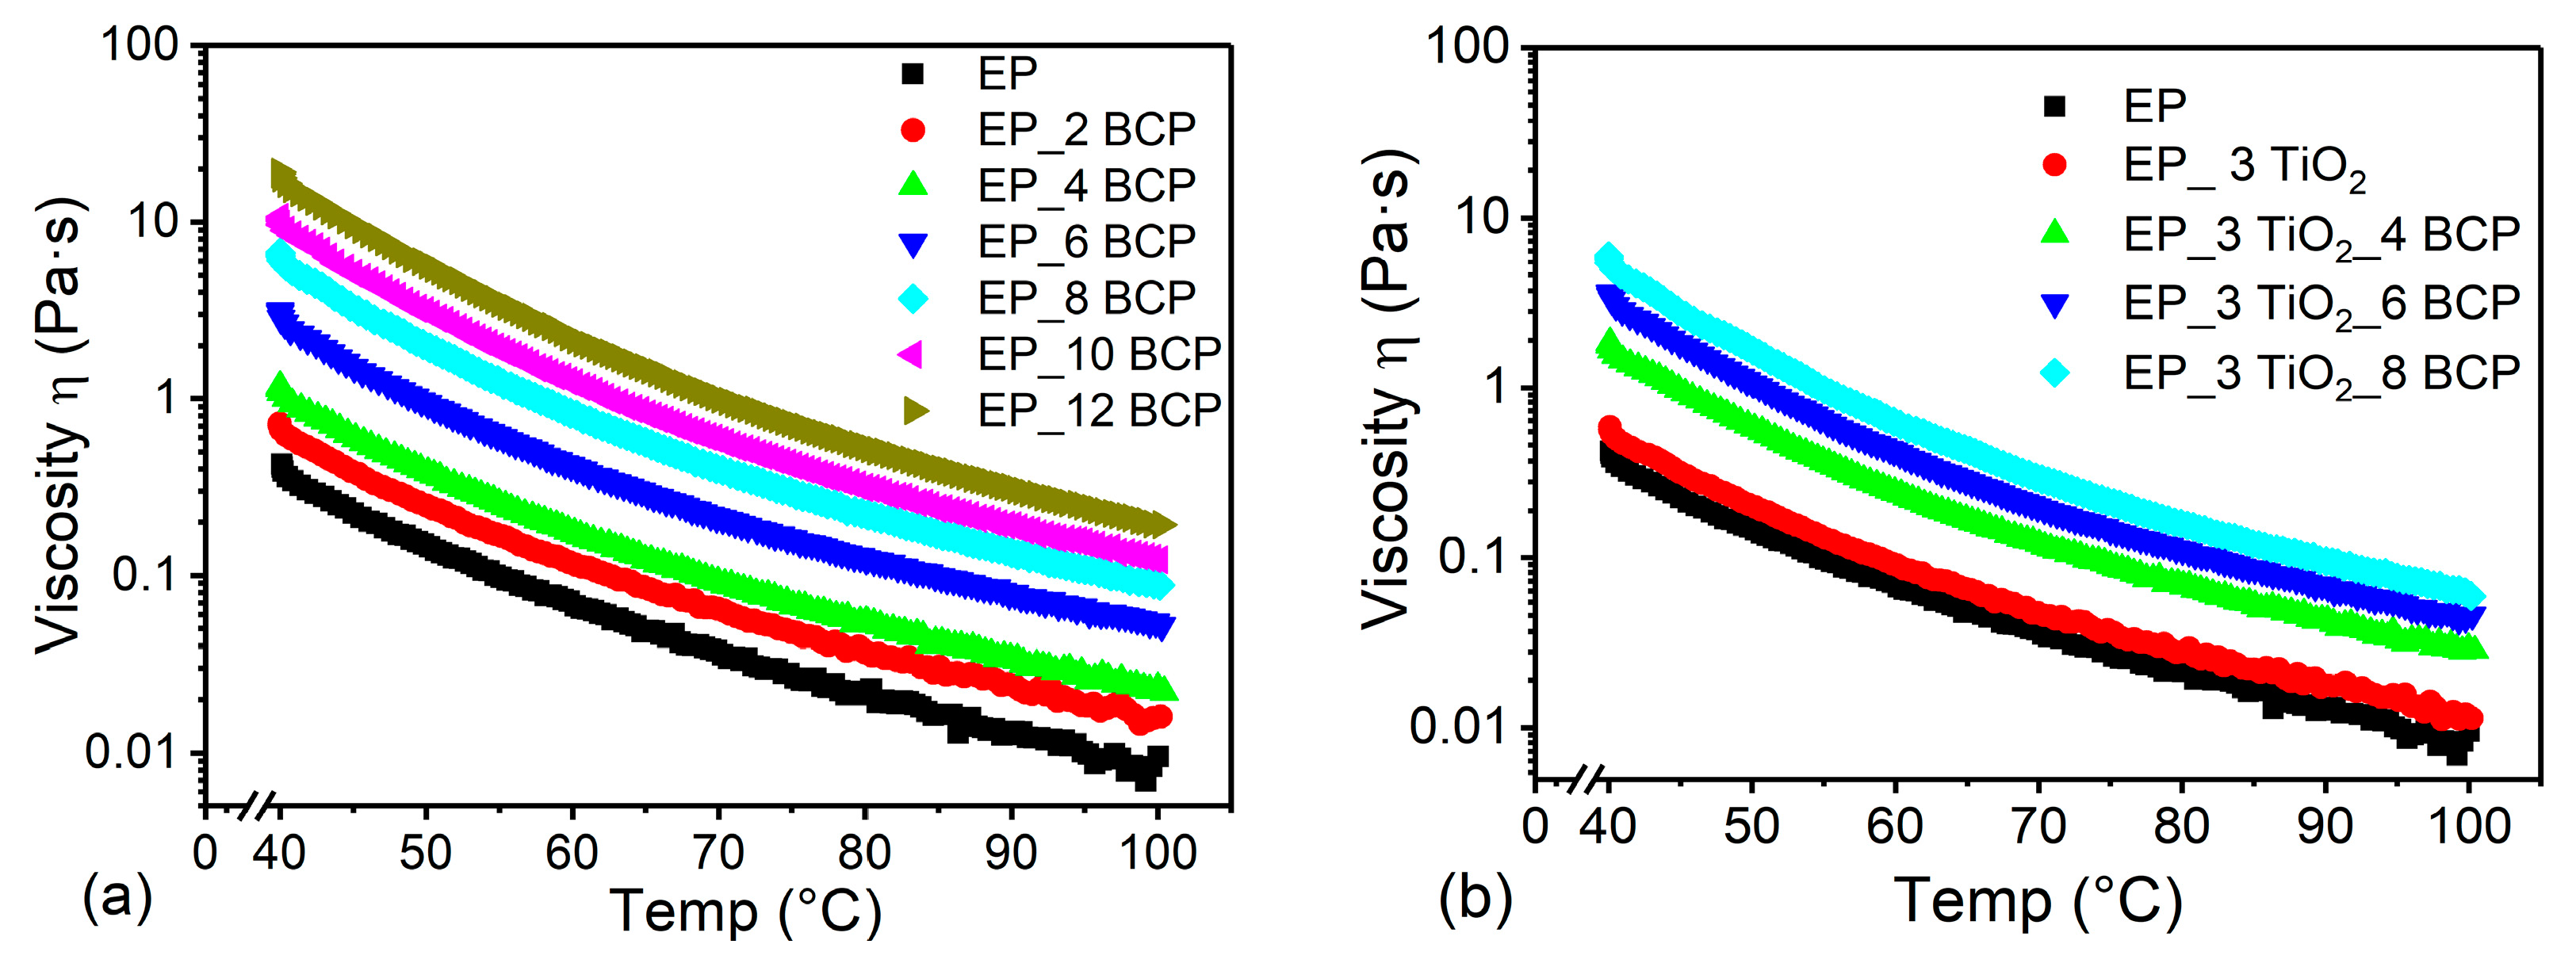
The glass transition temperature (Tg) was determined using DSC and dynamic mechanical analysis (DMA) (tanδ curve) and the results are summarized in Table 2. However, there was a slight difference between the Tg values due to the difference in the principle of measurement for DSC and DMA plus the difference in the heating rate with a variation of 3 °C. Although, this difference was small, which may be due to the use of a long post cure cycle (18 h at 120 °C) in the present work. In longer cured epoxy systems, the rate of reaction was much slower and unreacted polymer chains have sufficient time to orient themselves to the correct position for the crosslinking reaction to occur properly. Addition of BCP does not have any drastic effect on the glass transition temperature of the composites. For EP_BCP systems the minor change in Tg was attributed to the formation of nanostructures in the composites [15], and another reason may be the smaller wt % of the BCP in the resulting composite systems [18,19,25]. For EP_TiO2 modified systems, the Tg was measured as 138 °C which was higher than the unmodified system. The increase in Tg was expected if the interaction between the polymer and nanoparticles were strong which restricts the mobility of the matrix and this restriction can be overcome by the increase in temperature. Additionally, Baller et al. [43] showed that interaction between coated silica nanoparticles and epoxy matrix was relatively weak at all the stages of curing process. However, the TiO2 nanoparticles were used in pristine form as supplied by Evonik Industries (Essen, Germany) without any further surface treatment.
The M52N block copolymer have the PMMA and PbuA blocks, and they self-assemble into different morphologies in the epoxies depending on the concentration of BCP. Hence, the Tg of the nanostructured epoxies may be affected by the fraction content of the sub-chains of the block copolymers and their compatibility. The M52N BCP has a higher fraction content of the PMMA block [44], as M52N was triblock MAM with two blocks of PMMA. As expected, with the addition of the BCP particles, the elastic component of the modulus (storage module) decreased. The storage modulus of EP_12 BCP at 200 °C was 47% lower than reference EP system (E’ = 27.27 MPa) with a value of 14.50 MPa. No macro phase separation of the epoxy miscible PMMA block was found in the results of the DMA till 12 wt % of BCP, as shown in Figure 3a. Small shoulders were observed next to the main α-relaxation of the epoxies on the tanδ curves of the EP_12BCP modified epoxies, and a similar shoulder was not observed on the tanδ curve of the unmodified epoxy. These shoulders represent the micro-phase separation of the PMMA block that occurred in the M52N modified epoxy during the polymerization process, because the α-relaxation of PMMA has been reported to be in the same temperature range (about 100 °C) as the small shoulders [19,20,26]. The main relaxation around 132 °C was associated with the glass transition temperature of the epoxy-rich phase, where larger segments of the polymer become mobile. The β-transition peak (Tβ) was observed at ca. −69 °C. The shift of this relaxation to a lower temperature compared to the one of the neat EP_H1 network (ca. −45 °C) indicates a plasticization effect induced by the incorporation of PbuA blocks in the epoxy network. The same phenomena has already been observed for miscible diglycidyl ether of bisphenol A and 4,4′-methylenebis-[3-chloro2, 6diethylaniline]/homo PMMA blends [20].
The DMA results show a shift of the peak in mechanical damping (tanδ) towards higher temperatures, e.g., from 132 °C (epoxy) to ~138 °C in the case of EP_3 TiO2, Figure 4a. The storage modulus curve observes major changes in the temperature range (−120 to −50 °C) due to the addition of TiO2. In the temperature zone (75 to 150 °C) the TiO2 modified curve shifts towards a higher temperature indicating a higher Tg as compared to the reference system (see Figure 4b). It indicates that the storage modulus increases almost in the same proportion, along this temperature range irrespective of the shift in the β-transition to higher temperature in case of particle filled resins.
For hybrid systems, the storage modulus curve shows that for EP_3TiO2_4BCP system, the storage modulus value was higher in the glassy region and glass transition zone as compared to EP_H1 system, and as the amount of BCP was increased, the value of storage modulus decreased (see Figure 4d). The nanoparticles induce a higher stiffness on the epoxy resin, and on the other hand, they induce new mechanisms of energy dissipation, as filler/filler and filler/matrix friction, which were suggested as main reasons for mechanical damping in composites systems [45]. In the elastic zone (50 to 140 °C), damping of the neat epoxy was higher than the damping of nanocomposites. In this stage, the macromolecules start to move. The particles hinder the movement of the polymer chains resulting in lower energy dissipation. Moreover, it is vice versa in the rubbery state (140 to 200 °C) due to the reinforcement effect of nanoparticles on the matrix.

3.2. Rheology

Viscosity plays an important role while manufacturing the epoxy nanocomposites and especially when using the filament-winding technique. If it was lower or higher than the permissible values, the resin may flow excessively, leaving some fibers incompletely wetted or it may generate high resistance to the resin flow. In general, when a second phase was introduced to the epoxy resin, there will be an increase in the viscosity. As expected, from the graph shown, it was evident that there was a gradual increase in the viscosity with the increase of BCP, rigid nanoparticles and hybrids content. This was because the particles present in the system tend to offer a resistance to the resin flow, owing to increase in the viscosity. The viscosity of pure epoxy was 0.0647 Pa·s at 60 °C and the addition of 8 wt % of M52N block copolymers raised the viscosity to 2.488 Pa·s at the same temperature of 60 °C (see Figure 5a). Whereas in the hybrid composites, addition of rigid filler material TiO2 (3 wt %) to EP_8 BCP further increased the viscosity to 3.569 Pa·s at 60 °C (see Figure 5b).

3.3. Tensile Properties

The tensile properties of the BCP modified EP_H1 systems are shown in Table 3. A modulus of 2950 MPa and a tensile strength of 84 MPa were measured for the EP_H1 system. The addition of BCP reduces the modulus and tensile strength of the epoxies, which was expected because the M52N type BCP was softer than the epoxy and it contains the softer phase content in the medium range [44]. For the EP_12BCP system, the tensile strength and tensile modulus were measured as 71 and 2690 MPa respectively. The addition of the BCP particles reduced the modulus nearly linearly with increasing content. Similarly, the EP_H1 system was modified with TiO2 (3, 5 and 7 wt %) and it can be observed that, for system EP_3TiO2, the value of tensile strength was reported as 90 MPa and for 5 and 7 wt % 91 MPa respectively with an increase in elastic modulus as well. This suggests that even at very low vol % (see Table 1) TiO2 nanoparticles dispersed well with the epoxy matrix and this increase in strength and modulus is attributed to good adhesion between TiO2 nanoparticles and epoxy matrix with few traces of agglomeration. Based on the tensile results and keeping in mind the low viscosity, the EP_3TiO2 system was selected for hybrid systems.
For hybrids, the three different systems were prepared with a concentration of TiO2 fixed at 3 wt % and BCP varied (4, 6, and 8 wt %). For the hybrid EP_H1_6 BCP_3 TiO2, the tensile strength was decreased by ca. 2% while fracture toughness and fracture energy increased by 163% and ~ 600%, and elongation at maximum strength remained the same as compared to the reference EP_H1 system. It was clearly observed that all the hybrid formulations provided a fine balance between the tensile properties and fracture mechanics properties without disturbing the thermal properties.

3.4. Fracture-Mechanics Properties

The fracture toughness, KIc, and fracture energy, GIc, of the unmodified epoxy and epoxies modified with BCP were measured in mode I using compact tension (CT) tests. The results are summarized in Table 3. The mean values for KIc and GIc of the unmodified epoxy were determined to be 0.57 MPa·m1/2 and 0.096 kJ/m2, respectively. For the BCP modified epoxies, a steady increase of KIc and GIc was observed with BCP content. The maximum values of KIc = 2.18 MPa·m1/2 and the GIc = 1.58 kJ/m2 were measured for the EP_12BCP system revealing an increase by a factor of 3.82 and 16.5 above the unmodified epoxy. These values are in line with the fracture toughness reported by other researchers [19,22,25]. A KIc of 0.89 MPa·m1/2 was reported for the EP_3 TiO2 system, while the nanocomposite with 7 wt % TiO2 shoed a KIc of 1.10 MPa·m1/2, representing an almost two-fold higher toughness than for unmodified epoxy (see Table 4). The hybrid nanocomposite EP_3TiO2_4BCP has a fracture toughness KIc of 1.27 MPa·m1/2, which is around 123% higher than the one of EP_H1. With a value of 1.72 MPa·m1/2, the toughness of the EP_3TiO2_8BCP material was almost three times higher than for the EP_H1 system.

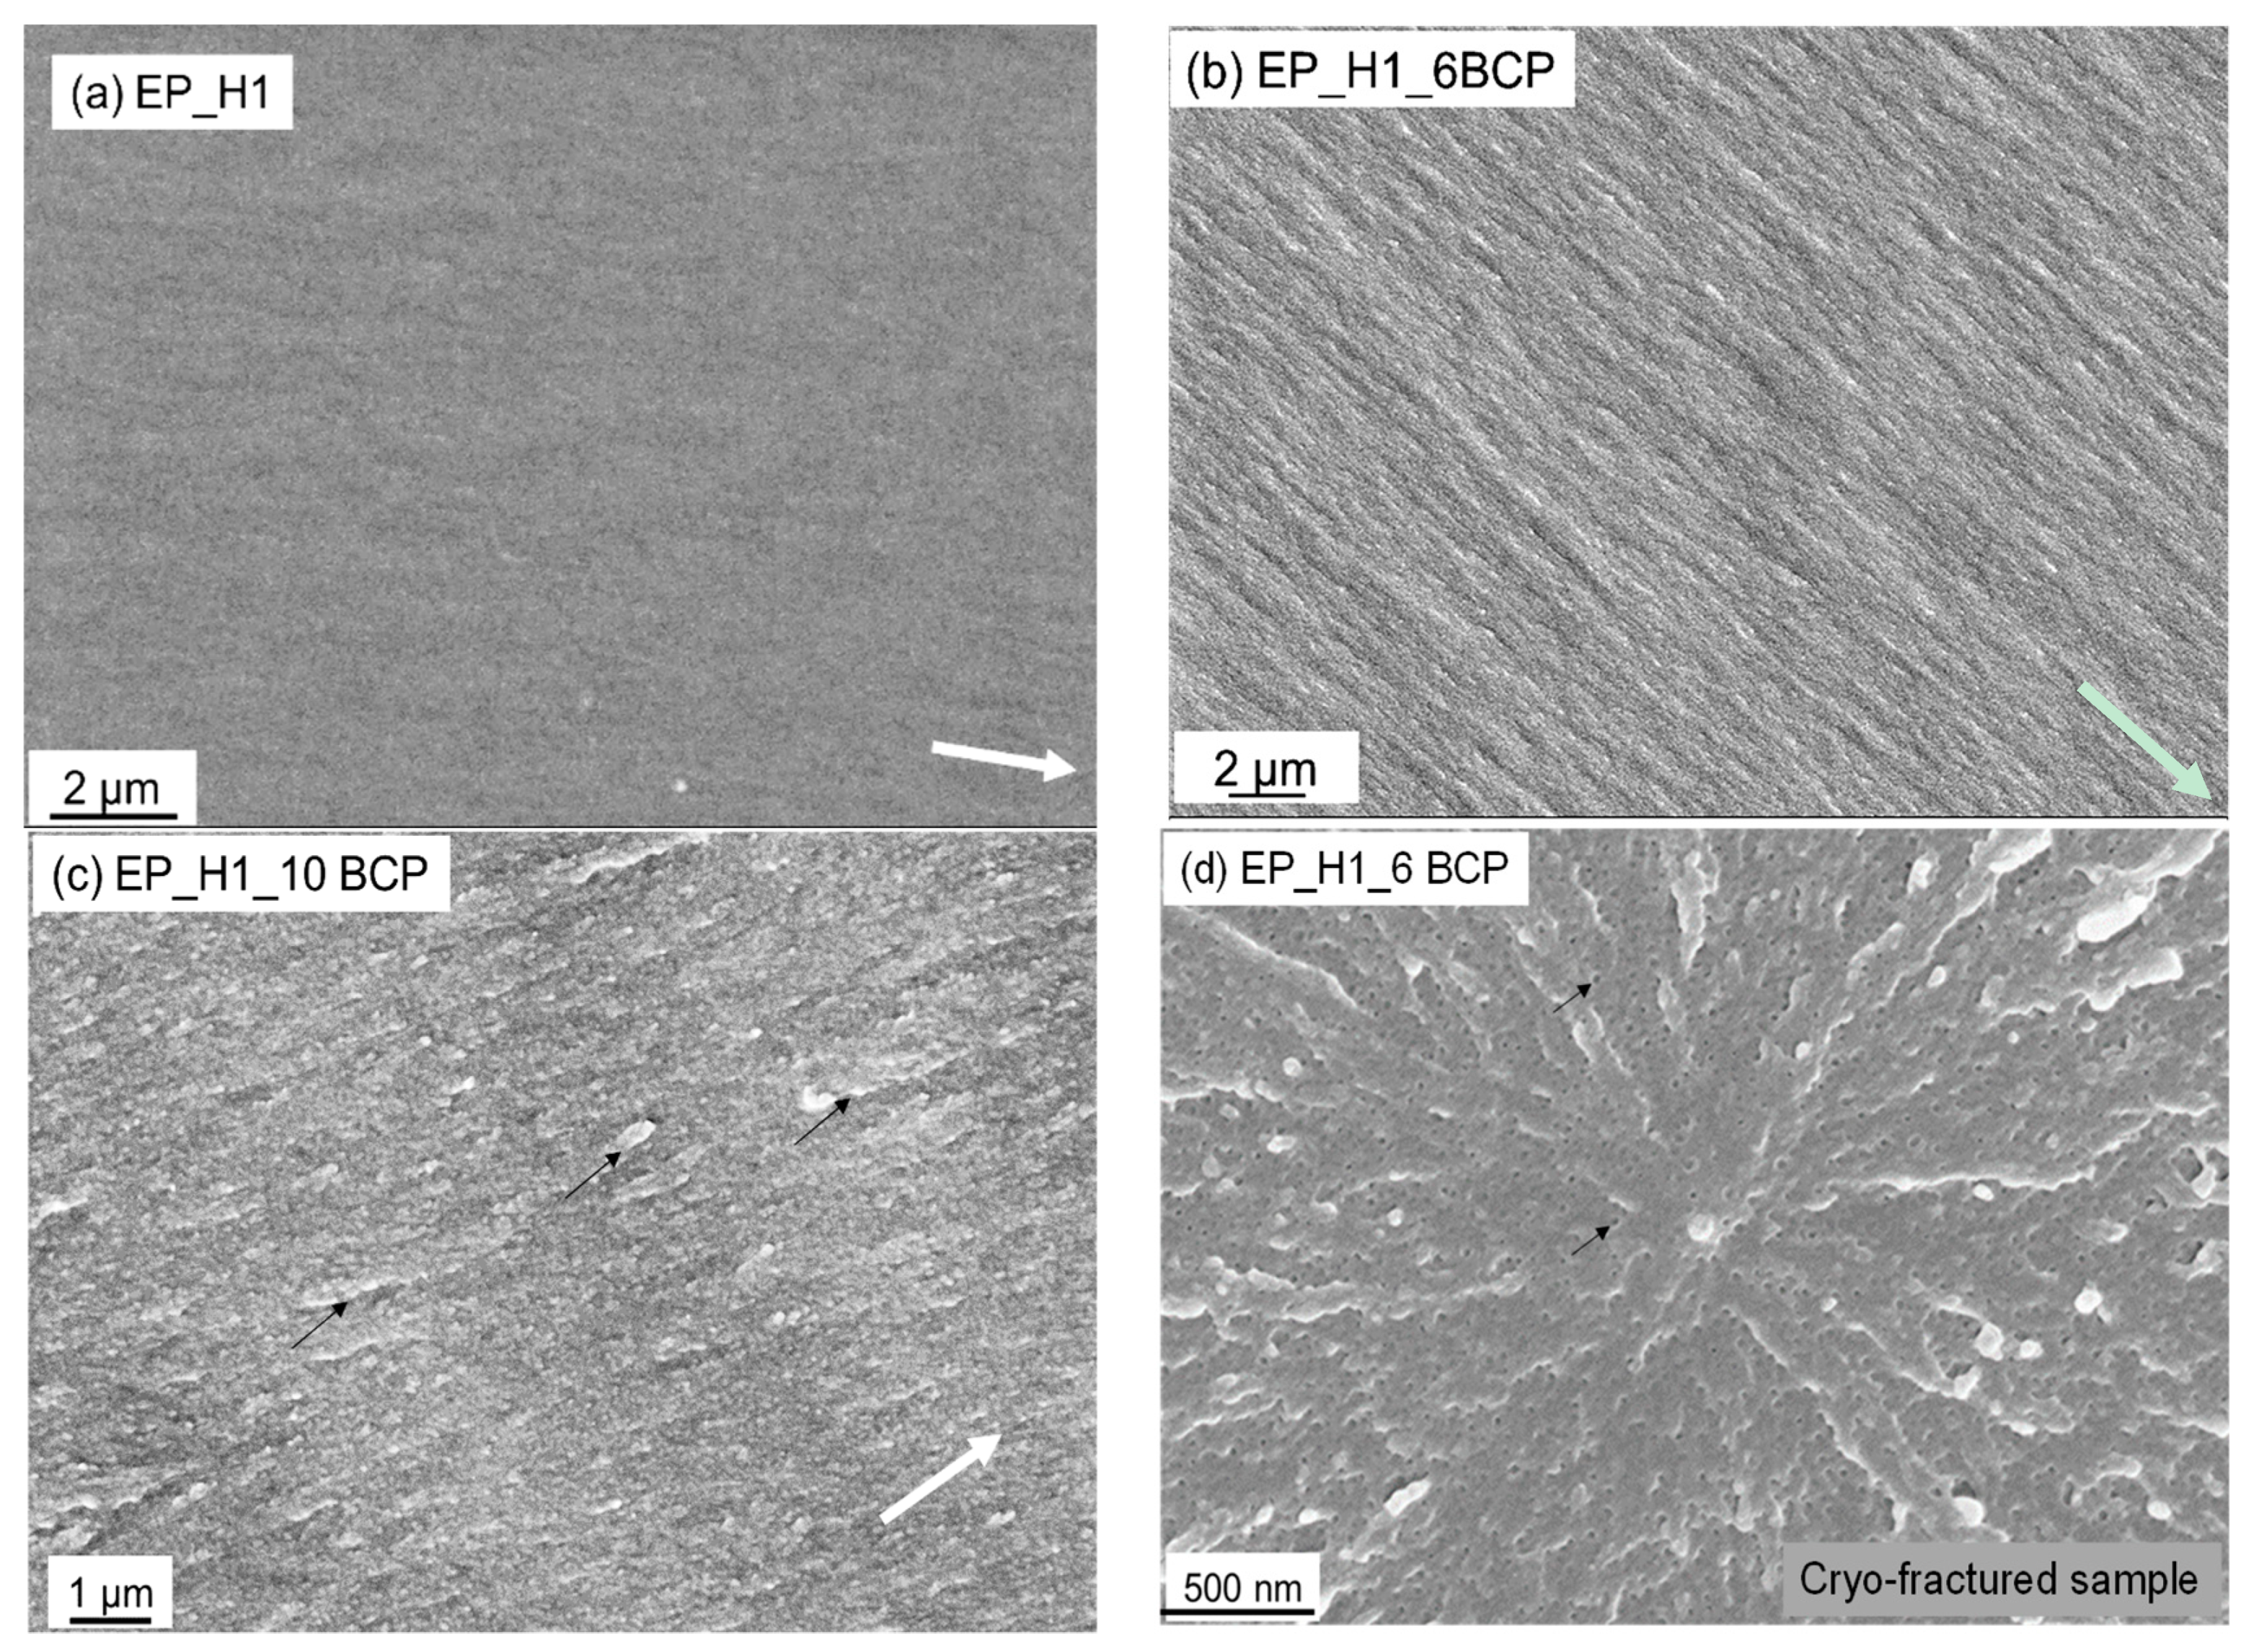
3.5. Fractography Studies

The toughening mechanisms responsible for the increase in fracture toughness due to matrix modification can be explained by analyzing the fracture surfaces of the unmodified and modified epoxy composites using a field emission scanning electron microscope (FE-SEM). The fracture surfaces for the unmodified epoxies, as shown in Figure 6a, for the amine-cured epoxy, show a smooth fracture surface typical for brittle epoxy. This indicates a lack of plastic deformation during the fracture process. Only small-scale river lines were observed at the crack tip, which were caused by the presence of some local mixed-mode I/III stresses [46].

3.5.1. BCP Modified Epoxies

The fracture surfaces of the epoxies keep their brittle occurrence, but they appeared much rougher after the adding of the M52N type BCP, as shown in Figure 6b,c. The surface roughness of fractured samples was measured with a white light profilometer, and it shows an increasing trend in surface roughness with rising BCP content (see Table 5). Due to the formation of BCP nanostructures in epoxy via the self-assembling mechanism, the exact morphology of nanostructure domains could not be identified here through SEM images, a fact that was also reported by other researchers [10,16]. The atomic force microscope images of EP_6BCP (see Figure 7a,b) reveal nano-sized spherical and worm-like micelles, while for the EP_H1 system such features were not obtained. A cryofracture was additionally performed for a representative BCP modified system (Figure 6d) and it showed that with rising BCP concentration the number of cavities, i.e., plastically deformed BCP nanostructures on the fracture surface, increase.
Furthermore, small scale matrix tearing was observed on the fracture surfaces of the BCP modified epoxies with all morphologies (see Figure 6c, arrows). These features indicate an enhanced plastic deformation of the epoxies. The obtained morphologies were in a good agreement with the work of Chen et al. [19]. Considering the FE-SEM images of the fracture surfaces in Figure 6c, the toughening mechanisms involved in the BCP modified amine cured epoxy composites can be proposed. The BCP nanostructures are believed to induce shear yielding in the matrix due to a local change in stress state from plane strain to plane stress. This may result in the formation of voids, cavities and deboning effects in the process zone at the crack tip vicinity [47]. Some authors also suggested the toughening mechanism of pullout and bridging for nanoscale micelles [19,48].
However, since a large difference between the dimensions of nanoscale micelles (~25–50 nm) and crack tip opening displacement (CTOD), as measured for EP_12BCP to be 9.98 µm via Equation (4), the pullout and bridging mechanisms hardly provide any significant toughening. In Equation (4), E represents the young’s modulus; σ y the tensile yield strength, KIc the fracture toughness, GIc the fracture energy, and ν the Poisson’s ratio for the epoxy system [49].
C T O D =   K I c E σ y ( 1 ϑ 2 ) = G I c σ y
Based on the fractography evidence the following mechanisms are proposed for EP_BCP systems: (a) Cavitation of micelles (spherical and worm-like), and (b) enhanced plastic deformation/tearing due to localized plasticization effect of the epoxy/PMMA mixing region. The micelles formed within the epoxy network were in the nanometer range, and thus they create a very large contact area between micelles and the epoxy matrix. During crack propagation this large interface area absorbs a large amount of energy before material failure. With rising BCP concentration the interface area also increases leading to even more fracture energy absorption and the formation of a high fracture surface roughness. This toughening mechanism is supported by the observation of enhanced matrix tearing and enlarged plastic zone size.

3.5.2. TiO2 Modified Epoxy Systems and Hybrid Composites

Visual analysis of the fracture surface of TiO2 modified epoxy resin with the help of SEM can give an insight into the cause and location of failure, as well as the dispersion state of the particles within the epoxy matrix. The fracture surface of the neat epoxy resin was brittle with a smooth surface (see Figure 6a). Figure 8a shows a close up of the crack surface in a nanocomposite containing 3 wt % of TiO2 nanoparticles, some nano and micro reinforcing mechanisms can be observed with more detail. Some of these mechanisms include particle pullout (debonding), crack deflection due to the nanometer scale agglomerates, and particle crack pinning [28,34,49] as indicated by the small tails behind the particles. Such ridges are caused by the reconcile of the crack front after passing the “particle obstacles.” The ridge results from the crack front moving around each side of the particle, and the crack fronts reunify in differing crack propagation planes. Morphology indicates that improvement in fracture properties in composites can be attributed to the presence of rigid TiO2 nanoparticles in the epoxy matrix, which led to increased surface roughness and hence more energy dissipation during the propagation of a crack. However, when the concentration of rigid nanofillers exceeds the critical value the particles’ agglomeration was sufficient to impart stress concentration which led to failure as in the case of micro fillers. Debonding of nanoparticles was not expected to be a major toughening mechanism due to the better adhesion in the particle-matrix in these composites at lower concentrations.
The fracture surface of the hybrid BCP_TiO2 nanoparticle modified epoxies occurred slightly different to the epoxies modified with BCP and TiO2 nanoparticles alone. It can be seen in Figure 8b that the obtained fractured surface had dispersed TiO2 nanoparticles with the stress whitened zone showing plastic deformations in the fractured specimens with spherical cavities, which were not observed in EP_BCP systems until cryo-fracture was performed. These spherical cavities were formed by BCP present in the epoxy system, and it is believed that the presence of TiO2 particles may cause a hindrance of the nanostructure formation during the curing process. Such effect may be a reason behind the lower fracture toughness of hybrid systems when compared to fracture toughness values of EP_BCP systems.
It can be concluded that the addition of the titanium dioxide nanoparticles had a minor contribution to toughness increase. The toughening mechanisms in hybrid-modified epoxies were dominated by BCP and they were nano-cavitation of micelles (present in form of either spherical or worm-like shape) and the enhanced plastic deformation of the epoxy matrix due to the localized plasticization of the epoxy/PMMA interface, with minor contribution from crack pinning, and debonding of TiO2 nanoparticles.

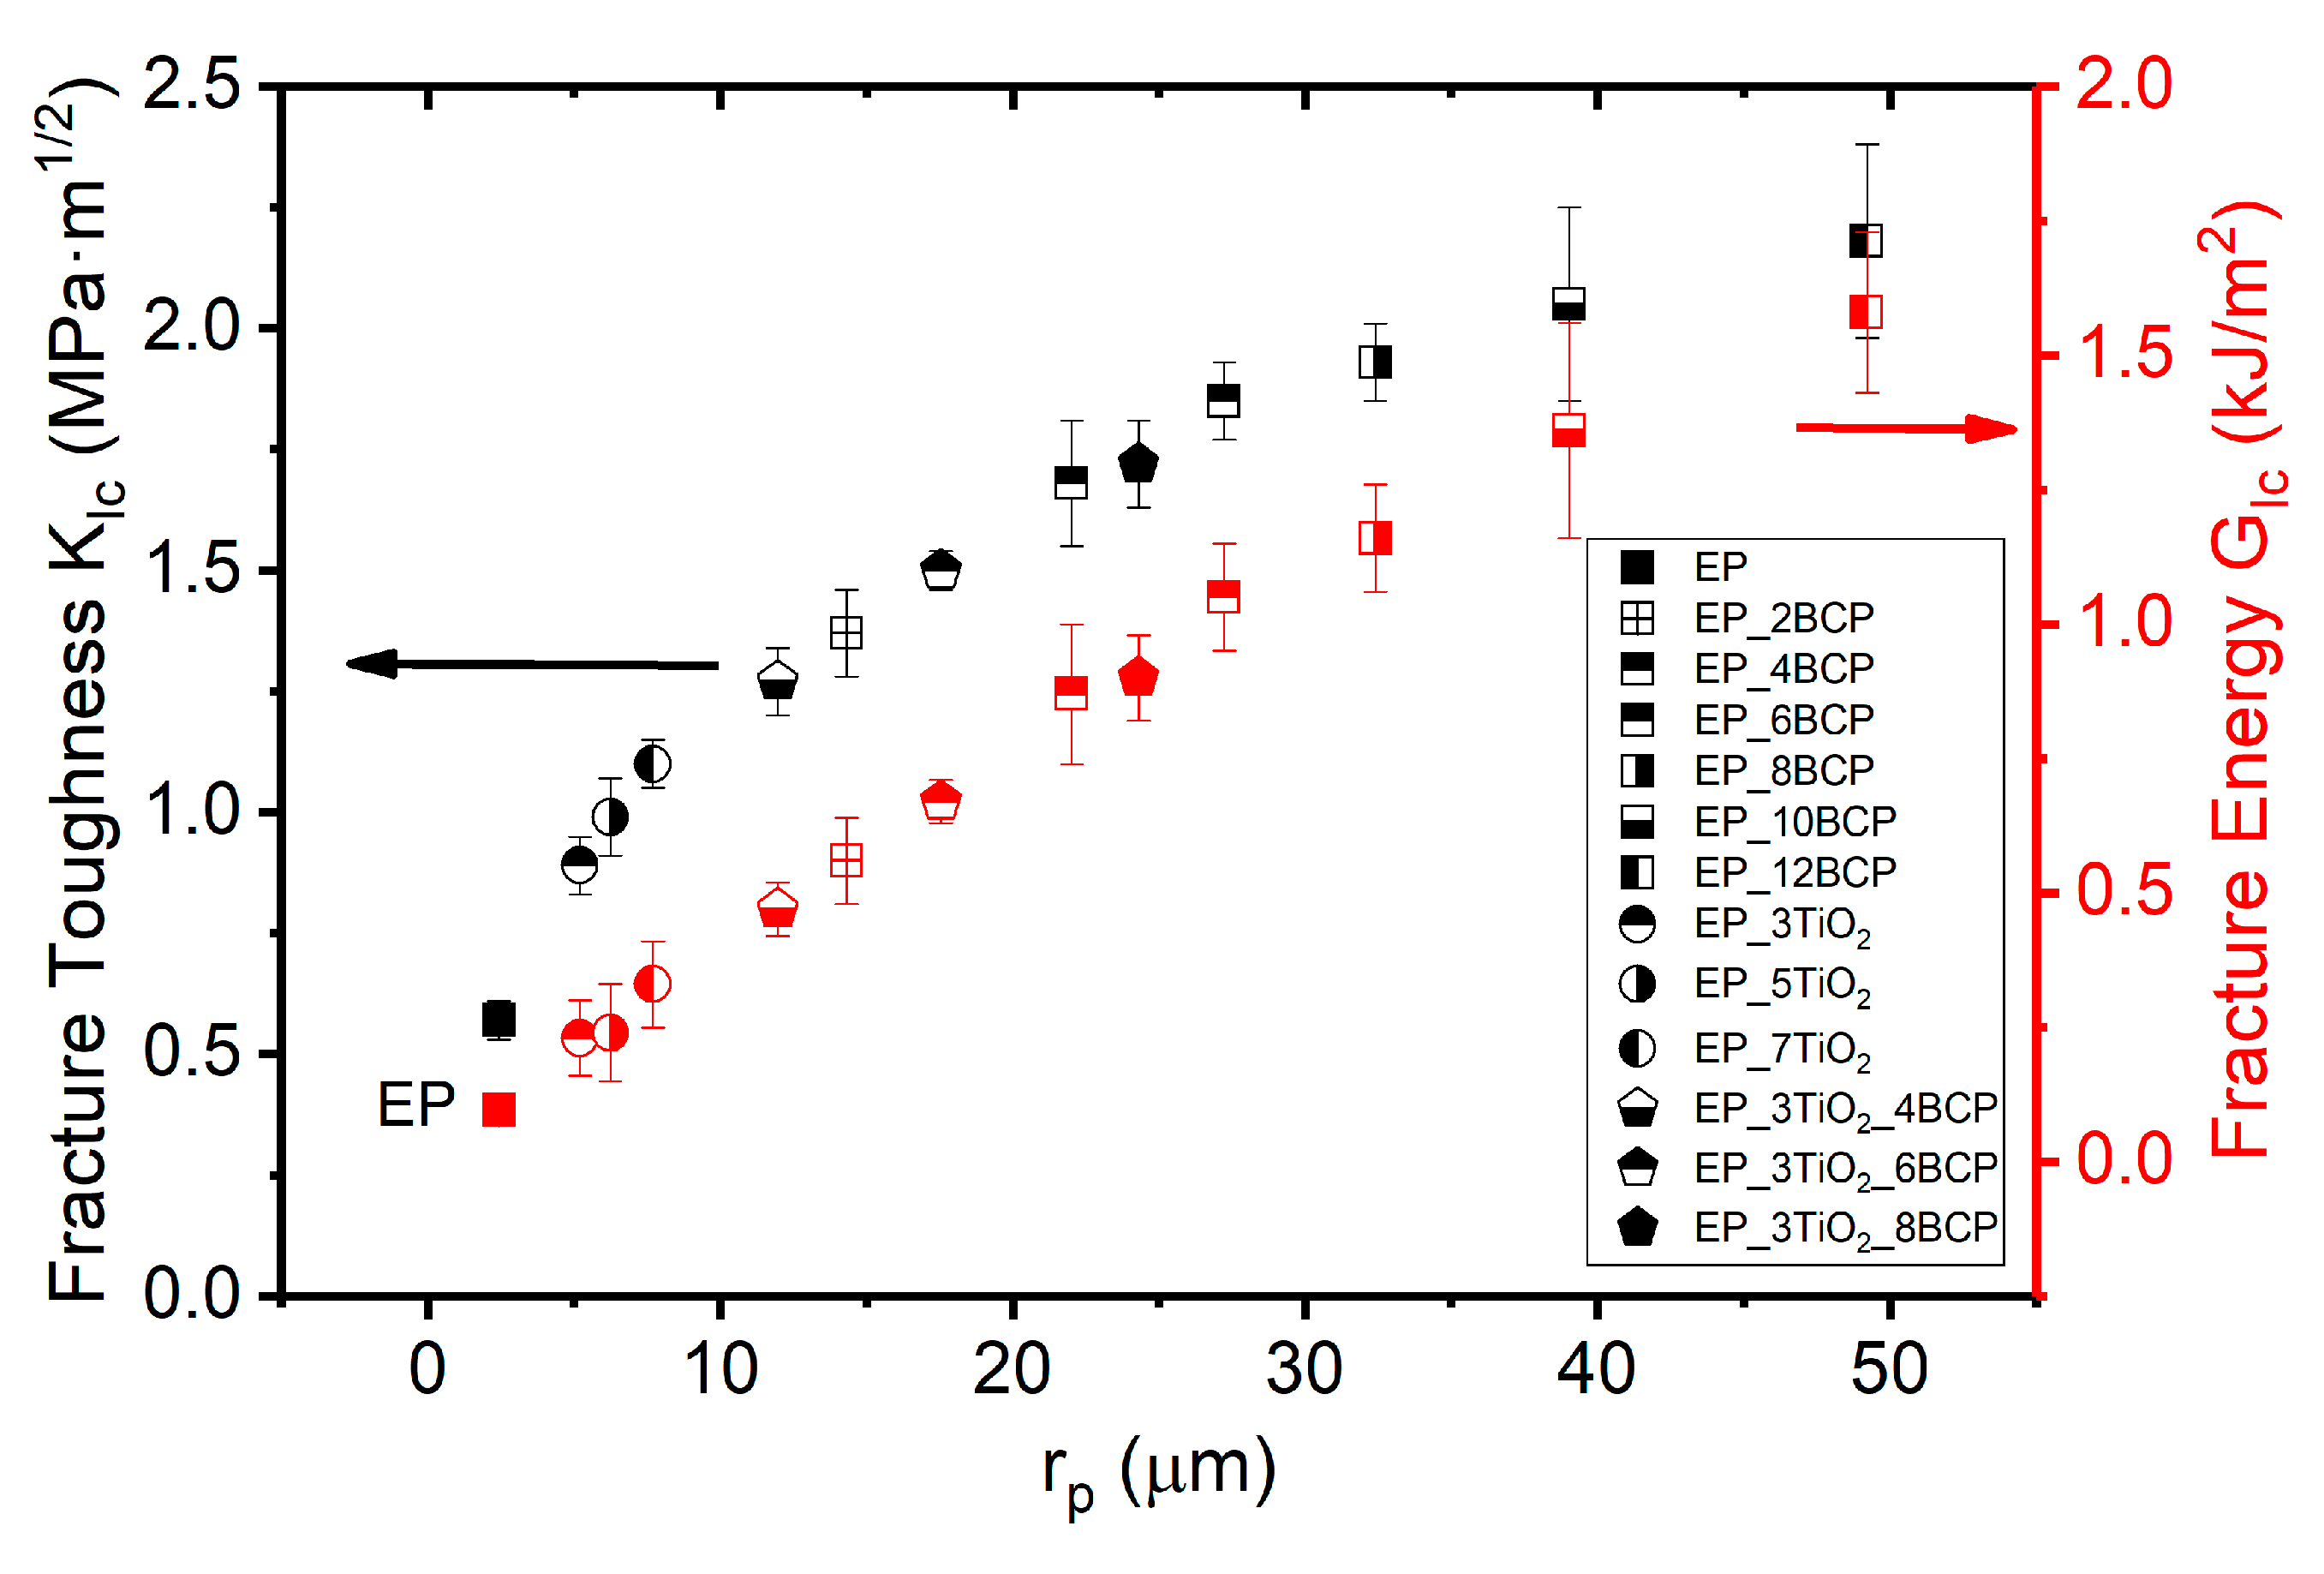
3.5.3. Plastic Zone Size

The plain strain dimension of the plastic zone size can be quantified by Irwin’s model, assuming that the zone is circular in shape and cracks occur in the matrix region, by using Equation (5) [49] where KIc is the fracture toughness and σ y t is the tensile true yield stress of the bulk polymer. A plastic zone radius of 2.44 µm was calculated for the EP_H1 system. The maximum plastic zone size of 49.20 µm was calculated for EP_12 BCP, and for all other modified systems the plastic zone size falls between these two limits (see Figure 9).
r p = 1 6 π ( K I c σ y t ) 2
The plastic zone was considerably larger than the radius of BCP and TiO2 nanoparticles. Therefore, these particles lie within the plastic zone and favor matrix toughening by events such as cavitation, plastic void growth (for BCP), crack pinning and crack deflection for rigid nano-fillers and compelling the material to dissipate more energy before failure.
It can be observed from the normalized graph (Figure 10) that, for hybrid systems, initially the properties were dominated by TiO2 nanoparticles but as the concentration of BCP increased the properties were governed by the BCP. Interestingly, for hybrid systems, the properties lie between those of BCP and TiO2 thus providing a complete map for all the modified systems.

4. Conclusions

The material properties of an amine cured bisphenol F based epoxy modified with soft BCP, rigid TiO2 nano-fillers, and BCP-TiO2 hybrids were investigated in terms of tensile and fracture mechanics properties, as well as thermo-mechanical properties, and correlated with microstructural features and toughening mechanisms. The addition of BCP to the epoxy was found to form a nanostructure with no traces of macro-phase separation. The elastic modulus and ultimate tensile strength decreased linearly with increasing BCP content due to the relative softness of PMMA and PBuA in M52N type BCP compared to the epoxy. The BCPs have no or only a minor effect on the glass transition temperature of EP_BCP nanocomposites. In the case of EP_TiO2 nanocomposites, the TiO2 nanoparticles could be well dispersed in the epoxy with very few agglomerates at low concentrations, and as the concentration was increased the tendency of agglomeration also rose. The elastic modulus and ultimate tensile strength were improved with the addition of TiO2 nanoparticles. Good adhesion between the epoxy matrix and TiO2 nanoparticles was observed. The glass transition temperature slightly increased with the addition of rigid TiO2 nano-fillers.
A significant increase in fracture toughness KIc and fracture energy GIc was reached by the addition of BCP, and maximum values of KIc = 2.18 MPa·m1/2 and GIc = 1.58 kJ/m2 were observed for the EP_12 BCP sample, representing a toughness increase by a factor of 3.8 and 16.5 respectively, as compared to the neat EP_H1 reference epoxy. For EP_TiO2 systems, the maximum values were KIc = 1.10 MPa·m1/2, and GIc = 0.33 kJ/m2 in case of the EP_7 TiO2 sample. For the hybrid systems, the maximum values of KIc = 1.72 MPa·m1/2 and GIc = 0.90 kJ/m2 were measured for the EP_8 BCP_3 TiO2 with a minor reduction (~4%) in the value of tensile strength as compared to EP_H1 system. Toughening mechanisms for BCP modified EP systems were detected as cavitation of spherical micelles and enhanced plastic deformation of the epoxy matrix due to the plasticization effect of epoxy/PMMA mixing region. For TiO2 modified epoxy, the main toughening mechanisms were shear yielding, crack pinning and particle pullout (debonding). For hybrid systems, the main toughening mechanisms were dominated by EP_BCP systems, especially at higher BCP (6 and 8 wt %) concentrations. Comparing the overall properties, the hybrids provide better performance in terms of tensile, fracture mechanics and thermo-mechanical properties as compared to those of EP_BCP and EP_TiO2 systems alone.

Author Contributions

A.B. and B.W. conceived and designed the experiments; A.K.A. prepared the nanocomposite and performed the fracture mechanics tests and the SEM analysis; A.K. performed tensile and thermal tests; A.B. and B.W. analyzed the data and wrote the paper.

Funding

This research receives no external public funding.

Acknowledgments

The authors gratefully acknowledge the provision of the materials by Arkema. Moreover, the authors thank Sergiy Grishchuk for the fruitful discussions.

Conflicts of Interest

The authors declare no conflict of interest.

References

  1. Kunz, S.C.; Syre, J.A.; Assink, R.A. Morphology and toughness characterization of epoxy resins modified with amine and carboxyl terminated rubbers. Polymer 1982, 23, 1897–1906. [Google Scholar] [CrossRef]
  2. Sultan, J.N.; McGarry, F. Effect of rubber particle size on deformation mechanisms in glassy epoxy. Polym. Eng. Sci. 1973, 13, 29–34. [Google Scholar] [CrossRef]
  3. Pearson, R.A.; Yee, A.F. Toughening mechanisms in elastomer-modified epoxies. J. Mater. Sci. 1989, 24, 2571–2580. [Google Scholar] [CrossRef]
  4. Yee, F.; Pearson, R.A. Toughening mechanisms in elastomer-modified epoxies Part 1 Mechanical studies. J. Mater. Sci. 1986, 21, 2462–2474. [Google Scholar] [CrossRef]
  5. Lin, K.F.; Shieh, Y.D. Core-shell particles designed for toughening the epoxy resins. II. Core-shell-particle-toughened epoxy resins. J. Appl. Polym. Sci. 1998, 70, 2313–2322. [Google Scholar] [CrossRef]
  6. Bates, C.M.; Bates, F.S. 50th anniversary perspective: Block polymers-pure potential. Macromolecules 2016, 50, 3–22. [Google Scholar] [CrossRef]
  7. Mai, Y.; Eisenberg, A. Self-assembly of block copolymers. Chem. Soc. Rev. 2012, 41, 5969–5985. [Google Scholar] [CrossRef] [PubMed]
  8. Lipic, P.M.; Bates, F.S.; Hillmyer, M.A. nanostructured thermosets from self-assembled amphiphilic block copolymer/epoxy resin mixtures. J. Am. Chem. Soc. 1998, 120, 8963–8970. [Google Scholar] [CrossRef]
  9. Maiez-Tribut, S.; Pascault, J.P.; Soule, E.R.; Borrajo, J.; Williams, R.J.J. Nanostructured epoxies based on the self-assembly of block copolymers: A new miscible block that can be tailored to different epoxy formulations. Macromolecules 2007, 40, 1268–1273. [Google Scholar] [CrossRef]
  10. Kishi, H.; Kunimitsu, Y.; Nakashima, Y.; Abe, T.; Imade, J.; Oshita, S. Control of nanostructures generated in epoxy matrices blended with PMMA-b-PnBA-b-PMMA triblock copolymers. Express Polym. Lett. 2015, 9, 23–25. [Google Scholar] [CrossRef]
  11. Yamanaka, K.; Takagi, Y.; Inoue, T. Reaction-induced phase separation in rubber-modified epoxy resins. Polymer 1989, 30, 1839–1844. [Google Scholar] [CrossRef]
  12. Meng, F.; Zheng, S.; Li, H.; Liang, Q.; Liu, T. Formation of ordered nanostructures in epoxy thermosets: A mechanism of reaction-induced microphase separation. Macromolecules 2006, 39, 5072–5080. [Google Scholar] [CrossRef]
  13. Williams, R.J.; Rozenberg, B.A.; Pascault, J.P. Reaction-induced phase separation in modified thermosetting polymers. In Polymer Analysis Polymer Physics; Springer: Berlin/Heidelberg, Germany, 1997; pp. 95–156. [Google Scholar]
  14. Ocando, C.; Tercjak, A.; Martín, M.D.; Ramos, J.A.; Campo, M.; Mondragon, I. Morphology development in thermosetting mixtures through the variation on chemical functionalization degree of poly(styrene-b-butadiene) diblock copolymer modifiers. Thermomechanical properties. Macromolecules 2009, 42, 6215–6224. [Google Scholar] [CrossRef]
  15. Fan, W.; Wang, L.; Zheng, S. Nanostructures in thermosetting blends of epoxy resin with polydimethylsiloxane-block-poly(ε-caprolactone)-block-polystyrene ABC triblock copolymer. Macromolecules 2008, 42, 327–336. [Google Scholar] [CrossRef]
  16. Dean, J.; Grubbs, R.B.; Saad, W.; Cook, R.; Bates, F. Mechanical properties of block copolymer vesicle and micelle modified epoxies. J. Polym. Sci. Part B Polym. Phys. 2003, 41, 2444–2456. [Google Scholar] [CrossRef]
  17. Kishi, H.; Kunimitsu, Y.; Nakashima, Y.; Imade, J.; Oshita, S.; Morishita, Y.; Asada, M. Relationship between the mechanical properties of epoxy/PMMA-b-PNBA-b-PMMA block copolymer blends and their three-dimensional nanostructures. Express Polym. Lett. 2017, 11, 765–777. [Google Scholar] [CrossRef]
  18. Redline, E.M.; Declet-Perez, C.; Bates, F.S.; Francis, L.F. Effect of block copolymer concentration and core composition on toughening epoxies. Polymer 2014, 55, 4172–4181. [Google Scholar] [CrossRef]
  19. Chen, J.; Taylor, A.C. Epoxy modified with triblock copolymers: Morphology, mechanical properties and fracture mechanisms. Mater. Sci. 2012, 47, 4546–4560. [Google Scholar] [CrossRef]
  20. Ritzenthaler, S.; Girard-Reydet, E.; Pascault, J.P. Influence of epoxy hardener on miscibility of blends of poly(methyl methacrylate) and epoxy networks. Polymer 2000, 41, 6375–6386. [Google Scholar] [CrossRef]
  21. Romeo, H.E.; Zucchi, I.A.; Rico, M.H.C.E.; Williams, R.J.J. From spherical micelles to hexagonally packed cylinders: The cure cycle determines nanostructures generated in block copolymer/epoxy blends. Macromolecules 2013, 46, 4854–4861. [Google Scholar] [CrossRef]
  22. Klingler, A.; Bajpai, A.; Wetzel, B. The effect of block copolymer and core-shell rubber hybrid toughening on morphology and fracture of epoxy-based fibre reinforced composites. Eng. Fract. Mech. 2018, 203, 81–101. [Google Scholar] [CrossRef]
  23. Klingler, A.; Wetzel, B. Fatigue crack propagation in triblock copolymer toughened epoxy nanocomposites. Polym. Eng. Sci. 2017, 57, 579–587. [Google Scholar] [CrossRef]
  24. Bajpai, A.; Alapati, A.K.; Wetzel, B. Toughening and mechanical properties of epoxy modified with block co-polymers and MWCNTs. Procedia Struct. Integr. 2016, 2, 104–111. [Google Scholar] [CrossRef]
  25. Chong, H.M.; Taylor, A.C. The microstructure and fracture performance of styrene-butadiene-methylmethacrylate block copolymer-modified epoxy polymers. Mater. Sci. 2013, 48, 6762–6777. [Google Scholar] [CrossRef]
  26. Ritzenthaler, S.; Court, F.; David, L.; Girard-Reydet, E.; Leibler, L.; Pascault, J.P. ABC triblock copolymers/epoxy—diamine blends. 1. keys to achieve nanostructured thermosets. Macromolecules 2002, 35, 6245–6254. [Google Scholar] [CrossRef]
  27. Carballeira, P.; Haupert, F. Toughening effects of titanium dioxide nanoparticles on TiO2/epoxy resin. Polym. Compos. 2010, 31, 1241–1246. [Google Scholar] [CrossRef]
  28. Wetzel, B.; Rosso, P.; Haupert, F.; Friedrich, K. Epoxy nanocomposites—Fracture and toughening mechanisms. Eng. Fract. Mech. 2006, 73, 2375–2398. [Google Scholar] [CrossRef]
  29. Lee, J.; Yee, A.F. Fracture of glass bead/epoxy composites: On micro-mechanical deformations. Polymer 2000, 41, 8363–8373. [Google Scholar] [CrossRef]
  30. Hsieh, T.H.; Kinloch, A.J.; Masania, K.; Taylor, A.C.; Sprenger, S. The mechanisms and mechanics of the toughening of epoxy polymers modified with silica nanoparticles. Polymer 2010, 51, 6284–6294. [Google Scholar] [CrossRef] [Green Version]
  31. Liang, Y.L.; Pearson, R.A. The toughening mechanism in hybrid epoxy-silica-rubber nanocomposites. Polymer 2010, 51, 4880–4890. [Google Scholar] [CrossRef]
  32. Hsieh, T.H.; Kinloch, A.J.; Masania, K.; Lee, J.S.; Taylor, A.C.; Sprenger, S. The toughness of epoxy polymers and fibre composites modified with rubber microparticles and silica nanoparticles. J. Mater. Sci. 2010, 45, 1193–1210. [Google Scholar] [CrossRef]
  33. Maxwell, D.; Young, R.J.; Kinloch, A.J. Hybrid particulate-filled epoxy-polymers. J. Mater. Sci. Lett. 1984, 3, 9–12. [Google Scholar] [CrossRef]
  34. Kinloch, J.; Maxwell, D.; Young, R.J. Micromechanisms of crack propagation in hybrid-particulate composites. J. Mater. Sci. Lett. 1985, 4, 1276–1279. [Google Scholar] [CrossRef]
  35. Durig, J. Comparisons of epoxy technology for protective coatings and linings in wasterwater facilities. In Proceedings of the Industrial Protective Coatings Conference and Exhibit, Houston, TX, USA, 14–18 November 1999. [Google Scholar]
  36. H. Inc. Product Specifications for the EPON862 and Technical Data Sheet; H. Inc.: Lansing, MI, USA, 2005. [Google Scholar]
  37. Evonik Resource Efficiency GmbH. Product information AEROXIDE® TiO2 P 25; Evonik Resource Efficiency GmbH: Darmstadt, Germany, 2016. [Google Scholar]
  38. Carballeira, P.; Haupert, F. Toughening effects of titanium dioxide nanoparticles on TiO2 /epoxy resin nanocomposites. Soc. Plast. Eng. 2009, 31, 1241–1246. [Google Scholar] [CrossRef]
  39. Wetzel, B. Mechanische Eigenschaften von Nanoverbundwerkstoffen aus Epoxydharz und keramischen Nanopartikeln; PhD, IVW Schriftenreihe Band 69; Technische Universität Kaiserslautern: Kaiserslautern, Germany, 2006; ISBN 3-934930-65-4. [Google Scholar]
  40. Moore, D. Application of Fracture Mechanics to Polymers, Adhesives and Composites; Elsevier Science: Amsterdam, The Netherlands, 2003. [Google Scholar]
  41. ISO 13586:2000(E): Plastics—Determination of Fracture Toughness (GIc and KIc)—Linear Elastic Fracture Mechanics (LEFM) Approach; ISO (The International Organization for Standardization): Geneva, Switzerland, 2000.
  42. Kinloch, J. Stresses in Adhesive Joints. In Adhesion and Adhesives: Science and Technology; Springer: London, UK, 1987; p. 209. [Google Scholar]
  43. Baller, J.; Becker, N.; Ziehmer, M.; Thomassey, M.; Zielinski, B.; Müller, U.; Sanctuary, R. Interactions between silica nanoparticles and an epoxy resin before and during network formation. Polymer 2009, 50, 3211–3219. [Google Scholar] [CrossRef]
  44. Arkema. Technical Data Sheet—Nanostrength® Epoxy Application; Arkema: Paris, France, 2013. [Google Scholar]
  45. Nielsen, L.; Landel, R.F. Mechanical Properties of Polymers and Composites; Marcel Dekker, Inc.: New York, NY, USA, 1994. [Google Scholar]
  46. Hull, D. Fractography: Observing, Measuring and Interpreting Fracture Structure Topography; Cambridge University Press: Cambridge, UK, 1999. [Google Scholar]
  47. Bagheri, R.; Pearson, R.A. Role of plastic cavitation in rubber toughened epoxies. Polymer 1996, 37, 5597–5600. [Google Scholar] [CrossRef]
  48. Wu, J.; Thio, Y.S.; Bates, F.S. Structure and properties of PBO-PEO diblock copolymer modified epoxy. J. Polym. Sci. Part B Polym. Phys. 2005, 43, 1950–1965. [Google Scholar] [CrossRef]
  49. Kinloch, J.; Young, R.J. Fracture Behaviour of Polymers; Elsevier Applied Science: New York, NY, USA, 1983. [Google Scholar]
Figure 1. Different devices used for mixing process of nanocomposites (a) Torus mill (b) Dissolver and (c) Propeller aggregate [39].
Jcs 02 00072 g001
Figure 2. Geometry of compact tension samples used for fracture testing [39].
Jcs 02 00072 g002
Figure 3. Graph showing (a) tanδ and (b) storage modulus, with respect to temperature for the EP_BCP systems.
Jcs 02 00072 g003
Figure 4. Graph showing (a) tanδ and (b) storage modulus, with respect to temperature for the EP_ TiO2 systems. (c) tanδ and (d) storage modulus, with respect to temperature for the EP_ TiO2_BCP systems.
Jcs 02 00072 g004
Figure 5. Graph showing variation in viscosity with respect to temperature for (a) EP_BCP systems, and (b) EP_TiO2_BCP hybrid systems.
Jcs 02 00072 g005
Figure 6. Field emission scanning electron microscope (FE-SEM) micrograph showing the fracture surface of different epoxy systems. (a) Reference epoxy system, (b) EP_6BCP system, (c) EP_10BCP and (d) Cryofractured sample of EP_6BCP system. Black arrows representing the small-scale matrix tearing in (c) and cavities in (d). White arrow indicates the direction of crack propagation.
Jcs 02 00072 g006
Figure 7. Atomic force microscope (AFM) height images polished surfaces: (a) Neat EP_H1, and (b) EP_6 BCP modified epoxy system revealing nanostructures such as spherical and wormlike micelles.
Jcs 02 00072 g007
Figure 8. SEM micrograph of the fracture surface showing the homogeneous dispersion of epoxy modified with different mechanisms for (a) EP_3TiO2 and (b) EP_3TiO2_6BCP systems taken near the tip of the crack. White arrows indicate the crack propagation direction.
Jcs 02 00072 g008
Figure 9. Fracture toughness and critical energy release rate of BCP, TiO2 and BCP_ TiO2 toughened epoxy systems as a function of plastic zone radius rp.
Jcs 02 00072 g009
Figure 10. Normalized graph showing the relation between the normalized fracture toughness and modulus of elasticity for different modified systems in comparison to reference epoxy system.
Jcs 02 00072 g010
Table 1. Composition and nomenclature of bulk epoxy based composites.
SeriesBCP (wt %)BCP (vol %)TiO2 (wt %)TiO2 (vol %)
EP0000
EP_2 BCP22.1400
EP_4 BCP44.2600
EP_6 BCP66.3900
EP_8 BCP88.5000
EP_10 BCP1010.6200
EP_12 BCP1212.7200
EP_3 TiO20030.82
EP_5 TiO20051.40
EP_7 TiO20071.98
EP_3 TiO2_4 BCP44.3630.82
EP_3 TiO2_6 BCP67.3230.81
EP_3 TiO2_8 BCP89.7230.81
Table 2. Glass transition temperature (Tg) of reference and different types of modified epoxy systems.
SampleTg (°C) DSCTg (°C) (tanδ Peak)SampleTg (°C) DSCTg (°C) (tanδ Peak)
EP134132EP134132
EP_2 BCP135132EP_3 TiO2136138
EP_4 BCP134N/AEP_5 TiO2136N/A
EP_6 BCP136132EP_7 TiO2137N/A
EP_8 BCP135N/AEP_3 TiO2_4 BCP135138
EP_10 BCP134N/AEP_3 TiO2_6 BCP136134
EP_12 BCP133132EP_3 TiO2_8 BCP135136
Table 3. Tensile and fracture mechanics properties of EP_BCP systems measured at 23 °C.
SystemsEt (MPa)σm (MPa)εm (%)KIc (MPa·m1/2)GIc (kJ/m2)
EP2950 (±75.8)84.0 (±0.7)6.3 (±0.4)0.57 (±0.04)0.096 (±0.03)
EP_2 BCP2920 (±35.2)83.4 (±0.8)6.7 (±0.4)1.37 (±0.09)0.56 (±0.08)
EP_4 BCP2870 (±39.4)82.5 (±4.9)5.9 (±1.4)1.68 (±0.13)0.87 (±0.13)
EP_6 BCP2860 (±22.7)81.7 (±1.7)5.6 (±0.7)1.85 (±0.08)1.05 (±0.10)
EP_8 BCP2810 (±36.1)78.1(±4.3)5.0 (±0.5)1.93 (±0.08)1.16 (±0.10)
EP_10 BCP2740 (±43.2)75.6 (±1.7)4.8 (±0.1)2.05 (±0.28)1.36 (±0.34)
EP_12 BCP2690 (±17.6)71.2 (±1.0)4.5 (±0.2)2.18(±0.30)1.58 (±0.45)
Table 4. Tensile and fracture mechanics properties of the EP_TiO2 and EP _TiO2_BCP systems measured at 23 °C.
SystemsEt (MPa)σm (MPa)εm (%)KIc (MPa·m1/2)GIc (kJ/m2)
EP2950 (±75.8)84.0 (±0.70)6.3 (±0.40)0.57 (±0.04)0.096 (±0.03)
EP_3 TiO23060 (±13.8)89.9 (± 0.63)6.3 (±0.54)0.89 (±0.06)0.23 (±0.12)
EP_5 TiO23160 (±26.2)91.3 (± 0.37)6.5 (±0.19)0.99 (±0.08)0.24 (±0.16)
EP_7 TiO23210 (±17.6)91.3 (±0.28)6.5 (±0.12)1.10 (±0.05)0.33 (±0.03)
EP_3TiO2_4 BCP3020 (±28.8)84.6 (±0.87)6.2 (±0.75)1.27 (±0.07)0.47 (±0.05)
EP_3TiO2_6 BCP2970 (±16.7)82.5 (±0.23)6.3 (±0.53)1.50 (±0.04)0.67 (±0.04)
EP_3TiO2_8 BCP2880 (±14.7)80.4 (±0.37)6.4 (±0.04)1.72 (±0.17)0.90 (±0.17)
Table 5. Surface roughness values of compact tension (CT) fractured samples for different EP_BCP systems measured from white light profilometry.
SystemSurface Roughness (µm)
EP0.157
EP_2 BCP0.183
EP_4 BCP0.201
EP_6 BCP0.223
EP_8 BCP0.235
EP_10 BCP0.245
EP_12 BCP0.251

