Article

A Numerical Method for Unstable Propagation of Damage in Fiber-Reinforced Plastics with an Implicit Static FE Solver

1
Department of Mechanical Engineering, Nippon Institute of Technology, 4-1 Gakuendai, Miyashiro-machi, Minamisaitama-gun, Saitama City 345-8501, Saitama, Japan
2
Department of Mechanical Engineering, Meiji University, Kawasaki 214-8571, Kanagawa, Japan
3
Aviation Technology Directorate, Japan Aerospace Exploration Agency, Tokyo 181-0015, Japan
*
Author to whom correspondence should be addressed.
J. Compos. Sci. 2024, 8(4), 130; https://doi.org/10.3390/jcs8040130
Submission received: 27 January 2024 / Revised: 19 March 2024 / Accepted: 26 March 2024 / Published: 2 April 2024
(This article belongs to the Special Issue Feature Papers in Journal of Composites Science in 2024)

Abstract

:
Finite element analyses of the propagation of damage such as fiber compressive failure and delamination have greatly contributed to the understanding of failure mechanisms of fiber-reinforced plastics owing to extensive studies on methodologies using Continuum Damage Mechanics and Fracture Mechanics. Problems without the need for consideration of inertia, such as Double-Cantilever Beam tests, are usually solved by implicit FE solvers, and explicit FE solvers are appropriate for phenomena that progress with very high velocity such as impact problems. However, quasi-static problems with unstable damage propagation observed in experiments such as Open-Hole Compression tests are still not easy to solve for both types of solvers. We propose a method to enable the static FE solver to solve problems with unstable propagation of damage. In the present method, an additional process of convergence checks on the averaged energy release rate of damaged elements is incorporated in a conventional Newton–Raphson scheme. The feasibility of the present method was validated by two numerical examples consisting of analyses of Open-Hole Compression tests and Double-Cantilever Beam tests. The results of the analyses of OHC tests showed that the present method was applicable to problems with unstable damage propagation. In addition, the results from the analyses of DCB tests with the present method indicated that mesh density and loading history are not significantly influential to the solution.

1. Introduction

Fiber-reinforced plastics have been widely used as structural materials in many industries such as aerospace, automotive, and marine due to its advantages of mechanical characteristics such as high specific stiffness and strength. However, the multi-phased nature of the materials’ structure leads to vulnerability to damage. Typical modes of damage in unidirectional fiber-reinforced plastics can be classified as fiber tension, fiber compression, matrix tension, matrix compression, and delamination [1,2,3]. The material under tensile loading in the fiber direction shows stages of deformation including elastic deformation of both fibers and matrix, plastic deformation of matrix, slight plastic deformation of fibers, and the fracture of the fiber followed by fracture of the composite material [1]. Under compressive loading in the fiber direction, on the other hand, the mode of failure is micro buckling of fibers. As a consequence of the micro buckling, a band of local shear deformation of the matrix called a kink band is formed. It is reported that initial imperfections of the fibers play an important role in this failure mode [4,5]. Tensile failure of matrix typically usually occurs at a plane normal to the loading direction, but compressive failure of the matrix is observed as shear failure of the matrix at an angle with the loading direction [4]. Because the material is made of different plies stacked together, delamination occurs, which is the failure of resin-rich region at the interface between the plies. Delamination tends to accelerate tensile and compressive failures of plies because delaminated plies are no longer supported by neighboring plies [2,3].
In real structures of the material, the combination of these modes makes the failure more complex. Therefore, numerous experiments are required to obtain design allowables to assure structural integrity of the products. In particular, the strength of specimens with a hole is important as allowables on the safe side because it is significantly lower than that of non-hole specimens. Accordingly, the strength of specimens with a hole has been actively studied via methods such as the Open-Hole Compression test [4,5,6,7,8,9]. Unstable propagation of the damage is one of the important factors to understand the damage mechanism. It is difficult to experimentally observe the unstable progress of the damage since the failure event is instantly occurred [10].
Since the material is used as a laminate, the effect of anisotropy on the above-mentioned failure modes must be considered. The most fundamental failure criterion is the maximum stress/strain criterion in which failure occurs when the stress/strain in each of longitudinal and transverse direction of the lamina reaches to its critical value [1]. In this criterion, a lamina is considered as an orthotropic material with the material principal axes aligned to the fiber. σL, σT, and τLT are stresses in longitudinal and transverse direction to the fiber and in-plane shear stress, respectively. For tensile stresses, the maximum stress criteria are expressed as
σ L X t = 1                 σ T Y t = 1
For compressive stresses,
σ L X c = 1                 σ T Y c = 1
And for shear stress,
τ L T S = 1
In the above Equations, X and Y are the strength in the fiber and matrix direction, and S is strength related to in-plane shear. The maximum strain criterion can be written in similar form with strain components.
Since the interaction between stresses/strains in the longitudinal and transverse direction are not considered in these criteria, the Tsai-Wu criterion was developed by rewriting Hill’s anisotropic yield criterion for metals in following tensor form [1].
F i σ i + F i j σ i σ i j = 1                 i , j = 1 ,   2 ,   ,   6
where Fi and Fij are strength tensors for the second and fourth rank, respectively. For an orthotropic lamina under plane stress condition, the equation is reduced to
1 X t 1 X c σ L + 1 Y t 1 Y c σ T + σ L 2 X t X c + σ T 2 Y t Y c + τ L T 2 S 2 + 2 F 12 σ L σ T = 1
where F12 represents interaction between stress components in fiber and matrix direction.
In spite of the fact that microscopic failure occurs independently in the fibers and matrix, the previous criteria only consider the failure of the whole lamina as a homogenized orthotropic material. Hashin proposed failure criteria in which the failure of the fiber and matrix is independently evaluated [11]. In the criteria, the failure of fibers in tension is evaluated by
σ L X t 2 + 1 S 2 τ L T 2 τ Z L 2 = 1
For the fiber compression failure,
σ L X c = 1
The tensile failure of matrix is evaluated by
1 Y t 2 σ T + σ Z 2 + 1 S L T 2 τ L T 2 + τ Z L 2 + 1 S T Z 2 τ T Z 2 σ T σ Z = 1
For the matrix compression failure,
1 Y c Y c 2 S T Z 2 1 σ T + σ Z + 1 4 S T Z 2 σ T + σ Z 2 + 1 S L T 2 τ L Z 2 + τ Z L 2 + 1 S T Z 2 τ T Z 2 σ T σ Z = 1
Pinho et al. proposed the LaRC04 criterion [12], which adopts mean-field homogenization theory such as Eshelby’s eigen strain problem to derive stress field in the matrix [13]. In Eshelby’s eigen problem, stresses in a solid and an inclusion can be analytically obtained by considering an elliptical inclusion embedded in an homogeneous infinite solid. This theory can be applied to unidirectional fiber-reinforced plastics by letting the aspect ratio of the elliptic inclusion approach infinity. Nonlinear response of shear deformation due to matrix’s visco-elastic-plastic characteristics is effectively incorporated in this model by treating the fibers and matrix separately. In this failure criteria, the existence of a crack inside the matrix is also considered by using the theory by Laws [14]. In LaRC04, the failure criterion of matrix tension mode is expressed as
1 g σ T Y c + g σ T Y t 2 + Λ T Z o τ T Z 2 + χ γ L T χ γ L T = 1
where g is the ratio of the normal mode of critical energy release rate to that of the shear mode. Λij are components of the crack tensor that transform stress at infinity to strain at the interface of the phases, and χ(γLT) is the in-plane shear internal energy. For the compressive failure of the matrix, the criterion is
τ T S T η T σ n 2 + τ L S L η L σ n 2 = 1
where σn is the normal stress at the potential failure plane that can be obtained from the Mohr–Coulomb theory, and τT and τL are two components of shear stress at the failure plane, respectively. ηL and ηT are friction coefficients that represent effect of the normal stress on the failure plane to shear strengths. The failure of the fiber in tension is simply evaluated by
σ L X t = 1
For compressive failure of the fiber, it is assumed that the fibers are significantly affected by its misalignment. The kink-band is assumed to be formed in a plane in which tensile normal stress in the matrix is maximized, which is called kink-plane. After the kink-plane is defined, the stresses are rotated to the misalignment frame. With the stress components in the misalignment frame σ2m2m and τ1m2m, the criterion for the compressive failure is expressed as
τ 1 m 2 m S L η L σ 2 m 2 m = 1
Numerical analyses have advantages that can reproduce phenomena that cannot be experimentally observed. For numerical modeling of damage in fiber-reinforced plastics, theories of Continuum Damage Mechanics and Fracture Mechanics are mainly adopted [15,16,17,18,19,20,21,22]. Although the initiation of damage can be evaluated by failure criteria based on stress state of constituents of the composite, the criteria are not necessarily sufficient to simulate development of the damage after the initiation. Therefore, Continuum Damage Mechanics (CDM) is often adopted to express development of the damage by expressing degradation of the material to carry load as reduction in its stiffness [23]. Intra-laminar damage such as matrix cracks and fiber failures are effectively modeled by this methodology [24,25,26]. Fracture Mechanics is widely used to evaluate conditions of crack propagation such as matrix cracks and delamination. Virtual Crack Closure Technique (VCCT) proposed by Shivakumar is one of the most widely used numerical methodologies to evaluate energy release rates at a tip of the crack [27,28]. The energy release rate can be simply evaluated by nodal reaction forces and crack opening displacements in a finite element analysis. Delamination is effectively modeled by the Cohesive Zone Model (CZM) in many studies such as Camanho et al. [29]. In CZM, a process zone of the damage is modeled by evaluating tractions between two interfaces as a function of their relative displacements. In the methodologies mentioned above, the mesh pattern of the finite element model must be created so that boundaries of the elements match edges of the cracks. An extended finite element method (XFEM) was proposed to cope with these kinds of problems [30]. The discontinuity of displacements at the cracks in the element is modeled by extended interpolation function with a step function in XFEM, so the cracks located inside elements can be expressed without the modification of the mesh pattern [31]. A methodology that combines CDM and XFEM has been proposed recently by Higuch et al. [32].
Commercially available FE solvers used for analyses of the damage can be generally categorized to implicit and explicit solvers. This categorization is originated by schemes of the time integral of dynamic problems. One of the most famous implicit methods is the Newmark-β method, and that of explicit methods is the Euler method. Implicit solvers have the advantages of a phenomenon that progresses with relatively low velocity. In implicit solvers, a mechanical equilibrium is precisely achieved by solving a matrix of an equation system even when a relatively large time step is used. A phenomenon that progresses with a very low velocity, such as delamination in a Double-Cantilever Beam test, is analyzed as a quasi-static problem by implicit solvers without consideration of inertia. In this case, the solver is called an implicit static solver. A phenomenon that progresses with very high velocity such as an impact problem is difficult to solve without explicit solvers. In explicit solvers, unknown displacement vectors are obtained without solving large size of matrix of an equation system. They are simply calculated by explicitly substituting known vectors in previous steps to a linear equation to obtain the displacement in the next time step. Computational costs for a single step are significantly reduced by this scheme. However, there is a limitation of time steps that leads to converged solutions in an explicit dynamic scheme, known as Courant–Friedrichs–Lewy condition [33]. The solution is diverged with time steps larger than the limit defined by this condition. Therefore, an explicit dynamic solver requires a huge number of time steps in the analyses in many cases. Since the limitation if the time step is related to velocity of stress wave in the material, the mass scaling technique, in which a virtual mass larger than that of realistic materials is used, is often adopted to increase the limit [32]. A wide variety of damage-related problems in fiber-reinforced plastics have been successfully solved either by implicit or explicit FE solvers. However, quasi-static problems with unstable damage propagation observed in experiments such as Open-Hole Compression tests are still not easy to solve since the problem itself is quasi-static, but the failure event instantly occurs. Although an explicit dynamic solver was chosen from the beginning, in some cases, when abundant computational resources were available, a hybrid approach that combines implicit and explicit solvers was proposed, as already mentioned [32].
In the present study, an implicit static scheme with a special treatment on damage propagation is proposed to effectively solve the problems with unstable damage propagation by a commercial implicit FE solver. This paper is organized as follows. First, a methodology including the program flow and formulation of a finite element method is described in Section 2. Then, numerical examples to validate the feasibility of the methodology are presented, and results of the examples are discussed in Section 3. Concluding remarks are given in Section 4.

2. Numerical Method

2.1. A Method of Failure Path Tracking

When damage such as a crack is initiated, stress is concentrated at a tip of the damaged region, so the damage propagation is supposed to occur at the tip of the damaged area. This behavior can be naturally expressed by an explicit dynamic FEA solver since it uses very small increments of time. However, it is difficult for an implicit static FE solver to correctly express this behavior because of the following reasons.
Stress concentration around a hole in a plate under compressive loading is shown in Figure 1a. When critical stress for initiation of damage under compressive loading is −1850 MPa, the potential region of damage is the blue area at the horizontal edge of the hole. In an implicit static FE analysis, load and/or displacement increment is usually set to relatively large value. Therefore, failure criteria are satisfied at a group of elements in the blue area during a single step of the analysis, but all these elements are not necessarily at the tip of the damaged region. If all elements in this area are degraded according to the law of Continuum Damage Mechanics, a wide region is incorrectly treated as failed.
In addition, the damage can unstably propagate. In some conditions, stress intensity at the tip of the damaged region does not decrease with propagation of the damage, and the damage keeps propagating until the material has completely failed. Explicit dynamic solvers can cope with this situation by considering the effect of inertia. Implicit static solvers usually have capability to automatically reduce load and/or displacement increment when the solution is difficult to converge. However, when the damage is unstably propagating, no state of mechanical equilibrium exists during the step of the analysis, no matter how much the increment of the load is reduced. Therefore, the analysis prematurely exits in this case.
Due to these behaviors, it is difficult for an implicit static FE solver to track correct failure paths in some cases of analyses with Continuum Damage Mechanics. To overcome this problem, the present method incorporates a special treatment on propagation of the damage based on Fracture Mechanics into the conventional method with Continuum Damage Mechanics. The energy release rate in potential region of damage is evaluated based on stress state, as shown in Figure 1a, and only the element at the tip of the region of damage where the energy release rate exceeds its critical value is degraded with a constitutive law of Continuum Damage Mechanics. Then, redistribution of stress is calculated according to the degradation of the element at the tip of the damaged region. The numerical solution is iteratively calculated until propagation of the damage during a load step of the analysis is completed, as shown in Figure 1b. This procedure requires modification of program flow of implicit static FE code by user subroutines, which is described in the next section.

2.2. Modification of Program Flow of a Finite Element Code

In the present study, the subroutines were implemented in Marc 2017 (MSC Software, Inc., Newport Beach, CA, USA). The flow of the program was implemented as shown in Figure 2. In an implicit static FE code such as Marc, the following incremental form of equilibrium equation is solved.
K δ u = δ F
where K, δu, and δF are global stiffness matrix, incremental displacement vector, and incremental load vector, respectively.
Since solution of the equation is nonlinear, the equation is iteratively solved with a Newton–Raphson procedure until specified convergence conditions are satisfied. Convergence is usually evaluated by residual vectors defined as
R = F V   B T σ d V
where R and B are the residual vector and a matrix that defines relationship between strain and nodal displacements. σ is stress tensor expressed as a column vector. In Marc, the solution is recognized to be converged when the following condition is satisfied.
R F r < T
where the norm operator means the maximum value in the model. Fr and T are reaction force in the model and threshold constant, respectively [34]. This condition means that ratio of the maximum residual to the maximum reaction force is lower than the specified threshold.
In addition to the above criterion, convergence of maximum energy release rate in the model is evaluated in the present method. The energy release rate is calculated in a user subroutine UPROGFAIL, and its convergence is evaluated with following criteria.
G < G c
where G represents the energy release rates of all damaged elements in the model, and Gc is the fracture toughness of the material. This means that the iterative calculation is continued until the maximum energy release rate in the model becomes lower than its critical value. Evaluation of this condition is conducted in a user subroutine USELEM. Numerical calculation of energy release rate is discussed in detail in the next section.

2.3. Constitutive Models of the Material

In the present method, a lamina in elastic region is simply treated as an orthotropic material as similarly assumed in the classical lamination theory [1]. The orthotropic material is assumed to be linear elastic until initiation of damage. The initiation of damage is evaluated by one of stress-based failure criteria mentioned in Section 1. After that, moduli Eij of the material are modified by stiffness reduction factors rij according to degradation of the material as
E i j * = r i j E i j
where summation convention is not used.
To express development of the damage, the energy release rate averaged in an element is evaluated and compared to mesoscopic fracture toughness of a lamina in the present method based on an idea that complex interactions between damage of constituents are detected as averaged apparent mesoscopic properties. It is reported by Pinho et al. that dependency of the solution on mesh density becomes small when smeared formulation, in which averaged energy release rate in an element is calculated, is adopted [24]. When the energy release rate in an element exceeds the fracture resistance of the material, the element is recognized as having failed, and rij of related failure mode is set to zero. We consider three principal planes of potential failure in L, T, and Z directions, which correspond to longitudinal direction to the fiber, transverse direction to the fiber, and thickness direction, respectively, as shown in Figure 3. Each component of energy release rate is calculated from components of strain energy density related to the planes of potential failure as follows.
U L ¯ = σ L d ε L + τ L T d γ L T + τ L Z d γ L Z
U T ¯ = σ T d ε T + τ L T d γ L T + τ T Z d γ T Z
U Z ¯ = σ Z d ε Z + τ L Z d γ L Z + τ T Z d γ T Z
The averaged energy release rate is calculated by dividing the strain energy by area of the potential failure plane as
G i = A i V   U i ¯ d V U i A i       i = L , T , Z
Δ U i = V e   U i ¯ d V
Δ A i = S e   d S
In finite element analyses, volume integral is numerically conducted by Gauss integral with respect to element coordinate system. The volume integral of the strain energy is expressed as
U i = V   U i ¯ d V = U i ¯ d x d y d z
=     U i ¯ J d ξ x d η d ζ
where J is Jacobian matrix defined as
J = x ξ x η x ζ y ξ y η y ζ z ξ z η z ζ
The potential failure planes are generally inclined with arbitral angle from axes of reference coordinate system. The area of the potential failure planes is expressed as a function of θ, which is the angle from the first axis of reference coordinate system to the orientation of fibers, as shown in Figure 4a. For example, the area of the potential failure plane L is written as
Δ A L = d l d z = 1 + t a n 2 θ d y d z
The following relationships are used in the above equation.
d l = d x 2 + d y 2 = 1 + d x d y 2 d y = 1 + t a n 2 θ d y
It is useful to express the area integral with respect to the element coordinate system when it is numerically calculated by Gauss integral. The integral is expressed with components of the Jacobian matrix as
Δ A L = 1 + t a n 2 θ 1 1 ξ 1 ξ 2 y ξ d ξ + η 1 η 2 y η d η z ζ d ζ
The following relationships are used in the above equation. It is assumed that direction of ζ axis is same as that of z axis. Therefore, x and y do not vary in ζ direction, and z does not vary in ξ and η direction.
d y = y ξ d ξ + y η d η + y ζ d ζ = y ξ d ξ + y η d η
d z = z ξ d ξ + z η d η + z ζ d ζ = z ζ d ζ
The areas of potential failure planes in other directions are similarly obtained.
In the case of an 8-noded hexahedral element with low-order interpolation functions, the numerical integration in element coordinate system is conducted at 8 integration points shown in Figure 4b.

3. Numerical Examples

In order to confirm feasibility of the present method, two problems were chosen as numerical examples described in following sections. Open-Hole Compression tests were calculated to test the applicability to unstable damage propagation. Double-Cantilever Beam tests were calculated mainly to test dependencies on mesh density and loading history.

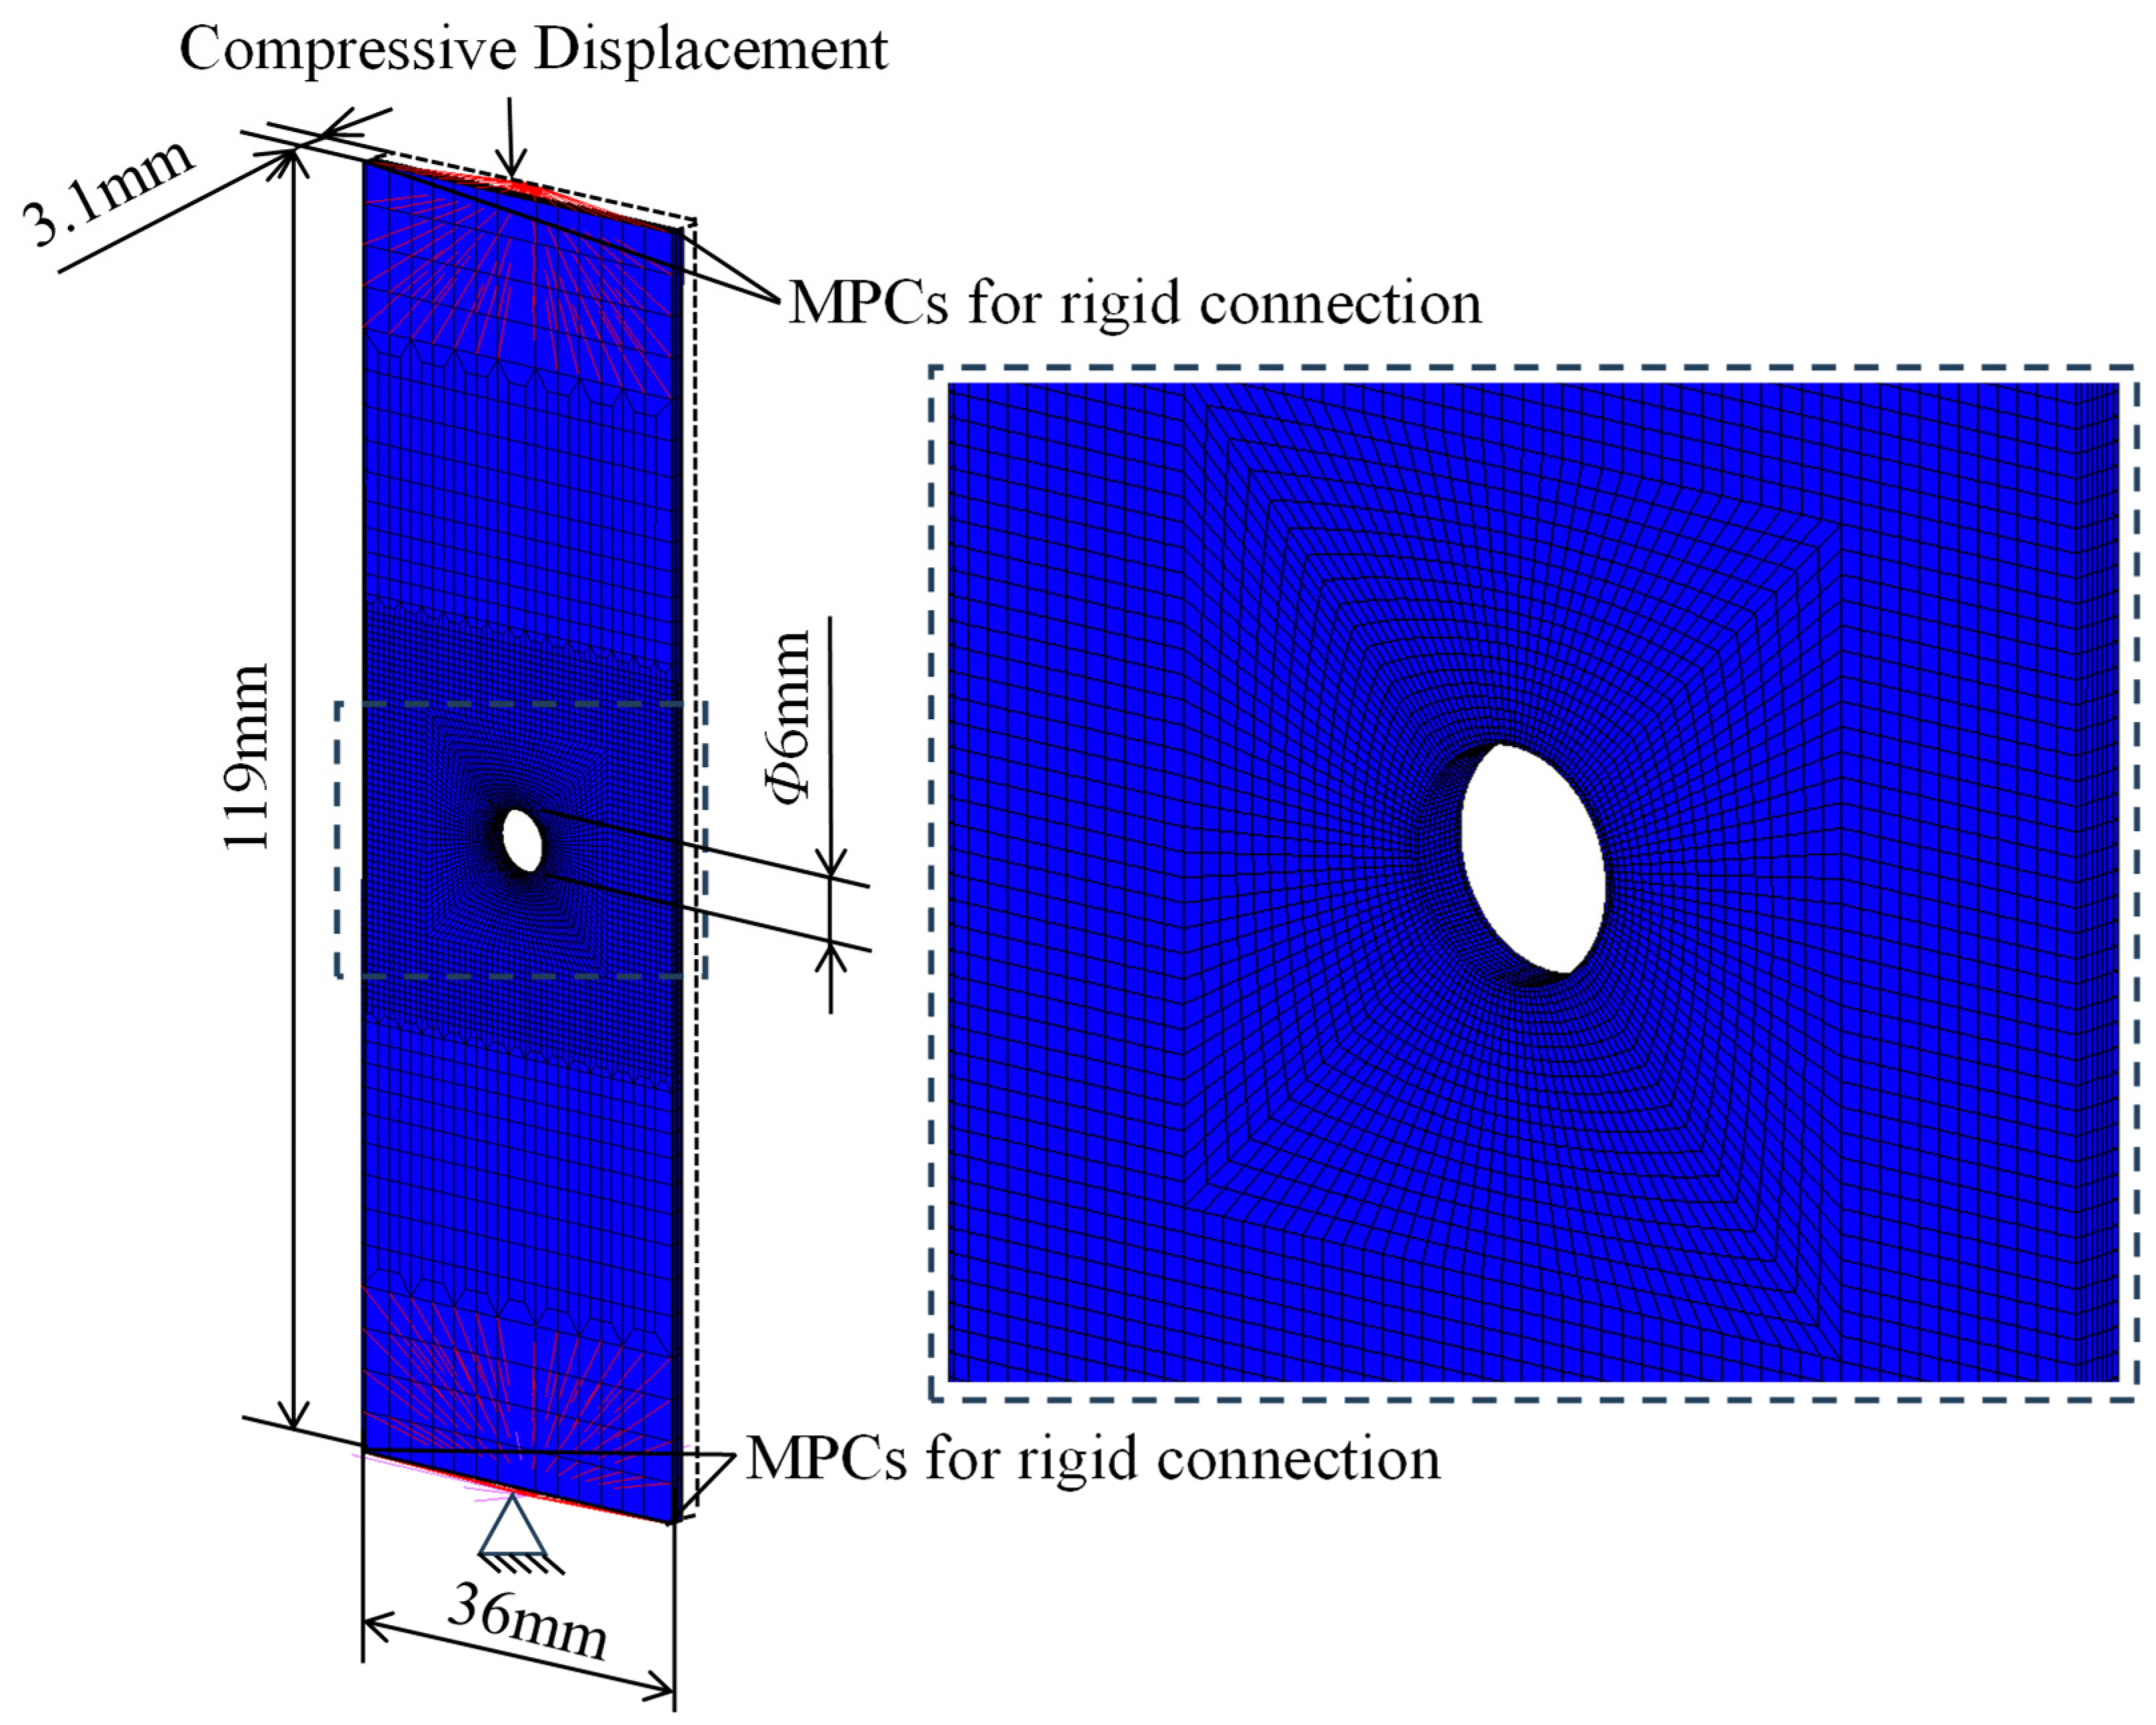
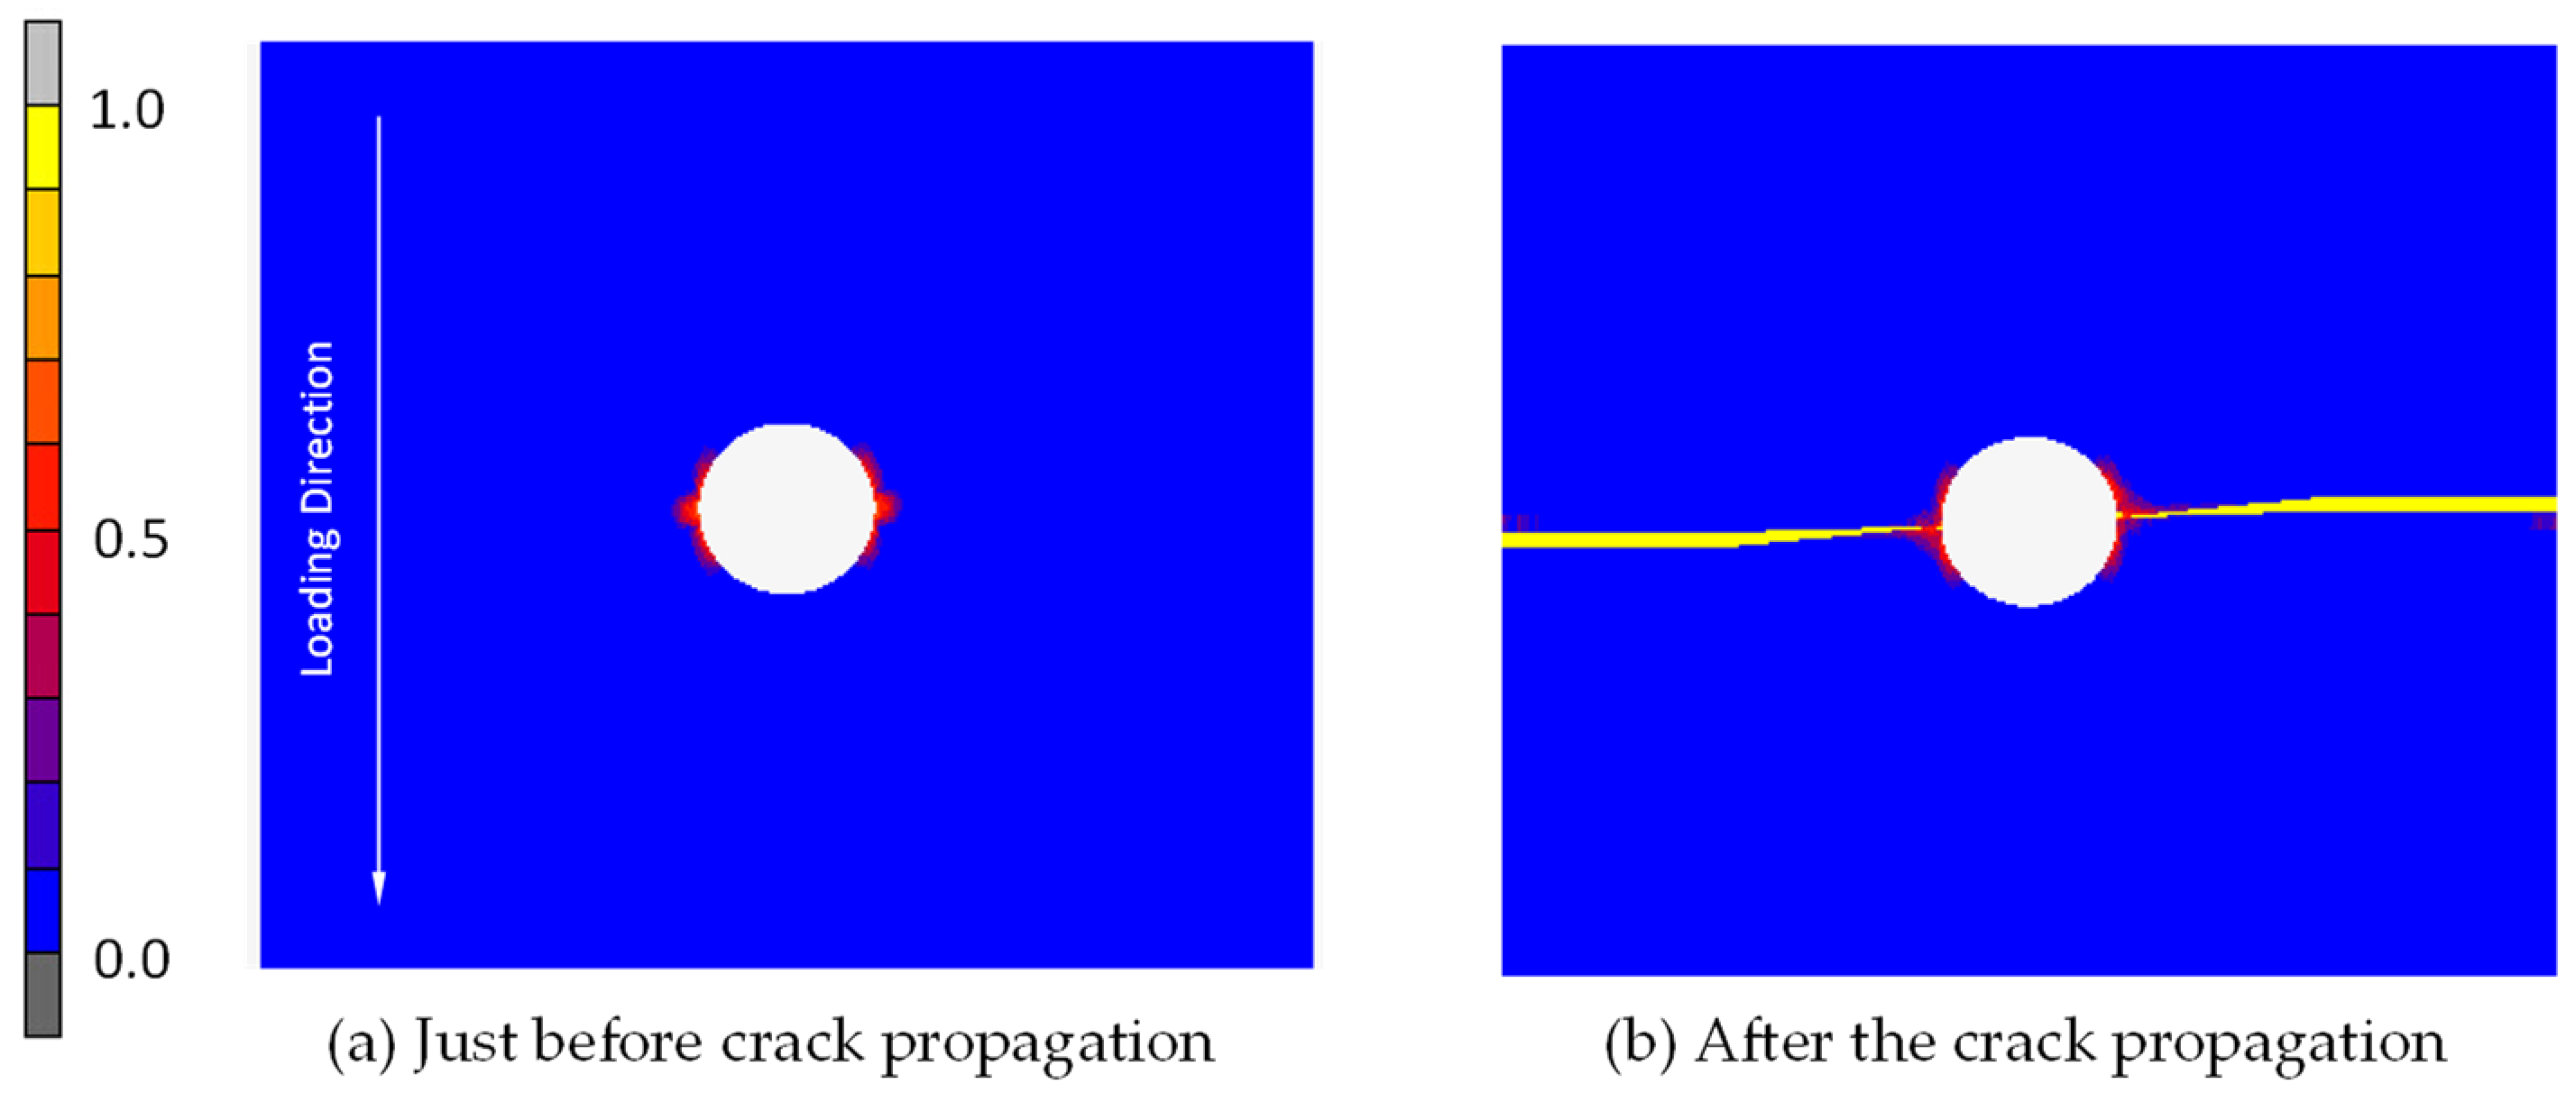
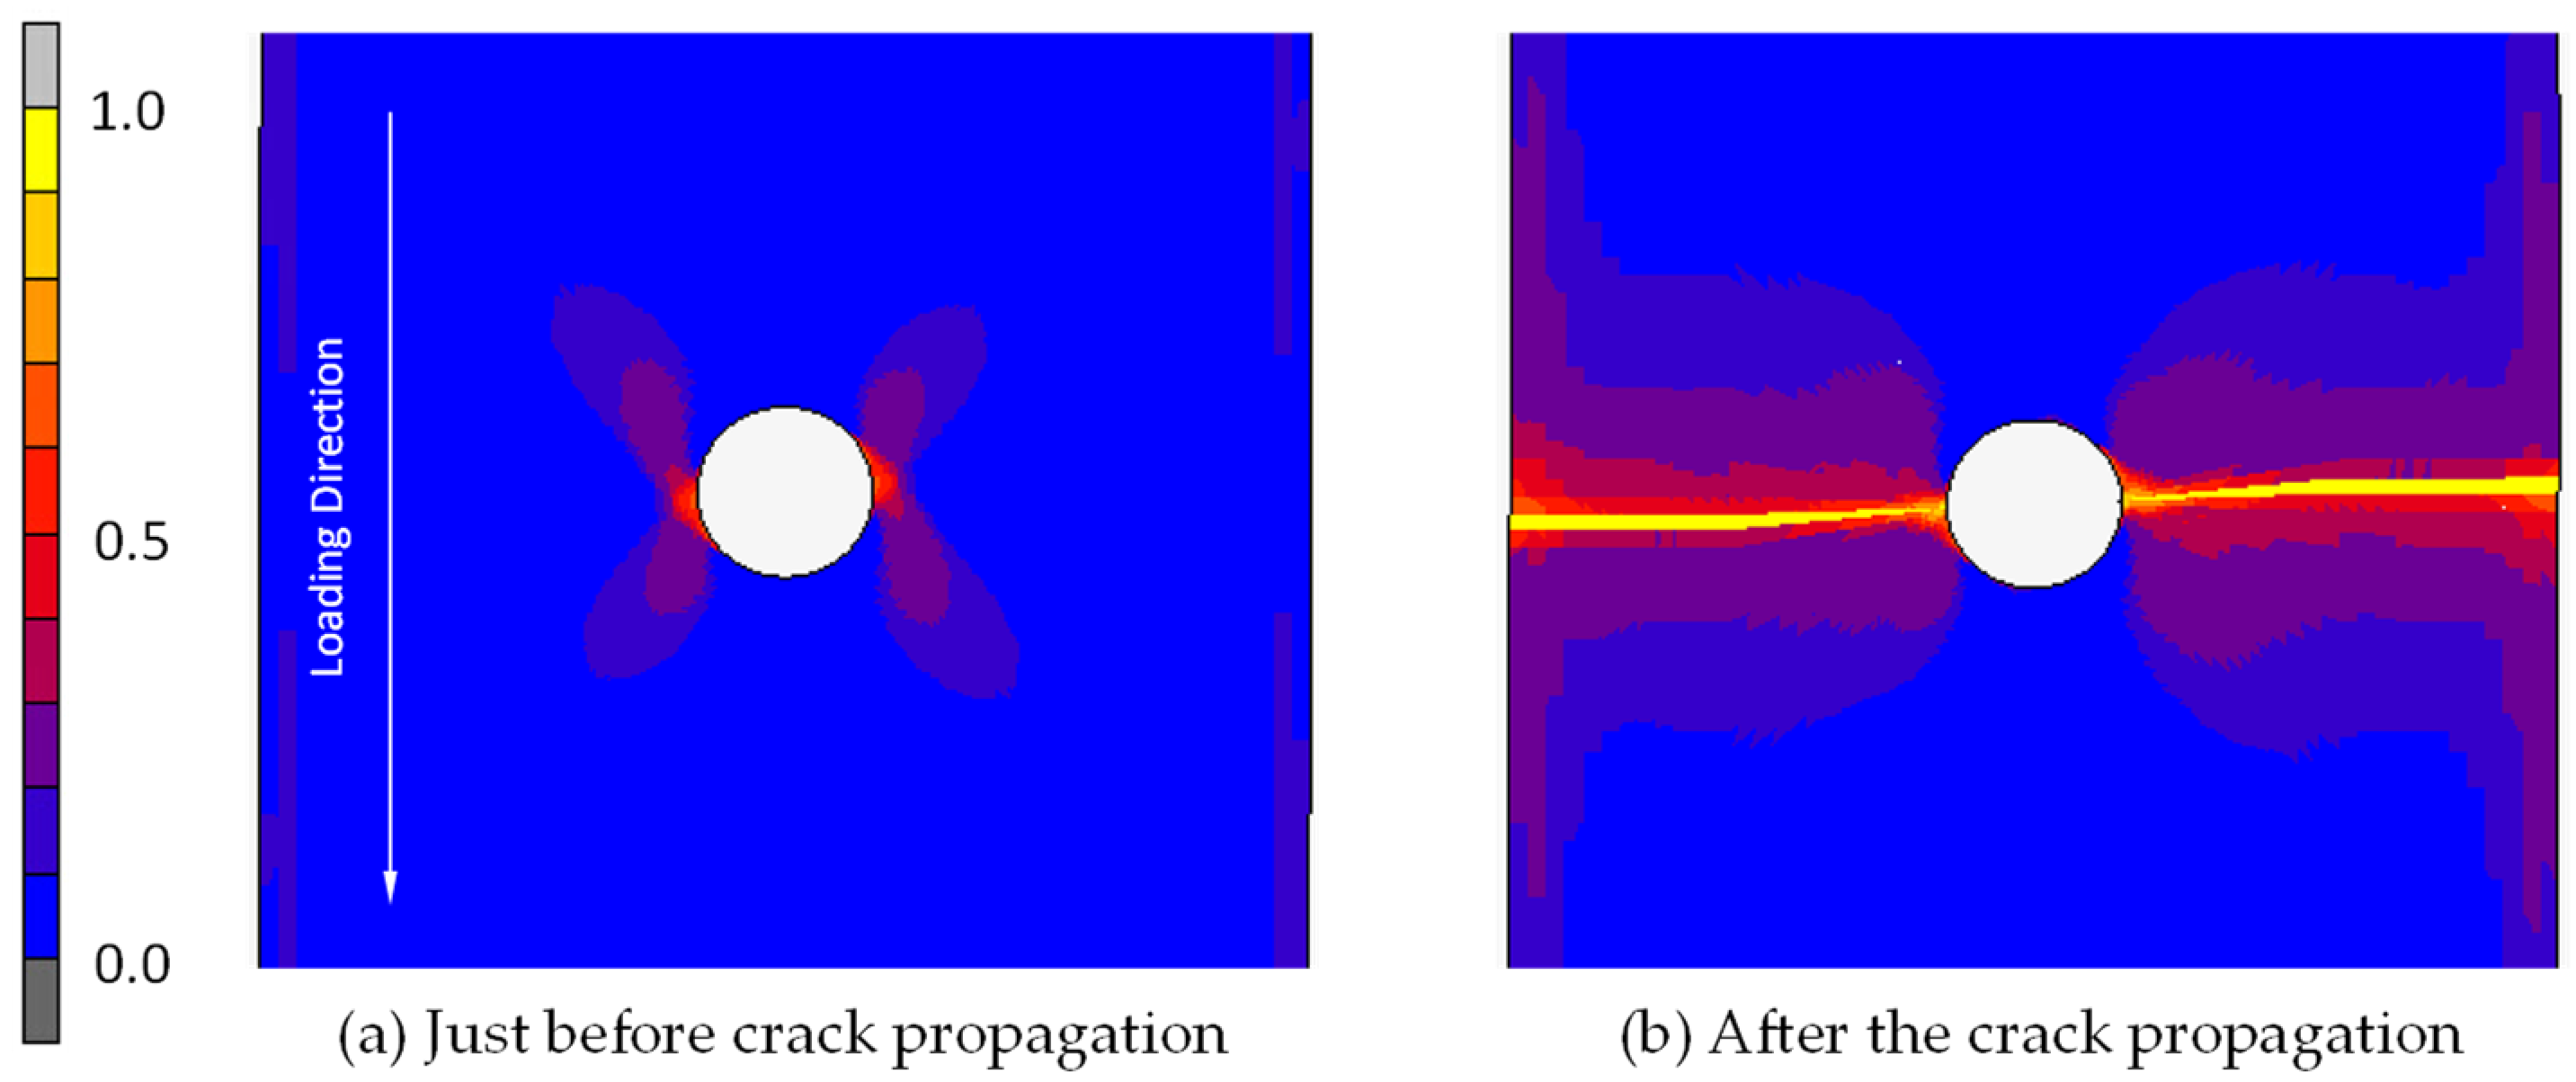
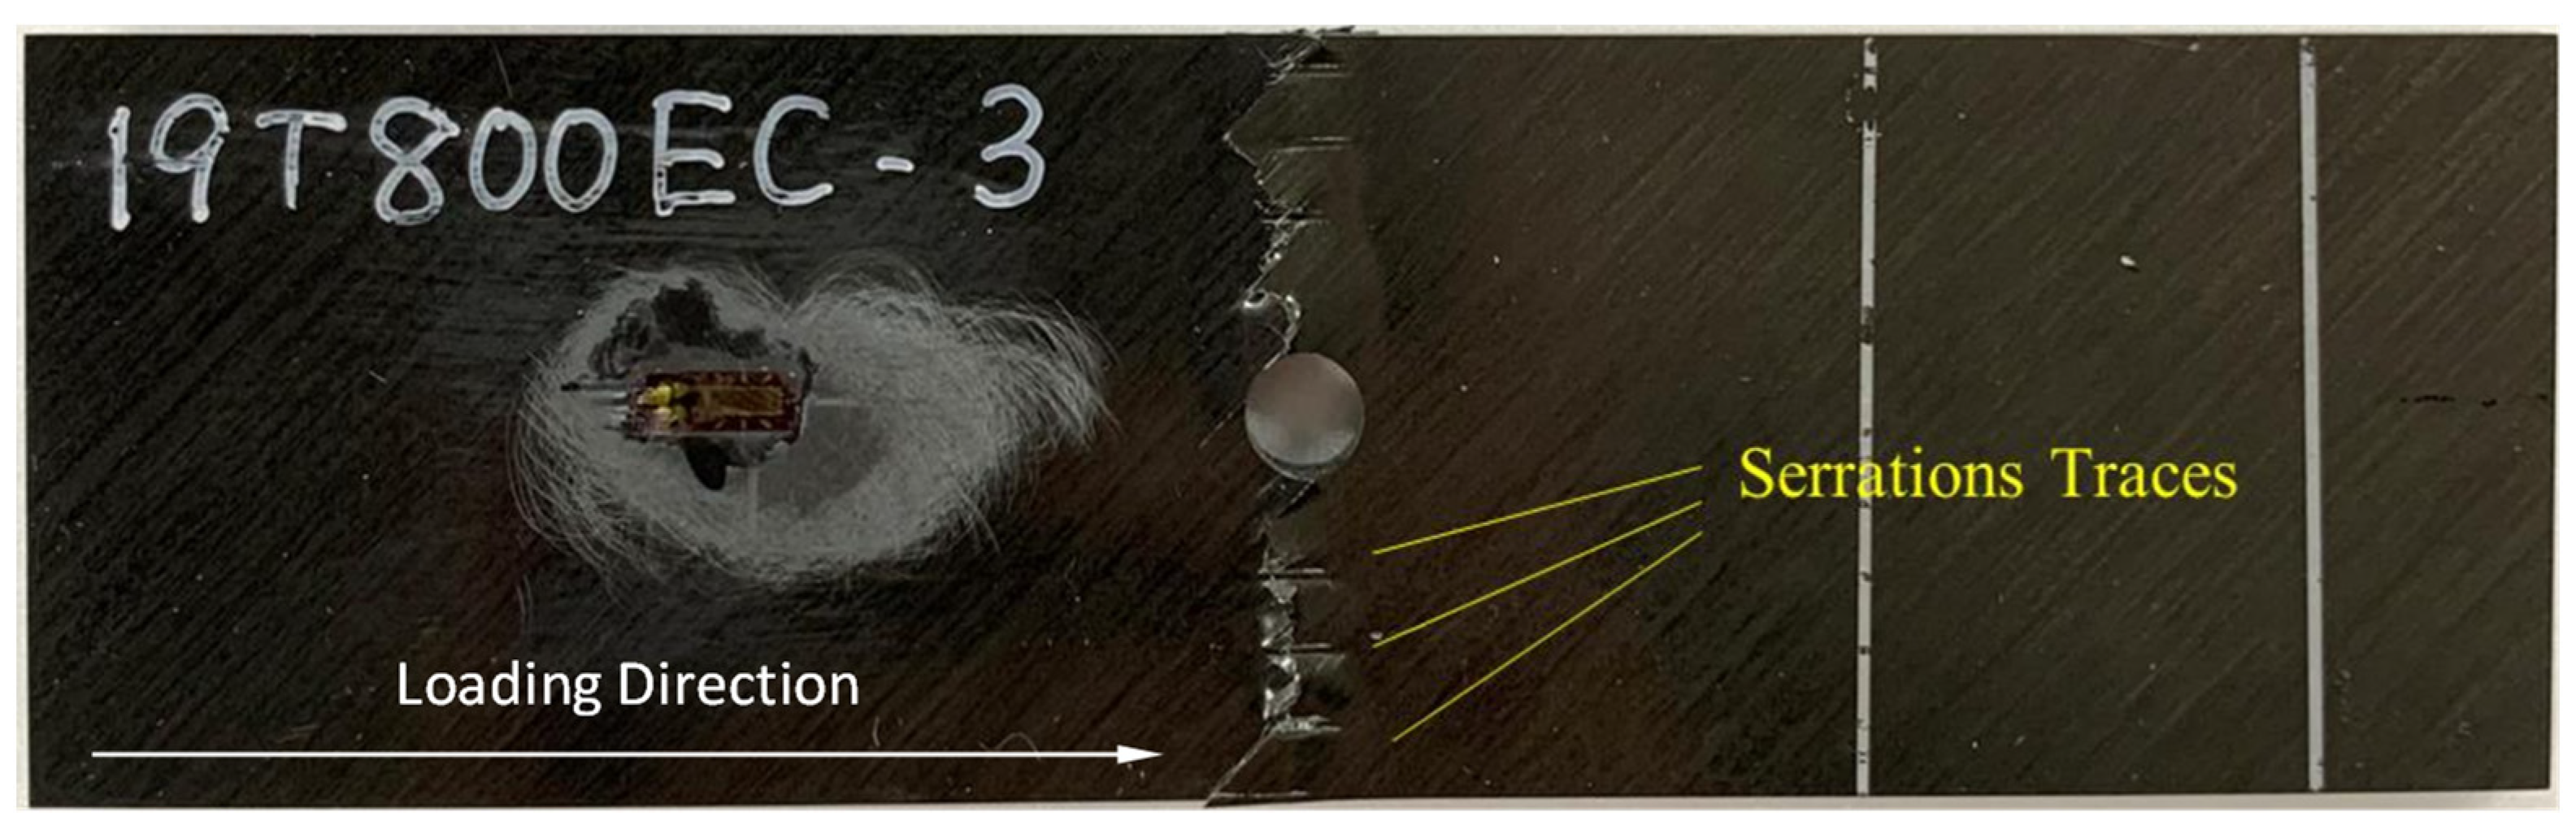
3.1. Open-Hole Compression Tests

3.1.1. FEA Model

The present method was applied to the analyses of Open-Hole Compression tests conducted in our previous study [35]. Specimens were made with P2352W-19-305 prepreg composed of T800S-24K fibers with 65% of volume fraction and #3900-2B epoxy as matrix (Toray, Inc., Tokyo, Japan). Material properties shown in Table 1 were obtained from tensile experiments of unidirectional laminates. The linear-elastic response was assumed for components other than LT components. The nonlinear stress–strain relationship of the LT component due to visco-elastic-plastic characteristics of the matrix was obtained from iosipescu shear tests and defined in the analyses by Swift law with F = 200, b = 4000, and n = 0.26, as follows.
τ L T = F b + γ L T n
Quasi-isotropic specimens with stacking sequence [45/0/−45/90]2s were modeled with dimensions shown in Figure 5. Each lamina was stacked with respect to the angle from the longitudinal axis of the specimen, which is the same as the loading direction. Half model was created with 8-noded hexahedral elements according to the symmetricity in the thickness direction. Each ply of the specimens was modeled with a different set of elements. The principal coordinate systems of an orthotropic material are defined for the plies. Analyses were conducted for cases with consideration of damage only in the L direction and that with damage in the L and T directions to investigate interaction between damage in the L and T direction.
It is reported by Camanho et al. that the fracture toughness Gc for compressive fiber failure of the lamina can be experimentally evaluated [9], but it is not available for the material system used presently. Therefore, two reference values GcL = 10.0 kJ/m2 and 20.0 kJ/m2 were used in the present example. The fracture toughness for failure in transverse direction of the lamina was set as GcT = 2.0 kJ/m2. For the initiation of damage, any stress-based failure criterion mentioned in Section 1 fits the present method. Because of nearly uniaxial stress state in 0-degree layers where the damage is initiated first, the maximum stress criterion with Xc = 1850 MPa was adopted in this example. Nodes in the clamped area were rigidly connected to a representative node with MPCs as shown as red lines in Figure 5, and the boundary conditions of fixed displacement were defined to the representative nodes to apply the compressive load.

3.1.2. Results and Discussion

The distribution of damage in 0-degree and 45-degree layers in the analysis with GLc = 10.0 kJ/m2 are shown in Figure 6 and Figure 7, respectively. Typical damage of specimens in OHC tests conducted in our previous study is shown in Figure 8. It is important to note that the loading direction of the specimen in the picture is the horizontal direction, but that of the analysis is the vertical direction. It is observed in both the analysis and experiment that compressive failure occurred from the transverse edge of the hole. Suemasu et al. studied the progress of the damage in OHC tests of quasi-isotropic laminates with a stacking sequence that is the same as that in the present example [10]. They reported that the fiber compressive damage of 0-degree layers was initiated at the transverse edge of the hole, and then it propagated a little in the circumferential direction. A similar trend was observed in the present analysis, as shown in Figure 6a. The study reported that the crack unstably propagated after a small amount of stable propagation of the damage, and the specimen failed completely, similarly to the present result in Figure 6b. The tracked path of failure in a 0-degree layer was slightly deviated from center line of the specimen due to effect of neighboring ±45-degree layers. The experimental study reported that a band of damage with a zig-zag failure pattern consisting of small compressive fiber failure and matrix cracks was observed in a region from the transverse edge of the hole in 45-degree layers of the failed specimen. In the present analysis, a band of damage was created at the same location as shown in Figure 7b, although the microscopic damage morphology was not expressed.
Figure 9 shows the relationship between the nominal strain and nominal stress obtained from the analyses with GLc = 10.0 kJ/m2 and 20.0 kJ/m2. Solid and dashed lines indicate the results with consideration of damage in the L direction and that with damage in the L and T directions, respectively. Points marked with (a) and (b) correspond to the distribution of damage shown in Figure 5 and Figure 6. The analytical results are compared to the experimental results. The peak stress from the analytical results with GLc = 10.0 kJ/m2 agreed with that in the experiment, i.e., the strength of the specimen, although the stiffness is slightly different. The strengths of the specimen in the experiments are in a range between the two peak stresses in the analyses.
The stress abruptly decreased at point (a) in Figure 9 when the damage unstably propagated, as shown in Figure 6b. In analysis, cases with consideration of damage only in the L direction, the stress started to increase again with an increase in strain because stiffness related to the remaining T components. When the damage in both the L and T directions are considered for more realistic situations, the nominal stress dropped to zero at the final failure. However, the damage and nominal stress at the final failure of the specimens were not significantly different between the analyzed cases with the consideration of damage only in the L direction and that in L and T directions. This means that compressive failure of fibers in 0-degree layers is dominant failure mode, and failure of matrix and fibers in 45-degree layers follows the failure of 0-degree layers due to stress redistribution.
Number of iterations and CPU time required for each analysis case is shown in Table 2. Significant number of iterations was needed to solve a loading step at which unstable damage propagation occurred. This is because hundreds of elements failed at this single loading step and the failure of one of those elements was calculated with 1 or 2 iterations in the present method. It is difficult to obtain converged solution at this step for the conventional method.

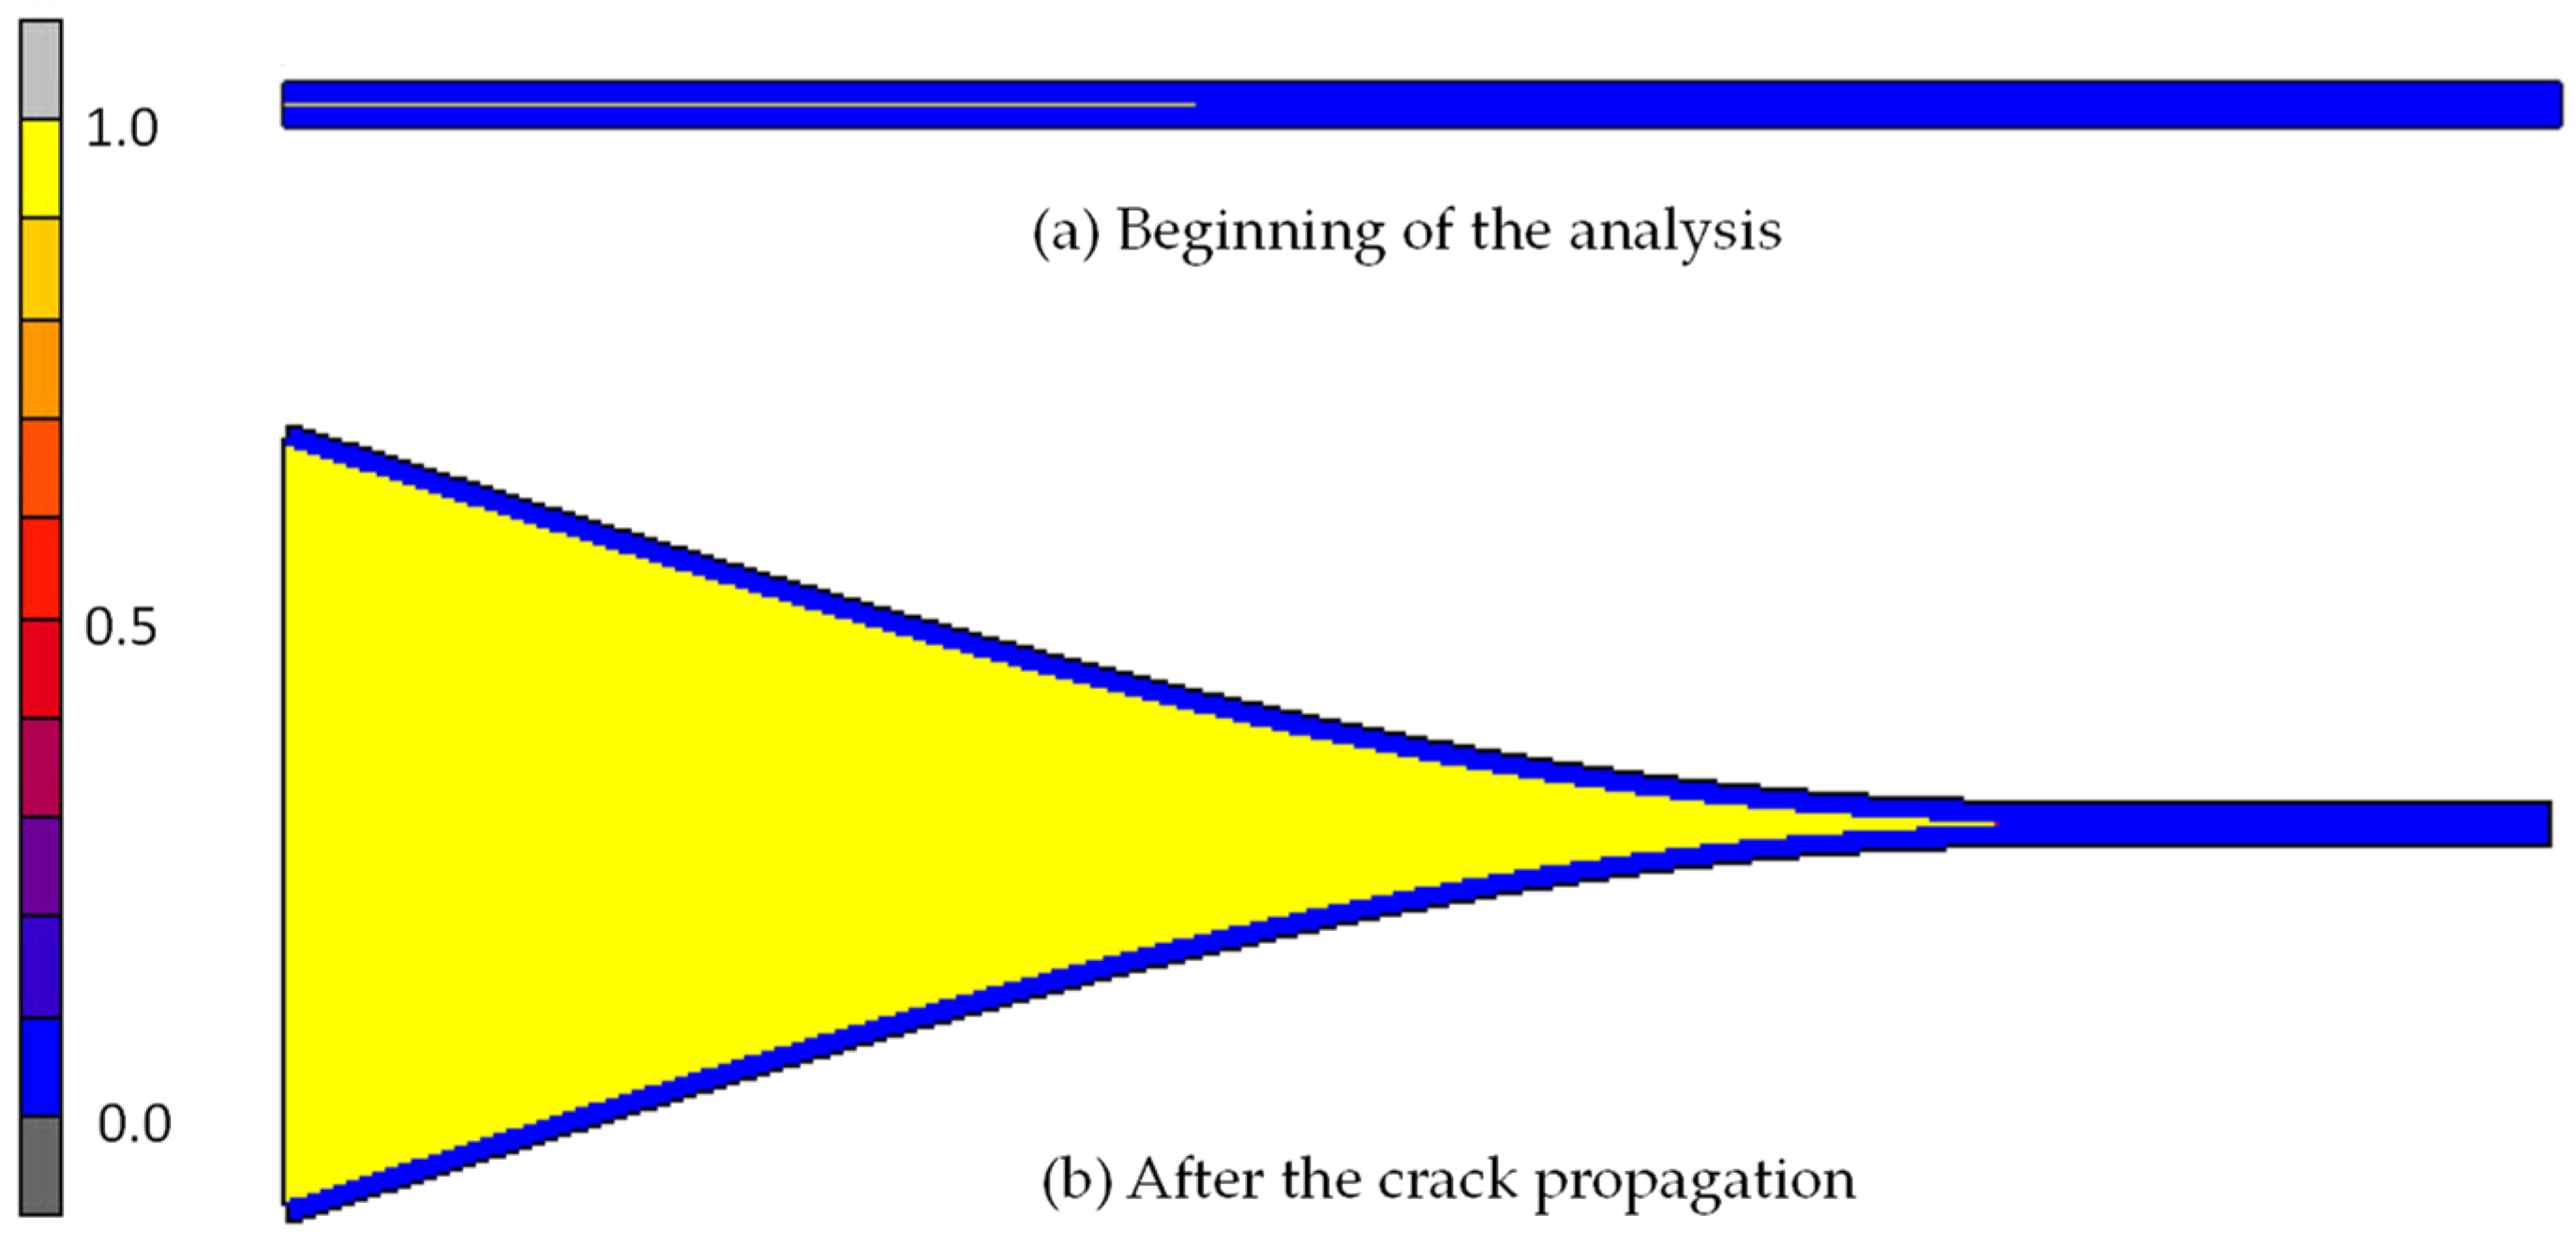
3.2. Double-Cantilever Beam Tests

3.2.1. FEA Model

Finite element analyses with the present method were conducted to model Double-Cantilever Beam Tests. The test is experimental method to evaluate fracture toughness for delamination, but the present method can be applied to model it by enabling damage in thickness direction. A theoretical result of relationship between load and displacement is available for the test although it is based on an isotropic material [36]. The results from the analyses were compared to the theoretical result as a reference. Eight-noded hexahedral elements were used to create the model shown in Figure 10. An orthotropic elastic material with principal axis aligned to longitudinal direction of the specimen was used. The same material properties in the previous example were used for this model. Damage in z direction with reference value of fracture toughness GZc = 1.0 kJ/m2 was considered to model delamination. Whole model is considered as a region of potential failure, and an initial crack was modeled by setting damage parameters for elements located at initial crack as failed status from the beginning of the analysis. Nodes at loading edges were rigidly connected to representative nodes with MPC as shown as red lines in Figure 10, and boundary conditions of fixed displacement were defined to the representative nodes to apply crack opening displacement. Models with 3 different number of elements, 2700, 5500 and 10,200 were analyzed to test dependency of the solution on mesh density. Since the results were supposed to be affected by not only number of elements but also aspect ratio of the element, the aspect ratio for these models was kept as close as possible. Ratio of element size in longitudinal direction to that in thickness direction was set to about 2.0 in all models. To test dependency of the solution on loading history, 2 different number of load steps for an analysis, i.e., time steps, were chosen, and models with 2 different length of initial cracks, 30 and 60 mm were analyzed.

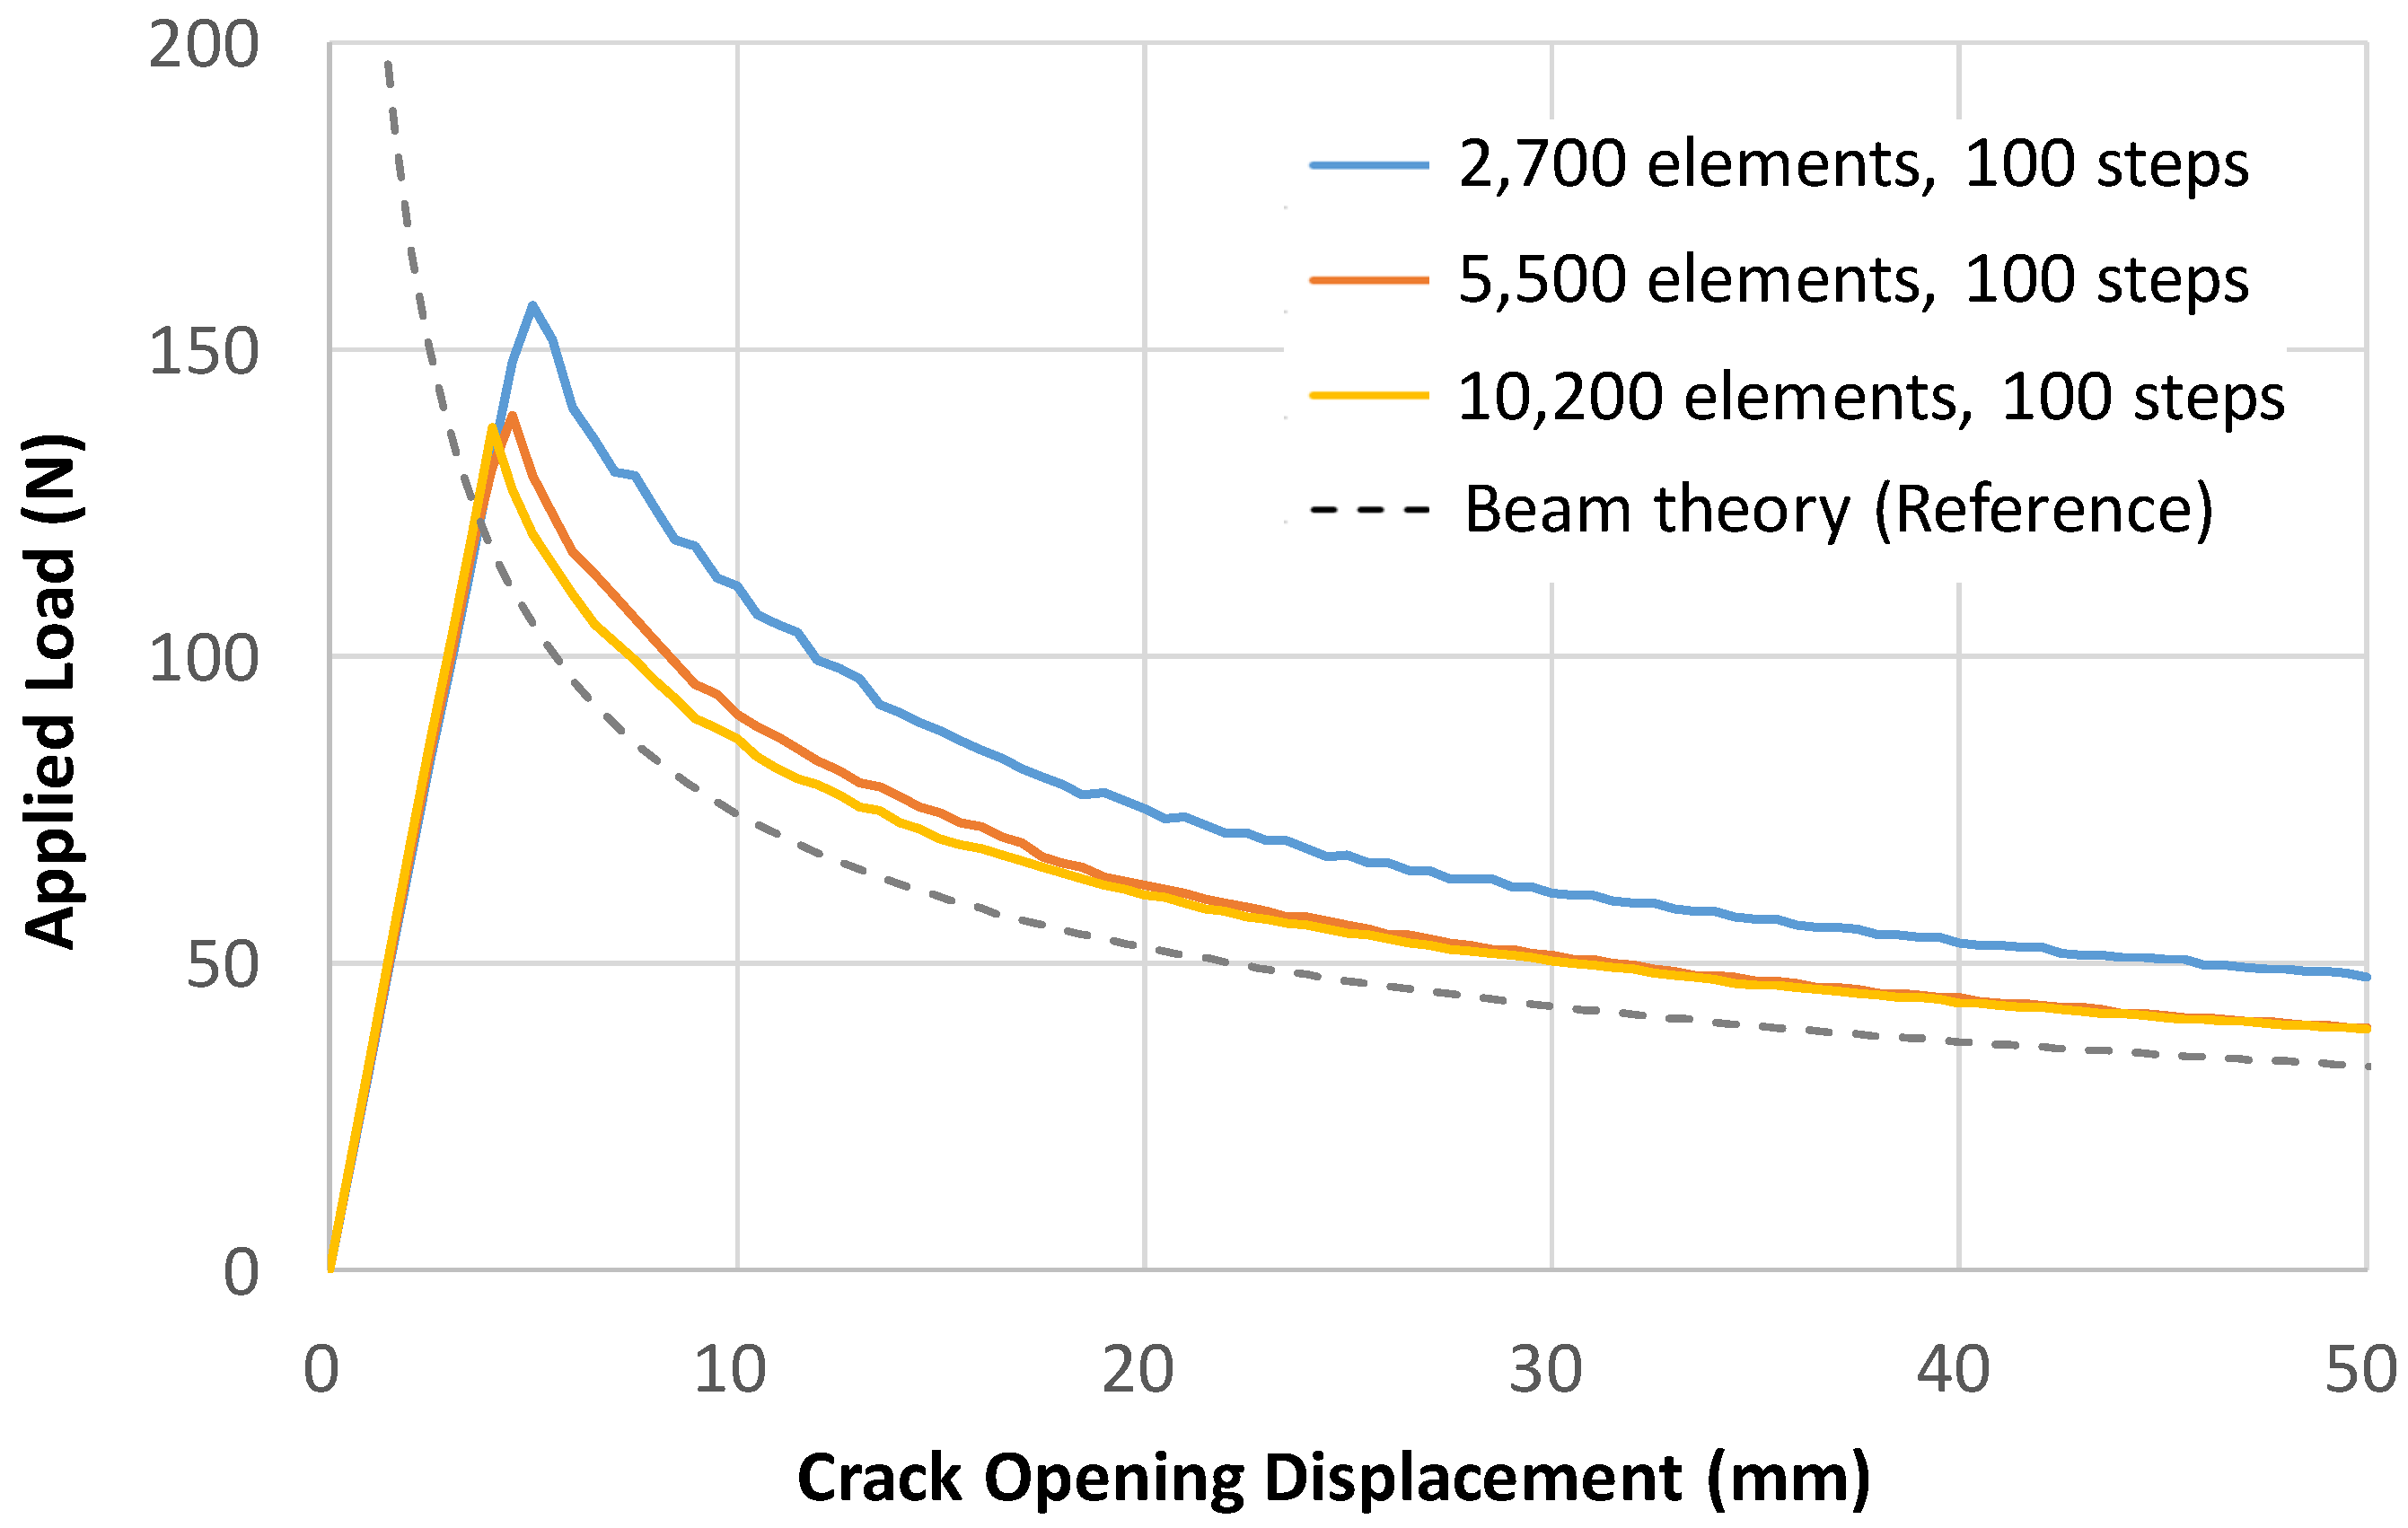
3.2.2. Results and Discussion

Figure 11a,b show initial and deformed shapes of the model, respectively. Distributions of damage are also shown in the figures. The damage propagated straight at center of the specimen. A triangle-shaped band is seen between the beams after the propagation of damage. This is due to failed elements remained in the model, but they no longer have stiffness to contribute the results.
Relationship between applied load and displacement from models with different number of elements are shown in Figure 12. The numerical results became closer to the theoretical result as the mesh density is increased. The difference between the analytical and theoretical result is mainly caused by the reason that the theory is based on an isotropic material although orthotropic material was used in the present analyses.
Figure 13 shows relationship between applied load and displacement from analyses with different number of steps and lengths of initial crack. Solid lines indicate results from analysis with 100 steps, and diamond-shaped markers indicate results from analyses with 25 steps. The results with large load increment were almost same as that with the 1/4th of load increment. Blue and Orange lines are results with different lengths of initial cracks. Initial slope of load–displacement curve was constant, which means that the crack did not start to propagate. The stiffness gradually decreased after the crack started to propagate. The peak points were different for 2 lengths of initial cracks because of difference of initial stiffness of the beams, but the same path was tracked during the crack propagation in the 2 analyses.
Table 3 shows number of iterations and CPU time required for each analysis case. Iterations required for analyses with different load steps were not significantly different when number of elements were the same. For example, difference between number of iterations in analysis cases 2 and 5 was about 8%. This is because 1 or 2 iterations were needed to calculate failure of a single element regardless of the size of load steps. Therefore, similar number of iterations were requited in analyses with the same number of failed elements.

3.3. Discussion on Characteristics of the Present Methodology

3.3.1. Applicability to Unstable Damage Propagation

The present method was developed mainly to conduct analyses in which damage unstably propagates such as Open-Hole Compression tests by an implicit static FE solver. The objective was fulfilled as follows. In one of previously mentioned numerical studies, implicit static FE solver was used to analyze tests of open-hole specimens [26]. In the study, it is mentioned that converged solution was not obtained when damage unstably propagated at final failure. Another study adopted hybrid solution scheme in which solution scheme was changed from implicit scheme to explicit scheme when the solution was not converged [32]. The study mentioned that this capability was invoked for analyses of open-hole specimens. In the present study, damage started to propagate at point (a) in Figure 9, and equilibrium state after the abrupt drop of the nominal stress was obtained at point (b). After that, the stress started to stably increase again with the strain increment. This result means that the unstable damage propagation during a step of an analysis was successfully tracked with an implicit static solver, and a state of mechanical equilibrium after the final failure of the 0-degree layer was successfully reached.

3.3.2. Dependency on Mesh Density

In the present study, averaged energy release rate in an element is calculated to evaluate condition of damage propagation with reference to the smeared formulation proposed by Pinho et al. [24]. This method was adopted in the aim of a reduction in the dependency of the solution on mesh density. The dependency in the present study was expectedly small as the previous study reported. In Figure 10, the results became closer to the reference results as mesh density was increased. However, the difference between the results was small for the difference of number of elements as many as 2 times. The difference in peak loads between the analyses with 2700 and 5500 elements was about 7%, and that between the analyses with 5500 and 10,200 elements was about 1%. These results indicate that the dependency is sufficiently small to apply the present method to analyses with a wide variety of element sizes without losing accuracy.

3.3.3. Dependency on Loading History

Implicit FE solvers are computationally more effective than explicit FE solvers for phenomena at a low velocity because it can use relatively large time steps without a significant loss of accuracy [26]. With this reason, the hybrid scheme in the previously mentioned numerical study uses an implicit scheme at first and changes to an explicit scheme only when it faces convergence problems [32]. Therefore, it is advantageous if implicit solvers can be used without worry of the convergence problems. The results in Figure 11 showed that the size of load steps did not affect the solution of the present method. In Figure, the result with a larger load step is the same as the result with a load step as small as 1/4th of the larger one. The figure also shows that a single state of the mechanical equilibrium was reached regardless of the different initial conditions. It is observed from Table 3 that the total number of iterations does not significantly change with respect to the size of load steps. These results indicate that the present method derives the solution without dependency on loading history such as the size of the load steps and initial conditions. This characteristic of the present method will contribute to a reduction in computational costs.

4. Conclusions

A method for analyses of unstable damage propagation in fiber-reinforced plastics with an implicit static FE solver was proposed. The algorithm and formulation were implemented in commercially available code by user subroutines. The feasibility of the method was validated by two numerical examples. The following conclusions were obtained from the study.
  • The method is applicable to the problems of unstable damage propagation, which are usually difficult to solve by an implicit static FE solver.
  • The dependency of solutions on mesh density with the present method is so small that it is applicable to analyses with a wide variety of element sizes without losing accuracy.
  • A solution by the present method reaches a single state of mechanical equilibrium in analyses without dependency on loading history.
  • In further research, this method is going to be applied to analyses of Filled-Hole Compression tests in which one of the major challenges is modelling the contact between the hole and a fastener inserted in the hole. The present method will contribute toward coping with this challenge because it enables an implicit FE solver to calculate unstable damage propagation with reasonable consideration of the contact conditions. In addition, the mesoscopic constitutive law for fiber compressive damage at the contact point is going to be further studied.

Author Contributions

Conceptualization, A.K.; methodology, A.K.; software, A.K.; validation, Y.W., K.S., Y.I., E.H. and H.K.; writing—original draft preparation, A.K.; writing—review and editing, Y.W., K.S., Y.I., E.H. and H.K.; project administration, E.H. and H.K. All authors have read and agreed to the published version of the manuscript.

Funding

This research received no external funding.

Data Availability Statement

Data are contained within the article.

Acknowledgments

The numerical analyses in the present study were conducted on computer resources offered by the Research Institute for Information Technology, Kyushu University.

Conflicts of Interest

The authors declare no conflicts of interest.

References

  1. Jones, R.M. Mechanics of Composite Materials, 2nd ed.; Taylor and Francis Book; CRC Press: Boca Raton, FL, USA, 1998. [Google Scholar]
  2. Morais, A.B. Open-hole tensile strength of quasi-isotropic laminates. Compos. Sci. Technol. 2000, 60, 1997–2004. [Google Scholar] [CrossRef]
  3. Wisnom, M.R.; Hallett, S.R. The role of delamination in strength, failure mechanism and hole size effect in open hole tensile tests on quasi-isotropic laminates. Compos. Part A 2009, 40, 335–342. [Google Scholar] [CrossRef]
  4. Soutis, C. Damage Tolerance of Open-Hole CFRP Laminates Loaded in Compression. Compos. Eng. 1994, 4, 317–327. [Google Scholar] [CrossRef]
  5. Schltheis, C.R.; Waas, A.M. Compressive failure of composites, Part I: Testing and micromechanical theories. Prog. Aerosp. Sci. 1996, 32, 1–42. [Google Scholar] [CrossRef]
  6. Chang, F.K.; Lessard, L.B. Damage Tolerance of Laminated Composites Containing an Open Hole and Subjected to Compressive Loadings: Part I—Analysis. J. Compos. Mater. 1991, 25, 2–43. [Google Scholar] [CrossRef]
  7. Pinho, S.T.; Iannucci, L.; Robinson, P. Physically based failure models ad criteria for laminated fibre-reinforced composites with emphasis on fibre kinking. Part I: Development. Compos. Part A 2006, 37, 67–73. [Google Scholar]
  8. Hallett, S.R.; Green, B.G.; Jiang, W.G.; Wisnom, M.R. An experimental and numerical investigation into the damage mechanisms in notched composites. Compos. Part A 2009, 40, 613–624. [Google Scholar] [CrossRef]
  9. Camanho, P.P.; Erçin, G.H.; Catalanotti, G.; Mahdi, S.; Linde, P. A finite fracture mechanics model for the prediction of the open-hole strength of composite laminates. Compos. Part A 2012, 43, 1219–1225. [Google Scholar] [CrossRef]
  10. Suemasu, H.; Naito, Y.; Gozu, K.; Aoki, Y. Damage initiation and growth in composite laminates during open hole compression tests. Adv. Compos. Mater. 2012, 21, 209–220. [Google Scholar] [CrossRef]
  11. Hashin, Z. Failure criteria for unidirectional fibre composites. J. Appl. Mech. 1980, 47, 329–334. [Google Scholar] [CrossRef]
  12. Pinho, S.T.; Davila, C.G.; Camanho, P.P.; Iannucci, L.; Robinson, P. Failure Models and Criteria for FRP under In-Plane or Three-Dimensional Stress States Including Shear Non-Linearity; NASA Technical Memorandum TM-2005-213530; NASA: Washington, DC, USA, 2005. [Google Scholar]
  13. Eshelby, J.D. The determination of the elastic field of an ellipsoidal inclusion, and related problems. Proc. R. Soc. A 1957, 241, 376–396. [Google Scholar]
  14. Laws, N. A note on interaction energies associated with cracks in anisotropic solids. Philos. Mag. 1977, 36, 367–372. [Google Scholar] [CrossRef]
  15. Orifici, A.C.; Thomson, R.S. Review of methodologies for composite material modelling incorporating failure. Compos. Struct. 2008, 86, 194–210. [Google Scholar] [CrossRef]
  16. Liu, P.F.; Zheng, J.Y. Recent developments on damage modeling and finite element analysis for composite laminates: A review. Mater. Des. 2010, 31, 3825–3834. [Google Scholar] [CrossRef]
  17. Maneval, V.; Vedvik, N.-P.; Echtermeyer, A.T. Progressive Fatigue Modelling of Open-Hole Glass-Fibre Epoxy Laminates. J. Compos. Sci. 2023, 7, 516. [Google Scholar] [CrossRef]
  18. Yang, F.; Li, Y.; Li, B. Characterization of Failure Behavior in Unidirectional Fiber-Reinforced Polymer via Off-Axis Compression on Small Block Specimens. Polymers 2023, 15, 4699. [Google Scholar] [CrossRef]
  19. Deng, J.; Zhou, J.; Wu, T.; Liu, Z.; Wu, Z. Review and Assessment of Fatigue Delamination Damage of Laminated Composite Structures. Materials 2023, 16, 7677. [Google Scholar] [CrossRef] [PubMed]
  20. Ravinath, G.; Wessley, J.J. LS-Dyna Impact Modelling on Carbon Fibre Reinforced Polymers (CFRP) Composite Aircraft Panel with Various Impactors. Eng. Proc. 2023, 59, 26. [Google Scholar] [CrossRef]
  21. Liu, B.; Lai, J.; Liu, H.; Huang, Z.; Liu, T.; Xia, Y.; Zhang, W. Finite Element Analysis of the Effect for Different Thicknesses and Stitching Densities under the Low-Velocity Impact of Stitched Composite Laminates. Polymers 2023, 15, 4628. [Google Scholar] [CrossRef]
  22. Tsivouraki, N.; Tserpes, K.; Sioutis, I. Modelling of Fatigue Delamination Growth and Prediction of Residual Tensile Strength of Thermoplastic Coupons. Materials 2024, 17, 362. [Google Scholar] [CrossRef]
  23. Murakami, S. Continuum Damage Mechanics; Springer: Dordrecht, The Netherland, 2014. [Google Scholar]
  24. Pinho, S.T.; Iannucci, L.; Robinson, P. Physically based failure models ad criteria for laminated fibre-reinforced composites with emphasis on fibre kinking. Part II: FE implementation. Compos. Part A 2006, 37, 766–777. [Google Scholar] [CrossRef]
  25. Hallett, S.; Jiang, W.G.; Khan, B.; Wisnom, M. Modelling the interaction between matrix cracks and delamination damage in scaled quasi-isotropic specimens. Compos. Sci. Technol. 2008, 68, 80–89. [Google Scholar] [CrossRef]
  26. Su, Z.C.; Tay, T.E.; Ridha, M.; Chen, B.Y. Progressive damage modeling of open-hole composite laminates under compression. Compos. Struct. 2015, 122, 507–517. [Google Scholar] [CrossRef]
  27. Shivakumar, K.N.; Tan, P.W.; Newman, J.C. A virtual crack-closure technique for calculating stress intensity factors for cracked three dimensional bodies. Int. J. Fract. 1988, 36, 43–50. [Google Scholar] [CrossRef]
  28. Qian, Q.; Xie, D. Analysis of mixed mode dynamic crack propagation by interface element based on virtual crack closure technique. Eng. Fract. Mech. 2007, 74, 807–814. [Google Scholar] [CrossRef]
  29. Camanho, P.P.; Dávila, C.G. Mixed-Mode Decohesion Finite Elements for the Simulation of Delamination in Composite Materials; NASA Technical Memorandum TM-2002-211737; NASA: Washington, DC, USA, 2002. [Google Scholar]
  30. Karihaloo, B.L.; Xiao, Q.Z. Modelling of stationary and growing cracks in FE framework without remeshing: A state-of-the-art review. Comput. Struct. 2003, 81, 119–129. [Google Scholar] [CrossRef]
  31. Giner, E.; Sukumar, N.; Tarancón, J.E.; Fuenmayor, F.J. An Abaqus implementation of the extended finite element method. Eng. Fract. Mech. 2009, 76, 347–368. [Google Scholar] [CrossRef]
  32. Higuchi, R.; Warabi, S.; Yoshimura, A.; Nagashima, T.; Yokozeki, T.; Okabe, T. Experimental and numerical study on progressive damage and failure in composite laminates during open-hole compression tests. Compos. Part A 2021, 145, 106300. [Google Scholar] [CrossRef]
  33. Courant, R.; Friedrichs, K.; Lewy, H. On the partial difference equations of mathematical physics. IBM J. Res. Dev. 1967, 11, 215–234. [Google Scholar] [CrossRef]
  34. Marc Volume A: Theory and User Information, version 2017; 880-881; MSC Software: Newport Beach, CA, USA, 2017.
  35. Kondo, A.; Takahashi, M.; Watanabe, Y.; Iwahori, Y.; Hara, E.; Katoh, H. Numerical analysis of filled-hole compression tests with different materials of inclusions. In Proceedings of the 23rd International Conference on Composite Materials, Belfast, UK, 30 July–4 August 2023. [Google Scholar]
  36. Ripling, E.J.; Mostovoy, S.; Patrick, R.L. Measuring fracture toughness of adhesive joints. Mater. Res. Stand. 1964, 4, 129–134. [Google Scholar]
Figure 1. Stress distribution after failure path tracking is conducted.
Jcs 08 00130 g001
Figure 2. Modified program flow of implicit static FE solver.
Jcs 08 00130 g002
Figure 3. Three principal planes of potential failure in fiber-reinforced plastics.
Jcs 08 00130 g003
Figure 4. Numerical Integration in an element coordinate system.
Jcs 08 00130 g004
Figure 5. FEA model of an Open-Hole Compression Test.
Jcs 08 00130 g005
Figure 6. Damaged region in 0-degree layer before and after the crack propagation.
Jcs 08 00130 g006
Figure 7. Damaged region in 45-degree layer before and after the crack propagation.
Jcs 08 00130 g007
Figure 8. Typical damage of OHC specimen after failure.
Jcs 08 00130 g008
Figure 9. Relationship between Nominal Stress and Nominal Strain.
Jcs 08 00130 g009
Figure 10. FEA Model of a Double-Cantilever Beam Test.
Jcs 08 00130 g010
Figure 11. Deformed Shape and Damaged Region before and after the Crack Propagation.
Jcs 08 00130 g011
Figure 12. Relationship between Load and Displacement with Different Mesh Densities.
Jcs 08 00130 g012
Figure 13. Relationship between Load and Displacement with Different Lengths of Initial Crack.
Jcs 08 00130 g013
Table 1. Mechanical properties used in the FE analyses.
ELETEZνLTνLZνTZGLTGLZGTZ
153 GPa8.00 GPa8.00 GPa0.3400.3440.5444.82 GPa3.56 GPa2.30 GPa
Table 2. Comparison of computational costs for analyses of OHC with different conditions.
Analysis
Cases
Damage
Mode
GcL
(kJ/m2)
GcT
(kJ/m2)
Iteration
(Total)
Iteration
(Unstable)
CPU Time
(s)
1L10.0N.A. 1720 51719,437.47
2L20.0N.A. 1215889757,782.35
3L, T10.02.03182129014.30
4L, T20.02.055244314,796.60
1 Damage in transverse direction was not considered in cases 1 and 2.
Table 3. Comparison of computational costs for analyses of DCB with different conditions.
Analysis
Cases
Number of
Elements
Number of
Load Steps
Initial
Crack (mm)
Iterations CPU Time
(s)
127001003015481855.68
255001003014553419.63
310,2001003022139550.84
42700253012631354.59
55500253015693413.81
610,200253014636094.47
727002560840925.51
85500256011282494.51
910,200256011824970.65
Disclaimer/Publisher’s Note: The statements, opinions and data contained in all publications are solely those of the individual author(s) and contributor(s) and not of MDPI and/or the editor(s). MDPI and/or the editor(s) disclaim responsibility for any injury to people or property resulting from any ideas, methods, instructions or products referred to in the content.

