
Non-Invasive On-Site XRF and Raman Classification and Dating of Ancient Ceramics: Application to 18th and 19th Century Meissen Porcelain (Saxony) and Comparison with Chinese Porcelain
 , ,
, ,
Abstract
:1. Introduction
2. Objects and Methods
2.1. Objects

| Inventory Number (Type) | Period (from Ancient Assignments) | View | Mark | XRF Analyzed Spot |
|---|---|---|---|---|
| MNC 2274.38 (Figure) | 1709–1730 | 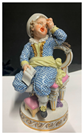 |  |  |
| MNC 469.11.1 (tea cup) | ca. 1720–1725 |  |  | Not pXRF analyzed |
| MNC 8160.2 (dish) | ca. 1720 |  | Not pXRF analysed | Not pXRF analyzed |
| MNC 2274.9 (2274.2) (bowl) | 1726 (mark) | 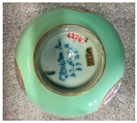 | 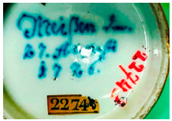 |  |
| MCSR XXXXV (Imari-style dish) | ca. 1730 | 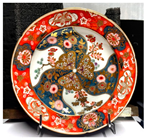 |  |  |
| MCSR LXXIX (tureen) | ca. 1730 |  |  | |
| MNC 19014 (coffee cup with coats of arms of France and Poland) | 1737 Gift from August III to Marie Leszcynska | 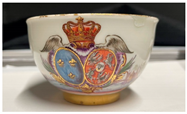 |  |  |
| MCSR LVII.1 (coffee cup with Watteau-like décor) | ca. 1745 |  |  | Not pXRF analyzed |
| MNC 8322 | ca. 1740–1760 |  | 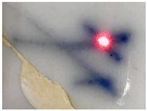 | |
| MNC 23181 (Louis XV figure) | c.a. 1746 (wedding of France Dauphin and M.-J. de Saxe) | 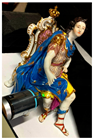 | 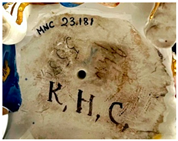 | No blue mark |
| MNC 11205 (Bacchus and bacchante group) | Käendler period ca. 1760 |  |  | Not pXRF analyzed |
| MNC 2274.20 (butter cup) | 18th c. c.a. 1730 | 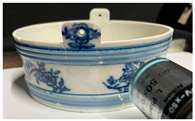 |  | 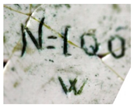 |
| MNC 19032.2 (mustard cup) | 18th c. | 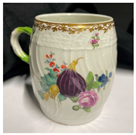 | 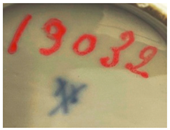 | 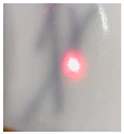 |
| MNC 14229.1 (chocolate pot) | 18th c. | 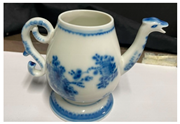 | 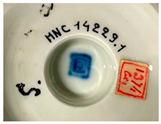 | 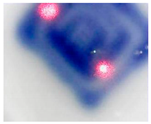 |
| MNC 11213.2 (coffee cup) | 18th c. |  |  |  |
| MNC 14234 (orange cup) | 18th c.? |  |  |  |
| MNC 11051.2 (boy figurine) | 18th c.? | 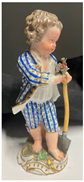 | 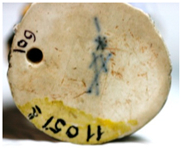 | 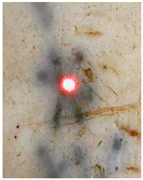 |
| MNC 11064 (Group of three child geometers and astronomers) | 18th c.? | 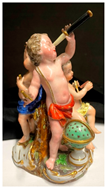 |  |  |
| MNC 19944 (singing angel) | 18th c. |  | No mark | |
| MNC 9638 (bowl) | 18th c. |  | Not pXRF analyzed | Not pXRF analyzed |
| MNC 14201 (tea pot) | 18th c. |  |  |  |
| MNC 23298.1 (cup for Turkish market) | ca. 1774–1814 |  |  |  |
| MNC 469.9.1 (coffee cup with painting copy) | ca. 1774–1814 (Marcolini period) |  |  |  |
| MNC 886.4.1 (coffee cup) | end of 18th c. to beginning of 19th c. |  |  | |
| MNC 469.5.1 (coffee cup) | 19th c.? |  |  |  |
| MNC 25340 (figure) | 19th c. |  |  | |
| MNC 886.3 (dish) | 1825 |  |  |  |
| MNC 2247.10 (dish) | 19th c.? |  |  |
2.2. pXRF Analyses
2.3. Raman Microspectroscopy
3. Results
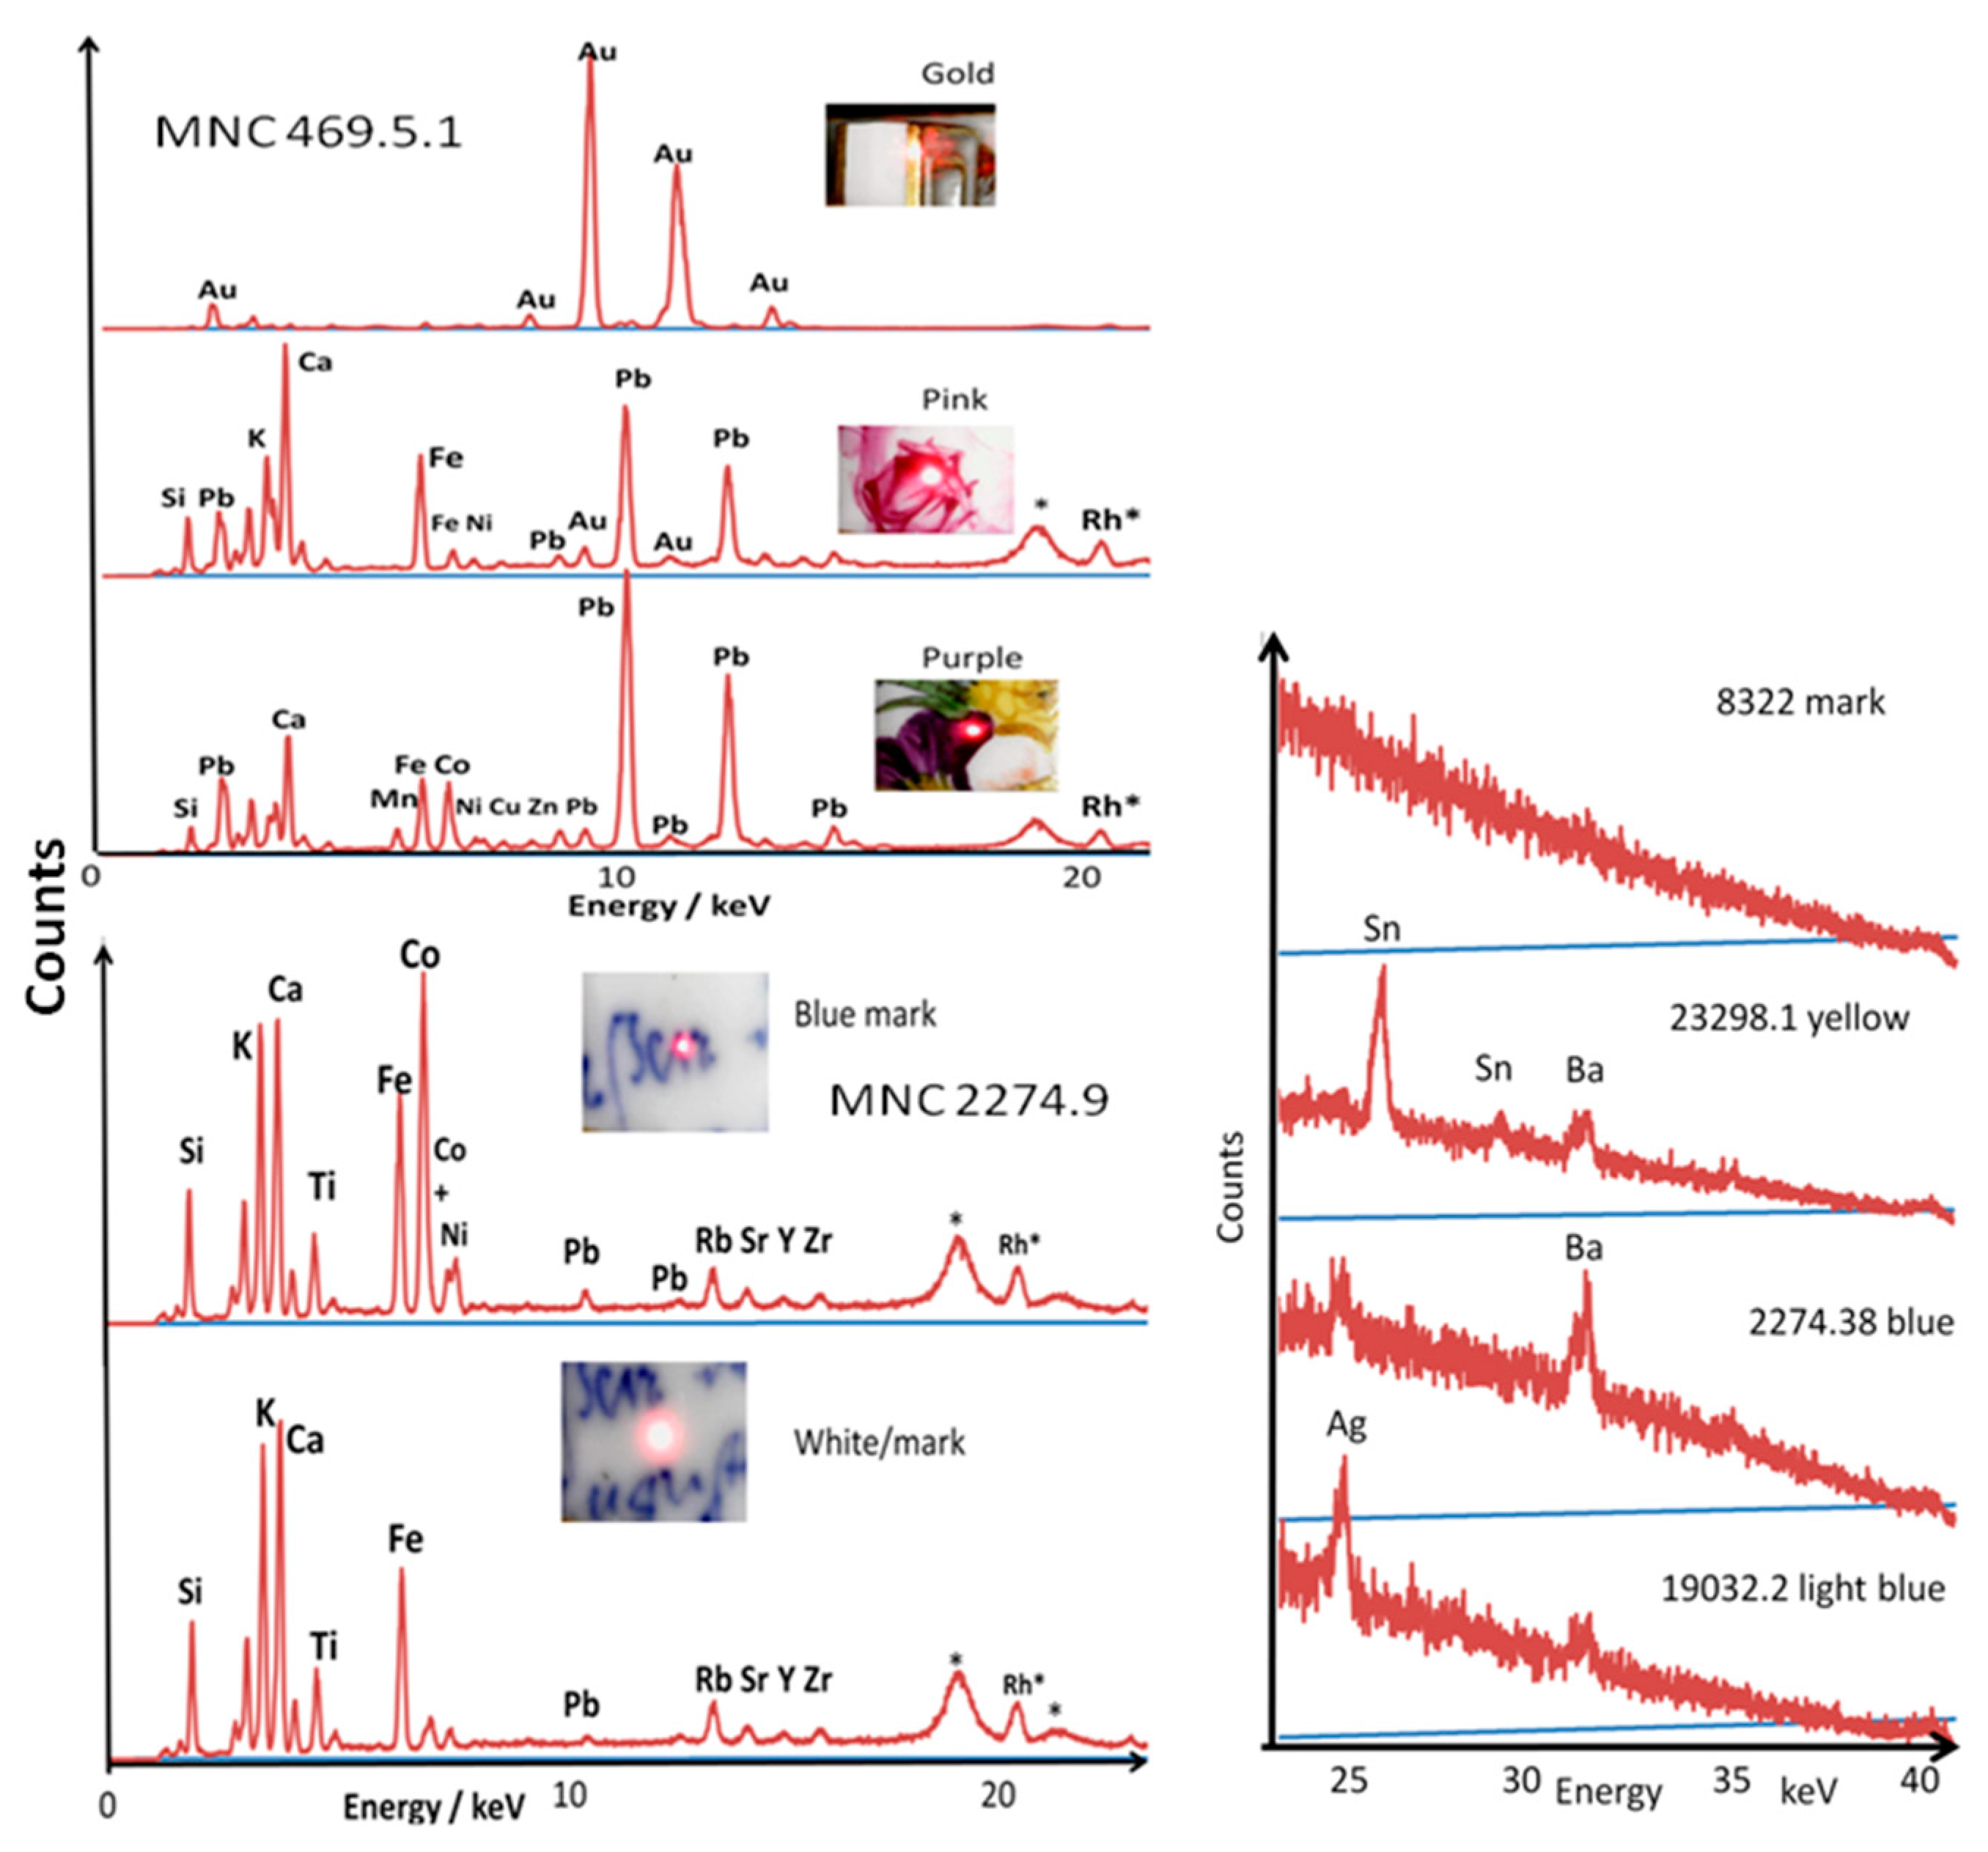
3.1. Information on the Elemental Composition
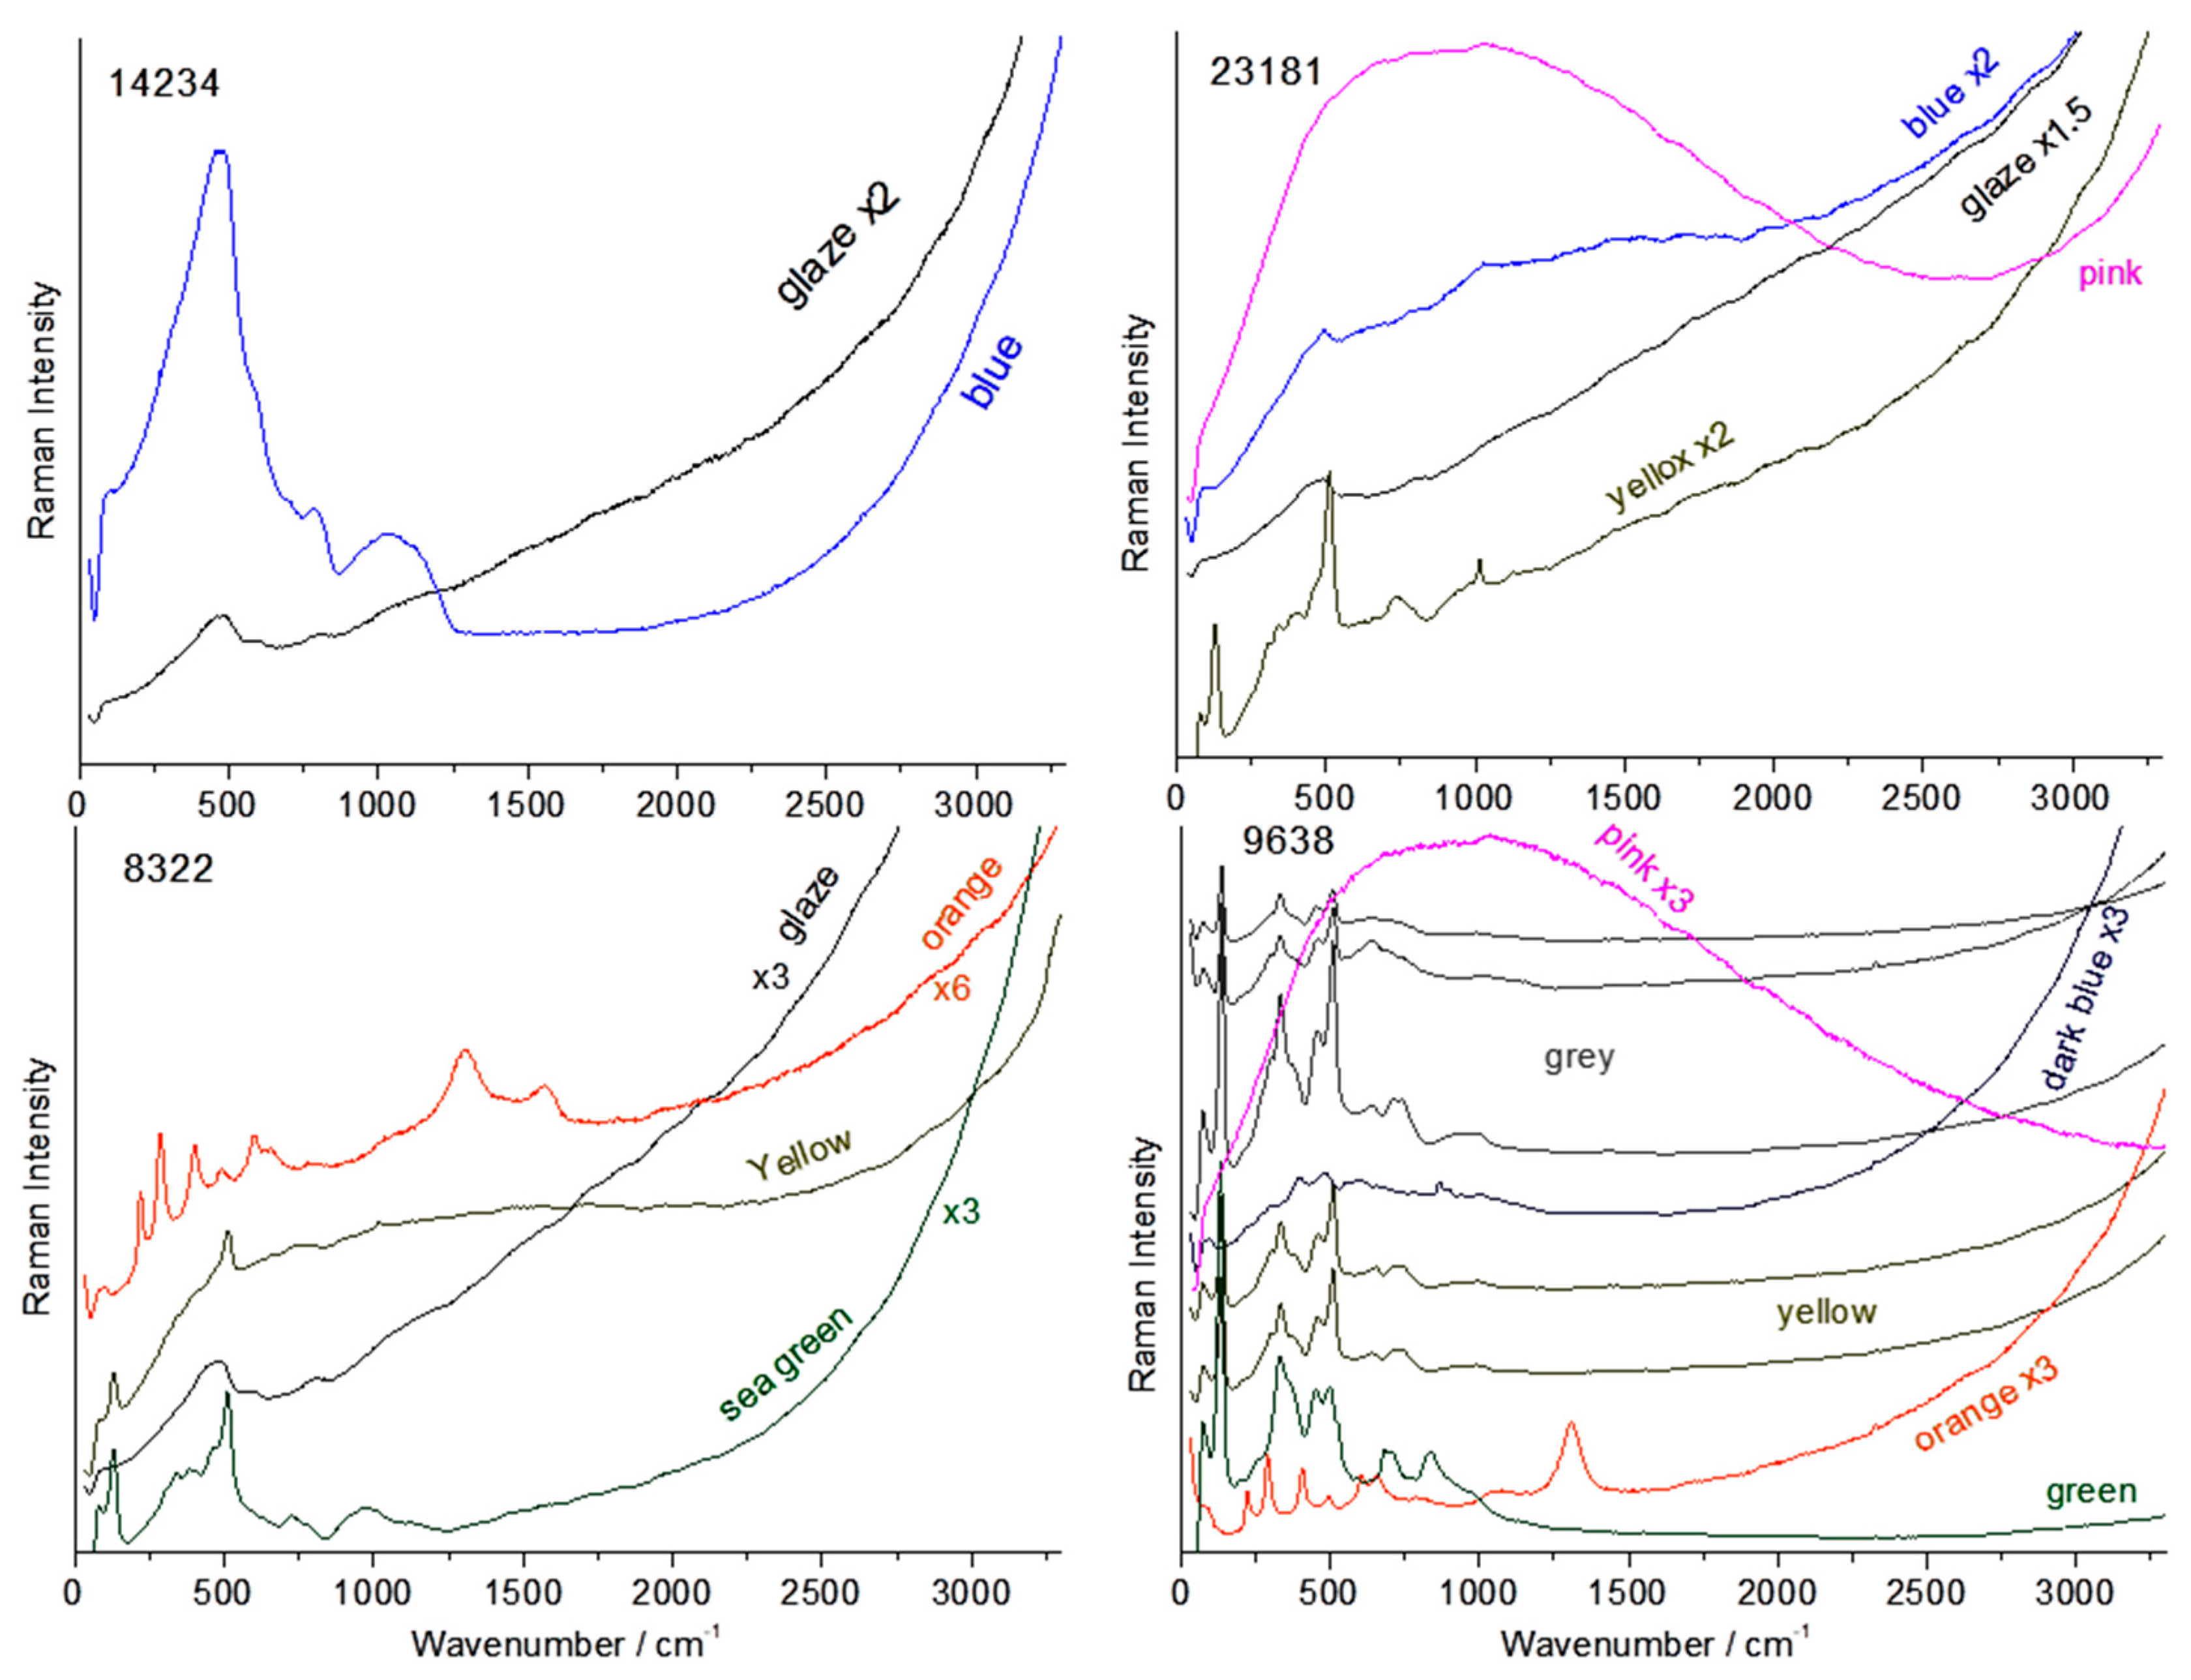
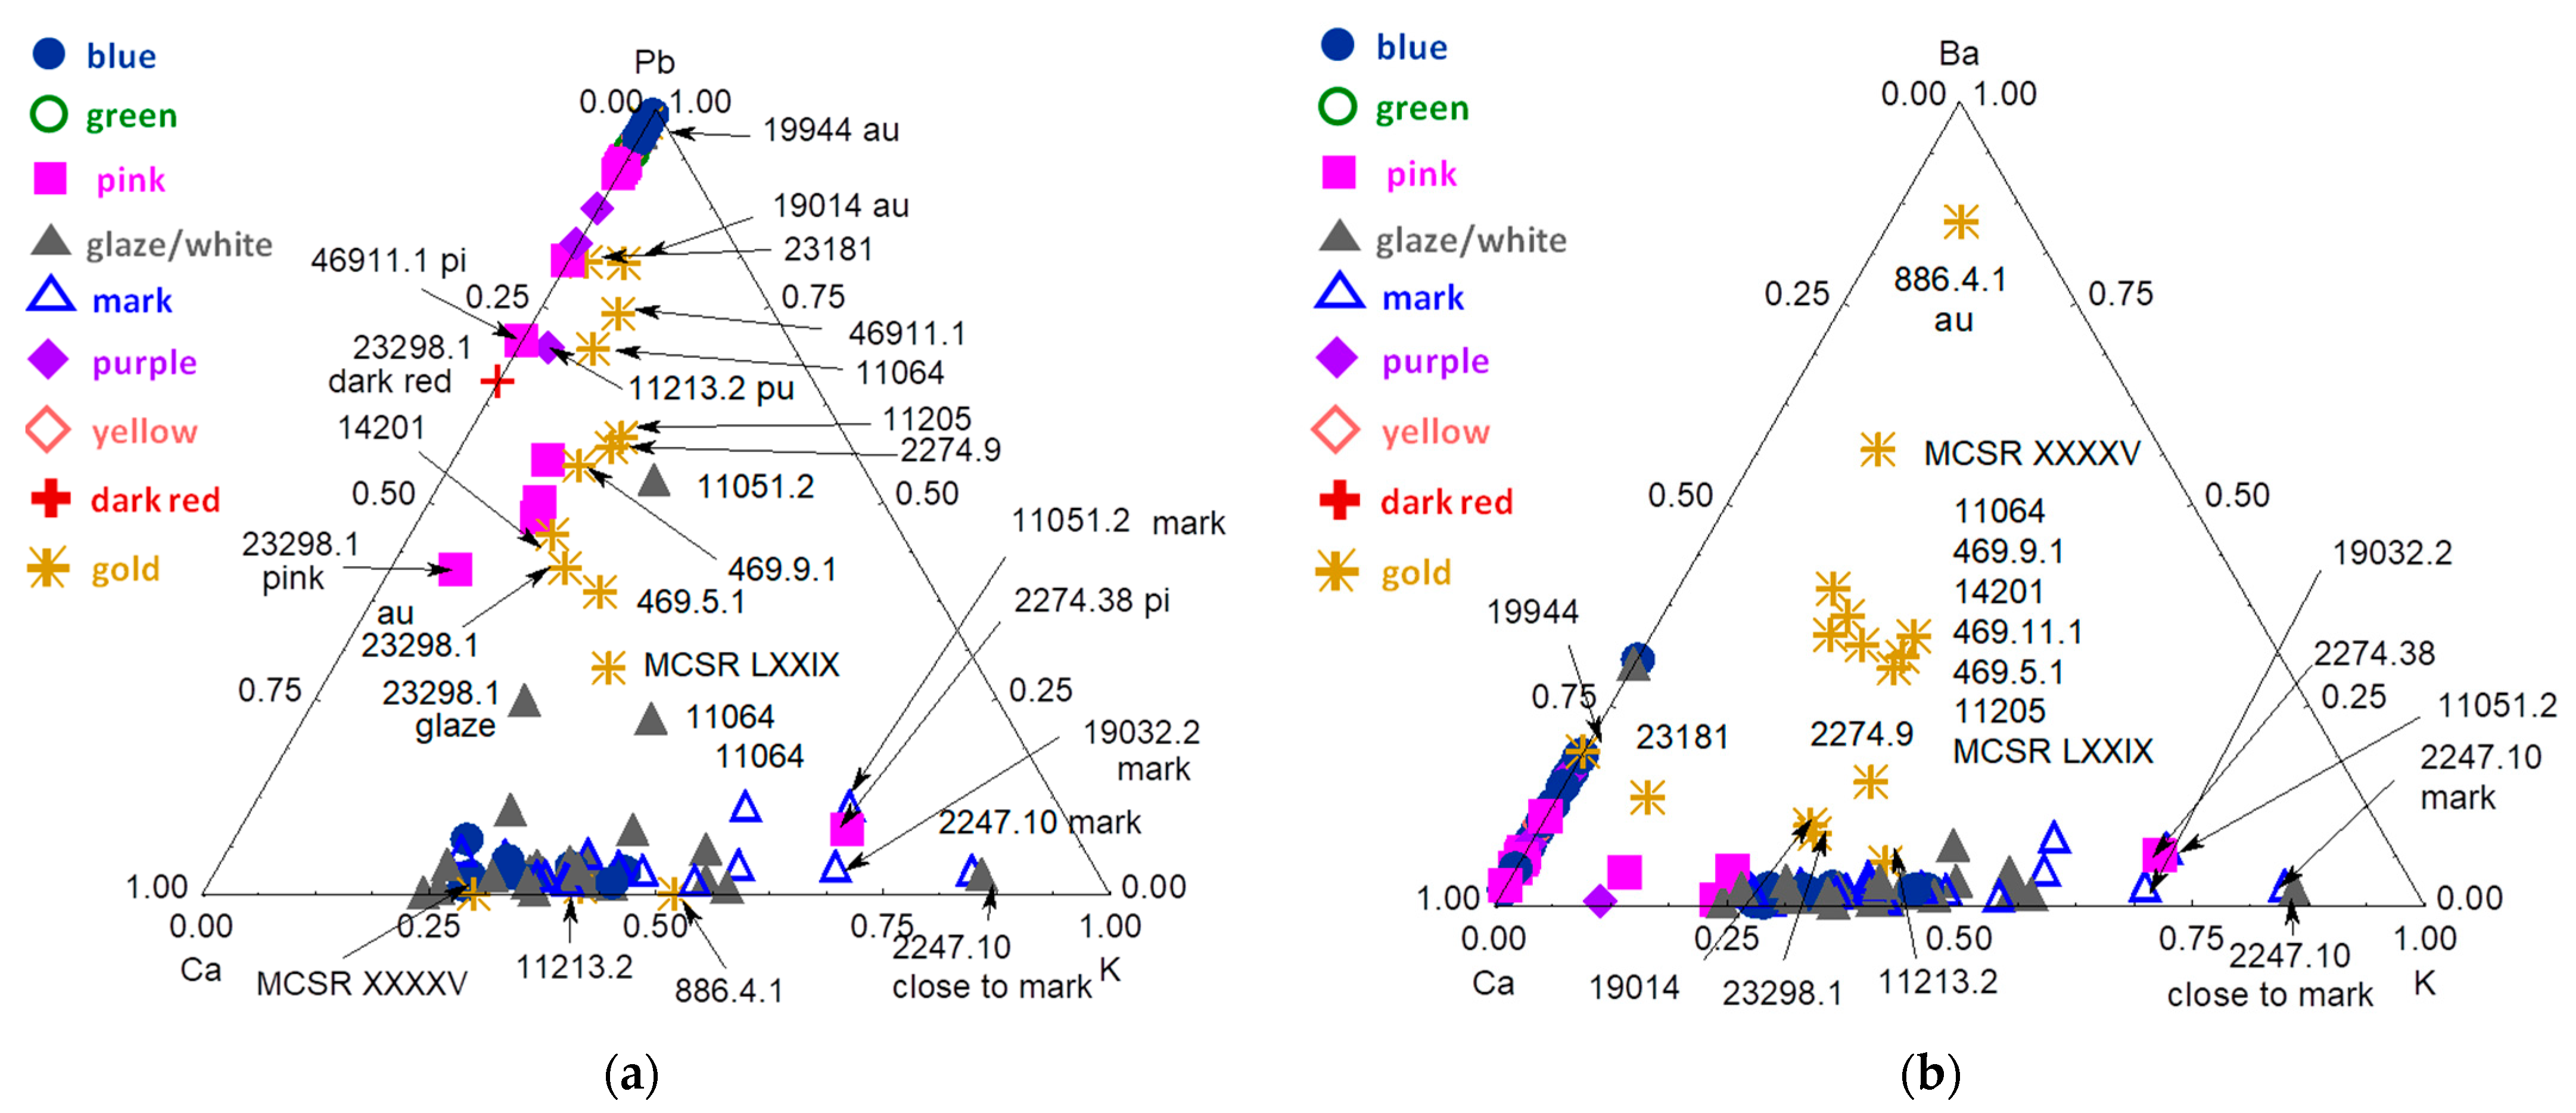
3.2. Glaze and Enamel Flux
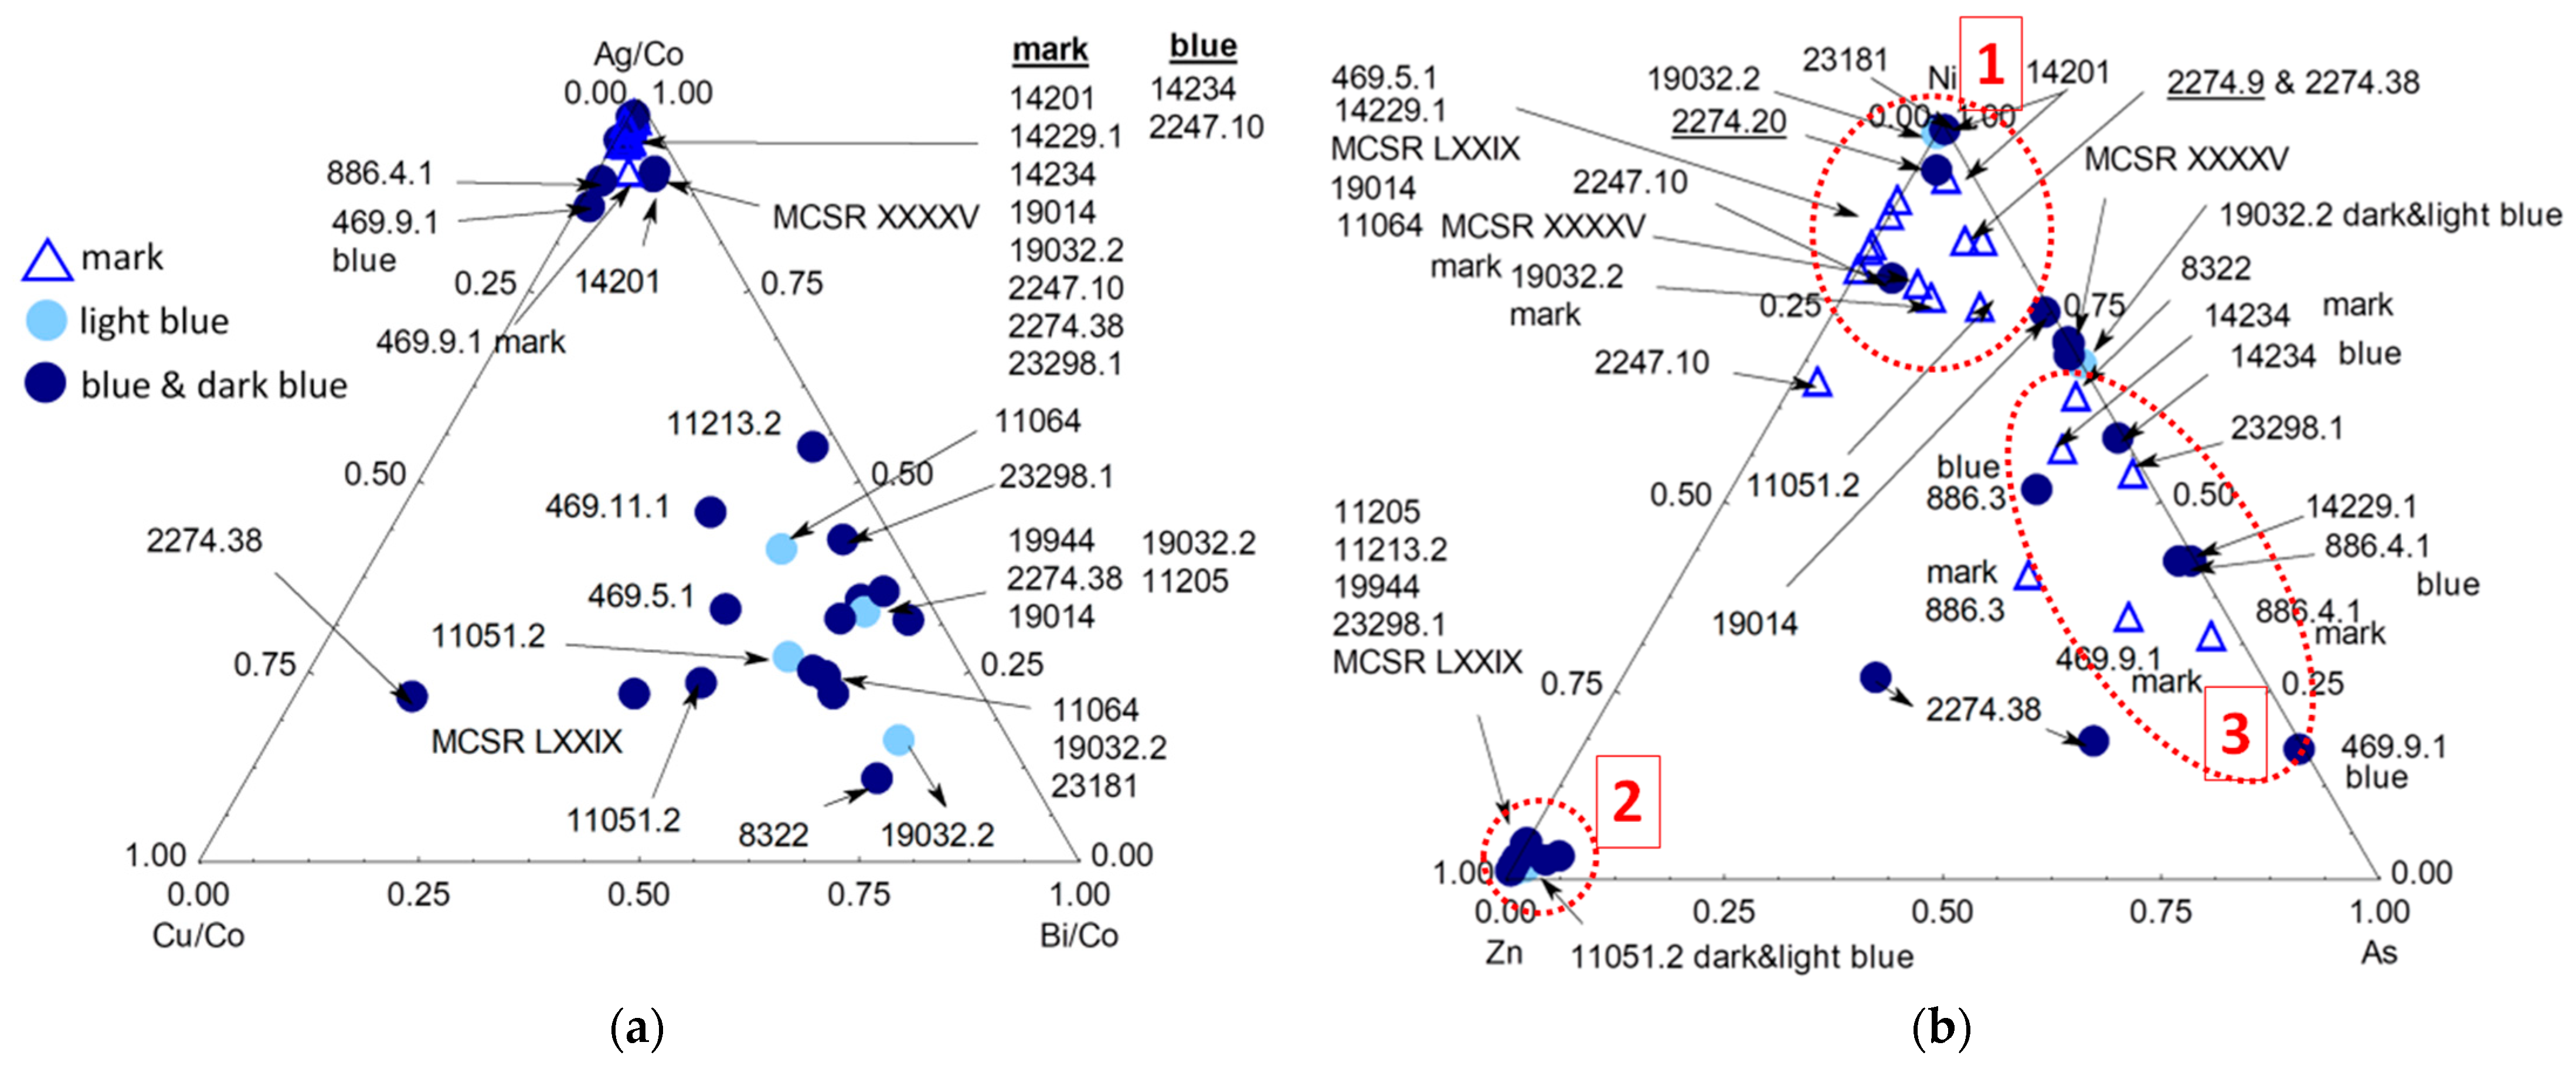
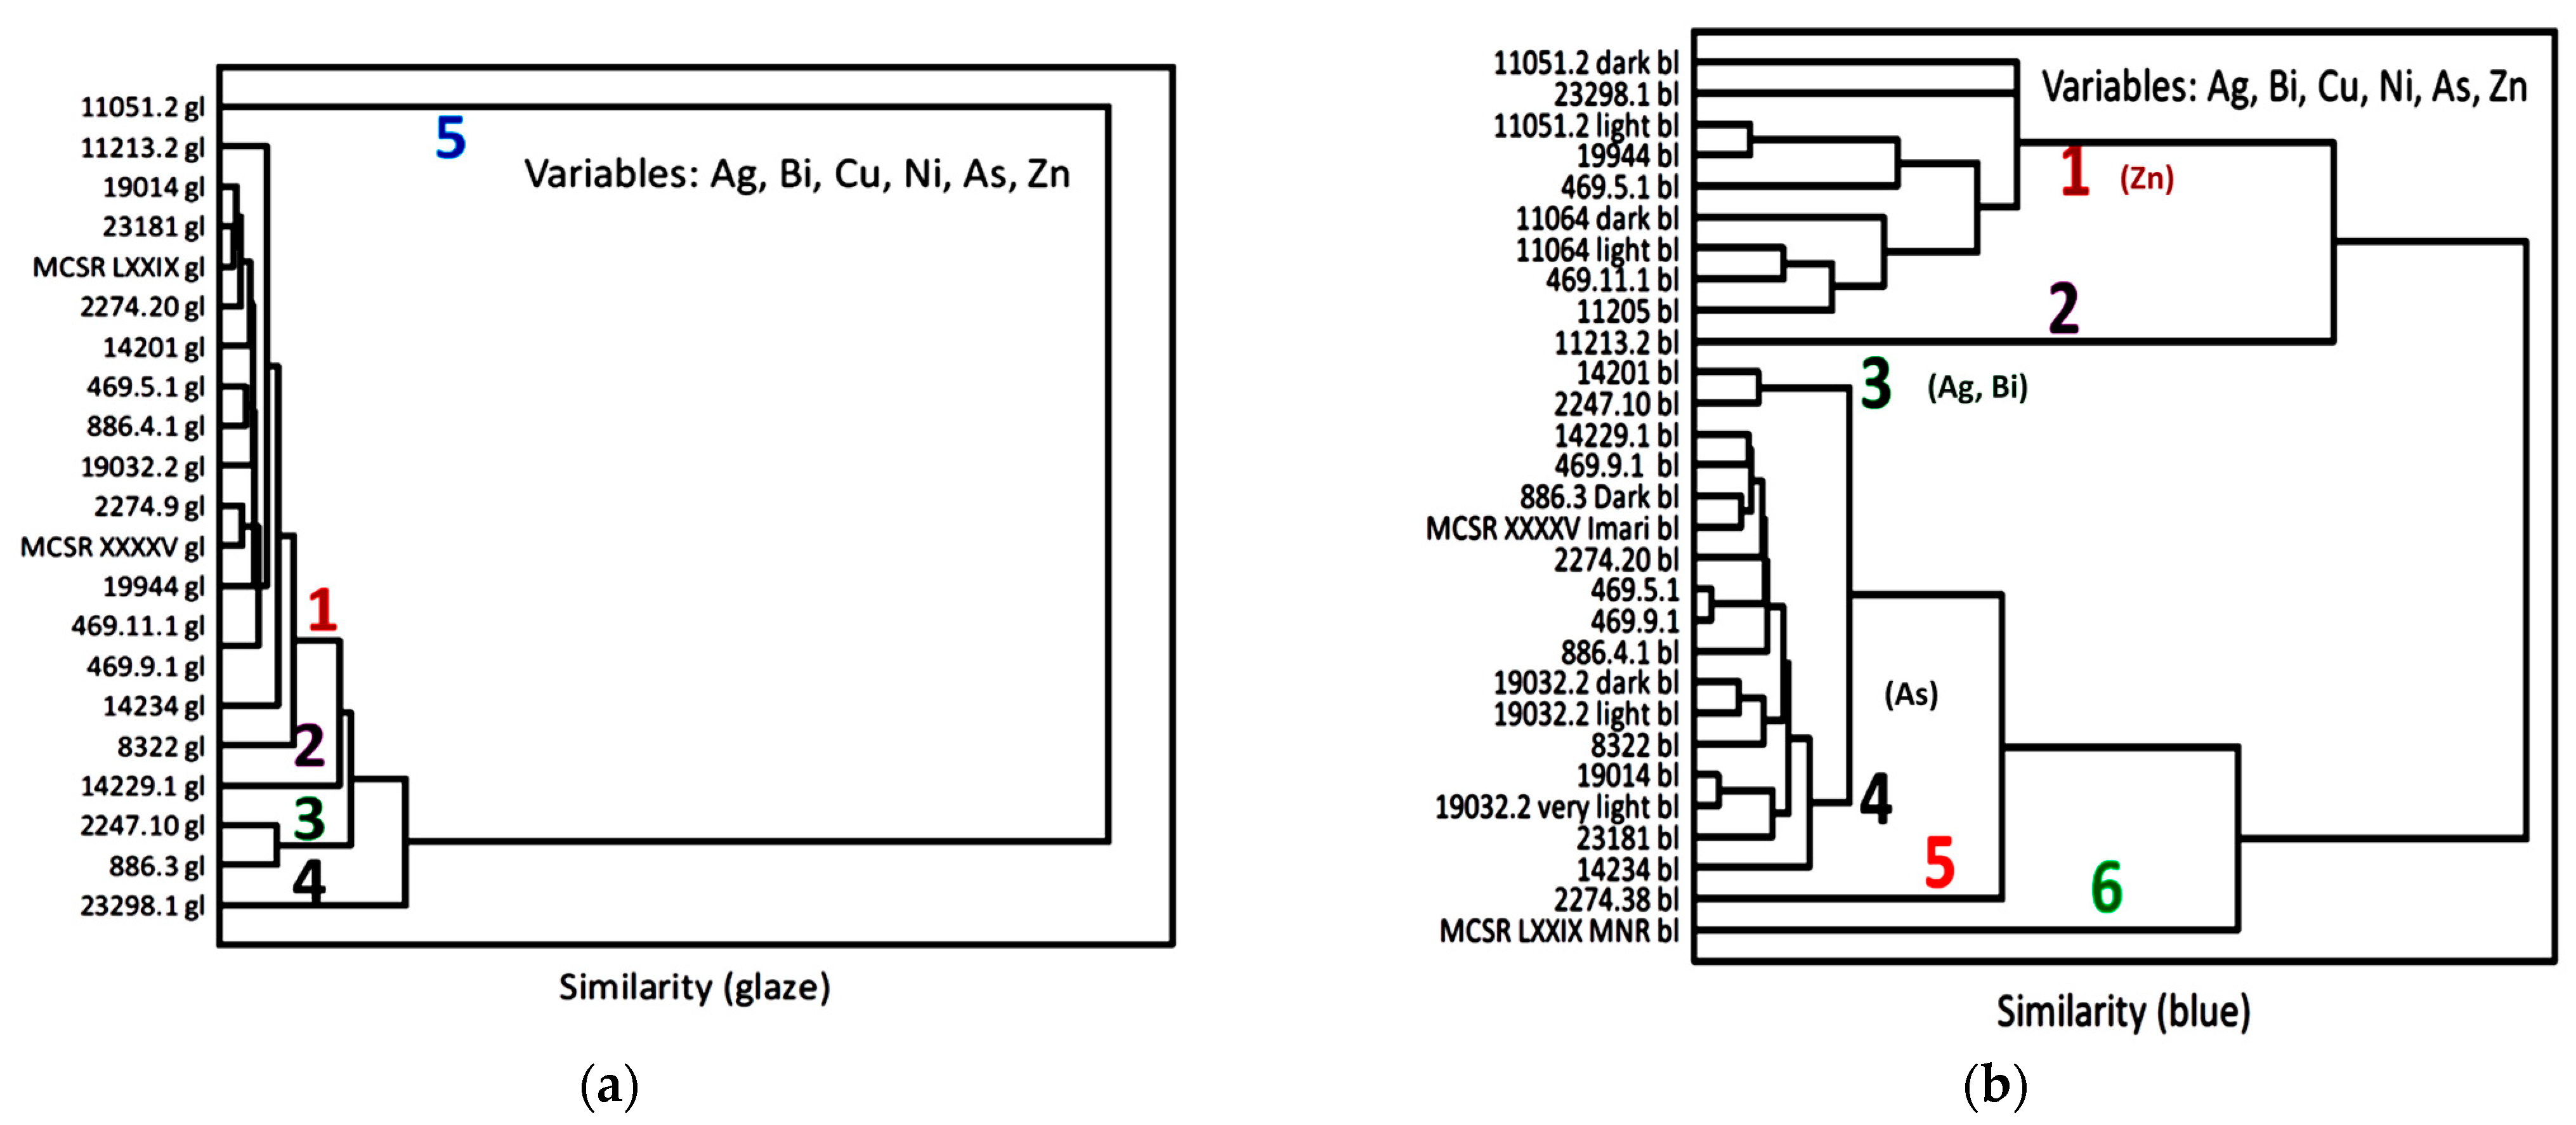
3.3. Blue Zones and Elements Associated with Cobalt
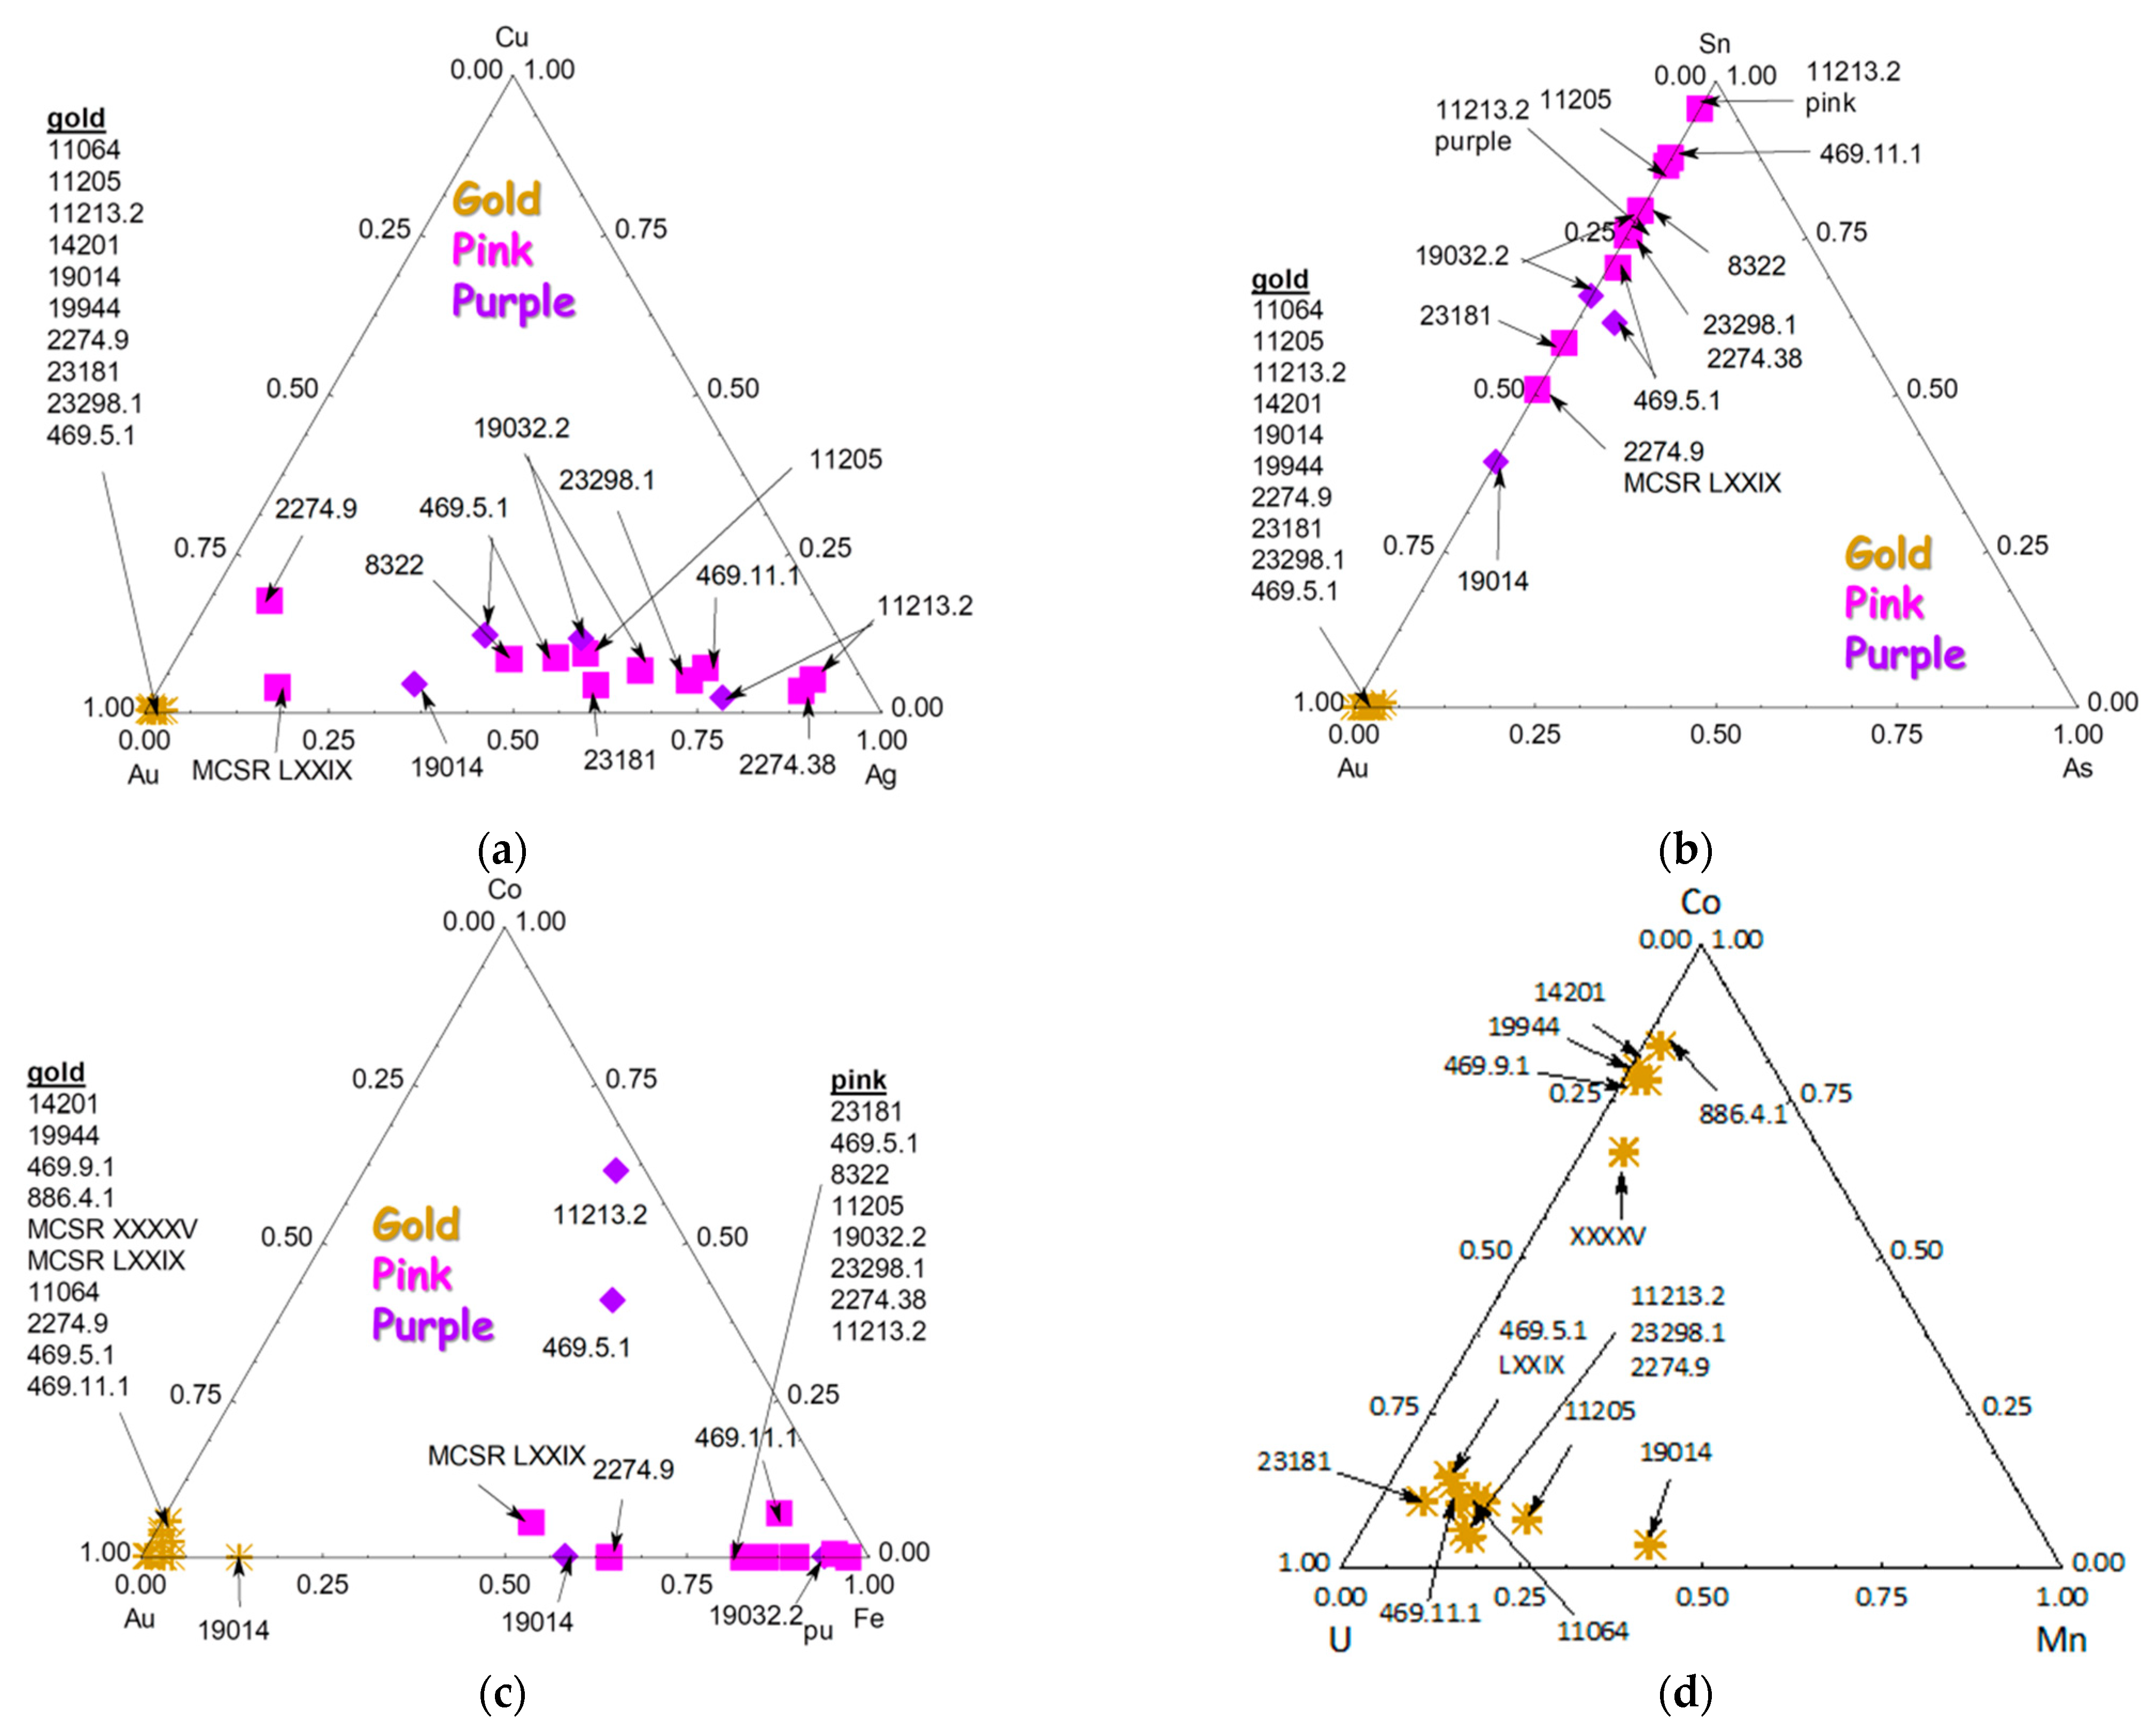
3.4. Other Colors: Green, Yellow, Red to Purple
3.5. Gilding
4. Comparison with Earlier Böttger Production
5. Tentative Dating and Discussion of Authentication Criteria
- (i)
- The first is the heterogeneity of the areas analyzed. Although the enamels are made of glass and a part is prepared using prior fusion, the heterogeneity should be important because of the raw materials’ variability with time (the composition of rock shifts with its location in many quarries) and the decoration’s realization. Also, we will use the elements associated with the coloring elements but that give a visible signal pXRF.
- (ii)
- The second is that, during the period considered, the 18th and 19th centuries, the processing of ores, for example, cobalt, evolved considerably and, therefore, the residual content of the associated elements evolved too [30]. Furthermore, different qualities (e.g., grades of smalt) may have been reported [74].
- (i)
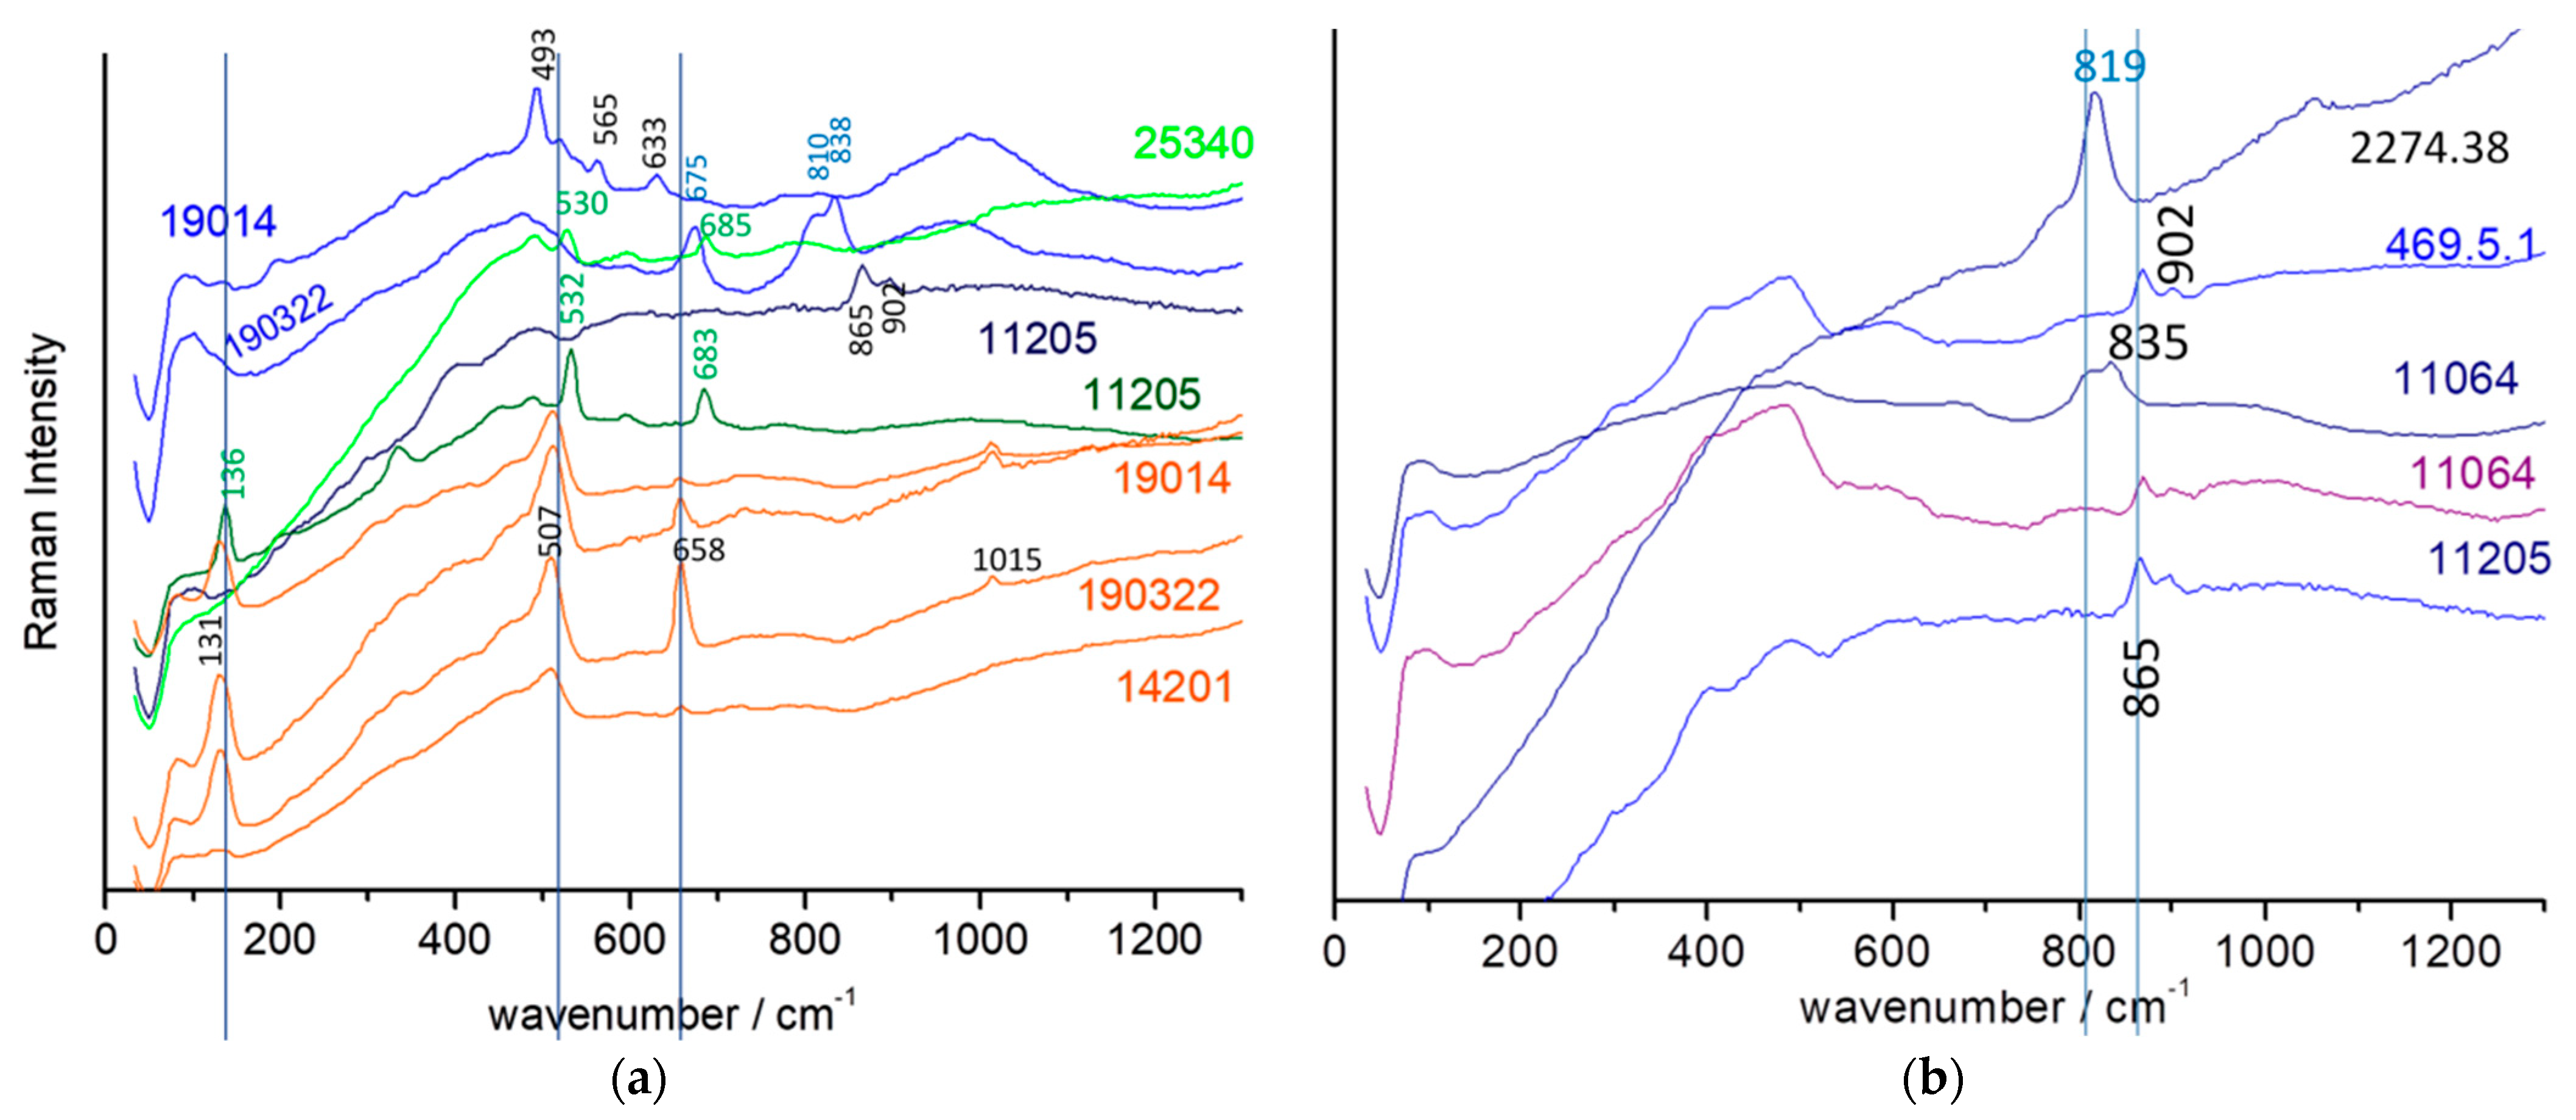
- The first concerns the silicate matrix constituting the glaze (Raman data);
- (ii)
- The second considers the elements associated with cobalt in the blue areas;
- (iii)
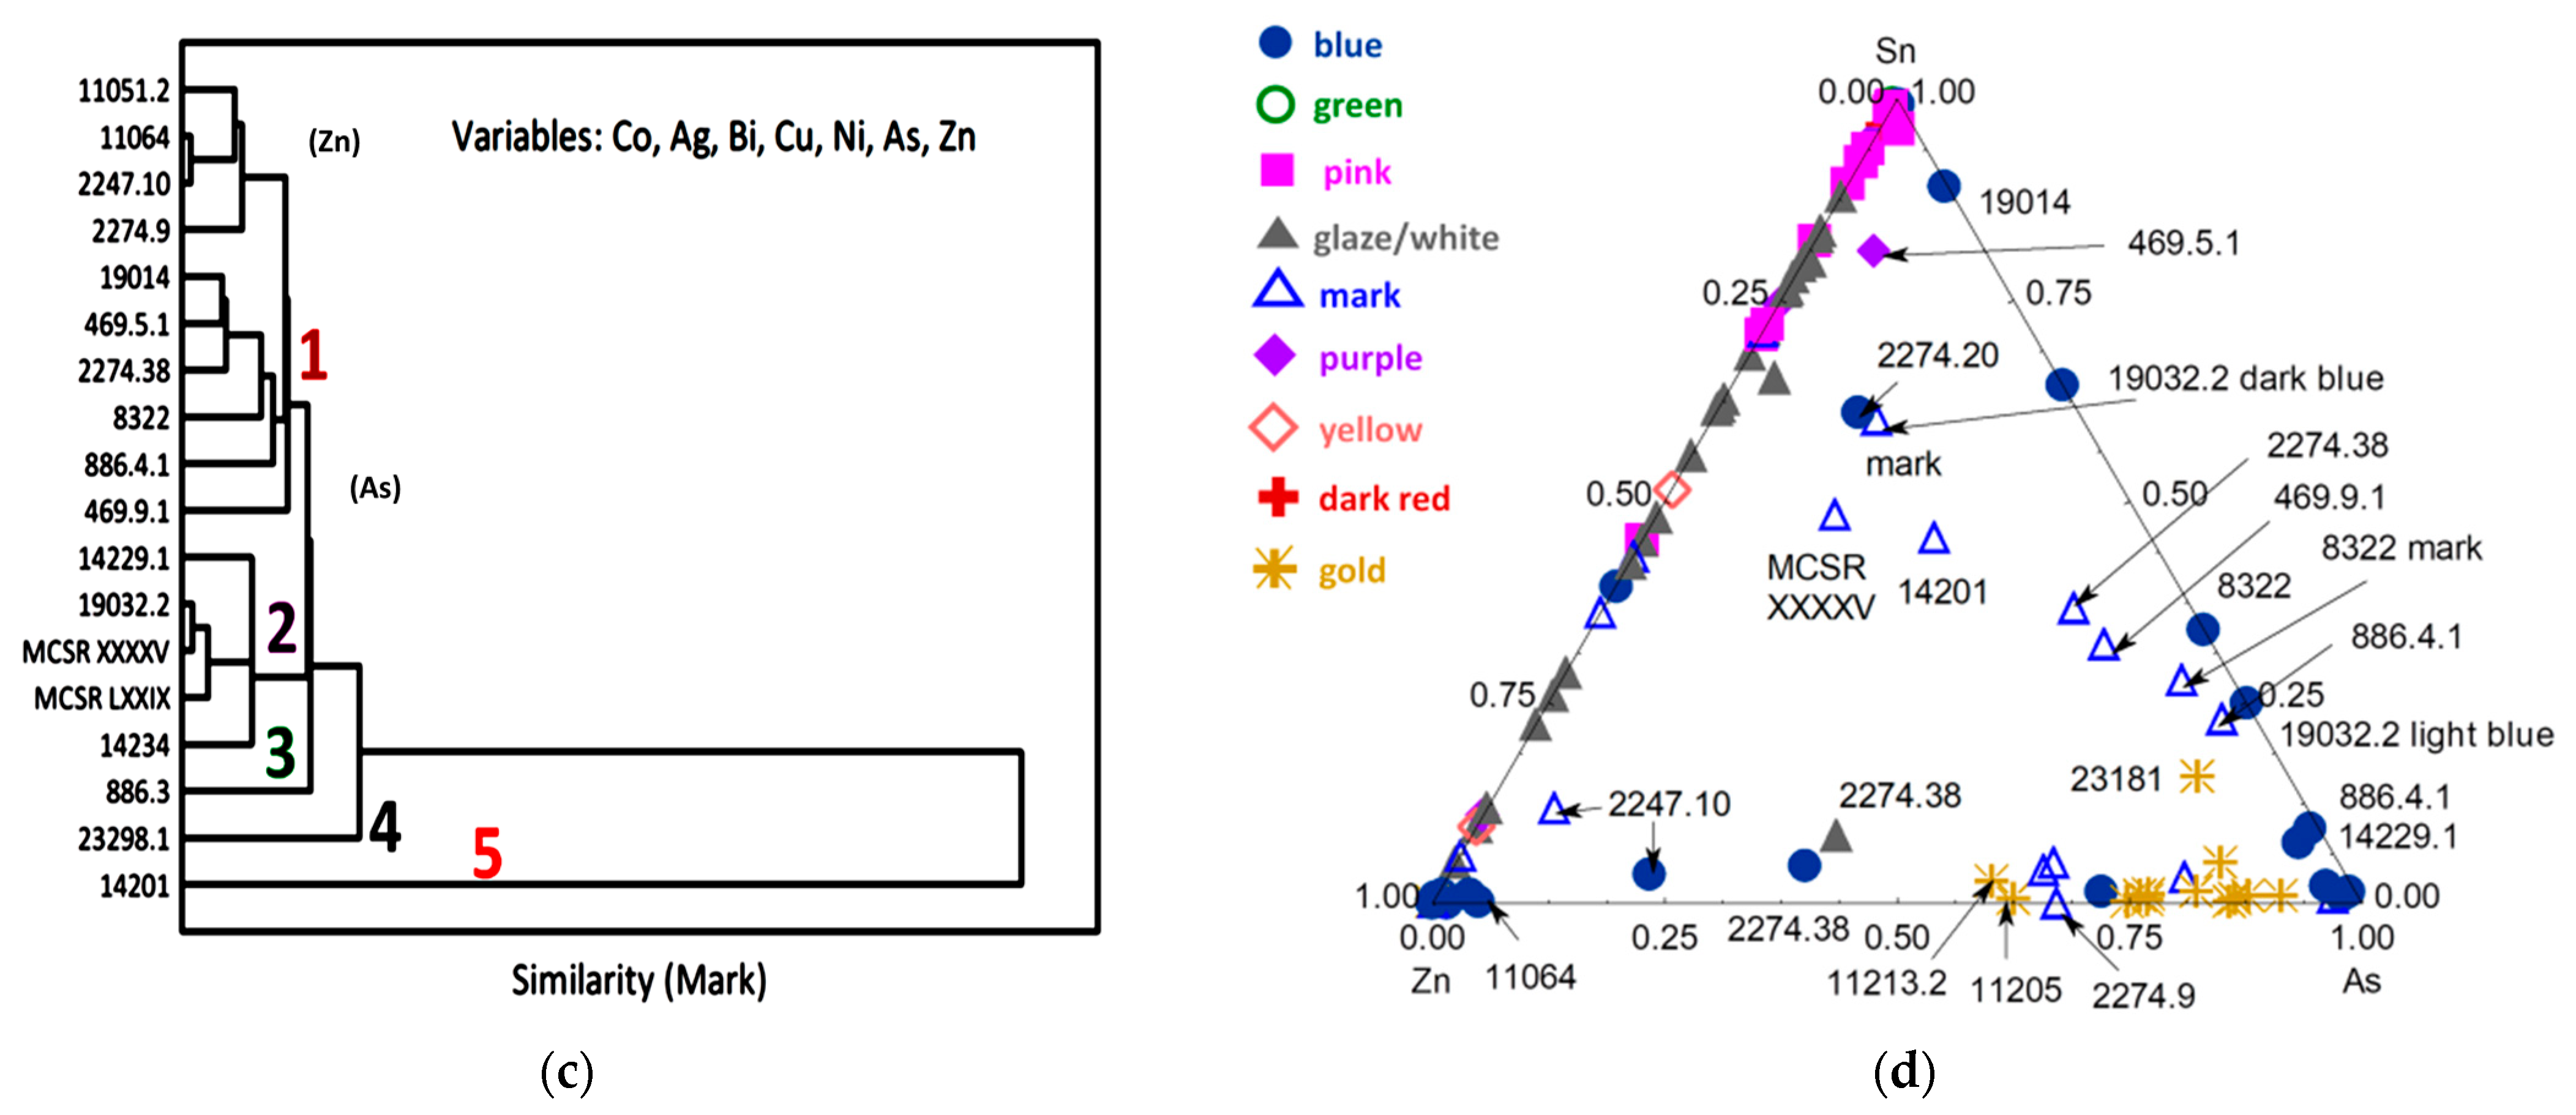
- The third, the elements detected in the mark;
- (iv)
- The fourth, those—cobalt included—detected in all the blues (décor and marks);
- (v)
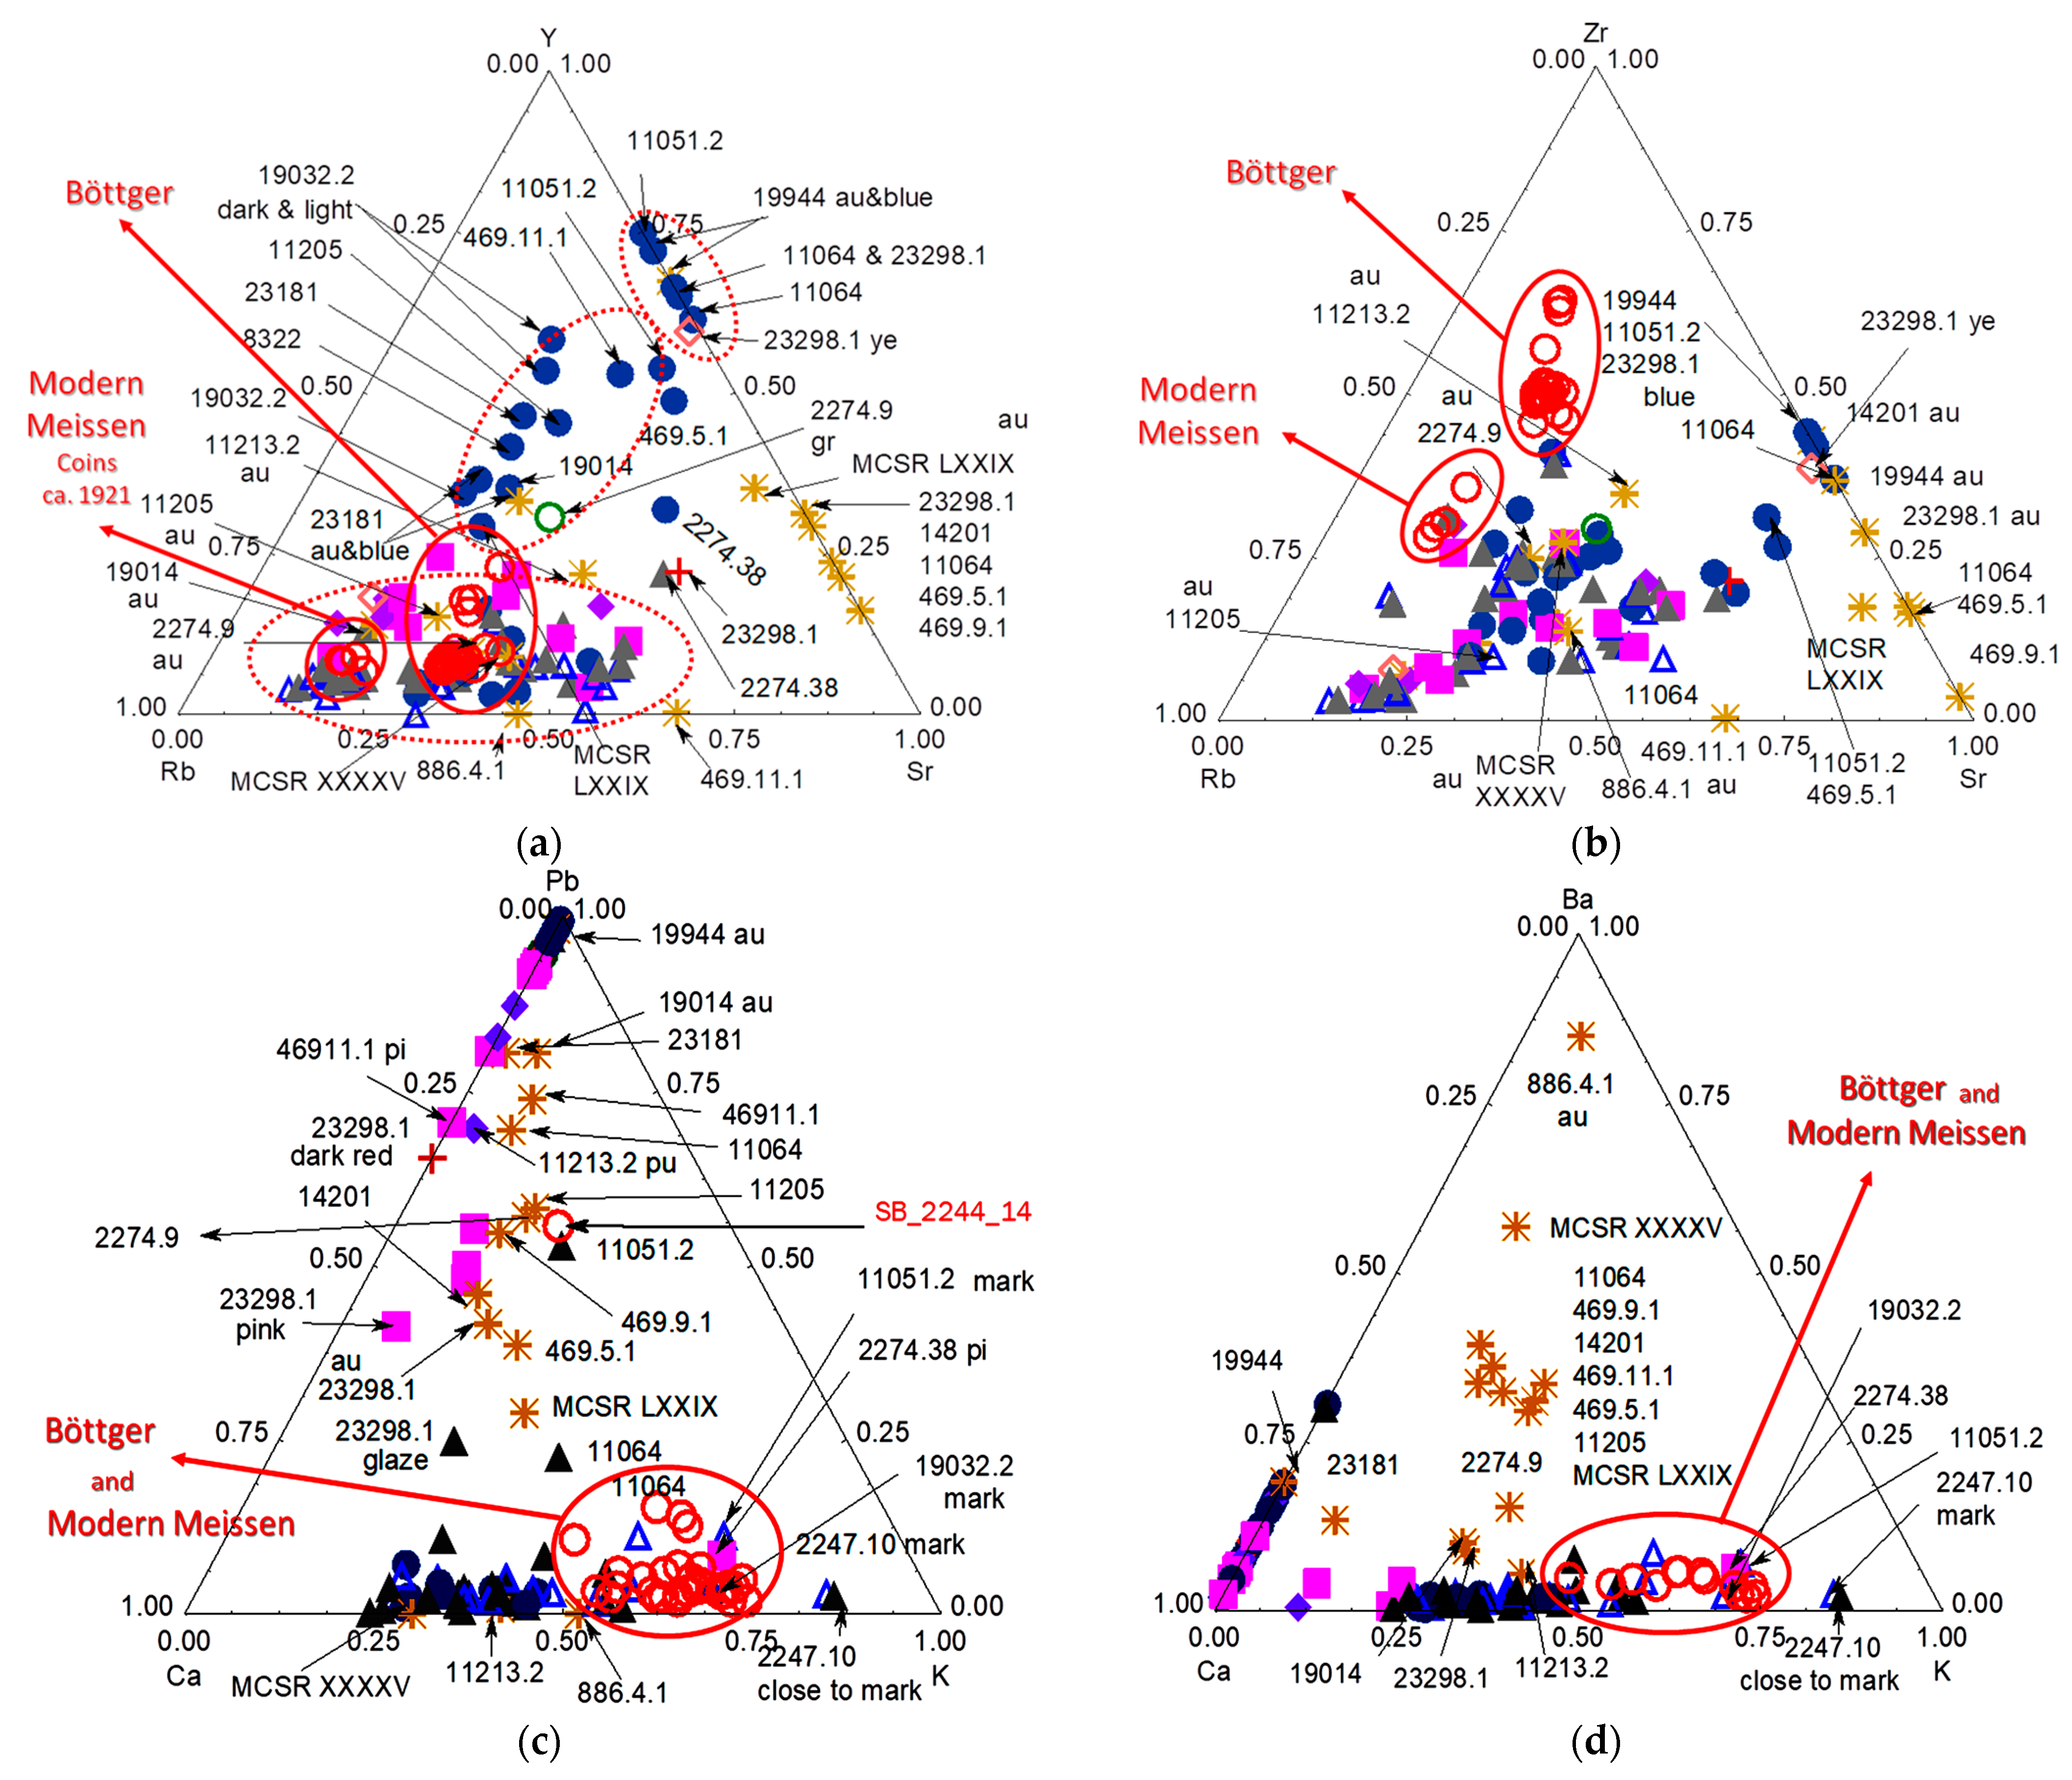
- Those according to the groups identified in the Y-Rb-Sr ternary diagram;
- (vi)
- And, additionally, the characterization of gilded areas.
6. Did Chinese Enamellers Use Parisian or Saxon Recipes?
- (i)
- Those made using imported raw materials, mainly from the Paris region, were rich in traces of yttrium, located at the top on the Y-Sr line;
- (ii)
- Those based on Chinese raw materials on the Rb-Sr line (i.e., without Y) are located on the side rich in Rb (as for Yuan and Ming Dynasty production);
- (iii)
- Those located on the line parallel to Y-Rb were obtained by mixing Chinese and imported ingredients.
7. Conclusions
Supplementary Materials
Author Contributions
Funding
Data Availability Statement
Conflicts of Interest
References
- Goder, W.; Schulle, W.; Wagenbreth, O.; Walter, H. Meissen, La Découverte de la Porcelaine Européenne en Saxe—J.F. Böttger; Pigmalion-Gérard Watelet: Paris, France, 1984. [Google Scholar]
- von Hornig Sutter, M. Meissener Porzellane des 18. Jahrhunderts im Visier von Kunstgeschichte und Naturwissenschaft. Weltkunst 1985, 55, 110–115. [Google Scholar]
- Kingery, W.D. The development of European porcelain. In High-Technology Ceramics: Past, Present, and Future—The Nature of Innovation and Change in Ceramic Technology; Technology and Style, Ceramic and Civilization Series; Kingery, W.D., Ed.; The American Ceramic Society: Westerville, OH, USA, 1986; Volume III, pp. 153–180. [Google Scholar]
- d’Albis, A. The history of innovation in European porcelain manufacture and the evolution of style: Are they related? In Technology and Style, Ceramic and Civilization; Kingery, W.D., Ed.; The American Ceramic Society: Westerville, OH, USA, 1986; Volume III, pp. 397–412. [Google Scholar]
- Colomban, P.; Milande, V. On-site Raman analysis of the earliest known Meissen porcelain and stoneware. J. Raman Spectrosc. 2006, 37, 606–613. [Google Scholar] [CrossRef]
- Simsek, G.; Casadio, F.; Colomban, P.; Bellot-Gurlet, L.; Faber, K.T.; Zelleke, G.; Milande, V.; Moinet, E. On-site Identification of Early Böttger Red Stoneware made at Meissen using portable XRF: 1, Body Analysis. J. Am. Ceram. Soc. 2014, 97, 2745–2754. [Google Scholar] [CrossRef]
- Simsek, G.; Casadio, F.; Colomban, P.; Bellot-Gurlet, L.; Faber, K.T.; Zelleke, G.; Milande, V.; Moinet, E. On-site Identification of Early Böttger Red Stoneware made at Meissen using portable XRF: 2, Glaze and Gilding Analysis. J. Am. Ceram. Soc. 2015, 98, 3006–3013. [Google Scholar] [CrossRef]
- d’Albis, A. Steps in the Manufacture of the soft-paste porcelain of Vincennes, According to the book of Hellot. In Ceramic and Civilization I: Ancient Technology to Modern Science; Kingery, W., Ed.; The American Ceramic Society: Colombus, OH, USA, 1985; pp. 257–272. [Google Scholar]
- Colomban, P.; Treppoz, F. Identification and Differentiation of Ancient and Modern European Porcelains by Raman Macro- and Microspectroscopy. J. Raman Spectrosc. 2001, 32, 93–102. [Google Scholar] [CrossRef]
- Colomban, P.; Robert, I.; Roche, C.; Sagon, G.; Milande, V. Identification des porcelaines “tendres” du 18ème siècle par spectroscopie Raman: Saint-Cloud, Chantilly, Mennecy et Vincennes/Sèvres. Rev. D’archéométrie 2004, 28, 153–167. [Google Scholar] [CrossRef]
- Maggetti, M.; d’Albis, A. Phase and compositional analysis of a Sèvres soft paste porcelain plate from 1781, with a review of early porcelain techniques. Eur. J. Mineral 2017, 29, 347–367. [Google Scholar] [CrossRef]
- Demirsar Arli, B.; Simsek Franci, G.; Kaya, S.; Arli, H.; Colomban, P. Portable X-ray Fluorescence (p-XRF) Uncertainty Estimation for Glazed Ceramic Analysis: Case of Iznik Tiles. Heritage 2020, 3, 1302–1329. [Google Scholar] [CrossRef]
- Colomban, P.; Milande, V.; Lucas, H. On-site Raman analysis of Medici porcelain. J. Raman Spectrosc. 2004, 35, 68–72. [Google Scholar] [CrossRef]
- Deron, I.; Colomban, P. Le traffic maritime de la Compagnie des Indes. manuscript in preparation.
- Père d’Entrecolle’s Letters from Ching-te-chen in 1712 and 1722, Translated in R. Tichane, Ching-te-Chen; New York State Institute for Glaze Research, Painted Post: New York, NY, USA, 1983.
- Finlay, J. Henri Bertin and the Representation of China in Eighteenth-Century France; Routlege: New York, NY, USA, 2020. [Google Scholar]
- Shih, C.-f. Evidence of East-West Exchange in the Eighteenth Century: The Establishment of Painted Enamel Art at the Qing Court in the Reign of Emperor Kangxi. Natl. Palace Mus. Res. Q. 2007, 24, 45–94. [Google Scholar]
- Curtis, E.B. Aspects of a multi-faceted process: The circulation of enamel wares between the Vatican and Kangxi’s court. Extrême-Orient Extrême-Occident. 2019, 43, 29–39. [Google Scholar] [CrossRef]
- Shih, C.-F. Hua Falang: The Chinese Concept of Painted Enamels. In The RA Collection of Chinese Ceramics: A Collector’s Vision; Jorge Welsh Research & Publishing: London, UK, 2021; Volume V, pp. 28–59. [Google Scholar]
- Shih, C.-f. L’Avènement d’une nouvelle palette de couleurs à Jingdezhen au XVIIIe siècle. In Le Secret des Couleurs. Céramiques de Chine et d’Europe du XVIIIe Siècle à Nos Jours; d’Abrigeon, P., Ed.; 5 Continents Editions & Fondation Baur: Milan, France, 2022; pp. 21–59. [Google Scholar]
- Bellemare, J. A New Palette: Reassessing the Development of Enamel Colors in Early-Eighteenth-Century China. J. Glass Stud. 2022, 64, 147–167. Available online: https://www.jstor.org/stable/48703407 (accessed on 30 September 2023).
- Colomban, P.; Zhang, Y.; Zhao, B. Non-invasive Raman analyses of huafalang and related porcelain wares. Searching for evidence for innovative pigment technologies. Ceram. Inter. 2017, 43, 12079–12088. [Google Scholar] [CrossRef]
- Colomban, P.; Gironda, M.; Vangu, D.; Kırmızı, B.; Zhao, B.; Cochet, V. The technology transfer from Europe to China in the 17th–18th centuries: Non-invasive on-site XRF and Raman analyses of Chinese Qing Dynasty enameled masterpieces made using European ingredients/recipes. Materials 2021, 14, 7434. [Google Scholar] [CrossRef] [PubMed]
- Colomban, P.; Simsek Franci, G.; Gironda, M.; d’Abrigeon, P.; Schuhmacher, A.-C. pXRF Data Evaluation Methodology for On-Site Analysis of Precious Artifacts: Cobalt Used in the Blue Decoration of Qing Dynasty Overglazed Porcelain Enameled at Customs District (Guangzhou), Jingdezhen and Zaobanchu (Beijing) Workshops. Heritage 2022, 5, 1752–1778. [Google Scholar] [CrossRef]
- Colomban, P.; Simsek Franci, G.; Burlot, J.; Gallet, X.; Zhao, B.; Clais, J.B. Non-Invasive on-Site pXRF Analysis of Coloring Agents, Marks and Enamels of Qing Imperial and Non-Imperial Porcelain. Ceramics 2023, 6, 447–474. [Google Scholar] [CrossRef]
- Colomban, P. Tracer l’utilisation de recettes et/ou d’ingrédients européens dans les objets émaillés: Stratégie et premiers résultats. Artefact 2023, 18, 161–193. [Google Scholar] [CrossRef]
- Landry-Deron, I. La contribution des missionnaires aux arts du feu à la cour de Pékin (xviie–xviiie siècles). Artefact 2023, 18, 117–137. [Google Scholar] [CrossRef]
- Klisinska Kopacz, A.; Wilkosz, T.; Ochniak Dudek, K. X-ray Analysis of Eighteenth- and Nineteenth-Century Meissen Porcelain Figurines. J. Anthr. Archaeol. Sci. 2023, 7, 964–974. [Google Scholar]
- Domoney, K.; Shortland, A.J.; Kuhn, S. Characterization of 18th-century Meissen porcelain using SEM-EDS. Archaeometry 2012, 54, 454–474. [Google Scholar] [CrossRef]
- Colomban, P.; Kirmizi, B.; Simsek Franci, G. Cobalt and associated impurities in blue (and green) glass, glaze and enamel: Relationships between raw materials, processing, composition, phases and international trade. Minerals 2021, 11, 633. [Google Scholar] [CrossRef]
- Colomban, P.; Simsek Franci, G. Timurid, Ottoman, Safavid and Qajar Ceramics: Raman and Composition Classification of the Different Types of Glaze and Pigments. Minerals 2023, 13, 977. [Google Scholar] [CrossRef]
- Fiches d’inventaire du Musée national de Céramique, 6 Grande Rue, 92310, Sèvres, France (This database can be consulted on request on site at the Cité de la Céramique).
- Pannequin, B.; Préaud, T.; Bezut, K.; d’Albis, A.; Dahlberg, L.; Lajoix, A.; Millasseau, S. The Sèvres Porcelain Manufactory: Alexandre Brongniart and the Triumph of Art and Industry, 1800–1847; Yale University Press: New Haven, CT, USA, 1997. [Google Scholar]
- Fourest, P.-H. Porcelaine de Saxe, Exhibition Catalog, 4th July–1st September 1952, Musée national de Céramique, Sèvres; Editions des musées nationaux: Paris, France, 1952. [Google Scholar]
- Pietsch, U. Triumph of the Blue Swords: Meissen Porcelain for Aristocracy and Bourgeoisie 1710–1815; Exhibition Cat., 8th May-25th August 2010; Dresdner Porzellansammlung, Zwinger: Dresden, Germany, 2010. [Google Scholar]
- Mission D’étude sur la Spoliation des Juifs de France, 1998–2000. Available online: https://www.culture.gouv.fr/Nous-connaitre/Organisation-du-ministere/Le-secretariat-general/Mission-de-recherche-et-de-restitution-des-biens-culturels-spolies-entre-1933-et-1945/Biens-Musees-Nationaux-Recuperation-MNR (accessed on 21 September 2023).
- Available online: https://xrfcheck.bruker.com/InfoDepth (accessed on 6 July 2022).
- Colomban, P.; Ambrosi, F.; Ngo, A.-T.; Lu, T.-A.; Feng, X.-L.; Chen, S.; Choi, C.-L. Comparative analysis of wucai Chinese porcelains using mobile and fixed Raman microspectrometers. Ceram. Inter. 2017, 43, 14244–14256. [Google Scholar] [CrossRef]
- Colomban, P.; Gironda, M.; Edwards, H.G.M.; Mesqui, V. The enamels of the first (softpaste) European blue-and-white porcelains: Rouen, Saint-Cloud and Paris factories: Complementarity of Raman and X-ray fluorescence analyses with mobile instruments to identify the cobalt ore. J. Raman Spectrosc. 2021, 52, 2246–2261. [Google Scholar] [CrossRef]
- Burlot, J.; Gallet, X.; Simsek Franci, G.; Bellot-Gurlet, L.; Colomban, P. Non-Invasive On-site pXRF Analysis of Coloring Agents, Marks and Glazes: Variability and Representativity of Measurements on Qing porcelain. Colorants 2023, 2, 42–57. [Google Scholar] [CrossRef]
- Colomban, P. Polymerisation Degree and Raman Identification of Ancient Glasses used for Jewellery, Ceramics Enamels and Mosaics. J. Non-Crystall. Solids 2003, 323, 180–187. [Google Scholar] [CrossRef]
- Colomban, P.; Tournié, A.; Bellot-Gurlet, L. Raman Identification of glassy silicates used in ceramic, glass and jewellry: A tentative differentiation guide. J. Raman Spectrosc. 2006, 37, 841–852. [Google Scholar] [CrossRef]
- Colomban, P.; Ngo, A.-T.; Fournery, N. Non-invasive Raman Analysis of 18th Century Chinese Export/Armorial Overglazed Porcelain: Identification of the Different Enameling Technology. Heritage 2022, 5, 233–259. [Google Scholar] [CrossRef]
- Edwards, H.G.M.; Vandenabeele, P.; Colomban, P. Raman Spectroscopy in Cultural Heritage Preservation; Springer: Cham, Switzerland, 2022. [Google Scholar]
- Colomban, P.; Sagon, G.; Faurel, X. Differentiation of antique ceramics from the Raman spectra of their coloured glazes and paintings. J. Raman Spectrosc. 2001, 32, 351–360. [Google Scholar] [CrossRef]
- Sakellariou, K.; Miliani, C.; Morresi, A.; Ombelli, M. Spectroscopic investigation of yellow majolica glazes. J. Raman Spectrosc. 2004, 35, 61–67. [Google Scholar] [CrossRef]
- Sandalinas, C.; Ruiz-Moreno, S.; Lopez-Gil, A.; Miralles, J. Experimental confirmation by Raman spectroscopy of a Pb-Sn-Sb triple oxide yellow pigment in sixteenth-century Italian pottery. J. Raman Spectrosc. 2006, 37, 1146–1153. [Google Scholar] [CrossRef]
- Rosi, F.; Manuali, V.; Miliani, C.; Brunetti, B.G.; Sgamellotti, A.; Grygar, T.; Hradil, D. Raman scattering features of lead pyroantimonate compounds. Part I: XRD and Raman characterization of Pb2Sb2O7 doped with tin and zinc. J. Raman Spectrosc. 2009, 40, 107–111. [Google Scholar] [CrossRef]
- Pelosi, C.; Agresti, G.; Santamaria, U.; Mattei, E. Artificial yellow pigments: Production and characterization through spectroscopic methods of analysis. E-Preserv. Sci. 2010, 7, 108–115. Available online: http://www.morana-rtd.com/e-preservationscience/2010/Pelosi-10-05-2010.pdf (accessed on 25 May 2023).
- Colomban, P.; Calligaro, T.; Vibert-Guigue, C.; Nguyen, Q.L.; Edwards, H.G.M. Dorures des céramiques et tesselles anciennes: Technologies et accrochage. ArchéoSciences 2005, 29, 7–20. [Google Scholar] [CrossRef]
- Colomban, P.; Gironda, M.; Simsek Franci, G.; d’Abrigeon, P. Distinguishing Genuine Imperial Qing Dynasty Porcelain from Ancient Replicas by On-site Noninvasive XRF and Raman Spectroscopy. Materials 2022, 15, 5147. [Google Scholar] [CrossRef] [PubMed]
- Kissin, S.A. Five Elements (Ni-Co-As-Ag-Bi) Veins, Geoscience Canada 19[3] (1992). pp. 113–124. Available online: https://journals.lib.unb.ca/index.php/gc/article/view/3768/4282 (accessed on 15 December 2019).
- Delamare, F. Aux origines des bleus de cobalt: Les débuts de la fabrication du saffre et du smalt en Europe occidentale. Comptes Rendus Séances L’académie Inscr. Belles-Lett. 2009, 153, 297–315. [Google Scholar] [CrossRef]
- Delamare, F. Saffre, smalt, bleu d’esmail et azur. In Bleus en Poudres, 5 000 ans D’innovations Techniques; Prese des Mines: Paris, France, 2008. [Google Scholar]
- Zlamalova Cilova, Z.; Gelnar, M.; Randakova, S. Smalt production in the ore mountains: Characterization of samples related to the production of blue pigment in Bohemia. Archaeometry 2020, 62, 1202–1215. [Google Scholar] [CrossRef]
- Available online: https://www.mindat.org/locentry-627563.html (accessed on 1 August 2023).
- Gratuze, B.; Soulier, I.; Barrandon, J.N.; Foy, D. De L’origine du Cobalt Dans les Verres. Rev. D’archéométrie 1992, 16, 97–108. Available online: https://www.persee.fr/doc/arsci_0399-1237_1992_num_16_1_895 (accessed on 30 September 2023). [CrossRef]
- Gratuze, B.; Soulier, I.; Blet, M.; Vallauri, L. De L’origine du Cobalt: Du Verre à la Céramique. Rev. D’archéométrie 1996, 20, 77–94. Available online: https://www.persee.fr/doc/arsci_0399-1237_1992_num_16_1_939 (accessed on 30 September 2023). [CrossRef]
- Wesch, H.; Wiethege, T.; Spiethoff, A.; Wegener, K.; Müller, K.M.; Mehlhorn, J. German uranium miner study: Historical background and available histopathological material. Radiat. Res. 1999, 152, S48–S51. [Google Scholar] [CrossRef]
- Scheinert, M.; Kupsch, H.; Bletz, B. Geochemical investigations of slags from the historical smelting in Freiberg, Erzgebirge (Germany). Geochemistry 2009, 69, 81–90. [Google Scholar] [CrossRef]
- Hunt, L.B. The true story of Purple of Cassius. Gold Bull. 1976, 9, 134–139. [Google Scholar] [CrossRef]
- Geyssant, J.; Gorget, C.; Tétart-Vittu, F. Bernard Perrot (1640–1709), Secrets et Chefs-D’œuvre des Verreries Royales D’orleans; Exhibition Catalogue, Musée des Beaux-Arts d’Orléans—SOMOGY Editions d’Arts: Paris, France, 2013. [Google Scholar]
- Colomban, P.; Kirmizi, B. Non-invasive on-site Raman study of white and polychrome enamelled glass artefacts in imitation of porcelain assigned to Bernard Perrot and his followers. J. Raman Spectrosc. 2020, 51, 133–146. [Google Scholar] [CrossRef]
- Colomban, P.; Kırmızı, B.; Clais, J.-B. Coteau’ jewelled porcelain: A summit of ceramic art. On-site Raman and pXRF study. J. Eur. Ceram. Soc. 2020, 40, 4664–4675. [Google Scholar] [CrossRef]
- Swann, C.P.; Nelson, C.H. Böttger stoneware from North America and Europe: Are they authentic? Nucl. Instr. Meth. Phys. Res. B 2000, 161–163, 694–698. [Google Scholar] [CrossRef]
- Simsek Franci, G.; Colomban, P. On-Site Identification of Pottery with pXRF: An Example of European and Chinese Red Stonewares. Heritage 2022, 5, 88–102. [Google Scholar] [CrossRef]
- Ullrich, B.; Lange, P.; Friedmar, K. Thüringer und Meissener Porcellan des spatter 18. und frühen 19. Jahrhunderts-ein werkstoffhistorischer Vergleich. Keram. Zeitsch. 2010, 62, 185–190. [Google Scholar]
- Casadio, F.; Bezur, A.; Domoney, K.; Eremin, K.; Lee, L.; Mass, J.L. X-ray fluorescence applied to overglaze enamel decoration on eighteenth- and nineteenth-century porcelain from central Europe. Stud. Conserv. 2012, 57, S61–S72. [Google Scholar] [CrossRef]
- Neelmeijer, C.; Pietsch, U.; Ulbricht, H. Eighteenth-century Meissen porcelain reference data obtained by proton-beam analysis (PIXE-PIGE). Archaeometry 2014, 56, 527–540. [Google Scholar] [CrossRef]
- Schulle, W.; Goder, F.W. Die Erfindung des europaischen Porzellans durch Böttger—Eine systematische schöpferische Entwicklung. Keram. Ztschr. 1982, 34, 598–600. [Google Scholar]
- Edwards, H.G.M. Porcelain Analysis and Its Role in the Forensic Attribution of Ceramic Specimens; Springer: Cham, Switzerland, 2022. [Google Scholar]
- Edwards, H.G.M. 18th and 19th Century Porcelain Analysis in A Forensic Provenancing Assessment; Springer: Cham, Switzerland, 2020; Available online: https://www.springer.com/gp/book/9783030421915 (accessed on 15 December 2021).
- Bezur, A.; Casadio, F. The Analysis of Porcelain Using Handheld and Portable X-ray Fluorescence Spectrometer. In Studies in Archaeological Sciences: Handheld XRF for Art and Archaeology; Shugar, A., Mass, J., Eds.; Leuven University Press: Leuven, Belgium, 2013. [Google Scholar]
- Valmont de Bomare, M. Minéralogie, ou Nouvelle Exposition du Règne Minéral, 2nd ed.; Vincent Imprimeur-Libraire: Paris, France, 1774; pp. 76–96. [Google Scholar]
- Colomban, P.; Milande, V.; Le Bihan, L. On-site Raman analysis of Iznik pottery glazes and pigments. J. Raman Spectrosc. 2004, 35, 527–535. [Google Scholar] [CrossRef]


| Inventory Number (Type) | Types and Period Assignment (This Work) | View | Raman Analyzed Spots | Phases (SiO4 Stret. In cm−1) | XRF Analyzed Spots | Major Elements (Other than Si) | Other Elements |
|---|---|---|---|---|---|---|---|
| MNC 2274.20 (butter cup) | [Cu-Zn] Co [Ni] Co |  | blue glaze | Si-rich (910–1050) Si-rich (910–1050) | blue glaze | K,Ca,Fe K,Ca,Fe | Co,Ti,Ni,As,Rb,Sr,Y,Zr,V Ni,Ti,As,Rb,Sr,Y,Zr,V |
| MNC 2274.2 (bowl) | [Cu-As-Ni] Co [Ni] Co |  | green see ref. [5] | Si-rich (1100), cas | green glaze pink gold mark | Pb,Ca,Fe,Cu K,Ca,Fe Pb,Ca,Fe Au K,Ca,Fe | K,Ni,Ti Ti,Ni,Rb,Sr,Y,Zr,Pb Au,Ni,Cu Pb,Fe,Ca,K Co,Ni,Ti,Rb,Sr,Y,Zr,Pb |
| MNC 19014 (coffee cup with arm coat of France and Poland) | [Cu] Co [Ni] Co |  | blue green yellow brown orange | mixed (1000), cas Sb-Naples, w Sb-Naples, w Mn oxide hematite | blue glaze purple gold mark | Pb Ca,K,Fe Pb,Ca,Fe Au K,Ca,Fe | Co,As,K,Ca,Fe,Ni Ti,Ni,Rb,Sr,Y,Pb Au,Ni,Rb,Sr Pb,Fe,Ca,U Co,Ni,Rb,Sr,Ti,Pb |
| MNC 23181 (Louis XV figure) | [Cu] Co [Ni] Co |  | blue glaze pink yellow | Si-rich (1050) Si-rich (1050–1100) Fluorescence Sb-Naples, w | blue glaze gold pink | Pb,Ca,K K,Ca,Fe Au,Pb Pb,Ca,Fe | Fe,Co,Ni,Sn,Ba Pb,Rb,Sr,Y Ca,Fe,U Au,Rb,Sr, |
| MNC 19032.2 (mustard cup) | [Cu] Co [Ni] Co |  | blue yellow green purple red | Cass, ars, (1000) Sb-Naples, X Sb-Naples, X Fluorescence Hematite | dark blue light blue glaze pink purple yellow mark | Pb Pb K,Ca,Fe Pb,Fe Pb,Fe Pb,Fe K,Fe | Co,Fe Co,Fe,As,Ag,Ba Ti,Ni,Rb,Sr Au,Ni,Cu,Zn Au,Ni,Cu,Zn Mn,Ni Ca,Co,Ni,Rb,Sr,Y |
| MCSR XXXXV (Imari-style dish) | [Cu-As] Co [Ni] Co | 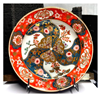 | dark blue blue green red | Si-rich (1010–1120) Si-rich (1010–1120) Sn-Naples Hematite | blue glaze gold mark (black) | Ca,K,Fe Ca,K,Fe Au, Ca,K,Fe | As,Co,Ni,Cu,Ti Rb,Sr,Y,Zr Fe,Ni Fe,Ni,Rb,Sr,Y,Zr,Pb |
| MNC 14229.1 (chocolate pot) | [Cu-As] Co [Ni] Co |  | blue | Si-rich (910–1050) | blue glaze mark | K,Ca,Fe K,Ca,Fe K,Ca,Fe | Co,Ti,V,Ni,Rb,Sr,Y,Pb Ti,V,Mn,Rb,Sr,Y,Zr Co,Ti,V,Mn,Rb,Sr,Y,Zr |
| MNC 8322 | [Cu-As] Co [Ni] Co | 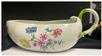 | glaze yellow green orange | Si-rich (1050–1100) Sb-Naples Sb-Naples Hematite | glaze blue pink mark | Ca,K,Fe Pb Pb,Ca,Fe K,Ca,Fe | Ti,Ni,Rb,Sr,Y,Pb Co,Fe,Ca,Ni,As,Ti Au,Ni,Ti Co,Ni,As,Rb,Sr,Y |
| MNC 14234 (orange cup) | [Cu-As] Co [Ni] Co | 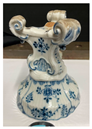 | blue glaze | Si-rich (1010–1120) Si-rich (1010–1120) | blue glaze mark | Ca,K,Fe Ca,K,Fe Ca,K,Fe | As,Co,Ni,Cu,Rb,Sr,Y Rb,Sr,Ni,Ti Co,Ni,As,Rb,Sr |
| MNC 469.9.1 (coffee cup with painting copy) | [Cu-As] Co [Ni] Co |  | blue brown red | Si-rich (1000–1100) Si-rich (1050) hematite | blue glaze gold mark | Co K,Ca,Fe Au K,Ca,Fe | K,Ca,Ti,Fe,Ni,Cu,As Ti,Ni,As,Rb,Sr,Y,Zr Fe,As,Ag,Ba Ti,Co,Ni,Cu,As,Rb,Sr,Y |
| MNC 886.4.1 (coffee cup) | [Cu-As] Co [Ni] Co |  | Blue glaze | Si-rich (1000–1050) Si-rich (1050) | blue glaze gold mark | Co K,Ca,Fe Au K,Ca,Fe | K,Ca,Ti,Fe,Ni,Cu,As,Rb Ti,Ni, Rb,Sr,Y,Zr Fe,As Co,Ni,Ti,As,Rb,Sr,Y,Zr |
| MNC 2274.38 (Figure) | [Cu-As] Co [-] Co | 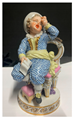 | dark blue yellow glaze | Arsenate Sb-Naples Mixed (1060) | blue white pink mark body | Pb,Ca,K Pb,K,Ca K,Fe K,Ca,Fe K,Ca,Fe | Co,As,Zn,Fe,Ni,Ag,Ba Fe,As,Co,Zn,Ni Ca,Au,Ni,Ti,Rb,Sr Co,Ni,Rb,Sr,Cu,Ti Ti,Rb,Sr |
| MNC 14201 (teapot) | [Cu-Zn] Co [?] Co |  | blue brown yellow green | Si-rich (1000) Spinel Sn-Naples, cas Sb-Naples | glaze | K,Ca,Fe | Ti,Ni,Pb,Rb,Sr,Y,Zr |
| MCSR LXXIX (large tureen) | [Zn] Co [-] Co |  | blue yellow green black | Si-rich Sb-Sn Naples Sb-Sn Naples MnO2 | blue glaze pink gold mark | Pb K,Ca,Fe Pb,Fe,Ca,K Au K,Ca,Fe | Zn,Co,Fe,Cu,Ca Ti,Ni,Rb,Sr,Y,Pb Au,Zn,Ni,Ti As,Pb,U Co,Ni, Rb,Sr,Y,Pb |
| MNC 11213.2 (coffee cup) | [Zn] Co [Zn] Co |  | blue yellow green red | Si-rich (1000–1100) Sb-Sn Naples Sb-Sn Naples, Fluorescence | blue glaze pink purple gold | Zn,Pb K,Ca,Fe Pb,K,Ca,Fe Ca,Zn,Pb Au | Co,Ca,Fe,Ni,Ti Ti,Ni,Rb,Sr,Y,Zr,U Au,Zn,Ti,Rb,Sr,Y,Zr Co,Fe,Ni K,Ca,Fe,U |
| MNC 11051.2 (boy figure) | [Zn] Co [Zn] Co |  | blue | Si-rich (1000),? | Dark blue light blue glaze mark | Pb,Zn Pb,Zn K,Ca,Pb,Fe Fe,Co,K | Co,Fe Co,Fe,As,Ni,Ti Ni,Cu,Zn,Ti Ca,Ni,Rb,Sr,Pb |
| MNC 11064 (Group of three child geometers and astronomers) | [Zn] Co [Zn] Co |  | dark blue light blue orange | Si-rich (1000), ars Si-rich (1000),? Hematite | dark blue light blue glaze gold mark | Pb,Zn Pb,Zn K,Ca,Fe Au Fe,K | Ca,Co,As,Sn,Ba,Ni Ca,Co,As,Sn,Ba,Ni Ti,Ni,Pb,Rb,Sr Ca,Ti,Fe,Ni,Pb,U Ca,Ti,Ni,Pb,Rb,Sr |
| MNC 11205 (Bacchus and bacchante group) | [Zn] Co [Zn] Co |  | dark blue blue brown green | ? Si-rich (1050) Fluo, Sn-Naples Sn-Naples, spinel? | Blue pink gold | Pb,Zn Ca,Pb,Zn Au | K,Ca,Fe,Co,Ni K,Ni,Cu,Au,,U Ca,Fe,K,Ni,Cu,Pb |
| MNC 23298.1 (cup for Turkish market) | [Zn] Co [Zn] Co |  | blue yellow | - Sb Naples | blue glaze yellow pink red mark gold | Zn,Pb K,Ca,Fe Pb Ca,Fe,Pb Pb,Ca Ca,Fe Au | Co,Ca,Ni Ti,Fe,Ni,Pb,Rb,Sr,Y,Zr Ca,Fe,Sn,Ba K,Ca,Ti,Ni,Au,Rb,Sr,Y K,Ti,Fe,Ni,Cu,Au,Rb,Sr Co,K,Ti,Ni,As,Rb,Sr,Y Ca,Fe,Pb,U |
| MNC 19944 (singing angel) | [Zn] Co [Zn] Co | 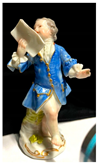 | blue | Si-rich (950–1150), ars | blue glaze gold mark | Pb,Zn K,Ca,Fe Au,Pb,Zn K,Ca,Fe | Ca,Fe,Co,Ni Ti,Ni,Pb,Rb,Sr,Y,Zr Ti,Co,Ni,Rb,Sr,Y,Pb |
| MNC 469.5.1 (coffee cup) | [Zn] Co [Zn] Co |  | blue yellow green pink purple red | Si-rich (1000), ars Sb-Naples Sb-Naples Fluorescence Fluorescence Hematite | blue glaze pink purple gold mark | Zn,Pb K,Ca,Fe Ca,Pb,Fe Pb,Ca Au K,Ca,Fe | Co,Pb,Fe,As,Ca,Ni Ti,Ni,Pb,Rb,Sr,Y,Zr K,Ni,Ti,Au,Rb,Sr Ti,Ni,Mn,Cu,Zn,Au Co,Ni,Rb,Sr,Ti |
| MNC 469.11.1 (tea cup) | [Zn] [-] |  | blue glaze green yellow pink | Si-rich (1050–1100) Si-rich (1100) Sb-Naples ? Fluorescence | blue pink gold | Zn,Co,Pb Pb,Fe,Ca Au | Fe,Ni,Ca Zn,Co,Ni Pb |
| MNC 886.3 | [Zn-As] Co [Ni] Co |  | glaze blue | Si-rich (1050–1150) Si-rich (1050–1150) | blue glaze mark | K,Ca,Fe K,Ca,Fe K,Ca,Fe | Co,Ti,Ni,Zn,As,Rb,Sr,Y,Zr Ti,Ni,Zn,Rb,Sr,Y,Zr Co,Ti,Ni,Zn,As,Rb,Sr,Y,Zr |
| MNC 2247.10 dish | [Ag] Co [Ni] Co | 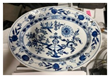 | blue glaze | Si-rich (1000–1150) Si-rich (1000–1150) | blue glaze mark | Ca K,Ca,Fe K,Ca,Fe | K,Co,Ti,Fe,Ni,Cu,Zn,Rb,Sr,As T,Ni,Rb,Zr,Sr,Y Co,V,Ni,Rb,Zr,Sr,Y,As |
| MCSR LVII.1 (coffee cup with Watteau-like décor) |  | glaze black yellow green orange | Si-rich (1100) Spinel Sb-Naples, w Sb-Naples, w Hematite | not studied | |||
| MNC 8160.2 (dish) |  | blue yellow pink | Si-rich (1000) Sb-Naples,? Fluorescence | Not studied | |||
| MNC 25340 (figure) |  | glaze yellow green light green purple orange black | Si-rich (1100) Sn-Naples, cas Sn-Naples, cas Sn-Naples, cas Fluorescence Hematite spinel | Not studied | |||
| MNC 9638 (bowl) |  | dark blue yellow grey green pink orange | ? Sb-Sn Naples Sb-Sn Naples Sn-Naples Fluorescence Hematite | Not studied |
| Inventory Number (Type) | Period | View | Glaze | Co and X Blue | Co and X Marks | CoBiPb Blue, Glaze and Marks | YRbSr | Au° | Classification |
|---|---|---|---|---|---|---|---|---|---|
| MNC 2274.20 (butter cup) | c.a. 1730 |  | 1 | 4 | no | 2,3 | 4 | no | A Group |
| MNC 2274.9 (2274.2) (bowl) | 1726 (mark) |  | 1 | no | 1 | 2 | 4 | 2 | |
| MNC 19014 (coffee cup with arm coat of France and Poland) | 1737 Gift from August III to Marie Leszcynska | 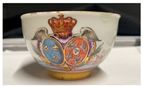 | 1 | 4 | 1 | 1,2 | 4 | 2 | |
| MNC 469.9.1 (coffee cup with painting copy) | ca. 1774–1814 (Marcolini period) | 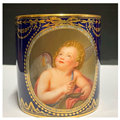 | 1 | 4 | 1 | 2,3 | 4 | 1 | |
| MNC 886.4.1 (coffee cup) | End of 18th—beginning of 19th c. |  | 1 | 4 | 1 | 2,3 | 4 | 1 | |
| MNC 14234 (orange cup) | 18th c.? |  | 1 | 4 | 2 | 2,3 | 4 | no | |
| MCSR XXXXV (Imari-style dish) | ca. 1730 |  | 1 | 4 | 2 | 2,3 | 4 | 1 | |
| MNC 469.5.1 (coffee cup) | ? |  | 1 | 1,4 | 1 | 1,2 | 2 | 2 | B Group |
| MNC 19032.2 (mustard cup) | 18th c. | 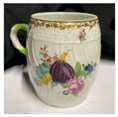 | 1 | 4 | 2 | 1,2 | 2 | no | |
| MNC 469.11.1 (tea cup) | ca. 19th c. | 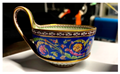 | 1 | 1 | no | 1 | 2 | 2 | |
| MNC 11064 (Group of three child geometers and astronomers) | 18th c.? |  | no | 1 | 1 | 1,2 | 1 | 2 | C Group |
| MNC 19944 (Singing angel) | 18th c. |  | 1 | 1 | 1 | 1 | |||
| MNC 11213.2 (coffee cup) | 18th c. |  | 1 | 2 | no | 1,2 | 4 | 2 | D |
| MNC 14201 (tea pot) | 18th c. |  | 1 | 3 | 5 | 4 | 1 | E | |
| MCSR LXXIX (Chinese decoration) | ca. 1720–1730 |  | 1 | 6 | 2 | 1,2 | 2 | 2 | F |
| MNC 2274.38 (Figure) | 1709–1730 |  | no | 5 | 1 | 1,2 | 2 | no | G |
| MNC 886.3 | 1825 | 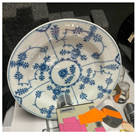 | 3 | 4 | 3 | 2,3 | 4 | no | H |
| MNC 2247.10 |  | 3 | 3 | 1 | 2,3 | 4 | no | ||
| MNC 23298.1 (cup for Turkish market) | ca. 1774 | 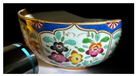 | 4 | 1 | 4 | 1,2 | 1 | 2 | I |
| MNC 11051.2 (boy figure) | 18th c.? | 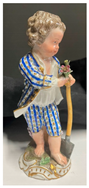 | 5 | 1 | 1 | 2 | 1,2 | no | J |
| MNC 11205 (Bacchus and bacchante group) | 18th c. | 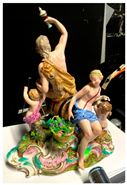 | no | no | no | no | no | 2 | K |
| MNC 8160.2 (dish) | ca. 1720 | 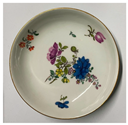 | no | no | no | no | no | no | Not studied using XRF |
| MNC 25340 (figure) | 19th c. | 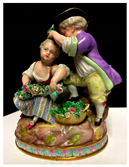 | no | no | no | no | no | no | |
| MNC 9638 (bowl) | 18th c. | 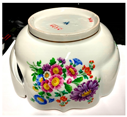 | no | no | no | no | no | no | |
| MCSR LVII.1 (coffee cup with Watteau-like décor) | ca. 1745 | 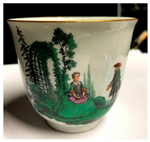 | no | no | no | no | no | no |
| Color | Coloring Agent Colorant/Opacifiant | Element(s) Associated with Coloring Agent/Phase(s) | Glassy Silicate Matrix/ Associated Elements | Recipes/ Ingredients Origin | Reference |
|---|---|---|---|---|---|
| White | Different types of lead arsenates | Y | Europe | [24,25,51] | |
| cassiterite | Europe | [22,23,26] | |||
| Blue | Co2+ | As/lead arsenate Ni,Cu | Y | Europe | [22,23,24,25,26,30,38,40,51] |
| Co2+ | Fe,Mn | Rb,Sr | China | [24,25,26,30,38,40] | |
| Yellow | Pb-Sn pigment | China/ Japan | [22,23,24,25,26,30,38,51] | ||
| Pb-Sb pyrochlore | Y | Europe | |||
| Pb-Sb/Sn/Zn pyrochlore | Y | Europe | |||
| Yellow-green | Co2+ + yellow pigment | Y | Europe | ||
| Green | Co2+ + yellow pigment | As | Y | Europe | [22,23,24,26,38,43] |
| Cu2+ | Europe/ China | ||||
| Red | Hematite | Europe/ China | [22,23,26,38,43] | ||
| Cu° NPs | Europe/ China | [26,51] | |||
| Au° NPs | As/lead arsenate | Y | Europe | [24,25,26,43,51] | |
| Orange | Au° NPs | Europe | [24,25,26,43,51] | ||
| Rose/pink | Au° NPs | As/lead arsenate | Y | Europe | [24,25,26,43,51] |
| Purple | Au° NPs | Europe | |||
| Black | Fe-Mn spinel | Europe/ China | [22,23,24,25,26,30,38,51] | ||
| Fe-Mn-Cr spinel | Europe/ China | ||||
| Brown | Mn oxide | Europe/ China |
Disclaimer/Publisher’s Note: The statements, opinions and data contained in all publications are solely those of the individual author(s) and contributor(s) and not of MDPI and/or the editor(s). MDPI and/or the editor(s) disclaim responsibility for any injury to people or property resulting from any ideas, methods, instructions or products referred to in the content. |
© 2023 by the authors. Licensee MDPI, Basel, Switzerland. This article is an open access article distributed under the terms and conditions of the Creative Commons Attribution (CC BY) license (https://creativecommons.org/licenses/by/4.0/).
Share and Cite
Colomban, P.; Simsek Franci, G.; Gerken, M.; Gironda, M.; Mesqui, V. Non-Invasive On-Site XRF and Raman Classification and Dating of Ancient Ceramics: Application to 18th and 19th Century Meissen Porcelain (Saxony) and Comparison with Chinese Porcelain. Ceramics 2023, 6, 2178-2212. https://doi.org/10.3390/ceramics6040134
Colomban P, Simsek Franci G, Gerken M, Gironda M, Mesqui V. Non-Invasive On-Site XRF and Raman Classification and Dating of Ancient Ceramics: Application to 18th and 19th Century Meissen Porcelain (Saxony) and Comparison with Chinese Porcelain. Ceramics. 2023; 6(4):2178-2212. https://doi.org/10.3390/ceramics6040134
Chicago/Turabian StyleColomban, Philippe, Gulsu Simsek Franci, Mareike Gerken, Michele Gironda, and Viviane Mesqui. 2023. "Non-Invasive On-Site XRF and Raman Classification and Dating of Ancient Ceramics: Application to 18th and 19th Century Meissen Porcelain (Saxony) and Comparison with Chinese Porcelain" Ceramics 6, no. 4: 2178-2212. https://doi.org/10.3390/ceramics6040134