Article

High-Lead Glazed Ceramic Production in Western Iberia (Gharb al-Andalus) between the 10th and Mid-13th Centuries: An Approach from the City of Évora (Portugal)

by
Carlos Andrés Camara
1,
María José Gonçalves
2,
José Antonio Paulo Mirão
1,3,4,5,
Susana Gómez Martínez
6,7,8 and
Massimo Beltrame
1,3,5,*
1
Laboratório HERCULES, Évora University, Largo Marquês de Marialva n.º 8, 7000-809 Évora, Portugal
2
Município de Silves, Museu Municipal de Arqueologia, Praça do Município, 8300-117 Silves, Portugal
3
Associate Laboratory for Research and Innovation in Heritage, Arts, Sustainability and Territory IN2PAST, Évora University, Largo Marquês de Marialva n.º 8, 7000-809 Évora, Portugal
4
Geosciences Department, School of Sciences and Technology, Évora University, Rua Romão Ramalho n.º 59, 7000-671 Évora, Portugal
5
City University of Macau Chair on Sustainable Heritage, Évora University, Cordovil Palace, Rua Dom Augusto Eduardo Nunes 7, 7000-784 Évora, Portugal
6
History Department, School of Social Sciences, Évora University, Colégio do Espírito Santo—Largo dos Colegiais n.º 2, 7004-516 Évora, Portugal
7
Campo Arqueológico de Mértola, R. António José de Almeida n.º 1-3, 7750-353 Mértola, Portugal
8
CEAACP, Centro de Estudos em Arqueologia, Artes e Ciências do Patrimonio, Coimbra University, Largo da Porta Férrea, 3000-395 Coimbra, Portugal
*
Author to whom correspondence should be addressed.
Ceramics 2023, 6(4), 2213-2242; https://doi.org/10.3390/ceramics6040135
Submission received: 28 September 2023 / Revised: 31 October 2023 / Accepted: 6 November 2023 / Published: 15 November 2023
(This article belongs to the Special Issue Advances in Ceramics, 2nd Edition)

Abstract

:
In the present study an archaeometry programme has been developed on a limited number of coarse wares, monochrome, and bichrome glazed ceramics retrieved in the cities of Évora, Mértola, and Silves, located in Western Iberia, Portugal (Gharb al-Andalus during the Islamic period). The goals were to shed light on glazed ceramics provenance, technology, trading, and on the glaze technology applied. For this purpose, a multi-analytical approach was employed to characterize ceramic pastes and glazes using optical microscopy (OM), X-ray diffraction (XRD), X-ray fluorescence (XRF), and a Scanning Electron Microscope coupled to an Energy Dispersive Spectrometer (SEM-EDS). Results evidenced that over the Islamic rule, coarse wares were locally produced at Évora. On the contrary, monochrome and bichrome glazed ceramics were imported from the city of Silves, Mértola, and from unidentified workshops, probably located in southern Iberia. The analysis of decorations evidenced that despite the provenance of the samples, the glaze technology applied was rather uniform over time, depicting a widespread technological transfer in the al-Andalus.

1. Introduction

The first evidence of Islamic glazed ceramic production in the Iberian Peninsula (i.e., al-Andalus during the Islamic Middle Ages) was documented at Pechina, Málaga, and Córdoba during the late Emiral period (end of the 9th/early 10th century AD) [1,2,3]. The production technology was characterized by the use of lead oxide (PbO), as the main fluxing agent, and silica (SiO2) to produce high-lead glazed ceramics. The procurance of lead was diverse but, preferentially, galena ore deposits from the southeast of the Iberian Peninsula were largely quarried as a naturally occurring mineral [4]. The contribution of alkaline earth metals (i.e., Na2O and K2O) as fluxing agents was generally low [5].
The glaze was commonly applied over biscuit-fired ceramic bodies, and calcareous clays were usually chosen for the technical advantages they presented compared to silica-rich ceramic bodies [5,6,7,8,9]. Additionally, the ceramic paste generally becomes buffy after firing, as calcareous clays prevent the crystallization of hematite in the ceramic paste.
The preparation of high-lead glazes involved the oxidation of galena (PbS) and continued with an additional two-stage process to produce “frits”. It consisted of a PbO-SiO2 mixture, which was melted at high temperatures to produce raw glasses. Eventually, transition metals such as copper (Cu/green), iron (Fe/yellow), and manganese (Mn/brown) could be added, or not, as coloring agents to obtain different colored glasses.
The resulting glass was subsequently ground and mixed in water. A binding agent (i.e., Arabic gum or clay) could also be included to favor glaze adhesion on the object surface. The glaze suspension was then poured onto a biscuit-fired ceramic body, dried, and submitted to the last firing cycle, forming a monochrome glaze cover [1,5,8,10,11].
In some cases, black/brown decorative patterns could also be drawn before the final firing stage using manganese- (Mn) and/or iron (Fe)-rich pigments. Pigments could be mixed with lead–silica mixtures and applied over, or under, the main glazed layer [10,11,12,13].
During the Emiral period, high-lead glazed ceramic dissemination was not uniform throughout the al-Andalus. It was widely used in southern Iberia [1,2,10,14,15] and belated toward more peripheral territories, such as the western al-Andalus: the “Gharb al-Andalus” (current Portugal). So, its rarity over this period was proportional to its prestigious and representative nature. Additionally, in this area, the distribution and ubiquitous dissemination of glazed tableware was pointed out by [16,17].
Since the beginning of the Caliphate (10th century AD), a period characterized by political stability and economic prosperity, high-lead glazed ceramics started to vulgarize, and the technology started to spread at a regional level. In the western part of the al-Andalus, it was probably the result of closer trading relationships between the most important cities of the Gharb (e.g., Coimbra, Santarem, Lisbon, Beja, Évora, Faro, and Silves) and the Islamic heartland (e.g., Bayyana, Málaga, Córdoba, Almería, and alike) which, in turn, fostered changes in cultural habits. Afterward, the utilization of high-lead glaze technology continued with no interruption during the Taifa, Almoravid, and Almohad Islamic periods (11th to 13th centuries AD).
In the Gharb al-Andalus, the production of unglazed, painted, and some glazed ceramics (monochrome and corda seca ceramic styles) is attested through the discovery of several ceramic workshops in Lisbon [18,19] and Santarém at the end of the Taifa kingdoms/beginning of the Almoravid periods (11th/12th centuries AD) [20,21]. In Mértola, the production of unglazed and white-painted pottery was also evidenced during the Almohad period [22].
Nevertheless, the possible production of high-lead glazed ceramics in different cities/workshops of the Gharb al-Andalus is still a matter of debate among archaeologists. Consequently, the development of archaeometric studies on unglazed and glazed ceramics from different archaeological sites is necessary to evaluate the ceramics’ possible origin, trade circuits, and the diffusion of high-lead glaze technology during the Islamic period in Western Iberia.
The ceramic samples selected for this study include unglazed coarse wares, monochrome (i.e., with a honey glaze), and bichrome (i.e., honey glaze with black/brown decorations) glazed ceramics from the Gharb al-Andalus (south central Portugal) with a relative chronology spanning between the 10th to mid-13th centuries AD. They were recovered within the historical center of the cities of Évora (the majority of them), Mértola, and Silves (Figure 1).
The methodology includes optical microscopy (OM), X-ray diffraction (XRD), and X-ray fluorescence (XRF) to determine the technology and provenance of ceramic samples, while a Scanning Electron Microscope coupled to an Energy Dispersive Spectrometer (SEM-EDS) has been used to determine the glaze technology applied in each case.
The starting point is the city of Évora, where most samples were recovered. The main goal is to evaluate the possible local production, or not, of glazed ceramics and their characteristics. Therefore, unglazed tableware and a kiln tool has been used as possible standards of locally available raw materials for comparison. As a second step, glazed ceramics from Évora has been compared to similar prototypes recovered in the cities of Silves and Mértola to evaluate similarities and differences within cities in terms of ceramic and glaze technologies.
Therefore, the characterization of Islamic glazed ceramics from the cities under study not only has the potential of adding new information regarding ceramic and glaze technology in Évora during the Islamic period, but it will also make it possible to evaluate trades and consumption trends over the given timeframe between the selected cities and, more generally, in the Gharb al-Andalus. Results are compared to and evaluated with the most recent bibliography in this field of study within the region [1,2,3,5,6,8,9,10,11,13,14,15,16,17,18,19,20,21,22,23,24,25] and other areas [26,27].

2. Geological Settings of the Cities of Évora, Mértola, and Silves

The selected cities are located in the south and central part of Portugal (Figure 1), and the geological characteristics of each area are different. As a result, the compatibility of the ceramic samples with the local geology in each place (Figure 2) can be evaluated and established.
From a geological point of view, the city of Évora is included within the Évora Massif, a geological unit outcropping within the Ossa–Morena Zone in the Iberian Variscan Orogen. It mainly consists of Ediacaran, Cambrian, and Ordovician country rocks, affected by medium- to high-grade metamorphism and large mafic to felsic intrusions. Specifically, Évora lies over a core of high-grade metamorphic rocks that comprise a variable complex of schists, migmatites, and gneiss. Also, intrusion of Variscan plutonic rocks ranging from gabbro to granite can be found [28].
The city of Mértola lies in southern Portugal. From a geological point of view, it is included within the Southern Portuguese Zone (SPZ), the southernmost segment of the Iberian Variscan Massif, with characteristic rocks of the Iberian Pyrite Belt (IPB). The stratigraphic succession of the IPB is subdivided into three major Upper Palaeozoic (Givetian-Visean) sedimentary and igneous lithostratigraphic units: the Phyllite/Slate–Quartzite Group (PQ Group), the volcano sedimentary complex (VS complex) and the Baixo Alentejo Flysch (BAF). The PQ group is dominated by interlayered slates of fine-grained quartzite and siltstones, as well as quartz-rich greywackes, rare conglomerates, and jasper lenses. The VS complex is made up of several lenticular outcrops of clay- and quartz-rich slates, siltstones, jaspers, cherts, mafic and felsic igneous rocks, and tuffs with nodules of manganese and iron oxides. Lastly, the BAF is composed of bedded successions of pelitic and turbidite deposits (i.e., slates and greywackes, respectively), and has scattered occurrences of carbonate-rich nodules [29,30].
The city of Silves is also located in southern Portugal. From a geological point of view, it is included in the Mesozoic to Cenozoic Algarve sedimentary basin, a large E-W trending elongated basin, comprising Triassic to Quaternary sediments, formed as a consequence of rifting in the Upper Triassic. Three different geological zones can be observed in Silves. The northernmost border is represented by the Brejeira Formation from the Carboniferous included in the Southern Portuguese Zone (SPZ). It is mainly composed of a turbiditic succession, which includes pelitic rocks (i.e., slates), quartzites, and greywackes. Going southward, sandstones from the Upper Triassic can be found (i.e., Silves Sandstones). In this area, small outcrops of Upper Triassic/Lower Jurassic limestones, dolostones, dolomitic limestones, marls, and evaporites, in addition to Lower Jurassic dolerites–basalts (i.e., volcano sedimentary complex) can be found. Finally, going further southward, Mesozoic to Cenozoic sedimentary deposits are widely represented, and are mainly characterized by the presence of sandstones, conglomerates, alluvial deposits, carbonate rocks, and sediments [31,32,33,34].

3. Materials and Methods
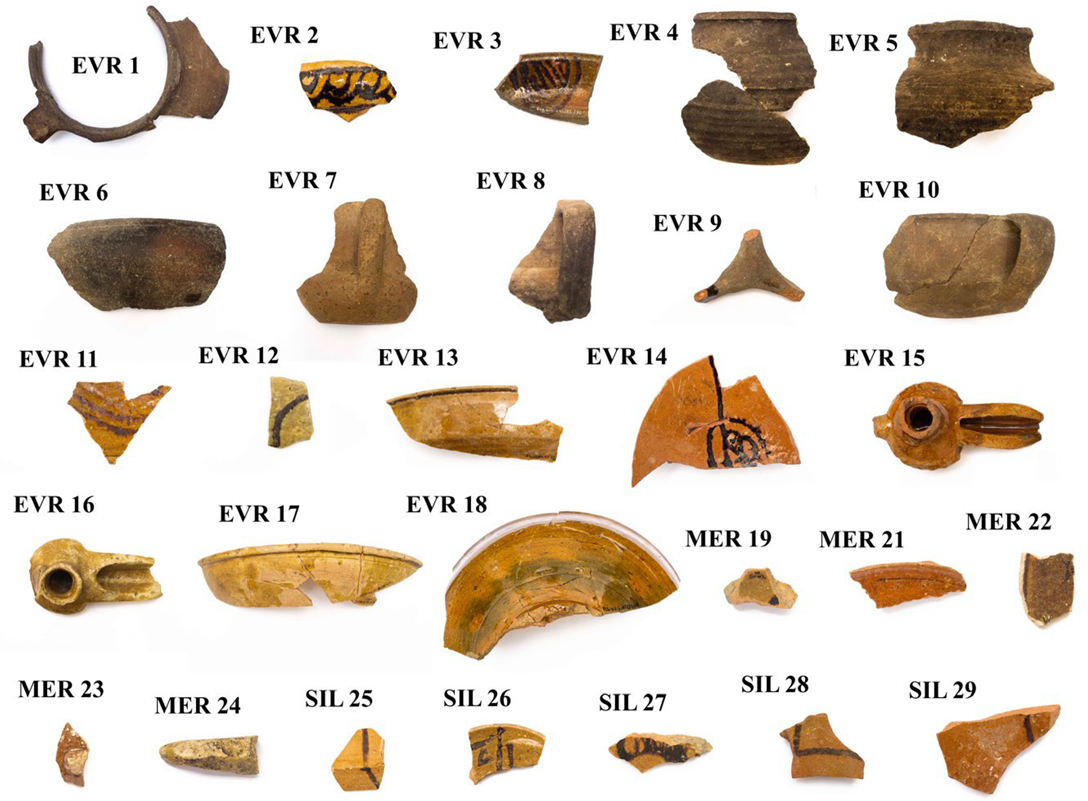
3.1. Materials

The collection includes 28 samples recovered in the cities of Évora (18), Mértola (5), and Silves (5). Samples consist of 8 monochrome honey-glazed wares and 12 bichrome honey-glazed wares with black/brown decorations. In addition, 8 unglazed coarse wares from the city of Évora, including a tripod stand with traces of glaze on top, were selected as reference materials to characterize the local pottery fabric (Figure 3 and Figure 4, Table 1).
Ceramic typological analysis evidenced that based on morphological and stylistic characteristics, specimens can be assigned to different Islamic periods [16,35,36].
Ceramics from the Caliphal period are mainly cooking pots, characterized by S-profile remnants, triangular-shaped lips, and short bodies. Soft carination and semi-spherical bodies are displayed in casseroles, as well as short bodies in small jugs, and the appearance of low-annular feet in bowls is also evident [16,37,38].
Over the Taifa kingdoms period, transitional changes were evident in ceramic typology. The carination of casseroles and bowls was stronger compared to the previous period, and the adoption of low-annular feet and thick walls was common. Moreover, oil lamps with small repositories and long, faceted spouts were usually produced [37,39]. Small jugs began to be glazed with a black/brown glazed decoration [16,17].
During the Almohad period, some attributes in bowls could be similar to the previous period (i.e., low-annular foot, strong carination, thick wall), but the adoption of diagonal high-annular feet was widely observed in small bowls and tureens [22,37,38,39,40].
Therefore, based on these observations, the relative chronology of the analyzed ceramic assemblage spans roughly between the late 10th and the mid-13th centuries AD.

3.2. Methods

In all cases, ceramic pastes were analyzed by OM, XRD, and XRF. When present, the glazed decorations were analyzed by SEM-EDS.

3.2.1. Optical Microscopy (OM)

Optical microscopy is a prime method to evaluate ceramic provenance, as it can clearly link ceramic samples to the geological characteristics of a specific area. The petrographic description of ceramic thin sections was performed using a Leica DM-2500P transmitted light microscope (Leyca microsystems, Wetzlar, Germany) equipped with an acquisition camera. Clay matrix, temper (i.e., minerals and rock fragments), and porosity were described following the scheme proposed by [7]. Digital image analysis (DIA) was utilized to evaluate grain size, grain size distribution temper, porosity, and clay matrix abundance. This approach is widely used for the study of ceramics and mortars [41,42,43,44]. The software utilized to develop DIA was ImageJ 1.54, starting from binary images collected in crossed-polarized light (XPL) and plane-polarized light (PPL). The grain size was described taking into account the Wentworth Scale [45]. The specifications of each sample are included in in a specific Supplementary Materials files annexed to the manuscript.

3.2.2. X-ray Diffraction (XRD)

XRD is an analytical technique employed to identify mineralogical phases. In the field of ceramic archaeometry it is essential to establish the mineralogical composition of samples. Analyses on powdered samples were performed using a Da Vinci design BrukerTM AXS D8 Discovery diffractometer (Bruker, Mannheim, Germany), with a Cu Kα radiation source, operating at 40 kV and 40 mA, and coupled to a LynxEye 1-dimensional detector. The patterns were collected from 3°–75° 2θ at a step size of 0.05° 2θ and a 1 s/step measuring time. The identification of minerals was set by Diffract.EVA 5.0 software with the PDF-2 mineralogical database (International Center for Diffraction Data—ICDD). The specimens’ thermal history was evaluated considering the decomposition and development (or not) of specific mineralogical phases during firing [32,46,47,48,49,50].

3.2.3. X-ray Fluorescence (XRF)

The quantification of major oxides (Na2O, MgO, Al2O3, SiO2, P2O5, K2O, CaO, TiO2, MnO, Fe2O3) by XRF spectroscopy allowed us to access the chemical composition of ceramic pastes. Analyses were performed by operating a BrukerTM S2 Puma energy-dispersive XRF spectrometer (Bruker, Mannheim, Germany)) equipped with a silver X-ray tube and calibrated using 36 standard reference materials [20]. Glass beads were prepared for this purpose mixing one part of sample with ten parts of flux (1:10 sample/flux ratio). Results included oxides concentrations in weight percentage (wt%) and the associated instrumental statistical errors. The full set of acquired data is included in a specific Supplementary Materials files annexed to this manuscript. The software utilized to acquire and process data was Spectra Elements 2.0. Loss on ignition (LOI) was evaluated by calcination using roughly 1 g of the sample [51].

3.2.4. Microanalysis by SEM-EDS

SEM-EDS has been utilized to determine the glaze technology applied (i.e., glaze chemical composition, application technique, firing technique, and decoration characteristics). The work was developed using a variable pressure SEM-Model HitachiTM S-3700N coupled to an EDS-BrukerTM XFlash 5010 Silicon Drift EDS Detector® (Hitachi, Tokyo, Japan) with a spectral resolution of 129 eV at FWHM/Mn Kα. Analyses were performed at a 20 kV acceleration voltage, 120 µA, and a pressure of 40 Pa in the chamber. The chemical data obtained were converted into oxides by stoichiometry and normalized to 100% using 3 different replicates. In the case of spot analysis, just one measurement was performed. In this case, the associated statistical error is 1 sigma. Esprit 1.9 software by BRUKER was utilized to acquire and interpret SEM-EDS data.
For each sample, inner/outer glazed surfaces and black/brown decorations were analyzed, and the results are presented in a separate data file annexed to the article. In all cases, the inner glaze was defined as the inside of the piece, whereas the outer glaze was defined as the external part of the piece. Depending on the typology back/brown decorations could be observed in the inner or outer glaze when present.
Glaze technology was evaluated following the guidelines proposed by different authors [5,8,10,52,53]. Specifically, the firing technology was examined by observing glaze/ceramic paste interfaces [53], whereas the glaze application technique was assessed according to the method proposed by [52].

4. Results and Discussion

4.1. Optical Microscopy (OM)

Samples were divided into six pottery fabrics (PFs). The compatibility with the geological settings of each area was also assessed. The petrographic characteristics of ceramic samples are resumed in a specific Supplementary Materials, and Figure 5 and Figure 6. Follow the description of each PF.

4.1.1. PF 1

It includes cookware (EVR 1, 4, 5, 6 and 10), tableware (EVR 7 and 8) and a kiln tool (EVR 9) (Figure 5). In all cases, the ceramic paste is highly homogeneous and brown coloured. The only exception is sample EVR 9, which shows a moderately heterogeneous red/buffy ceramic paste. Porosity (4 to 11%) is mainly composed of meso-vughs and meso-elongated voids. Temper (11 to 17%) is very poorly sorted in all cases, with a high amount of equant crystals if compared to elongated ones. Roundness varies from very angular to sub-angular. Grain size distribution is mostly unimodal, except for EVR 1 and 9.
Mineralogically, it was characterised by non-plastic inclusions of green/brown amphibole (probably hornblende and/or cummingtonite), plagioclase feldspar, biotite, quartz, opaque mineral, potassium-rich feldspars (rare), and muscovite (rare). Pyroxenes (rare) were also observed in some cases. Acid and mafic plutonic rock fragments (i.e., probably granite and tonalite) were usually identified.

4.1.2. PF 2

PF 2 includes lots of tableware (EVR 3, 14, 18, MER 21, 22, 23, and SIL 27) and an oil lamp (EVR 15) (Figure 5). In all cases, the ceramic paste is slightly heterogeneous and brown-red in color. Lime nodules were very common and clay pellets could also be rarely observed. Porosity (1 to 4%) is mainly composed of micro/macro-sized vughs, vesicles, and elongated voids. Temper (5 to 14%) is moderately sorted in most cases, except for SIL 27 (very poorly sorted), with a high amount of equant crystals compared to elongated ones. Roundness varies from very angular to sub-rounded. Grain size distribution is unimodal.
Mineralogically, it was characterized by the recurrent presence of quartz, potassium-rich feldspar, muscovite (rare), and plagioclase. Amphiboles were rarely observed in some samples (EVR 3, MER 21, and 23). Quartzite and sandstone rock fragments could be indistinctly identified in each sample.

4.1.3. PF 3

PF 3 includes lots of tableware (EVR 11, 13, 17, SIL 25, and 26) In all cases, the ceramic paste is moderately homogeneous and red-buffy in color (Figure 5). Additionally, unmixed clay pellets are very common and lime nodules could also be rarely observed (EVR 13 and SIL 26). Porosity (1 to 2%) is mainly composed of meso/macro-sized vughs, vesicles, and elongated voids. Temper (5 to 10%) is moderately sorted, with a high amount of equant crystals compared to elongated ones. Roundness varies from sub-angular to sub-rounded. Grain size distribution could be unimodal (EVR 11 and 13) or bimodal (EVR 17, SIL 25 and 26).
Mineralogically, it was characterized by the recurrent presence of quartz, potassium-rich feldspar, muscovite (rare), and plagioclase feldspars (rare). Amphiboles and secondary calcite (recrystallized after firing) were rarely identified in a few samples. Quartzite and sandstone were common rock fragments in addition to thermally altered limestone fragments (rare) and bioclasts (rare).

4.1.4. PF 4

PF 4 includes only one piece of tableware (EVR 12) (Figure 5). The ceramic paste is highly homogeneous and buffy-colored. Porosity (1%) is mainly composed of meso-vughs and meso-elongated voids. Temper (4%) is moderately sorted, with a high amount of equant crystals compared to elongated ones. Roundness varies from angular to sub-angular. Grain size distribution is unimodal.
Mineralogically, it was characterized by the presence of quartz, potassium-rich feldspar, muscovite (rare), plagioclase feldspars (rare), and biotite. Thermally altered limestone, bioclasts, and schist rock fragments could be also identified.

4.1.5. PF 5

PF 5 includes two oil lamps (EVR16 and MER 24) (Figure 5). In both cases, the ceramic paste is moderately homogeneous and buffy in color. Porosity (2%) is mainly composed of meso/macro-sized vughs and elongated voids. Temper (2 to 10%) is moderately sorted, with a high amount of equant crystals compared to elongated ones. Roundness varies from angular to sub-angular. Grain size distribution is unimodal.
Mineralogically, it was characterized by the presence of quartz, potassium-rich feldspar, muscovite, calcite, secondary calcite inside pores (recrystallized after firing), and biotite (rare). Thermally altered limestone fragments were common. Gneiss, schist, and quartzite rock fragments could be also identified.

4.1.6. PF 6

PF 6 includes lots of tableware (EVR 2, MER 19, SIL 28, and 29). In all cases, the ceramic paste is moderately homogeneous (Figure 5) and red-buffy in color. Porosity (2 to 4%) is mainly composed of meso/macro-sized vughs, vesicles, and elongated voids. Temper (4 to 7%) is moderately sorted, with a high amount of equant crystals compared to elongated ones. Roundness varies from very angular to sub-angular. Grain size distribution could be unimodal (EVR 2) or bimodal (MER 19, SIL 28 and 29).
Mineralogically, it was characterized by the presence of muscovite (very abundant in the ceramic matrix), quartz, potassium-rich feldspar, and plagioclase feldspar (rare). Brown amphibole could also be observed in some samples (EVR 2 and MER 19). Quartzite, greywacke, and chert rock fragments could be also indistinctly recognized in each sample.
Regarding the applied ceramic technology, DIA results evidenced a clear difference between unglazed and glazed ceramic samples. Additionally, specimens could be divided based on temper, porosity, and paste abundance (Figure 6).
Unglazed PF1 samples (i.e., cookware, tableware) were abundant in temper (i.e., max. 17%), porosity was generally high (up to 11%), and the ceramic paste represented approximately 82% at maximum. The applied technology evidenced the production of coarse-manufactured ceramic vessels, enriched in temper to improve the piece’s thermal shock resistance and heating effectiveness when they were subjected to high temperatures [6,7]. Similar considerations can be performed for the EVR 9 sample, but the original function was different (i.e., tripod—kiln tool). On the contrary, a different technological choice was applied in most glazed tableware and lighting objects (PF2 to 6). Samples are less porous and have less temper, and the ceramic paste is more abundant in all cases compared to PF1 specimens. So, the raw material was probably treated (i.e., decanted) to remove bigger grains. The second addition of temper depended on the characteristics of the employed clay raw material and object typology.
Sample provenance is also diversified. The local geology in each place (Évora, Silves, Mértola) is widely known, and the identification of specific mineralogy/rock fragments inside samples of ceramic pastes is indicative of a specific provenance. PF1 was assigned to the city of Évora, and PF2 and 3 were attributed to the city of Silves. PF6 was allocated to the city of Mértola. In contrast, PF4 and 5 were not compatible with the local geology of the cities of Évora, Mértola, and Silves and depicted imported artifacts in the Gharb al-Andalus.
The main mineralogy (plagioclase feldspars, amphiboles, opaque minerals, quartz, biotite, potassium-rich feldspars) and rock fragments (i.e., plutonic acid/felsic rock fragments) reported in PF1 are compatible with the regional geology documented in the city of Évora [28]. Furthermore, the local coarse ware production of PF1 was corroborated by the tripod stand (EVR 9) included in this group.
The mineralogy (quartz, plagioclase feldspar, potassium-rich feldspar, muscovite) and rock fragments (quartzite, sandstone) identified in PF2 and PF3 samples point out the affinity to the geological setting of the Silves area. The alteration products of the Silves Sandstone were probably employed for ceramic production. Similar results were obtained in a previous study [25]. Although similar minerals and rock fragments were identified in PF2 and PF3 samples, the identification of lime nodules and clay pellets suggests that the raw material exploited was probably heterogeneous, or different raw materials were mixed. A difference in the color of the ceramic paste of samples has also been observed. So, raw material heterogeneity or different raw material mixing probably influenced the samples’ paste carbonate component abundance. Additionally, the ceramic paste of PF3 samples is generally lighter in color, suggesting that the carbonate component is slightly higher than PF2.
The compatibility between the regional geology of Mértola and PF6 is attested by the identification of quartzite, greywacke, and chert rock fragments. The exploitation of the alteration products from the Baixo Alentejo Flysch unit is suggested for ceramic production [30].
PF4 and PF5 samples are not compatible with the local geology of Évora, Mértola, and Silves, indicating that ceramics were likely manufactured over an unspecified area across the southern al-Andalus (southern Iberia). It is noteworthy that the majority of the main pottery workshops were located on the southern coast of the Iberian Peninsula during the Islamic period [24].

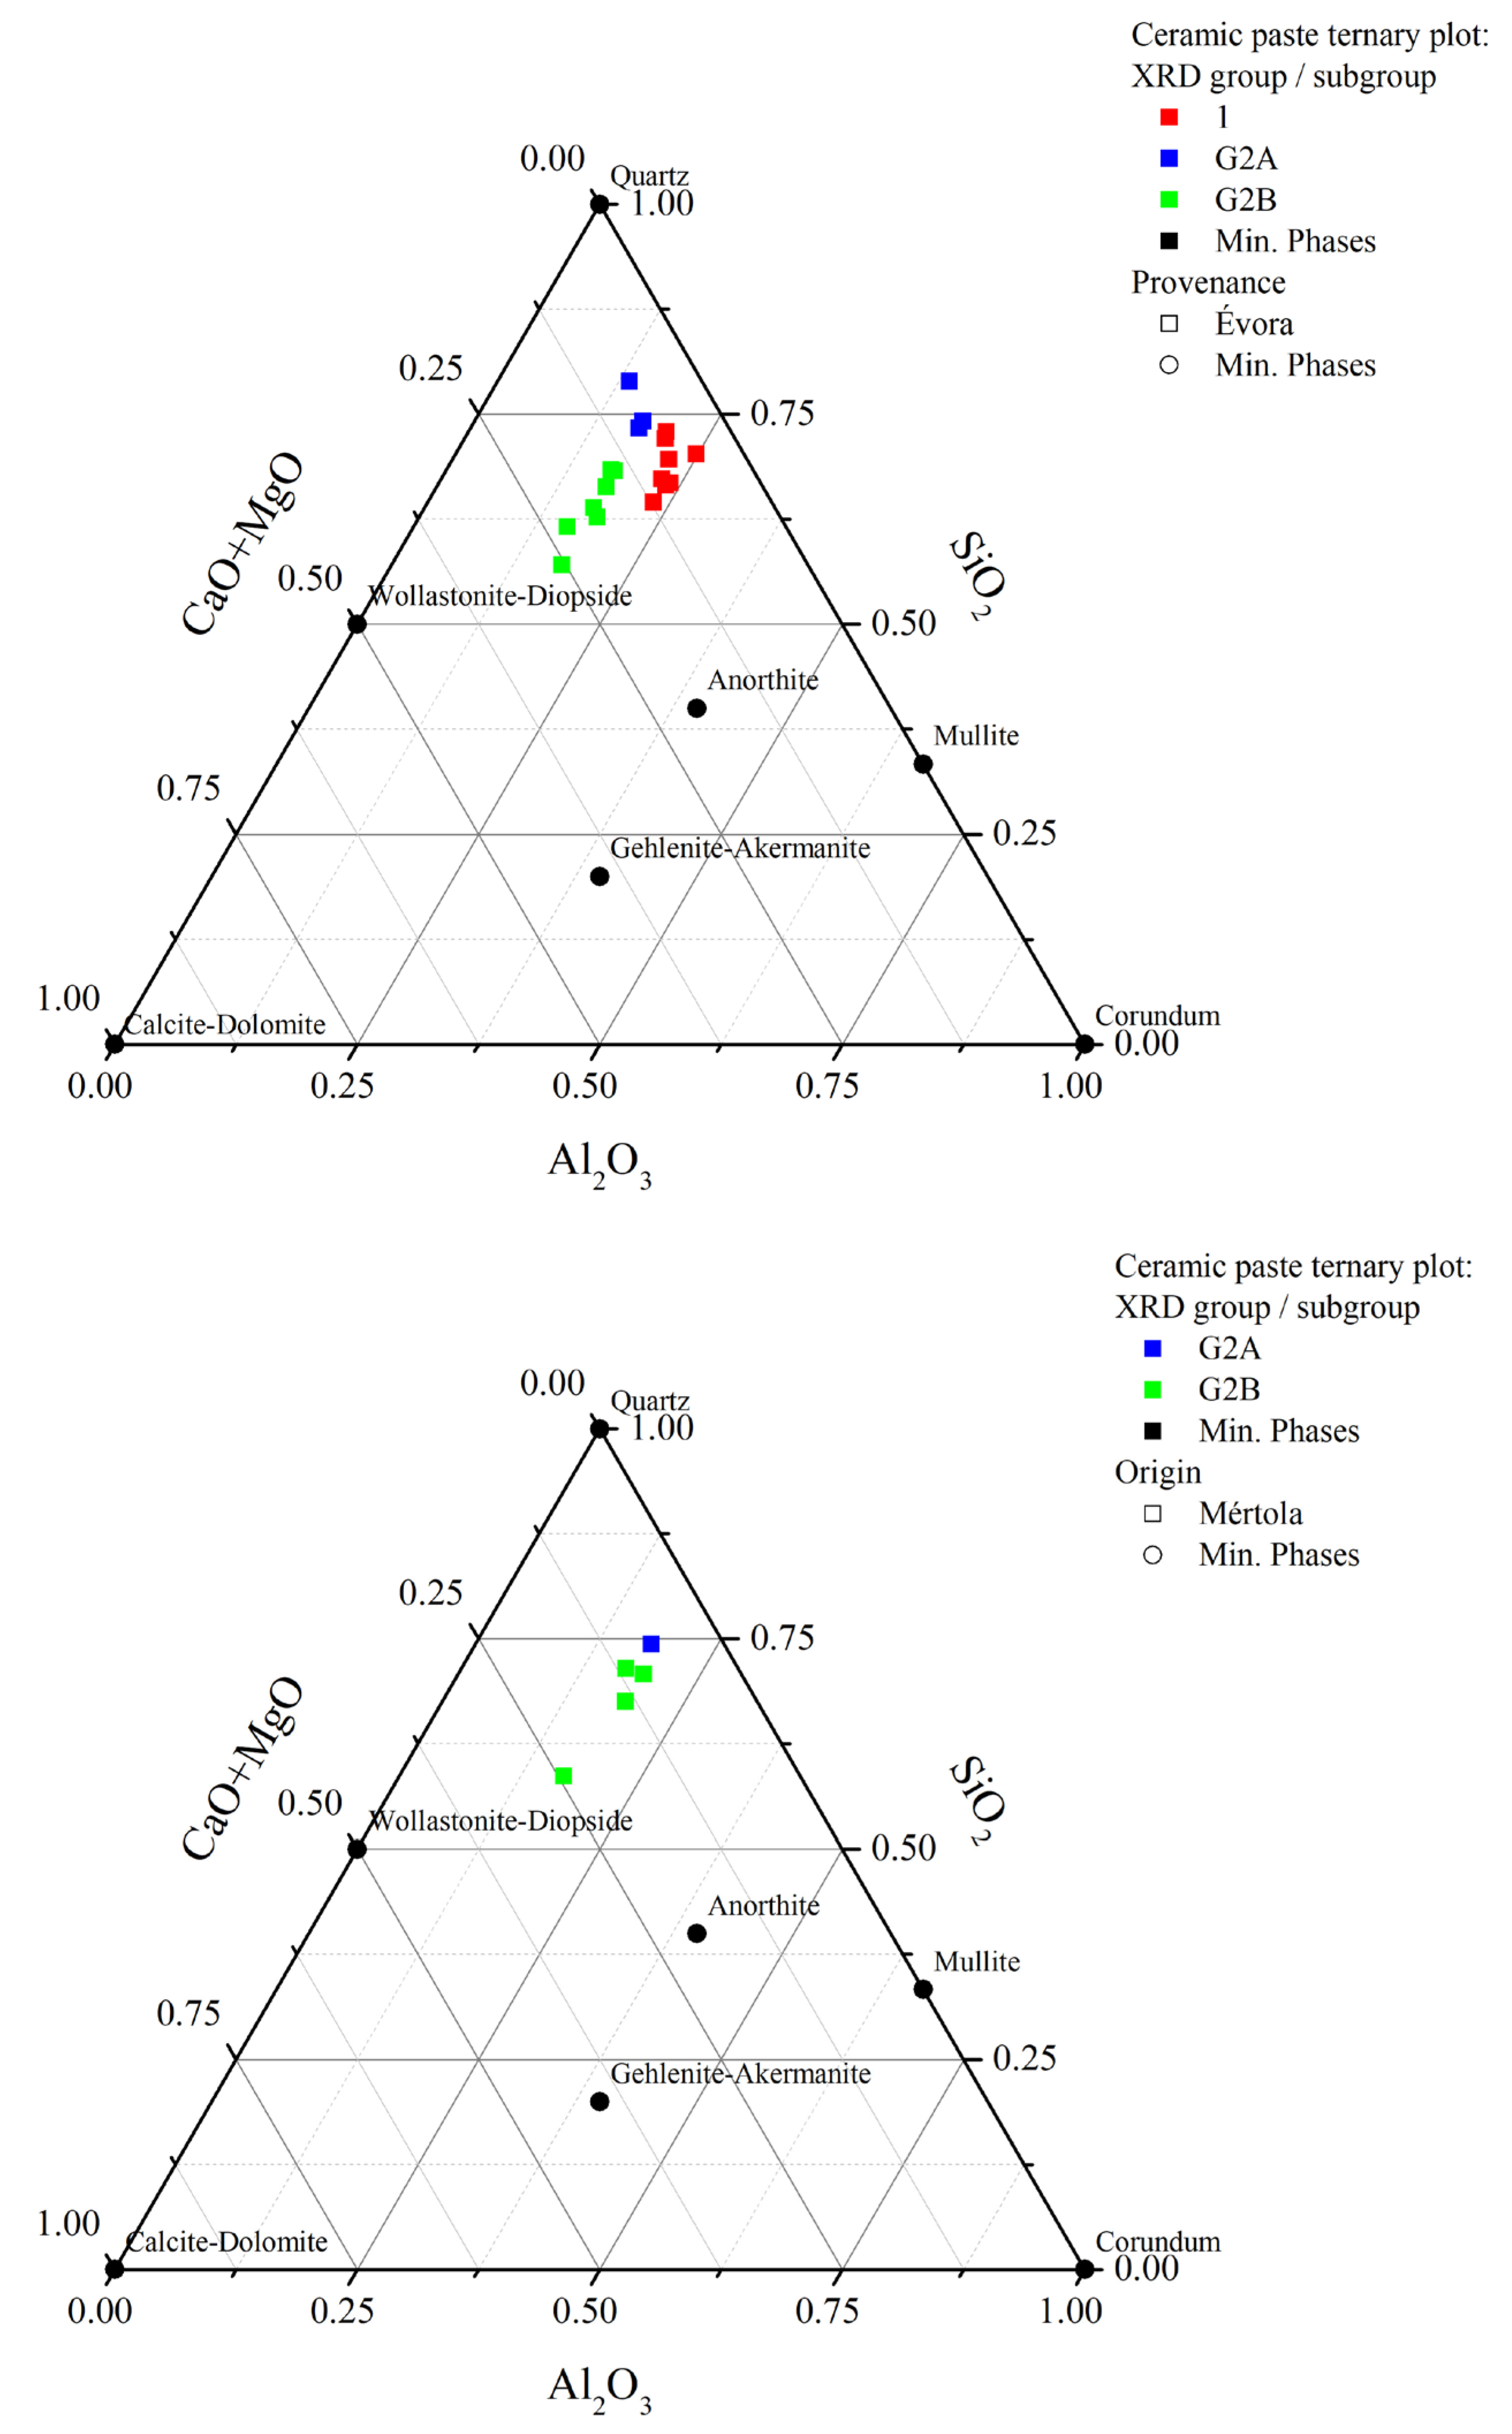
4.2. X-ray Diffraction (XRD)

XRD was employed to evaluate samples’ thermal history and understand the firing technology applied. Results are presented in Table 2 and, based on sample characteristics, specimens were included in different XRD groups.
In group 1 (G1), coarse wares from PF1 were included. Quartz, feldspars (i.e., plagioclase and potassium-rich), and amphibole mineralogical phases were the most significant on XRD patterns. Secondary mineralogical phases included pyroxene, biotite, illite/muscovite, calcite, hematite, and smectite. Illite/muscovite was identified in all cases, indicating that the maximum firing temperature was below 950 °C [46,47,48,49,54]. The only exceptions were samples EVR 8 and 9. In the first case, the presence of smectite clay minerals was determined, pointing out that the maximum firing temperature was below 600 °C [55]. In the second case (i.e., tripod, EVR 9), illite/muscovite was not detected. Considering the object function (i.e., kiln tool—tripod), it was probably subjected to multiple firing cycles. So, for the G1 sample, the firing temperature range can be established between 500 and 950 °C.
In group 2 (G2) PF2, 3, 4, 5, and 6 glazed samples were included. Based on the identification of newly developed high-temperature mineralogical phases, G2 was divided into two different subgroups, G2A and G2B. PF2 samples could be included in the G2A or G2B subgroup, suggesting that the exploited raw material was probably heterogeneous. Similar observations were carried out in the OM section.
In G2A samples, major mineralogical phases are quartz, plagioclase feldspars, potassium-rich feldspar, illite/muscovite, and hematite. Illite/muscovite (i.e., dehydroxylation that normally occurs above 950 °C), was not identified in all samples. So, considering the identification of hematite (i.e., normal nucleate from 750 °C onward), the firing temperature range for G2A samples can be established between 750 °C and 1000 °C [47,49].
In the case of G2B samples, high-temperature calcium-rich mineralogical phases nucleated because of carbonate and clay mineral decomposition and recombination [32,46,47,48,49,50]. Among them, pyroxenes (i.e., probably diopside) and melilites (i.e., probably akermanite) were identified. In addition, calcium-rich plagioclase (i.e., anorthite) were also nucleated. Additionally, the low amount of temper observed in most samples (i.e., during OM analysis) does not justify calcium-rich plagioclase abundance on XRD patterns. Quartz was always detected as a major component in addition to calcite, hematite, and analcime.
Considering the identification of illite/muscovite in some samples (i.e., dehydroxylation normally occurs above 950 °C) and the development of calcium-rich mineralogical phases during firing [32,46,47,48,49,50,54,56], the firing temperature range of the G2B subgroup can be settled between 950 and 1100 °C.

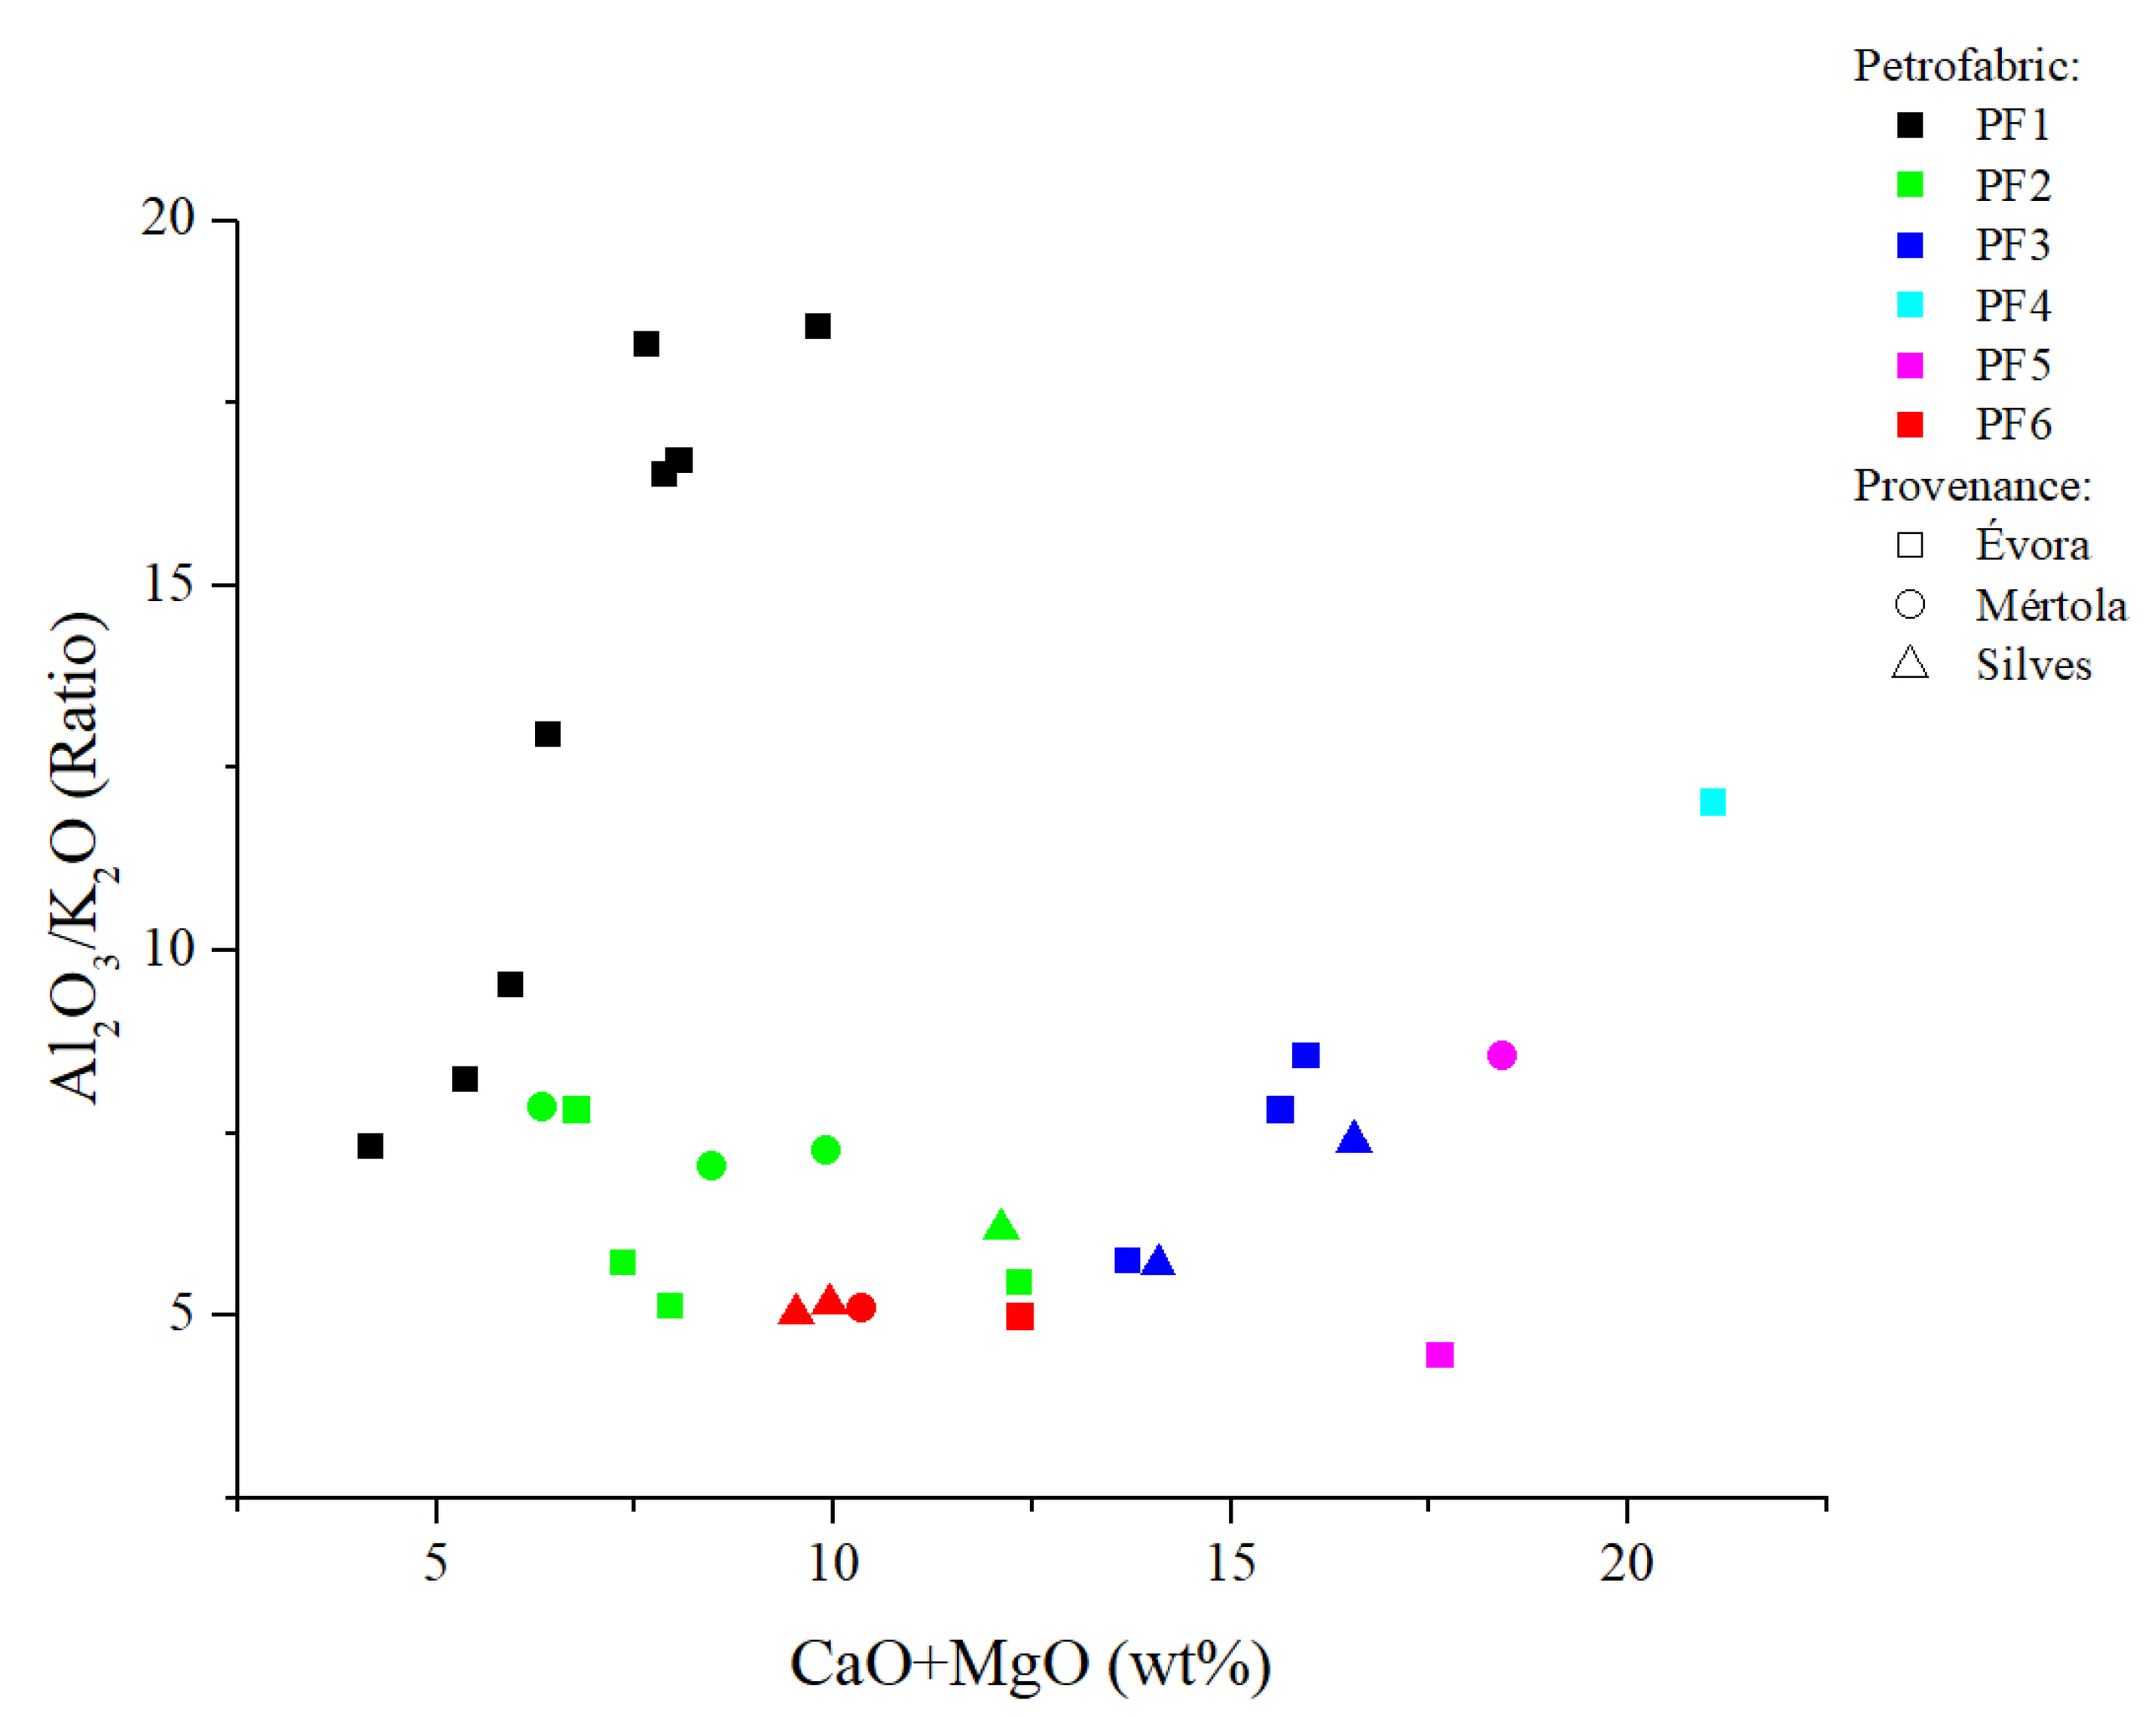
4.3. X-ray Fluorescence (XRF)

The complete XRF dataset can be found in a separate data file attached to this article.
On the ternary plot presented in Figure 7 and Figure 8 [50], specimens are distributed as a function of (CaO + MgO) − Al2O3 − SiO2 abundance, and the mineralogical phases that should crystalize in the ceramic paste, when the piece is fired at a maximum of 1100 °C under oxidizing conditions, are highlighted.
Therefore, samples with high alumina (Al2O3) and silica (SiO2) content should be plotted inside the quartz–anorthite–mullite area. On the other hand, when the carbonate component is high (CaO + MgO), samples should be plotted inside the quartz–anorthite–wollastonite/diopside space or in the anorthite/wollastonite/diopside–gehlenite/akermanite space. In our case, the ternary plots presented in Figure 7 and Figure 8 confirmed XRD observations, sample characteristics, and sample thermal history. Samples included G1 and G2A subgroup plots in the carbonate-poor area. Conversely, G2B subgroup plots in the carbonate-rich area and calcium/magnesium-rich high-temperature mineralogical phases crystallized, as evidenced by the combination of OM and XRD results.
Regarding PF chemical composition, the binary plots presented in Figure 9 and Figure 10 support optical microscopy observations. The Na2O/CaO vs. CaO binary plot (Figure 9, top) highlights a specific characteristic of PF1 samples. After OM observation, plagioclase feldspars were clearly identified as clast or associated with mafic/felsic plutonic rock fragments. The ratio evidenced on the “y” axis is a representation of the CaO abundance inside plagioclase feldspars and indicates a clear difference from the other samples. Additionally, the anorthite component inside PF1 plagioclase feldspar is higher compared to PF2 to PF6 samples and indicates a difference in the raw material exploited for ceramic production. The SiO2 vs. CaO binary plot (Figure 9, bottom) shows that samples’ silica and carbonate components are also important variables. CaO concentration constantly increases from PF2 to PF5, while SiO2 concentration decreases accordingly. PF2 and PF3 can be clearly distinguished based on CaO content, confirming OM and XRD observations. PF4 and PF5 have a concentration of CaO higher than 15 wt%, and calcite, secondary calcite (recrystallized after firing), limestone fragments, and bioclasts were usually identified during OM observation, indicating the exploitation of carbonate-rich raw materials. The same plot also partly distinguishes PF6. But what really characterizes PF6 samples is the Al2O3/K2O ratio (Figure 10). Additionally, the ratio is low. So, PF6 samples are particularly enriched in K2O-bearing mineralogical phases, such as muscovite and potassium-rich feldspars, as evidenced during OM analyses.

4.4. Micro-Structural and Chemical Analysis of Glazed Decorations by SEM-EDS

SEM-EDS was utilized to characterize glazed decoration from a microstructural and chemical point of view. Specifically, the glaze chemical composition, the firing technology applied (i.e., single vs. double firing technique), the glaze application technique (i.e., raw lead–silica mixture and/or frit), and black/brown decorations were evaluated [1,5,8,10,12,52,53,57,58,59]. The full table with the glaze chemical composition of each sample is included in a separate data file annexed to the manuscript.

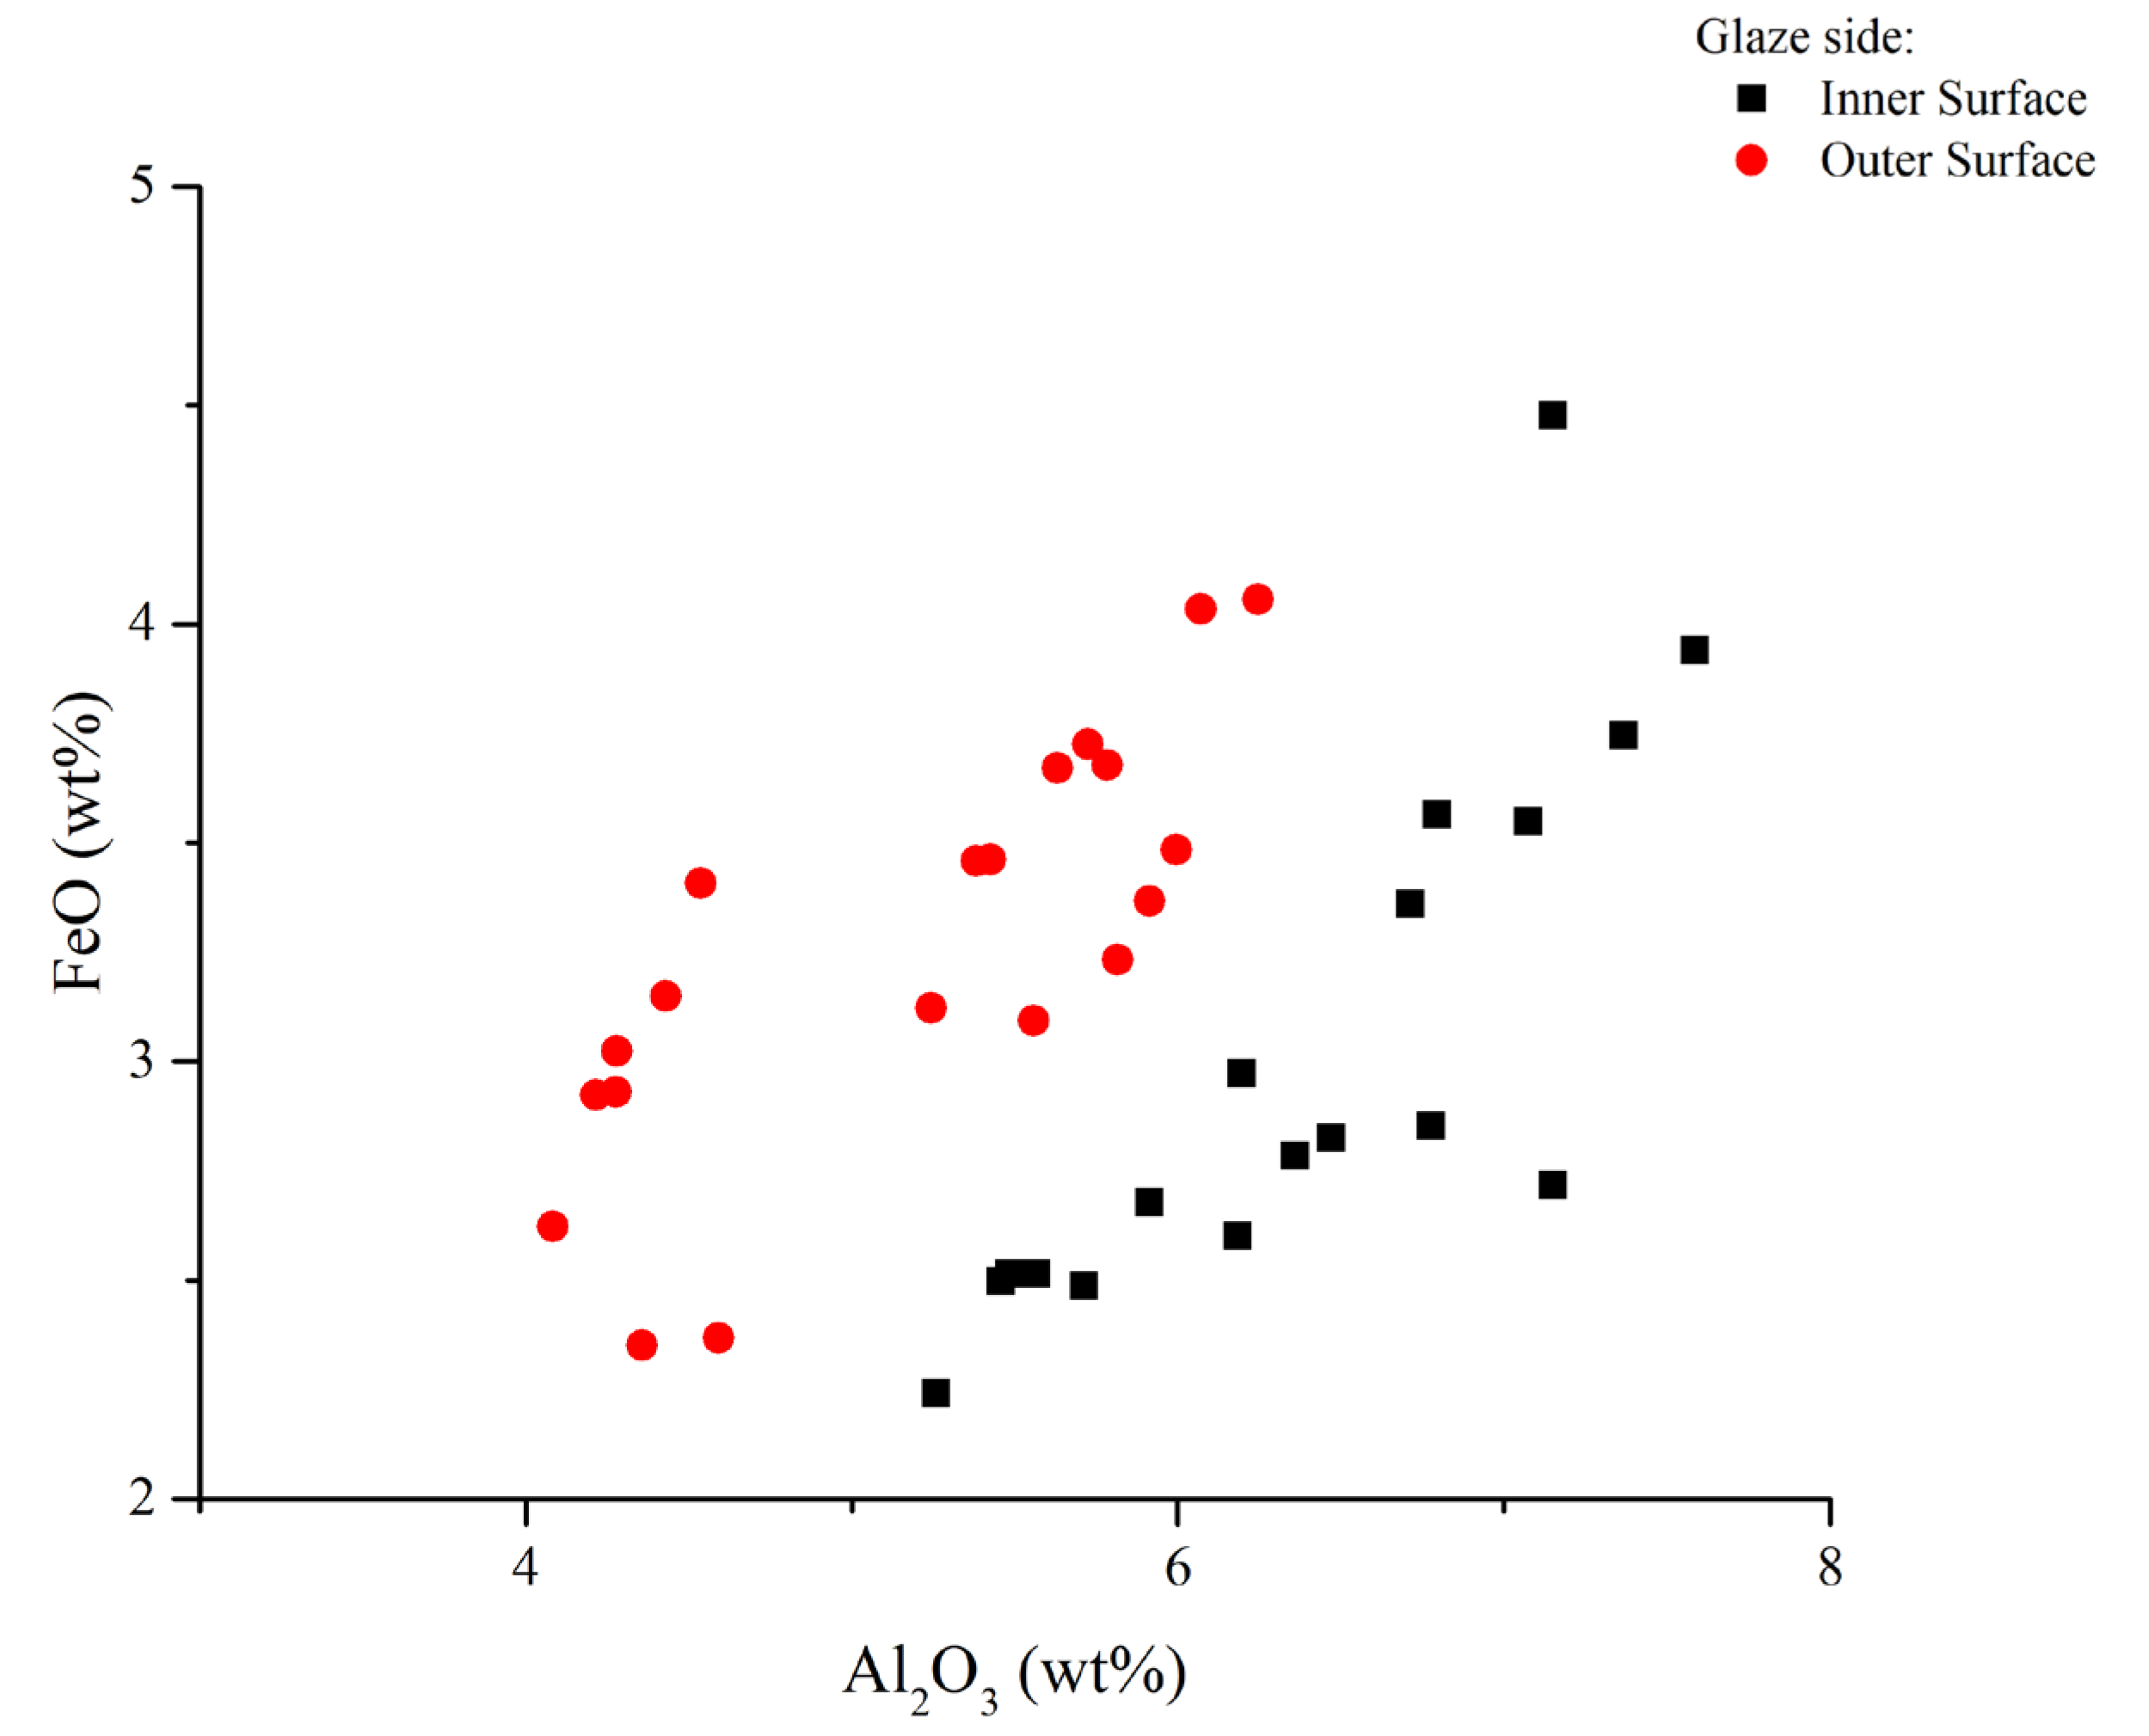
4.4.1. Micro-Structural and Chemical Characteristics of the Inner and Outer Glazes

In each sample, the glaze appeared honey in color, even, and homogeneous on both sides (i.e., inner and outer), with a very limited/absent alteration of the surface. As a result, the glaze’s chemical composition could be evaluated accurately. Air bubbles were rarely observed. This indicates that the glaze’s viscosity was sufficiently low to allow gas bubbles, formed in the glaze due to the decomposition of constituents, to be released without leaving depressions or pinholes on the surface. Also, vertical fissures were rarely observed.
SEM-EDS evidenced the production of high lead–silica glazes, but alkali (Na2O+K2O) concentration could vary (Figure 11, Table 3). PbO was the main fluxing agent in all cases, as evidenced by the low SiO2/PbO ratio, and alkali content was also generally low (Na2O+K2O~3%) in most samples. However, three samples (EVR 12, 17, and MER 24) are more enriched in alkalis (Na2O+K2O > 3%) than the rest of the samples. This could happen in any of the pottery fabrics identified, suggesting that different solutions could be employed in the same place. So, in these cases, an additional fluxing agent was probably added to the glaze mixture (i.e., suggesting the application of a different technology) or, alternatively, sand impurities played an important role in the final concentration of alkalis in these samples [13].
SEM-EDS also evidenced another technological difference between the inner and outer glazes. The SiO2/PbO ratio is always higher on the inner surface of the analyzed samples compared to the outer sides (Table 3). Moreover, as evidenced in Figure 12, the outer and inner glazed surfaces of the samples always show a different FeO, Al2O3, and SiO2 concentration which, in turn, affected the final glaze’s color and viscosity (explained below). This behavior is rather uniform regardless of sample typology, pottery fabrics, glaze types (i.e., monochrome—bichrome), and chronology. In particular, the inner glazed surfaces always show higher Al2O3 and SiO2 concentration. On the contrary, in the outer glazed surfaces, the concentration of FeO is higher.
Normally, during firing and glaze adhesion, chemicals from the ceramic paste migrate to the glaze and vice versa [53], and if the ceramic piece is uniform (uniformly made using the same raw material), a similar pattern should be found on both sides. Moreover, considering the concentration of FeO and Al2O3 in the analyzed glazes (Figure 12, top) a simple interaction between the glaze and the ceramic paste during firing does not justify their abundance in the glaze. So, it highlights a specific technological choice of Islamic ceramists, with the addition of two different components to the glaze mixture. The first one is more enriched in FeO, and the second one is more enriched in Al2O3 and SiO2. In both cases, these components were probably two different types of clay.
In the first case, the preferential addition of FeO influenced the glaze color [11], which normally becomes yellow/honey under oxidizing conditions. In the second case, the preferential addition of Al2O3 and SiO2 has significant consequences on the glaze viscosity [5]. Thus, indirectly, the modification of the glaze viscosity by the ceramist was conscious. In the case of inner glazes, the viscosity was higher probably to avoid the accumulation of the glaze in concave sections of the piece. On the contrary, on the outer side, it was lower, to favor a uniform dispersion of the glaze over the piece (Figure 12, bottom). Nevertheless, considering the glaze appearance in all cases, the viscosity was sufficiently high to prevent the glaze from running off the body.

4.4.2. Firing Technology (Single vs. Double Firing)

Glaze softening and adhesion to the ceramic body determine the formation of a ceramic body–glaze interface. Thus, during firing at the interface, new crystallites may nucleate as a result of a diffusion of chemical elements from the ceramic body to the glaze (i.e., and from the glaze to the ceramic body) and recombination [53]. Moreover, interface thickness changes as a function of the firing technology applied. When the glaze is applied over an unfired ceramic body (i.e., single firing), the interaction (i.e., chemical elements diffusion) is stronger, many crystallites nucleate, the interface is thick, and many newly formed crystals can be present throughout the glaze thickness. Otherwise, when the glaze is applied over a biscuit-fired ceramic body (i.e., double firing), the interface is thinner, and few crystallites nucleate at the interface. So, the interface is normally much thinner.
On the analyzed samples, glazes appeared homogeneous in all cases, and few crystallites were observed inside (i.e., floating) the glaze. Most of them are concentrated in a limited ceramic body–glaze interface (i.e., roughly 30 µm maximum). They generally appear as acicular crystals, which directly develop at the interface, and they subsequently start to fluctuate inside the glaze. Based on the analysis of elemental mapping distribution, they can be classified as lead-rich feldspars and pyroxenes that are usually enriched in potassium and calcium, respectively (Figure 13).

4.4.3. Glaze Application Technique

The glaze application technique was determined following the scheme proposed by [52]. It consists of the analysis of several areas of the ceramic paste and the glaze by SEM-EDS. After that, PbO content from the chemical composition of both paste and glaze is removed. Afterward, the resulting new values are recast to 100%. With the application of this method, the ceramic paste and glaze chemical compositions should match if the lead ore was applied by itself on the surface of the ceramic body. Otherwise, a lead–silica mixture, either in a raw state or frits, was applied to the ceramic body.
Recalculated values from ceramic pastes and glazes (i.e., inner/outer) indicate that in the entire sample collection, the glaze was applied using frits. This statement was positively tested by the comparison of Al2O3 and SiO2 from the ceramic pastes and glazes (Figure 14 and Figure 15). This is coherent with the absence of not melted quartz grains inside the glaze (i.e., excluding newly formed crystallites). The existing archaeological and archaeometric data support this interpretation. Additionally, this technological option was widely adopted since the beginning of glazed ceramic production throughout the Iberian Peninsula (i.e., Pechina and San Nicolás) during the Islamic period [1,3,10,13,57].
Moreover, this approach also supports the observations developed in Section 4.4.1, indicating that Al2O3 and SiO2 concentration inside glazes is not the result of diffusion from the ceramic paste but a separate addition to the glaze mixture.

4.4.4. Micro-Structural and Chemical Characteristics of Black/Brown Glazed Decorations

Black/brown decorations were analyzed on twelve samples in total (Table 1). The chemical composition of glazes is reported in a separate data file annexed to the manuscript. In black/brown glazes, the main coloring agents were FeO and/or MnO. Glazes could appear homogenous (eight out of twelve samples), and the pigment was completely dissolved into the glaze or heterogeneous (samples EVR 2, EVR 11, SIL 25, SIL 26), and many crystallites could be identified in the glaze (Figure 16A,B). The production of homogeneous or heterogenous black/brown glazes can be influenced by different factors, such as the temperature reached inside the kiln during firing and the amount of the added pigment. Generally, the more pigment that is added, the more precipitation of crystallites is favored [8,12,58,59].
In all cases, the pigment was applied to overglaze (i.e., on top of the raw glaze) mixing coloring agents with some frit prior to the second firing [8]. This is particularly evident in black/brown decorated samples enriched in newly formed crystallites (Figure 16B). Additionally, the development of new crystalline phases is observed in the upper glaze surface to the interface proximity. On homogeneous glazes, the pigment is completely dissolved, but a small gradient in the coloring agent concentration (i.e., from the top to the bottom) was detected, indicating the same application method.
The chemical composition of clean (i.e., without any crystallite when present) black/brown decorated areas on homogeneous and heterogeneous glazes determined the variable contribution of FeO (1–10%) and MnO (1–3%), indicating that different pigments could be mixed together and applied. Nevertheless, on homogeneous glazes, considering that the decoration was applied over a honey-colored glaze and the addition of a different component to the glaze mixture has been assessed (see Section 4.4.1 and Section 4.4.3), it is not possible to determine to what extent FeO-rich raw material was utilized as a pigment. In any case, it is possible to affirm that a MnO-rich raw material was surely added to the decoration, as it was never detected on the honey glaze (see Section 4.4.1).
On the contrary, on heterogeneous glazes, it was possible to indicate what kind of pigment was employed in black decorations. In specimen EVR 2, spot analyses (Table 4) and elemental mapping distribution (Figure 17A,C) evidenced that inclusions are MnO-rich. Considering the low particle contrast on the BSE image and the elevated concentration of MnO compared to PbO and SiO2 in the microanalysis results, crystallites can be classified as braunite (Mn2+Mn3+6SiO12) [12,58,59]. Thus, pyrolusite (MnO2) was probably the original pigment employed.
In specimen EVR 11, MnO was not detected during area analyses, spot analyses (Table 4), or elemental mapping distribution (Figure 17B,D). Considering the low contrast of particles on the BSE image and the chemical composition obtained by spot analyses (i.e., the inclusion is extremely rich in FeO and poor in PbO), they cannot be classified as melanotekite (Pb2Fe2Si2O9) and they are most probably hematite (Fe2O3) crystals [58].
Conversely, regarding the previous samples, the black/brown decorations of samples SIL 25 and SIL 26 showed different characteristics. In both cases, MnO and FeO were always detected by elemental mapping distribution, area, and spot analyses (Figure 18). Nevertheless, FeO is usually more represented, suggesting that the pigment was mainly enriched in this oxide.
On specimen SIL 25, MnO and FeO are mostly dissolved in the glaze, but two different kinds of crystallites have been analyzed by SEM-EDS. The first one (Figure 18A, spot 2) probably represents the raw material employed in the decoration, and it was applied on the glaze surface. The high concentration of SiO2 and other oxides suggests it was a non-digested inclusion of clayey raw materials enriched in MnO (1.71 wt%) and FeO (11.88 wt%). The second one, considering the high concentration of FeO (80 wt%), is most probably a hematite crystal (Fe2O3) (Figure 18A, spot 1).
In specimen SIL 26, a large amount of pigment was applied on the glaze surface, and different crystallites precipitated in the glaze (Figure 18B,D). Some of them (Figure 18B, spot 2) are FeO-rich (80 wt%) and can be classified as hematite crystals (Fe2O3).
In addition to hematite crystals, SEM-EDS also identified two more different crystallites, which generally show different contrasts in BSE pictures. In the first one (Figure 18B, spot 1), FeO (44.68 wt%) is more represented than MnO (15.63 wt%). So, based on chemical contrast (i.e., low) and composition, these inclusions are probably iron and manganese oxides, and they can possibly be classified as jacobsite (MnFe2O4). This inclusion type is generally crystallized during firing by the combination of manganese- and iron-rich raw materials [12].
The second inclusion identified in the decoration (Figure 18B, spot 3) shows high contrast on the BSE picture. Thus, PbO was surely included in the internal crystallite structure. Considering the crystallite chemical composition (Table 4), this mineral can probably be included in the solid solution, which normally includes melanotekite (Pb2Fe2Si2O9) and kentrolite (Pb2Mn2Si2O9) [12,15].

5. Conclusions

This study analyzed 28 ceramic samples in total (unglazed and glazed) with a chronology ranging between the 10th and the mid-13th centuries AD. Over this time, glazed ceramic production was increasingly widespread across the Gharb, and many cities were producers and receptors of goods across the al-Andalus [23].
Historical sources highlight the strategic position of different cities in the Islamic world. In the Alentejo region, Évora was an important by-land trading crossroad to demanding market hubs such as Lisbon and Alcácer do Sal [60]. Similarly, Mértola and Silves in the Algarve region depicted crucial riverine and sea staging points for overland and overseas trading, respectively [22,40]. In light of this historical background, the present study attempts to give more insight into the dynamic trading network within the Gharb through the production and distribution of glazed ceramics.
The results of the archaeometric study determined the local supply of coarse wares from the city of Évora. In addition, the same city acted as an internal marketplace for imported regional production of glazed wares from Mértola and Silves, as well as extra-regional products from out of the borders of the Gharb al-Andalus.
The glazed ceramic collection includes two of the most popular glazed ceramic styles (monochrome and bichrome) throughout the al-Andalus. The production and diffusion of these glazed wares constantly increased from the 10th century AD onwards across the Gharb, highlighting the short-distance trade contacts already documented on different historical sources and archaeological evidence [15,16,17,18,19,23,24].
The identification of exogenous objects figured out in the present study also sheds light on the long-distance trade network between the Islamic heartland in the al-Andalus and the Gharb [17,23]. On the other hand, the number of coarse-manufactured kitchen and tablewares examined draws attention to an internal market in the city of Évora supplied by local workshops that despite the negative evidence, might have produced its own glazed ceramics, as evidenced by the recovery of a tripod stand with glaze traces on top [61].
The glazing technology was also assessed, and it testified the technological level of Islamic ceramists during the given period in the Gharb. Results evidenced the application of the same technology in all cases. Only a few exceptions were registered, indicating that different technological solutions could be employed independently from sample provenance. Moreover, the addition of different components to the original glaze mixture was established to modify glaze viscosity and color. This behavior was rather uniform across time and space. This shows the high level of expertise of Islamic ceramists in the al-Andalus and the uniformity of the glaze technology applied in different places.
FeO- and/or MnO-rich pigments were employed to obtain black/brown decoration. These elements usually dissolved during the firing process but, when added in great quantities to render black/brown colors many crystallites can precipitate in the glaze. Only in two cases, FeO and MnO rich pigments were added simultaneously. In any case, black-brown decoration analysis also points to the application of homogeneous technology in pigment application independent of ceramic provenance. When a different solution was employed, it was probably a deliberate choice of the ceramist.
To conclude, this study evidenced how the high-lead glazed ceramic production was uniform throughout the al-Andalus, and small variabilities in the ceramic and glaze technology can be interpreted as the great expertise of Islamic potters to manage a wide array of raw materials. This was the case of honey and black-decorated honey glazes, two of the most diffused and consumed glazed wares during the 10th and the mid-13th centuries AD in the Iberian Peninsula. Arguably, the demanding market encouraged workshops to look for faster and more reliable methods and raw materials to produce glazed ceramics in the desirable and required color appearance. Therefore, the Islamic glazing tradition would change into a more industrialized and simplified production by the end of the 13th onwards in what was renowned as the Hispano–Moresque or Mudejar tradition [10].

Supplementary Materials

The following supporting information can be downloaded at: https://www.mdpi.com/article/10.3390/ceramics6040135/s1. Table S1: Temper characteristics of each ceramic sample; Table S2: Petrographyc description of samples ceramic paste, temper, and porosity; Table S3: Chemical composition of samples ceramic pastes; Table S4: Chemical composition of the outer glazed surfaces; Table S5: Chemical composition of the inner glazed surfaces; Table S6: Chemical composition of samples black/brown glazes; Table S7: Chemical composition of samples ceramic paste obtained by SEM-EDS.

Author Contributions

Conceptualization, M.B. and C.A.C.; methodology, M.B. and C.A.C.; validation, M.B., C.A.C. and J.A.P.M.; formal analysis, M.B., C.A.C., J.A.P.M., S.G.M. and M.J.G.; investigation, M.B., C.A.C., J.A.P.M., S.G.M. and M.J.G.; resources, M.B., C.A.C., J.A.P.M., S.G.M. and M.J.G.; data curation, M.B., C.A.C. and J.A.P.M.; writing—original draft preparation, M.B., C.A.C., J.A.P.M., S.G.M. and M.J.G.; writing—review and editing, M.B., C.A.C., J.A.P.M., S.G.M. and M.J.G.; visualization, M.B.; supervision, M.B., J.A.P.M. and S.G.M.; project administration, M.B., J.A.P.M. and S.G.M.; funding acquisition, J.A.P.M. All authors have read and agreed to the published version of the manuscript.

Funding

The research was funded by the HERCULES Laboratory (grants number: UIDB/04449/2020 and UIDP/04449/2020).

Institutional Review Board Statement

Not applicable.

Informed Consent Statement

Not applicable.

Acknowledgments

The corresponding author wishes to acknowledge the HERCULES Laboratory funded by the “Fundação para Ciência e Tecnologia” (project codes UIDB/04449/2020 and UIDP/04449/2020) and the China-Portugal Joint Laboratory of Cultural Heritage Conservation Science supported by the Belt and Road Initiative—National Key R&D Program of China (2021YFE0200100).

Conflicts of Interest

The author declare no conflict of interest.

References

  1. Salinas, E.; Pradell, T.; Molera, J. Glaze production at early Islamic workshop in al-Andalus. Archaeol. Anthropol. Sci. 2018, 11, 2201–2213. [Google Scholar] [CrossRef]
  2. Salinas, E.; Pradell, T. The introduction of the glaze in al-Andalus: Technological waves and Oriental influences. Libyan Stud. 2020, 51, 87–98. [Google Scholar] [CrossRef]
  3. Salinas, E.; Pradell, T. The first glaze production centres in al-Andalus (late 9th early 10th centuries): Pechina, Cordoba and Malaga. In Proceedings of the Tecnología de los Vidriados en el Oeste Mediterráneo: Tradiciones Islámicas y Cristianas, Valencia, Spain, 25 January 2018; Coll Conesa, J., Salinas, E., Eds.; Ministerio de Cultura y Deporte: Madrid, Spain, 2021; pp. 49–60. [Google Scholar]
  4. Almodóvar, G.R.; Yesares, L.; Sáez, R.; Toscano, M.; González, F.; Pons, J.M. Massive sulfide ores in the Iberian Pyrite Belt: Mineralogical and textural evolution. Minerals 2019, 9, 653. [Google Scholar] [CrossRef]
  5. Tite, M.S.; Freestone, I.; Mason, R.; Molera, J.; Vendrell-Saz, M.; Wood, N. Lead glazes in antiquity. Methods Prod. Reason. Use. Archaeom. 1998, 40, 241–260. [Google Scholar] [CrossRef]
  6. Molera, J.; García-Vallés, M.; Pradell, T.; Vendrell-Saz, M. Hispano-Moresque pottery production of the fourteenth-century workshop of Testar del Molí (Paterna, Spain). Archaeometry 1996, 38, 67–80. [Google Scholar] [CrossRef]
  7. Quinn, P.S. Ceramic Petrography: The Interpretation of Archaeological Pottery & Related Artefacts in Thin Section, 1st ed.; Archaeopress: Oxford, UK, 2013; ISBN 978-1-905739-59-2. [Google Scholar]
  8. Pradell, T.; Molera, J. Ceramic technology. How to characterize ceramic glazes. Archaeol. Anthropol. Sci. 2020, 12, 189. [Google Scholar] [CrossRef]
  9. Beltrame, M.; Sitzia, F.; Liberato, M.; Santos, H.; Themudo, F.; Columbu, S.; Mirão, J. Comparative pottery technology between the Middle Ages and Modern times (Santarém, Portugal). Archaeol. Anthropol. Sci. 2020, 12, 130. [Google Scholar] [CrossRef]
  10. Molera, J.; Pradell, T.; Merino, L.; García-Vallés, M.; García-Orellana, J.; Salvadó, N.; Vendrell-Saz, M. La tecnología de la cerámica Islámica y Mudéjar. Caesaraugusta 1997, 73, 15–41. [Google Scholar]
  11. Molera, J.; Vendrell-Saz, M.; García-Vallés, M. Technology and colour development of Hispano-Moresque lead-glazed pottery. Archaeometry 1997, 39, 23–39. [Google Scholar] [CrossRef]
  12. Molera, J.; Coll, J.; Labrador, A.; Pradell, T. Manganese brown decorations in 10th to 18th century Spanish tin glazed ceramics. Appl. Clay Sci. 2013, 82, 86–90. [Google Scholar] [CrossRef]
  13. Molera, J.; Carvajal, J.C.; Molina, G.; Pradell, T. Glazes, colourants and decorations in early Islamic glazed ceramics from the Vega of Granada (9th to 12th centuries CE). J. Archaeol. Sci. Rep. 2017, 21, 1141–1151. [Google Scholar] [CrossRef]
  14. Salinas, E.; Zozaya, J. Pechina: El antecedente de las cerámicas vidriadas Islámicas en el al-Andalus. In Proceedings of the X Congresso Internacional a Cerâmica Medieval no Mediterrâneo, Silves-Mértola, Portugal, 22–27 October 2012; Gonçalves, M.J., Gómez-Martínez, S., Eds.; Câmara Municipal de Silves & Campo Arqueológico de Mértola: Silves/Mértola, Portugal, 2015; pp. 573–576. [Google Scholar]
  15. Gómez, S. La cerámica en al-Andalus: Producción y comercio. In Economía y Trabajo: Las Bases Materiales de la Vida en al-Andalus; Delgado, M.M., Pérez-Aguilar, L., Eds.; Ediciones Alfar: Seville, Spain, 2019; pp. 199–234. ISBN 978-84-7898-839-6. [Google Scholar]
  16. Gómez, S.; Gonçalves, M.J.; Inácio, I.; dos Santos, C.; Coelho, C.; Liberato, M.; Gomes, A.S.; Bugalhão, J.; Catarino, H.; Cavaco, S.; et al. A cidade e o seu território no Gharb al-Andalus através da cerâmica. In Proceedings of the X Congresso Internacional a Cerâmica Medieval no Mediterrâneo, Silves-Mértola, Portugal, 22–27 October 2012; Gonçalves, M.J., Gómez-Martínez, S., Eds.; Câmara Municipal de Silves & Campo Arqueológico de Mértola: Silves/Mértola, Portugal, 2015; pp. 19–50. [Google Scholar]
  17. Gómez, S.; Cavaco, S.; Coelho, C.; Covanerio, J.; Fernandes, I.C.; Gomes, A.S.; Gonçalves, M.J.; Linácio, I.; Liberato, M.; Lopes, G.; et al. El uso del vidriado en el Garb al-Ándalus y su lenta difusión. In Proceedings of the Tecnología de los Vidriados en el Oeste Mediterráneo: Tradiciones Islámicas y Cristianas, Valencia, Spain, 25 January 2018; Coll Conesa, J., Salinas, E., Eds.; Ministerio de Cultura y Deporte: Madrid, Spain, 2021; pp. 129–152. [Google Scholar]
  18. Bugalhão, J.; Sousa, M.; Gomes, A. Vestígios de produção oleira islâmica no Mandarim Chinês, Lisboa. Rev. Port. Arqueol. 2004, 7, 575–643. Available online: https://dialnet.unirioja.es/servlet/articulo?codigo=1039244 (accessed on 27 February 2023).
  19. Dias, M.I.; Prudêncio, M.I.; Bugalhão, J.; Gomes, S.; Sousa, M.J.; Folgado, D. A produção de cerâmicas no arrabalde occidental de Lisboa islâmica. Primeros resultados arqueométricos. A Ocupação Islâmica da Península Ibérica. In Proceedings of the IV Congresso de Arqueologia Peninsular, Faro, Portugal,, 14–19 September 2004; Ferreira, N., Ed.; University of Algarve: Algarve, Portugal, 2008; pp. 157–167. [Google Scholar]
  20. Beltrame, M.; Liberato, M.; Mirão, J.; Santos, H.; Barrulas, P.; Branco, F.; Gonçalves, L.; Candeias, A.; Schiavon, N. Islamic and post Islamic ceramics from the town of Santarém (Portugal): The continuity of ceramic technology in a transforming society. J. Archaeol. Sci. Rep. 2019, 23, 910–928. [Google Scholar] [CrossRef]
  21. Beltrame, M.; Sitzia, F.; Arruda, A.M.; Barrulas, P.; Barata, F.T.; Mirão, J. The Islamic ceramic of the Santarém Alcaçova: Raw materials, technology, and trade. Archaeometry 2021, 63, 1157–1177. [Google Scholar] [CrossRef]
  22. Gómez, S. La Cerámica Islámica de Mértola: Producción y Comercio. Ph.D. Thesis, Complutense University of Madrid, Madrid, Spain, 2004. Available online: eprints.ucm.es/id/eprint/7087/ (accessed on 11 June 2021).
  23. Bridgman, R. Re-examining Almohad economies in south-western al-Andalus through petrological analysis of archaeological ceramics. In Revisiting Al-Andalus. Perspectives on the Material Culture of Islamic Iberia and Beyond, 1st ed.; Anderson, G.D., Rosser-Owen, M., Eds.; Brill: Leiden, The Netherlands, 2007; Volume 34, pp. 143–165. ISBN 978-90-04-16227-3. [Google Scholar]
  24. Coll Conesa, J.; Garcia Porras, A. Tipologia, cronologia e produzione dei forni per ceramica in al-Andalus. Fornaci. Tecnologie e produzione della ceramica in Età Medievale e Moderna. In Proceedings of the XLII Convegno Internazionale della Ceramica, Savona, Italy, 29–30 May 2009; Centro Ligure per la Storia della Ceramica: Firenze, Italia, 2010; pp. 25–44. [Google Scholar]
  25. Karagiannopoulou, M.; Mirão, J.A.P.; Beltrame, M.; Gonçalves, M.J. Islamic Almohad pottery from Silves, Portugal. In Proceedings of the 12th Congress AIECM on Medieval and Modern Period Mediterranean Ceramic, Athens, Greece, 21–27 October 2018; Petridis, P., Yangaki, A.G., Liaros, N., Bia, E.-E., Eds.; National Hellenistic Research Foundation: Athens, Greece, 2021; pp. 255–262. [Google Scholar]
  26. Ma, B.; Liu, L.; Feng, S.; Xu, Q.; Feng, X. Analyisis of the elemental composition of Tang Sancai from the four major kilns in China using EDXRF. Nucl. Instrum. Methods Phys. Res. Sect. B 2014, 319, 95–99. [Google Scholar] [CrossRef]
  27. Buravlev, I.Y.; Gelman, E.I.; Lapo, E.G.; Pimenov, V.A.; Martynenko, A.V. Three-colored Sancai glazed ceramics excavated from Bohai sites in Primorye (Russia). J. Archaeol. Sci. Rep. 2022, 41, 103346. [Google Scholar] [CrossRef]
  28. Moita, P.; Santo, J.F.; Francisco, M. Layered granitoids: Interaction between continental crust recycling processes and mantle-derived magmatism. Examples from the Évora Massif (Ossa-Morena Zone, southwest Iberia, Portugal). Lithos 2009, 111, 125–141. [Google Scholar] [CrossRef]
  29. Schermerhorn, L.J.G. An outline stratigraphy of the Iberian Pyrite Belt. Boletín Geológico E Min. España 1971, 82, 304–308. [Google Scholar]
  30. Oliveira, J.T.; Silva, J.B. Notícia Explicativa de Folha 46-D, Mértola; Instituto Nacional de Engenharia, Tecnologia e Inovação: Lisbon, Portugal, 2007. [Google Scholar]
  31. Fletcher, W.J. Holocene Landscape History of Southern Portugal. Ph.D. Thesis, University of Cambridge, Cambridge, UK, 2005. [Google Scholar] [CrossRef]
  32. Trindade, M.J.; Dias, M.I.; Coroado, J.; Rocha, F. Mineralogical transformation of calcareous rich clays with firing: A comparative study between calcite and dolomite rich clays from Algarve, Portugal. Appl. Clay Sci. 2009, 42, 345–355. [Google Scholar] [CrossRef]
  33. Trindade, M.J.; Rocha, F.; Dias, M.I.; Prudêncio, M.I. Mineralogy and grain-size distribution of clay-rich rock units of the Algarve basin (South Portugal). Clay Miner. 2013, 48, 59–83. [Google Scholar] [CrossRef]
  34. Trindade, M.J.; Dias, M.I.; Rocha, F.; Prudêncio, M.I.; Marques, R. Geochemistry of mudrock units from the Meso-Cenozoic Algarve Basin, Portugal. Geosci. J. 2018, 22, 733–749. [Google Scholar] [CrossRef]
  35. Bugalhão, J.; Catarino, H.; Cavaco, S.; Covaneiro, J.; Fernandes, I.C.; Gomes, A.; Gómez, S.; Gonçalves, M.; Grangé, M.; Inácio, I.; et al. CIGA: Projecto de sistematização para a cerãmica islãmica do Gharb al-Ândalus. XELB 2010, 10, 455–476. Available online: https://hdl.handle.net/10400.26/6580 (accessed on 15 February 2021).
  36. Cavaco, S.; Covaneiro, J.; Fernandes, I.; Gómez, S.; Gonçalves, M.J.; Grangé, M.; Inácio, I.; Lopes, G.; Santos, C.; Bugalhão, J.; et al. Contextos sócio-territoriais de distribuição. In O Arqueólogo Português, 1st ed.; Museu Nacional de Arqueologia, Ed.; Imprensa Nacional-Casa da Moeda: Lisbon, Portugal, 2013; Volume 3(V), pp. 349–380. ISSN 0870-094X. [Google Scholar]
  37. Lopez, G.; Santos, J.R. Cerâmicas islâmicas da Natatio das Termas Romanas de Évora. In Proceedings of the X Congresso Internacional a Cerâmica Medieval no Mediterrâneo, Silves-Mértola, Portugal, 22–27 October 2012; Gonçalves, M.J., Gómez-Martínez, S., Eds.; Câmara Municipal de Silves & Campo Arqueológico de Mértola: Silves/Mértola, Portugal, 2015; pp. 346–352. [Google Scholar]
  38. Santos, J.R. Conjunto de cerâmica Omíada (sêculos X–XI) do Colégio Dos Meninos do Coro da Sé de Évora. Arqueol. Mediev. 2016, 13, 81–90. [Google Scholar]
  39. Acién, M.; Castillo, F.; Fernandez, M.I.; Martinez, R.; Peral, C.; Vallego, A. Evolución de los tipos cerámicos en el S.E. de Al-Andalus. In Proceedings of the 5ème Colloque sur la Céramique Médiévale en Méditerranée Occidentale, Rabat, Morocco, 11–17 November 1991; El Hraîki, R., Erbati, E., Eds.; Institut National des Sciences de l’Archéologie et du Patrimoine: Rabat, Morocco, 1995; pp. 125–139. [Google Scholar]
  40. Gonçalves, M.J. Silves Islâmica. A Muralha do Arravalde Oriental e a Dinâmica de Ocupacão do Espaço Adjacente. Master’s Thesis, University of Algarve, Algarve, Portugal, 2008. Available online: hdl.handle.net/10400.1/267 (accessed on 16 July 2021).
  41. Reedy, C.L.; Anderson, J.; Reedy, T.J.; Liu, Y. Image analysis in quantitative particle studies of archaeological ceramic thin sections. Adv. Archaeol. Pract. 2014, 2, 252–268. [Google Scholar] [CrossRef]
  42. Maritan, L. Archaeo-ceramic 2.0: Investigating ancient ceramics using modern technological approaches. Archaeol. Anthropol. Sci. 2019, 11, 5085–5093. [Google Scholar] [CrossRef]
  43. Sitzia, F.; Beltrame, M.; Lisci, C.; Mirão, J. Micro destructive analysis for the characterization of ancient mortars: A case study from the Little Roman Bath of Nora (Sardinia, Italy). Heritage 2021, 4, 144. [Google Scholar] [CrossRef]
  44. Sitzia, F.; Beltrame, M.; Mirão, J. The particle-size distribution of concrete and mortar aggregates by image analysis. J. Build. Rehabil. 2022, 7, 74. [Google Scholar] [CrossRef]
  45. Adams, A.E.; MacKenzie, W.S.; Guilford, C. Atlas of Sedimentary Rocks under the Microscope, 1st ed.; Longman Group: London, UK, 1984; ISBN 0-582-02701-2. [Google Scholar]
  46. Duminuco, P.; Messiga, B.; Riccardi, M.P. Firing process of natural clays. Some microtextures and related phase compositions. Thermochim. Acta 1998, 321, 185–190. [Google Scholar] [CrossRef]
  47. Riccardi, M.P.; Messiga, B.; Duminuco, P. An approach to the dynamics of clay firing. Appl. Clay Sci. 1999, 15, 393–409. [Google Scholar] [CrossRef]
  48. Cultrone, G.; Rodriguez-Navarro, C.; Sebastian, E.; Cazalla, O.; De La Torre, M.J. Carbonate and silicate phase reactions during ceramic firing. Eur. J. Mineral. 2001, 13, 621–634. [Google Scholar] [CrossRef]
  49. El Ouahabi, M.; Daoudi, L.; Hatert, F.; Fagel, N. Modified mineral phases during clay ceramic firing. Clays Clay Miner. 2015, 63, 404–413. [Google Scholar] [CrossRef]
  50. Heimann, R.B.; Maggetti, M. The struggle between thermodynamics and kinetics: Phase evolution of ancient and historical ceramics. Eur. Mineral. Union Notes Mineral. 2019, 20, 233–281. [Google Scholar] [CrossRef]
  51. Heiri, O.; Lotter, A.F.; Lemcke, G. Loss on ignition as a method for estimating organic and carbonate content in sediments: Reproducibility and comparability of results. J. Paleolimnol. 2001, 25, 101–110. [Google Scholar] [CrossRef]
  52. Walton, M.S.; Tite, M.S. Production technology of Roman lead-glazed pottery and its continuance into Late Antiquity. Archaeometry 2010, 52, 733–759. [Google Scholar] [CrossRef]
  53. Molera, J.; Pradell, T.; Salvadó, N.; Vendrell-Saz, M. Interactions between clay bodies and lead glazes. J. Am. Ceram. Soc. 2001, 84, 1120–1128. [Google Scholar] [CrossRef]
  54. Nodari, L.; Marcuz, E.; Maritan, L.; Mazzoli, C.; Russo, U. Hematite nucleation and growth in the firing of carbonate-rich clay for pottery production. J. Eur. Ceram. Soc. 2007, 27, 4665–4673. [Google Scholar] [CrossRef]
  55. Malek, Z.; Balek, V.; Garfinkel-Shweky, D.; Yariv, S. The study of the dehydration and dehydroxylation of smectites by emanation thermal analysis. J. Therm Anal. 1997, 48, 83–92. [Google Scholar] [CrossRef]
  56. Fabbri, B.; Gualtieri, S.; Shoval, S. The presence of calcite in archaeological ceramics. J. Eur. Ceram. Soc. 2014, 34, 1899–1911. [Google Scholar] [CrossRef]
  57. Molera, J.; Pradell, T.; Salvadó, N.; Vendrell-Saz, M. Lead frits in Islamic and Hispano-moresque glazed productions. In From Mine to Microscope: Advances in the Study of Ancient Technology, 1st ed.; Shortland, A.J., Freestone, I.C., Rehren, T., Eds.; Oxbow Books: Oxford, UK, 2007; pp. 1–10. ISBN 978-184217-259-9. [Google Scholar]
  58. Di Febo, R.; Molera, J.; Pradell, T.; Vallcorba, O.; Capelli, C. Technological implications of neo-formed hematite crystals in ceramic lead glazes. Sci. Technol. Archaeol. Res. 2017, 3, 366–375. [Google Scholar] [CrossRef]
  59. Di Febo, R.; Molera, J.; Pradell, T.; Vallcorba, O.; Melgarejo, J.C.; Capelli, C. Thin-section petrography and SR-µXRD for the identification of micro-crystallites in the brown decorations of ceramic lead glazes. Eur. J. Mineral. 2017, 29, 861–870. [Google Scholar] [CrossRef]
  60. Galiza, V. Contributo para o Conhecimento da Presença Islâmica em Yābura. Master’s Thesis, Nova University of Lisbon, Lisbon, Portugal, 2012. Available online: hdl.handle.net/10362/8109 (accessed on 2 October 2021).
  61. Santos, J.R. Um Olhar sobre o Quotidiano de Évora no Período Medieval-Islâmico. Séculos VIII-XI. Master’s Thesis, University of Évora, Évora, Portugal, 2015. Available online: https://hdl.handle.net/10174/18256 (accessed on 27 March 2021).
Figure 1. The Iberian Peninsula and the geographical location of Évora, Mértola, and Silves (elaborated by Massimo Beltrame).
Ceramics 06 00135 g001
Figure 2. Adapted geological maps of the cities of Évora, Mértola, and Silves. Maps were downloaded from the website of the National Laboratory of Energy and Geology (Geoportal-LNEG-Portugal). The scale is 1:500,000 (elaborated by Massimo Beltrame).
Ceramics 06 00135 g002
Figure 3. Picture of each unglazed and glazed ceramic sample included in the present study.
Ceramics 06 00135 g003
Figure 4. Technical drawings of each ceramic sample (elaborated by Carlos Camara).
Ceramics 06 00135 g004
Figure 5. Representative microphotographs of each pottery fabric collected in cross polarized light (XPL) (scale 750 µm): PF1 with an amphibole in the centre of the picture (EVR 1 sample), PF2 with angular to sub-rounded crystals of quartz and feldspars (EVR 15 sample), PF3 with and unmixed clay nodule (SIL 26 sample), PF4 with a buffy coloured ceramic paste and a small fragment of schist (EVR 12 sample), PF5 with thermally altered limestone fragments (EVR 16 sample) and PF6 very small crystals of muscovite mixed in the ceramic paste and a fragment of chert in the centre of the picture (EVR 2 sample).
Ceramics 06 00135 g005
Figure 6. Unglazed and glazed ceramic samples plotted on the Paste-Temper-Porosity ternary plot.
Ceramics 06 00135 g006
Figure 7. Samples ternary plots. Unglazed and glazed ceramic samples from Évora (top), Mértola (bottom) are plotted inside the (CaO + MgO) − Al2O3 − SiO2 ternary system.
Ceramics 06 00135 g007
Figure 8. Samples ternary plots. Unglazed and glazed ceramic samples from Silves are plotted inside the (CaO + MgO) − Al2O3 − SiO2 ternary system.
Ceramics 06 00135 g008
Figure 9. Samples binary plots. Identified pottery fabrics plotted inside the Na2O/CaO vs. CaO binary space (top), and inside the SiO2 vs. CaO binary space (bottom).
Ceramics 06 00135 g009
Figure 10. Samples of binary plots. Identified pottery fabrics plotted inside the Al2O3/K2O vs. CaO + MgO binary space.
Ceramics 06 00135 g010
Figure 11. Inner and outer glazed surfaces plotted inside PbO/SiO2 ratio vs. Na2O+K2O binary plots.
Ceramics 06 00135 g011aCeramics 06 00135 g011b
Figure 12. Inner and outer glazed surfaces plotted inside FeO vs. Al2O3 (top) and SiO2 vs. Al2O3 (bottom) binary plots. Sample EVR 9 is not included in binary plots.
Ceramics 06 00135 g012aCeramics 06 00135 g012b
Figure 13. BSE and SE images and elemental mapping distribution of the SIL 29 sample (inner side) displaying a limited ceramic body–glaze interface made up of acicular and euhedral crystals (A), which, correspondingly, are composed of lead–potassium feldspar and calcium-rich pyroxene (B,C).
Ceramics 06 00135 g013
Figure 14. Binary plot of Al2O3 (ceramic paste vs. glaze) of the inner (top) and outer (bottom) glaze surfaces, evidencing that there was no diffusion of Al2O3 from the ceramic body toward the glaze.
Ceramics 06 00135 g014
Figure 15. Binary plot of SiO2 (ceramic paste vs. glaze) of the inner (top) and outer (bottom) glaze surfaces, evidencing that there was no diffusion of SiO2 from the ceramic body to the glaze.
Ceramics 06 00135 g015
Figure 16. (A) BSE picture of black/brown decoration of sample MER 19 showing a rather homogeneous glaze. (B) BSE picture of black/brown decoration of sample EVR 11 showing different crystallites on the top surface of the glaze.
Ceramics 06 00135 g016
Figure 17. (AC) BSE picture and elemental mapping distribution of the black/brown decoration of sample EVR 2. (BD) BSE picture and elemental mapping distribution of the black/brown decoration of sample EVR 11.
Ceramics 06 00135 g017
Figure 18. (AC) BSE picture and elemental mapping distribution of the black/brown decoration of sample SIL 25. (BD) BSE picture and elemental mapping distribution of the black/brown decoration of sample SIL 26.
Ceramics 06 00135 g018
Table 1. List of glazed and unglazed ceramic samples included in this study with the indication of the excavation reference, the glaze type, the glaze and decoration color, the typology, the function, the chronology, the Islamic period, the archaeological site, and the city of retrieval.
SampleExcavation ReferenceGlaze TypeGlaze Colour
(Inner/Outer)
Glazed Decoration
Color
TypologyFunctionChronologyPeriodArchaeological SiteLocation
EVR-1CMCS.48/53Unglazed CookwareCooking potX–XICaliphalColégio dos Meninos do CoroÉvora
EVR-2EVR.LOIOS.23BichromeHoneyBlack/brownTablewareMedium jugX–XICaliphalPousada dos LoiosÉvora
EVR-3EVR.LOG.243/XII/90BichromeHoneyBlack/brownTablewareBowlXI–XIITaifaDa Natatio das Termas RomanasÉvora
EVR-4CMCS.5/44Unglazed CookwareCooking potX–XICaliphalColégio dos Meninos do CoroÉvora
EVR-5CMCS.25/6Unglazed CookwareCooking potX–XICaliphalColégio dos Meninos do CoroÉvora
EVR-6CMCS.455Unglazed CookwareCasseroleX–XICaliphalColégio dos Meninos do CoroÉvora
EVR-7CMCS.830Unglazed TablewareSmall jugX–XICaliphalColégio dos Meninos do CoroÉvora
EVR-8CMCS.49Unglazed TablewareSmall jugX–XICaliphalColégio dos Meninos do CoroÉvora
EVR-9EVR-GOU.142Glaze dropGreen Kiln toolTripod standX–XICaliphalCasa de BurgosÉvora
EVR-10EVT-92-12Unglazed CookwareCasseroleXI–XIITaifaRoman TempleÉvora
EVR-11PLG.S2.Si8 (2) 1136BichromeHoneyBlack/brownTablewareBowlXI–XIITaifaPaço dos Lobo da GamaÉvora
EVR-12EVR.LOIOS.149BichromeHoneyBlack/brownTablewareSmall jugXI–XIITaifaPousada dos LoiosÉvora
EVR-13PLG.S2.Si8 (2) 1119MonochromeHoney TablewareBowlXI–XIITaifaPaço dos Lobo da GamaÉvora
EVR-14EVR3-IV-F-1BichromeHoneyBlack/brownTablewareBowlX–XICaliphalCasa de BurgosÉvora
EVR-15PLG.S2.Si2 (1) 785MonochromeHoney LightingOil lampXI–XIITaifaPaço dos Lobo da GamaÉvora
EVR-16SEM.REF.PLGMonochromeHoney LightingOil lampXI–XIITaifaPaço dos Lobo da GamaÉvora
EVR-17PLG.S2.Si8 (2) 1129BichromeHoneyBlack/brownTablewareBowlXI–XIITaifaPaço dos Lobo da GamaÉvora
EVR-18PLG.S2.Si8 (2) 1118MonochromeHoney TablewareBowlXI–XIITaifaPaço dos Lobo da GamaÉvora
MER-19M (20.110) 24BichromeHoneyBlack/brownTablewareBowlmid-XII/mid-XIIIAlmohadEncosta do CasteloMértola
MER-21M (20.110) 59MonochromeHoney TablewareBowlmid-XII/mid-XIIIAlmohadEncosta do CasteloMértola
MER-22M (20.110) 67MonochromeHoney TablewareBowlmid-XII/mid-XIIIAlmohadEncosta do CasteloMértola
MER-23M (20.110) 68MonochromeHoney TablewareSmall jugmid-XII/mid-XIIIAlmohadEncosta do CasteloMértola
MER-24M (20.110) 54MonochromeHoney LightingOil lampmid-XII-mid-XIIIAlmohadEncosta do CasteloMértola
SIL-25M (20.110) 43BichromeHoneyBlack/brownTablewareTureenmid-XII/mid-XIIIAlmohadArrabalde IslâmicoSilves
SIL-26BIB.03 M7 E10 1020BichromeHoneyBlack/brownTablewareSmall bowlmid-XII/mid-XIIIAlmohadArrabalde IslâmicoSilves
SIL-27BIB.03 K7 E6BichromeHoneyBlack/brownTablewareSmall bowlmid-XII/mid-XIIIAlmohadArrabalde IslâmicoSilves
SIL-28BIB.02 J2/E6 66BichromeHoneyBlack/brownTablewareSmall bowlmid-XII/mid-XIIIAlmohadArrabalde IslâmicoSilves
SIL-29BIB.04 J7 E2 4A 60BichromeHoneyBlack/brownTablewareSmall bowlmid-XII/mid-XIIIAlmohadArrabalde IslâmicoSilves
Table 2. Table of XRD results. xxxx = abundant, xxx = frequent, xx = moderate, x = low, tr = traces.
Sample Ref.PFXRD-GroupQuartzPlagioclase
Feldspar
K-Rich
Feldspar
PyroxeneBiotiteIllite/MuscoviteAmphiboleCalciteHematiteAnalcimeAkermaniteSmectite
EVR-1PF1G1xxxxxxxxx xxxx
EVR-2PF6G2Bxxxxxxxxxx x xx x
EVR-3PF2G2Axxxxxxxx x
EVR-4PF1G1xxxxxxx xxxxxxxx
EVR-5PF1G1xxxxxxxxtrxxxxxtrx
EVR-6PF1G1xxxxxxxx xxxxtrx
EVR-7PF1G1xxxxxxxxxxtrxxxxxx
EVR-8PF1G1xxxxxxxxxtrxxxxxxxx x
EVR-9PF1G1xxxxxxxxx x x
EVR-10PF1G1xxxxxxxxx xxxx
EVR-11PF3G2Bxxxxxxxxxxx tr xx
EVR-12PF4G2Bxxxxxxxxxxx xxx xxxxx
EVR-13PF3G2Bxxxxxxxxxxxx trx
EVR-14PF2G2Axxxxxx x trx
EVR-15PF2G2Axxxxxx x
EVR-16PF5G2Bxxxxxxxx xx xx
EVR-17PF3G2Bxxxxxxxxxxxx xxx
EVR-18PF2G2Bxxxxxxxxxxx x tr
MER-19PF6G2Bxxxxxxxxx x x xx
MER-21PF2G2Bxxxxxxxx xx x
MER-22PF2G2Bxxxxxxxxxx trx tr
MER-23PF2G2Axxxxxxxx x
MER-24PF5G2Bxxxxxxxxxx x x xxxxx
SIL-25PF3G2Bxxxxxxxx xxx
SIL-26PF3G2Bxxxxxxxxxxx xxxxx
SIL-27PF2G2Bxxxxxxxxxxx x x
SIL-28PF6G2Bxxxxxxx x xx
SIL-29PF6G2Bxxxxxxxxx x xx x
Table 3. Comparative PbO, SiO2, and SiO2/PbO ratio and Na2O+K2O concentration in weight percent (wt%) of the inner and outer glaze. The table also includes the PF, the glaze type, and the chronology.
Sample Ref.PFGlaze TypeChronologyInnerOuterInnerOuterInnerOuterInnerOuter
PbOSiO2SiO2/PbONa2O+K2O
EVR-26BichromeX–XI48.3654.4036.0730.770.750.572.242.30
EVR-32BichromeXI–XII36.4944.0542.6836.591.170.832.272.50
EVR-91Glaze dropsX–XI 42.66 36.46 0.85 2.79
EVR-113BichromeXI–XII37.9040.8838.8834.771.030.853.123.47
EVR-124BichromeXI–XII37.6449.6739.9231.401.060.635.635.00
EVR-133MonochromeXI–XII41.0343.2038.4934.440.940.82.933.53
EVR-142BichromeX–XI46.0348.2237.2532.420.810.672.753.17
EVR-152MonochromeXI–XII47.6444.3435.9536.250.750.821.802.75
EVR-165MonochromeXI–XII45.6050.5536.0530.780.790.612.462.89
EVR-173BichromeXI–XII40.7843.5637.5234.350.920.793.975.19
EVR-182MonochromeXI–XII38.1741.2239.7736.431.040.882.943.28
MER-196Bichromemid-XII/mid-XIII 53.88 28.97 0.54 2.47
MER-212Monochromemid-XII/mid-XIII47.3052.7737.5933.270.790.631.351.69
MER-222Monochromemid-XII/mid-XIII33.7935.7044.3638.791.311.092.493.16
MER-232Monochromemid-XII/mid-XIII 45.21 35.61 0.79 2.17
MER-245Monochromemid-XII-mid-XIII39.9749.0236.5530.790.910.633.634.81
SIL-253Bichromemid-XII/mid-XIII40.8640.7938.6535.850.950.882.673.20
SIL-263Bichromemid-XII/mid-XIII35.1341.5239.9434.071.140.823.193.41
SIL-272Bichromemid-XII/mid-XIII38.9352.6440.2530.261.030.572.972.65
SIL-286Bichromemid-XII/mid-XIII42.0545.1040.0335.790.950.792.082.15
SIL-296Bichromemid-XII/mid-XIII41.4943.5540.2435.650.970.822.292.40
Table 4. Spot analysis developed in crystallites identified inside the black/brown decoration of samples EVR 2, EVR 11, SIL 25, and SIL 26. The statistical error is 1 sigma.
Oxides Wt%—Black/Brown Decoration—Spot Analyses
SamplesSpotNa2OMgOAl2O3SiO2P2O5K2OCaOTiO2MnOFeOBaOPbO
EVR-210.520.714.7520.63 1.013.220.8256.210.44 11.69
20.410.362.5516.04 0.231.171.0468.311.43 8.45
30.200.342.7214.40 0.412.031.2767.961.20 9.46
EVR-1110.530.552.9011.86 0.431.731.61 68.87 11.52
SIL-2510.714.905.6442.470.331.5719.86 1.7111.881.279.66
20.430.122.766.760.140.330.910.021.9880.021.594.93
SIL-2610.703.703.0812.77 0.822.531.0415.6344.68 15.06
20.000.432.086.62 0.311.280.813.5480.04 4.88
30.730.553.5813.00 0.532.531.605.0147.80 24.67
Disclaimer/Publisher’s Note: The statements, opinions and data contained in all publications are solely those of the individual author(s) and contributor(s) and not of MDPI and/or the editor(s). MDPI and/or the editor(s) disclaim responsibility for any injury to people or property resulting from any ideas, methods, instructions or products referred to in the content.

