
Early Fire Detection: A New Indoor Laboratory Dataset and Data Distribution Analysis


1
Department of Information Systems and Technology Management, Zayed University, Abu Dhabi P.O. Box 144534, United Arab Emirates
2
Faculty of Automatic Control, Electronics and Computer Science, Silesian University of Technology, Akademicka 16, 44-100 Gliwice, Poland
3
Department of Electrical, Electronics and Communications Engineering, American University of Ras Al Khaimah, Ras Al Khaimah P.O. Box 10021, United Arab Emirates
4
Department of Electrical Engineering, United Arab Emirates University, Al Ain P.O. Box 15551, United Arab Emirates
5
National Space Science and Technology Center, United Arab Emirates University, Al Ain P.O. Box 15551, United Arab Emirates
*
Author to whom correspondence should be addressed.
Fire 2022, 5(1), 11; https://doi.org/10.3390/fire5010011
Submission received: 24 November 2021
/
Revised: 4 January 2022
/
Accepted: 12 January 2022
/
Published: 18 January 2022
(This article belongs to the Collection Technical Forum for Fire Science Laboratory and Field Methods)
Abstract
:Fire alarm systems are typically equipped with various sensors such as heat, smoke, and gas detectors. These provide fire alerts and notifications of emergency exits when a fire has been detected. However, such systems do not give early warning in order to allow appropriate action to be taken when an alarm is first triggered, as the fire may have already caused severe damage. This paper analyzes a new dataset gathered from controlled realistic fire experiments conducted in an indoor laboratory environment. The experiments were conducted in a controlled manner by triggering the source of fire using electrical devices and charcoal on paperboard, cardboard or clothing. Important data such as humidity, temperature, MQ139, Total Volatile Organic Compounds (TVOC) and eCO2 were collected using sensor devices. These datasets will be extremely valuable to researchers in the machine learning and data science communities interested in pursuing novel advanced statistical and machine learning techniques and methods for developing early fire detection systems. The analysis of the collected data demonstrates the possibility of using eCO2 and TVOC reading levels for early detection of smoldering fires. The experimental setup was based on Low-Power Wireless Area Networks (LPWAN), which can be used to reliably deliver fire-related data over long ranges without depending on the status of a cellular or WiFi Network.
1. Introduction
Conventional fire alarms are very effective in detecting flaming fires. However, they cannot detect the presence of smoldering fires, which develop very slowly and do not develop much heat when compared to flaming fires. Therefore, it takes a relatively long time before a fire alarm can detect them. Thus, if smoldering flames are not detected early, they can cause a significant fire hazard. Recently, there has been a rising interest in providing fire systems that can provide reliable early detection of fires [1]. However, most conventional studies of fire science are based on numerical experiments such as CFD simulations [2,3,4] and not on actual experimentation.
Smoldering is a slow, flameless form of combustion that is a cause of residential fires. It is usually initiated by heat sources such as cigarettes, coal or short-circuited wires, which can cause slow combustion of home furniture, linen, cloth or paper-based materials. These fires are relatively slow and are not quickly detected by photoelectric smoke detectors and fire alarms except after the fire is fully developed and damage in the property is inevitable [5]. As such, this research measures the gas concentration levels accumulated in a room with a smoldering fire before a smoke alarm is activated. The paper shows graphically and statistically that it is possible to detect smoldering fire before it actually develops into a full flammable fire. Such early detection can prevent property damage and preserve lives.
Several studies covering early fire detection have been reported in the literature. A. Solorazano et al. [6,7] proposed the use of fire detectors based on chemical gas sensors instead of smoke-based detection systems in order to achieve early fire detection. This approach mainly depends on the fact that some types of fires involve the release of volatiles before smoke [8].
In addition, interest has increased in developing machine learning solutions using real fire datasets [9,10]. However, the vast majority of publicly available datasets related to the study of early fire detection are based solely on image data [11,12,13,14]. L. Wu et al. [10] used data on temperature, smoke concentration and carbon dioxide to develop an early warning algorithm based on a back-propagation neural network that outputs the probability of fire occurrence, using the National Institute of Standards and Technology (NIST) dataset [15] for their work [10]. While the NIST dataset is very valuable and includes 27 different experiments, it covers a limited number of indoor fire scenarios. For the development of reliable machine learning-based fire warning systems, the algorithms need to be exposed to a much larger number of fire types and scenarios in order to cover the flammable materials commonly found in homes [10]. This paper concludes that in order to develop a proper multi-sensor fusion mode, the fire dataset needs to be expanded to include flammable materials commonly found in homes.
One of the primary contributions of this work is to collect and provide data for machine learning practitioners and data scientists to build early fire detection predictive models. Our work provides a unique publicly available indoor laboratory fire dataset that has been readily formatted and made available to machine learning researchers and data scientists. The experiments conducted and the data collected cover scenarios that have not been previously reported. The scenarios provided by our work include experiments conducted on electric-triggered fires and charcoal-triggered fires on material commonly found in homes. Our main objective is to provide a sufficiently high-quality laboratory fire dataset that can help answer such important questions as what the most important predictive variables are for detecting smoldering fires. There is a strong need to gather data on the gas concentration levels accumulated in a room with a smoldering fire in the time before a smoke alarm is activated in order to answer such questions. Because it takes a relatively long time for a photoelectric smoke detector to detect a smoldering fire, it is important to measure the concentration of toxic gasses in the room before alarm activation. The volume of toxic gases present before the alarm goes off significantly affects a person’s chance of escaping a fire hazard [5].
The experiments conducted in this work aim to determine the sensitivity thresholds or boundaries between the following conditions: (1) no fire; (2) fire started, and (3) fire alarm activated. Figure 1 illustrates the general concept. The blue dashed line indicates the time when a fire is started, and the red dashed line indicates the point at which the fire alarm is activated or triggered. Notice that the time threshold is categorized into three sensitivity threshold limits within this time interval: low risk, medium risk, and high risk, as shown in the grey dotted lines. The ideal solution is to trigger an alert as soon as possible when a fire is started, at the low-risk sensitivity threshold limit. However, employing such a strategy introduces a high likelihood of false alarms. False alarms incur high human and financial costs, especially to the fire authority resources, and should be minimized or avoided completely [16]. On the other hand, if an alarm is triggered within the high-risk level, then the degree of damage may have already been severe. Therefore, there is a need to determine the “sweet spot” (preferably at the medium risk level) at which to trigger the fire alert in order to allow for the earliest possible detection without triggering false alarms. This is a challenging task, and it is envisaged that any decision for determining the right time to trigger an alert should be based on a data-driven approach.
The results from the conducted experiments reveal a set of interesting observations. From the results presented in this paper it can be observed that the most volatile variables trigger the fire alarm at the eCO2 and TVOC. In particular, the pattern shown by the eCO2 levels indicates that it can be used as a possible trigger for early fire alarms. The variable correlation analysis conducted on the collected data provided here provides valuable results and observations that filter only the most relevant features in order to build accurate predictive models. For example, the analysis provided reveals that eCO2 and TVOC are both strongly correlated with MQ139, leading to the conclusion that MQ139 can be removed from any constructed models.
The paper proposes and uses an IoT-based system for experimentation. The experimental setup is based on a Low-Power Wireless Area Network (LPWAN) protocol [17,18] commonly used in IoT systems and connects to the Things Network cloud server through an LoRaWAN [19] Gateway that can be located outside the affected building/premises. LPWAN systems such as LoRa have been demonstrated to provide connectivity up to 100s of kilometers line-of-sight and a few kilometers in urban areas [20]. The advantage of such a system is that it enables long range communications independent of the status of the cellular or Wi-Fi network. While this is a prototype setup, it has the potential to develop into an IoT-like system capable of providing an early fire alarm system connected remotely to home owners through mobile phone and/or to the concerned authorities through any device connected to the internet. Several research works have been reported proposing an early fire detection system based on Wireless Sensor Networks (WSNs) [21,22]. However, these reported designs depend on low range ZigBee protocol-based devices that do not provide the long-range advantages of LPWAN. IoT-based technologies have been proposed for early fire detection systems [23]; however, most of these proposed applications were in the area of forest fires in order to exploit the long range provided by LPWAN to achieve connectivity with rural areas [24,25].
2. Materials and Methods
In this section, the experimental methodology is described. We first describe how we set up our experiments to gather the fire dataset.
2.1. Experimental Setup
All experiments were conducted in a non-vented room with dimensions of 3 × 3 × 3 m. The location of the sensing setup was fixed in the middle of the room. The fire source was placed in the corner of the room to ensure that the emitted gases or smoke would not go directly to the sensing setup. Various sensors were used in the experiments. All sensors were connected to a microcontroller using an Arduino board. The data were collected using the wired serial connection between the computer and the microcontroller. PLX-DAQ [26] was used for data acquisition to collect the data instantaneously into an Excel sheet. We used two generic sensors to reflect the starting pattern of fires. A DHT22 sensor was used to measure both the temperature and humidity, while an SGP30 sensor was used to collect the Total Volatile Organic Compounds (TVOC) and CO2 readings.
Finally, a fire system alarm was installed to detect precisely the point of time at which the alarm was triggered. FIREX-UK FX0102E fire detectors were used; these were equipped with internal heat, smoke, and gas detector sensor devices. The fire alarm detector is designed to trigger based on a sensitivity limit, and if the sensed value cross that limit, an alarm is triggered. In our experiments, we captured exactly the time at which the detector triggered the alarm. In our datasets, for each data point, “OFF” indicates that the alarm has not been triggered, while “ON” indicates that the fire alarm has been triggered.
Each experiment was conducted separately using two main methods to trigger the fire, namely, electric heating devices and charcoal. Electrical fires were triggered using electrical heating devices consisting of a wound coil normally used for heating or cooking purposes, with a power of 10–12 Watts (12–13 Vdc, 0.85–1 A). The burning materials used in the experiments were of two types, paperboard cardboards (paper with a plastic layer) or clothes. The clothes materials included Cotton Fabric, Denim Fabric, a mixture of cotton and polyester, and commercial bedsheet and pillow sets in order to include a range of materials commonly found in residential homes. The cardboard-based fires were only triggered by charcoal, while cloth fires were triggered by charcoal or electrical devices. The sensors employed in our setup captured humidity, temperature, ammonia (NH3), TVOC, and eCO2 readings. The sampling time for recording the data was 1 sample per second.
A total of eight experiments were successfully conducted. While over 30 experiments were initially conducted, not all experiments were successful. Most experiments failed to produce enough smoldering fires, and others developed flammable fires before the fire alarms were triggered. We faced issues with our hardware setups during some experiments which required us to stop the experiments halfway.
The eCO2 levels were collected because it is the primary gas emitted from complete combustion in smoldering fires. eCO2 stands for “Equivalent CO2” (known as Global Warming Potential weighted greenhouse gas emissions, or GWP) and is a standard unit for measuring carbon footprints; it expresses the impact of each different greenhouse gas in terms of the amount of CO2 that would create the same amount of warming [27]. Sometimes, other gases are emitted from the smoldering fires depending on whether the burning materials are comprised of nitrogen or other compounds such as NH3, NO2, H2, SO2, and H2S [28]. Thus, it is important to measure VOC gas levels. The SGP30 sensor offers an advantage, as it is a pre-calibrated sensor that accurately measures the levels of CO2 and VOC without requiring calibration at the start of each experiment.
Additional sensors were used to capture a range of VOC gases such as Freon (R134A) and Ammonia (NH2) gases. However, from the observations of several experiments, we discovered some issues with our sensors. First, the sensors required a long preheating time before giving accurate measurements. Second, we noticed that the sensors were not consistently calibrated. To address these issues, we captured output based on the gas level (from 1 to 1000). The experimental hardware setup is depicted in Figure 2.
2.2. System Architecture and Communications Flow
In this section the overall communication flow using the designed system architecture is presented. The overall communication flow is shown in Figure 3. The sensor data were collected using a microcontroller Arduino board, then sent to The Things Network cloud server using LoRa communication gateway technology [18]. The LoRaWAN Gateway enables long-range and low-power data transfer transmission without using cellular or WiFi connections. Specifically, the data are collected by a Seeeduino LoRaWAN controller which has a built-in LoRa Module connected using a serial connection with the controller. The data are then sent to a Raspberry Pi-based gateway connected to the Internet using an Ethernet connection. Data are then transmitted to The Things LoRaWAN Network (TTN) via the internet. The TTN network provides the ability to integrate with other cloud providers such as AWS IoT, allowing data queries to be performed using other AWS services such as the Dynamic Database (DynamoDB) Lambda. Finally, all analyses can be offloaded to a mobile App using the Xamarin open-source platform [29].
The duration of an experiment varied depending on the fire source. For each experiment, all the sensor readings capture was initiated at the point when a fire was triggered, and stopped a few minutes after the fire alarm was activated. Table 1 summarizes the experimental duration for each fire source.
It can be observed that the approximate time the fire alarm was activated for the electrical/clothes material varied significantly, between 12 and 37 min. On the other hand, the fire alarm activated by the charcoal/clothing fires did not differ much, between 14 and 17 min. A similar observation was made for the charcoal/cardboard paperboard, as the alarm was activated between 14 and 17 min.
3. Results and Discussion
A total of eight controlled experiments were carried out. Four fire experiments were conducted on clothing triggered by electric fire sources, while the remaining four fire experiments were triggered by charcoal on paperboard cardboard or clothing. We conducted additional experiments for the electric fire source as the time for the fire alarms to be activated (due to electric fire sources) significantly varied, between 12 and 37 min, whereas the duration of charcoal-based cardboard, paperboard, and clothing fires did not differ much, between 14 and 17 min. Figure 4 shows the progress of fire with time for different types of fires in linear and log scales.
Each conducted experiment comprises a collection of time series data that correspond to the various sensor measurements (i.e., humidity, temperature, MQ139, TVOC, and eCO2) taken every second.
Figure 5 shows all the reading measurements (i.e., humidity, temperature, MQ139, TVOC, and eCO2) for all fire sources (i.e., the electrical device/cloth, charcoal/cardboards, and charcoal/cloth). We can observe that both eCO2 and TVOC appear to exhibit important predictive variables, as their values increase significantly before the fire alarms are triggered for every fire source, including electricity/clothing, charcoal/cardboards, and charcoal/clothing. For example, we can see that both TVOC and eCO2 values increase drastically around time 27:00 before the fire alarm is triggered at time 37:02 for the electric fire. As observed, there is always a visible dramatic increase and abrupt changes to the eCO2 values, despite the different time-series patterns. It is envisaged that if we could detect such patterns at an early stage, this would offer an opportunity to trigger a fire alarm warning alert before a fire grows out of control. In Figure 5, both eCO2 and TVOC exhibit the most important predictive variables, as the values increase significantly before the fire alarms are triggered for every source of the fire.
For illustrative purposes, Figure 5 further depicts the eCO2 reading measurements for four different experiments with electric fires. The red dashed line represents the point where the fire alarm is activated. From the plots, we can observe that their readings patterns are different, but there were some visible periods. For example, we can see a drastic change to the normal patterns (the outliers and anomaly formations) before the fire alarm was activated. Based on our observations, the most volatile variables that trigger the fire are the eCO2 and TVOC attributes. The results shown in Figure 5 indicate that that eCO2 levels can be used as an indicator for more prompt trigger times.
3.1. Variable Correlation Analysis
The objective of the variable correlation analysis is to examine and determine any visible patterns from the dataset that can be used to select the best features to build a predictive model. This is done by examining the feature interactions among each of the attributes. Figure 6 shows the Pearson correlations between each feature for a fire that was triggered by an electric device. As expected, TVOC and eCO2 are strongly correlated to each other. However, we can see some interesting observations regarding the correlations of the Ammonia (NH3) gas level (i.e., MQ139) with both eCO2 and TVOC. Both eCO2 and TVOC are strongly correlated with MQ139. When building a machine learning predictive model, one could consider removing one of the strongly correlated features, and based on our variable correlation analysis, the MQ139 could be one potential candidate for removal. This correlation analysis would be valuable to machine learning researchers and data scientists seeking to filter only the most relevant features in order to build more accurate predictive models.
3.2. Data Distribution Analysis
In this section, we present a data distribution analysis of our experimental dataset. The primary objective of the data distribution fitting analysis is to determine whether our dataset fits well on a specific statistical distribution, which could be useful to generate synthetic data.
We fitted each variable, i.e., eCO2, TVOC, humidity, temperature, and MQ139, to the most well-known distributions to find the best distributions that fit our data. These distributions include the normal, lognormal, exponential, power law, power normal, Weibull, Weibull minimum, Weibull maximum, exponentiated Weibull, erlang, exponential normal, exponential Weibull, logistic, log gamma, log-Laplace, skew normal, Pareto, Pearson, beta, and generalized gamma distributions.
For each fitted distribution, we estimated the parameters that provide the minimum SSE errors. Based on the SSEs computed for all distributions, we then selected the lowest SSE as the best distribution. Table 2 shows a summary of the best distributions for each source of fire for all the reading measurements (i.e., eCO2, TVOC, humidity, temperature, and MQ130).
The results include several interesting observations. First, we can observe that the SSEs for eCO2 and TVOC are extremely low, which indicates that these two variables can be modeled accurately using both Exponentiated Weibull and Double Weibull distributions (i.e., 0.0001 and 2.7088 × 10⁻⁵). As was shown earlier in Figure 4, eCO2 and TVOC are the two most important predictor variables for predicting fires. A more accurate ability to synthetically generate patterns for these two variables offers significant advantages in building a more accurate model for early fire detection.
Second, we found the temperature variable to be the most challenging variable to model for all sources of fire. We identified the Double Weibull distribution as the best-fitted variable for electrical/clothing and charcoal/clothing fires, although the SSEs reached as high as 44,790. This indicates that it is almost impossible to model the temperature variable accurately in any conditions. Humidity gives very high SSEs for electrical/clothing and charcoal/cardboard fires reaching up to 1236. Interestingly, the humidity can be modeled reasonably well using the Log Gamma Distribution, as it only incurs 29.49 of SSE.
Third, it is very interesting to note that MQ139 can be modeled accurately using Power Lognormal, Power Law, and Pearson type (PT) III distributions. It was initially suspected that the MQ139 reading was not captured accurately, as we had difficulties calibrating the sensors during our experiments. However, based on the data distribution analysis on multiple experiments for an identical source of fire, we found that the data distributions of the MQ139 do not vary much. It can be accurately modeled using the same best-fitted distributions, with a maximum of only 0.55 SSE.
Overall, we observed that the Double Weibull distribution gives the best-fitted distribution to model most measurements for the electrical/cloth fires. As observed, the Double Weibull distribution is the best-fitted for TVOC, humidity, and temperature. Interestingly, both eCO2 and TVOC have the same distribution family of exponentiated Weibull Distribution, with slightly different parameters for the charcoal/cardboards fire. On the other hand, the humidity and temperature for charcoal/cardboards are best fitted with the beta distribution. Interestingly, the charcoal/clothing fires, eCO2, TVOC, and humidity closely follow the Log Gamma Distribution. However, the MQ139 fire exhibits a very different distribution family for different fire sources, following a Power Lognormal distribution for the electrical/cloth fire, the Power Law Distribution for charcoal/cardboards, and the Pearson type (PT) III distribution for charcoal/clothing fires.
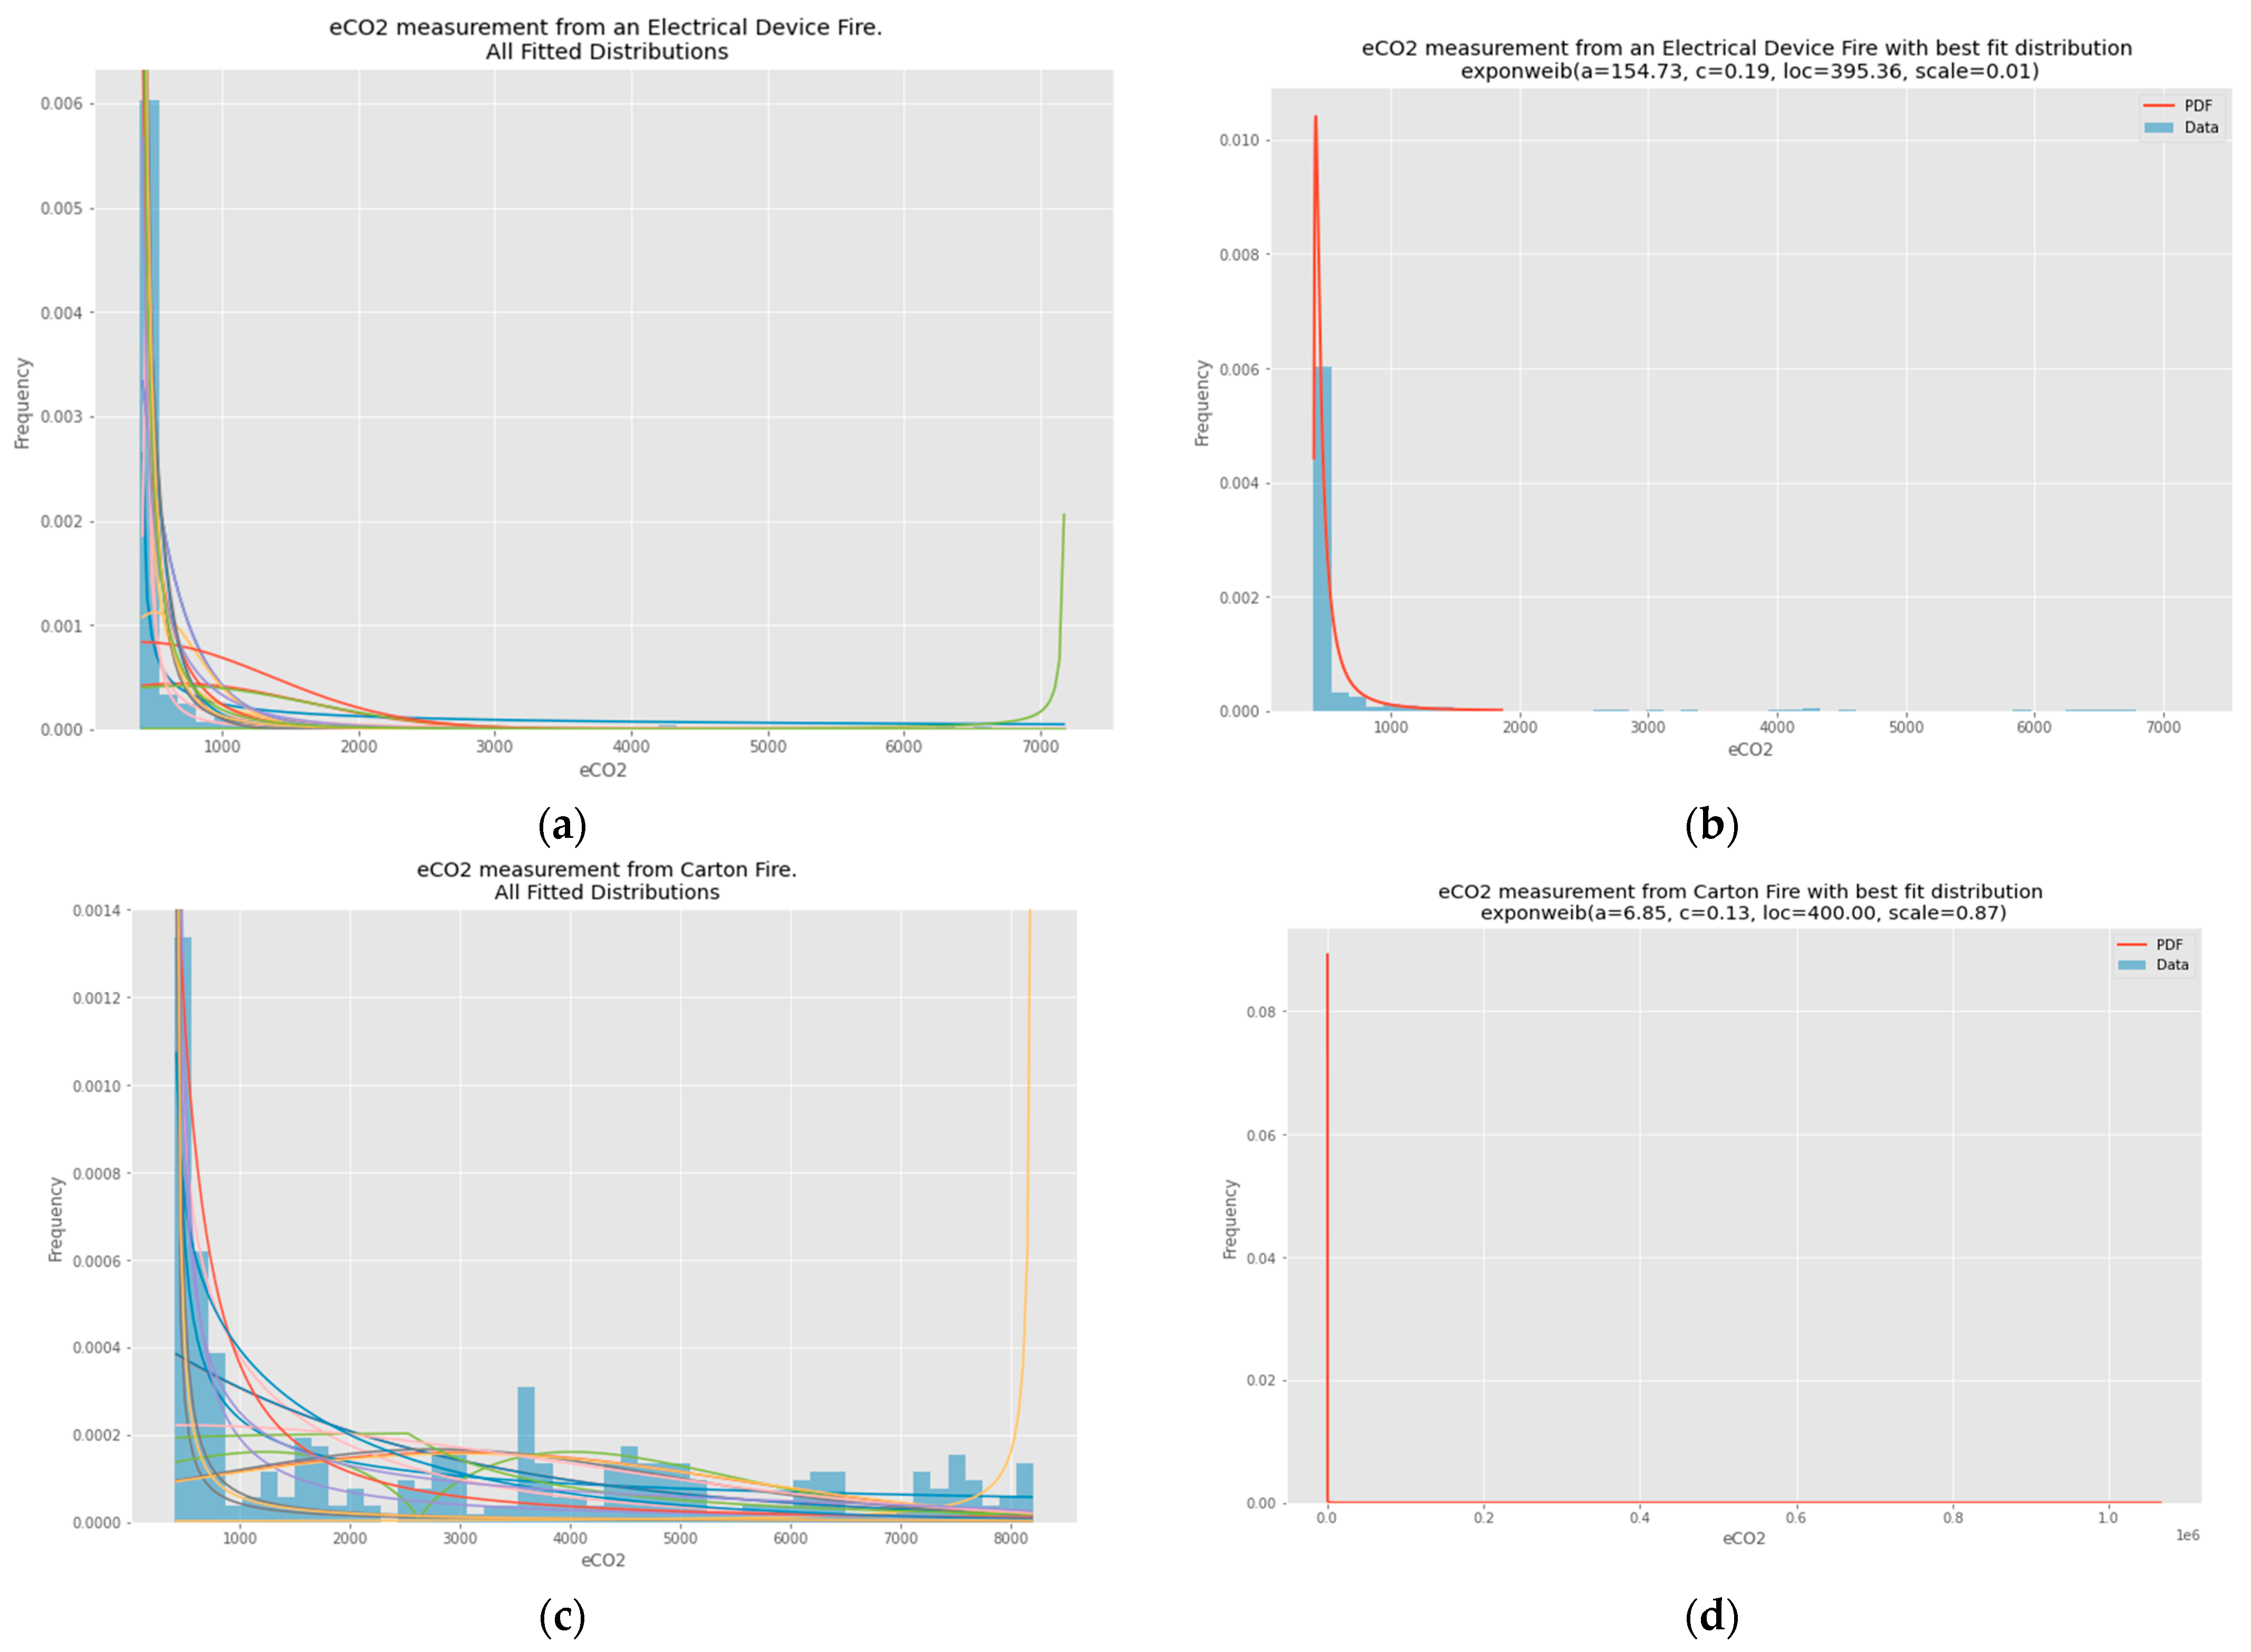
For illustrative purposes, Figure 7 shows all the fitted distributions for the eCO2 measurement for each fire source, namely electrical/clothing, charcoal/clothing, and charcoal/cardboards. The left side of the plots shows our attempts to fit the data based on the test distributions. Based on the analysis, the best fit distribution of the eCO2 from an electrical/cloth fire cause is an exponentiated Weibull, which has four parameters. The distribution takes a parameter as the exponentiation parameter, identified as 154.73 in our experimental best fit. The c is the shape parameter of the non-exponentiated Weibull law, for which we identified the best fit as 0.19 (i.e., c = 0.19). Furthermore, we found that shifting the loc parameter by 395.36 and the scale parameter by 0.01 offered the best fit distribution.
Interestingly, the best fit distribution of the eCO2 for the charcoal/cardboard source of fire was an exponentiated Weibull as well. The parameter is somewhat different as the mean value for the charcoal/cardboard is significantly less (a parameter value is 6.8 compared to 154.7 of the electrical/cloth fire). However, the best fit distribution for the charcoal/clothing fires is a log gamma distribution, different from the electrical/cloth and charcoal/cardboard fires. The log gamma distribution takes c as a shape parameter, for which we identified 0.01 as the best fit. Similar to the exponentiated Weibull, it takes the loc and scale parameters to shift and scale the distribution. For our charcoal/clothing fire datasets, we identified the best loc as 9103.87 and the scale as 49.40.
4. Conclusions
This paper presents the results of a series of laboratory experiments that provides a fire dataset for various fire scenarios that can take place in an indoor home environment. The purpose of the conducted experiments was to provide a dataset and a study on the possibility of early fire detection for smoldering fires. The experiments and analysis presented in the paper show that commercial fire detectors can take over 15 min to trigger the alarm. The experiments show that by monitoring certain gases such as eCO2 and VOC, more efficient fire alarm systems can be built. In addition, for commercial fire detectors there exist two contradictory criteria: sensitivity and accuracy. Increased sensitivity can lead to a higher probability of false fire alarms, which is expensive for large scale institutions, while decreased sensitivity can lead to delayed fire alarms. The results presented in this work show that the data collected through laboratory experimentation provide important predictor variables such as eCO2 and TVOC. The collected data could potentially be used to build highly accurate predictive models for early fire detection systems. The dataset provided by this work can be further used to develop machine learning-based systems to further improve the performance of fire alarm systems.
It was found that the sum of square errors (SSEs) for the fitted reading measurements was minimal based on our data distribution analysis. For example, the highest SSE errors were attributed to measurements of the electrical/cloth fire, yet the errors were less than 0.01 sum of square errors. This makes it accessible and practical for generating additional synthetic data based on best-fit distributions. Advanced machine learning techniques such as deep learning require a considerable amount of data for training, and generating synthetic data will be very helpful for such purpose.
To make the presented dataset highly accessible to machine learning practitioners and data scientists, we have added class/target labels. The target variables are classified into 3 classes: 0, 1, and 2. The class label ‘status’ is provided as the basis for supervised machine learning classification tasks. The class label 0 represents the initial point of the experiment (i.e., no fire or activated alarm). Class label 1 represents the point at which the fire has been started but with no activated alarm. Finally, class label 2 represents the point at which the fire causes activation of the fire alarm.
The class labels will be extremely valuable for machine learning classification tasks. For example, a machine learning engineer or data scientist may want to develop a predictive model that offers early fire detection by accurately classifying a sequence of class label 1s (with the object of detecting fire events accurately as soon as a fire has started). Moreover, we have added timestamps in our dataset, which could be useful if there is a need to extract more granular features. For example, one could aggregate a one-second interval into one-minute intervals to compare the trends from different time perspectives for more insightful conclusions of the data. The timestamps enable the use of previous values as features. Based on window size, one can compute the weighted average in order to, for example, gain insights into the most recent data, which could be used as additional features to build the machine learning model. For a more advanced techniques, our dataset can be applied to lag time-series information as features. Based on the correlation of individual values with their past values, one could calculate the best lag parameters to better forecast future values, for instance, by creating an ARIMA model for time series forecasting.
The paper presents a novel experimental setup communications flow, which was used in collecting the data and can be used as a prototype for early detection systems. The setup architecture depends on LPWAN technology, commonly used in the domain of Internet of Things, in order to provide long-range communications with a remote gateway and allow direct communication with the end user, regardless of the status of the cellular or local Wi-Fi network. The experimental setup proved to be highly reliable in terms of data delivery.
Future work includes the expansion of the number of experiments to include various other fire scenarios and the addition of more sensors, such as LPG gas leakage sensors.
Main Dataset
Time: Time (in 24-h format) when data was recorded by the sensor.
Reading ID#: unique id for the row or instances
Humidity%: humidity percentage
Temperature: temperature record in Celsius (°C)
MQ139: VOC gases (most sensitive to the Ammonia (NH3) and Freon gases level
TVOC: TVOC (Total Volatile Organic Compounds) level
eCO2: the estimated concentration of carbon dioxide calculated from known TVOC concentration. This assumes that the VOC produced by humans is proportional to their exhaled CO2. The analog output of the VOC sensor is in the range of 400–2000 ppm eCO2.
Detector: the fire alarm detection (conventional Photoelectric smoke detector). ‘OFF’ indicates no fire detected, while ‘OFF’ indicates a fire is detected
Status: ‘0′ represents the initial point of the experiment (i.e., no fire or activated alarm). ‘1′ represents the point at which the fire has been started but with no activated alarm yet (i.e., by electrical devices or charcoal). ‘2′ represents the point at which the real fire system was activated by the fire cause.
Author Contributions
Conceptualization, H.A., H.M., M.T., A.-H.J.; methodology, H.M., A.N., M.T., H.A.; software, A.N.; validation, H.M., A.N., M.T., A.-H.J.; formal analysis, H.M., M.T.; investigation, H.M., M.T.; resources, H.A., M.T.; data curation, A.N., H.M.; writing—original draft preparation, A.N, H.M.; writing—review and editing, A.N., H.M, M.T., A.-H.J., H.A.; visualization, A.N.; supervision, A.N., M.T., H.A., A.-H.J.; project administration, M.T., A.-H.J.; funding acquisition, H.A, A.-H.J. All authors have read and agreed to the published version of the manuscript.
Funding
This research was funded by Expo Dubai 2020 LLC-SO through EXPO Live Agreement EL-RA-013.
Institutional Review Board Statement
Not applicable.
Informed Consent Statement
Not applicable.
Data Availability Statement
The data are provided in a CSV format and are publicly available for download from the Mendeley Data via the following link https://data.mendeley.com/datasets/f3mjnbm9b3/1 (accessed on 24 November 2021).
Acknowledgments
The authors wish to express their gratitude to EXPO 2020, Dubai, UAE through EXPO Live Agreement EL-RA-013 for supporting this work.
Conflicts of Interest
The authors declare no conflict of interest.
Glossary
| Main Dataset | |
| Time: | Time (in 24-h format) when data was recorded by the sensor. |
| Reading ID#: | unique id for the row or instances |
| Humidity%: | humidity percentage |
| Temperature: | temperature record in Celsius (°C) |
| MQ139: | VOC gases (most sensitive to the Ammonia (NH3) and Freon gases level |
| TVOC: | TVOC (Total Volatile Organic Compounds) level |
| eCO2: | the estimated concentration of carbon dioxide calculated from known TVOC concentration. This assumes that the VOC produced by humans is proportional to their exhaled CO2. The analog output of the VOC sensor is in the range of 400–2000 ppm eCO2. |
| Detector: | the fire alarm detection (conventional Photoelectric smoke detector). ‘OFF’ indicates no fire detected, while ‘OFF’ indicates a fire is detected |
| Status: | ‘0’ represents the initial point of the experiment (i.e., no fire or activated alarm). ‘1’ represents the point at which the fire has been started but with no activated alarm yet (i.e., by electrical devices or charcoal). ‘2’ represents the point at which the real fire system was activated by the fire cause. |
References
- Kumar, A.; Gaur, A.; Singh, A.; Kumar, K.S.; Kulkarni, S.; Lala, K.; Kapoor, V.; Srivastava, S.C. Mukhopadhyay, Fire sensing technologies: A review. IEEE Sens. J. 2019, 19, 3191–3202. [Google Scholar] [CrossRef]
- Fernández-Alaiz, F.; Castañón, A.M.; Gómez-Fernández, F.; Bernardo-Sánchez, A.; Bascompta, M. Determination and Fire Analysis of Gob Characteristics Using CFD. Energies 2020, 13, 5274. [Google Scholar] [CrossRef]
- Maragkos, G.; Beji, T. Review of Convective Heat Transfer Modelling in CFD Simulations of Fire-Driven Flows. Appl. Sci. 2021, 11, 5240. [Google Scholar] [CrossRef]
- Kolaitis, D.; Asimakopoulou, E.; Founti, M. CFD Simulation of Fire Spreading in a Residential Building: The Effect of Implementing Phase Changing Materials. In Proceedings of the 5th European Combustion Meeting, Cardiff, UK, 30 June–2 July 2011. [Google Scholar]
- Sesseng, C. Mapping of Gas Concentrations, Effect of Deadair Space and Effect of Alternative Detection Technology in Smouldering Fires. SPFR Rep. A 2016, 16, 20053. [Google Scholar]
- Fonollosa, J.; Solórzano, A.; Marco, S. Chemical sensor systems and associated algorithms for fire detection: A review. Sensors 2018, 18, 553. [Google Scholar] [CrossRef] [Green Version]
- Solórzano, A.; Fonollosa, J.; Marco, S. Improving Calibration of Chemical Gas Sensors for Fire Detection Using Small Scale Setups. Proceedings 2017, 1, 453. [Google Scholar] [CrossRef] [Green Version]
- Fleming, J.M. Smoke Detector Technology and the Investigation of Fatal Fires May 2000; Boston Fire Department: Boston, MA, USA, 2000. [Google Scholar]
- Andrew, A.M.; Shakaff, A.Y.M.; Zakaria, A.; Gunasagaran, R.; Kanagaraj, E.; Saad, S.M. Early stage fire source classification in building using artificial intelligence. In Proceedings of the 2018 IEEE Conference on Systems, Process and Control (ICSPC 2018), Melaka, Malaysia, 14–15 December 2018; pp. 165–169. [Google Scholar] [CrossRef]
- Wu, L.; Chen, L.; Hao, X. Multi-Sensor Data Fusion Algorithm for Indoor Fire Early Warning Based on BP Neural Network. Information 2021, 12, 59. [Google Scholar] [CrossRef]
- Maheen, J.B.; Aneesh, R.P. Machine learning algorithm for fire detection using color correlogram. In Proceedings of the 2019 2nd international conference on intelligent computing, instrumentation and control technologies (ICICICT), Kannur, India, 5–6 July 2019; Volume 1. [Google Scholar]
- Khan, R.A.; Uddin, J.; Corraya, S.; Kim, J. Machine vision based indoor fire detection using static and dynamic features. Int. J. Control. Autom. 2018, 11, 87–98. [Google Scholar]
- Saponara, S.; Elhanashi, A.; Gagliardi, A. Real-time video fire/smoke detection based on CNN in antifire surveillance systems. J. Real-Time Image Processing 2020, 18, 889–900. [Google Scholar] [CrossRef]
- Li, P.; Zhao, W. Image fire detection algorithms based on convolutional neural networks. Case Stud. Therm. Eng. 2020, 19, 100625. [Google Scholar] [CrossRef]
- Bukowski, R.; Peacock, R.D.; Averill, J.; Cleary, T.; Bryner, N.; Walton, W.; Reneke, P.A.; Kuligowski, E.D. Performance of Home Smoke Alarms, Analysis of the Response of Several Available Technologies in Residential Fire Settings; National Institute of Standards and Technology: Gaithersburg, MD, USA, 2008.
- Chagger, R.; Smith, D. The Causes of False Fire Alarms in Buildings; Briefing Paper; BRE Global Limited: Watford, UK, 2014. [Google Scholar]
- Augustin, A.; Yi, J.; Clausen, T.; Townsley, W.M. A Study of LoRa: Long Range & Low Power Networks for the Internet of Things. Sensors 2016, 16, 1466. [Google Scholar] [CrossRef]
- Chaudhari, B.S.; Zennaro, M.; Borkar, S. LPWAN Technologies: Emerging Application Characteristics, Requirements, and Design Considerations. Future Internet 2020, 12, 46. [Google Scholar] [CrossRef] [Green Version]
- LoRa Alliance. LoRaWAN v1.0 Specification; LoRa Alliance: Fremont, CA, USA, 2015; Available online: https://lora-alliance.org/resource-hub/lorawanr-specification-v10 (accessed on 24 November 2021).
- Janssen, T.; BniLam, N.; Aernouts, M.; Berkvens, R.; Weyn, M. LoRa 2.4 GHz Communication Link and Range. Sensors 2020, 20, 4366. [Google Scholar] [CrossRef] [PubMed]
- Saputra, F.A.; Rasyid, M.U.H.A.; Abiantoro, B.A. Prototype of early fire detection system for home monitoring based on Wireless Sensor Network. In Proceedings of the 2017 International Electronics Symposium on Engineering Technology and Applications (IES-ETA), Surabaya, Indonesia, 26–27 September 2017; pp. 39–44. [Google Scholar] [CrossRef]
- Al Rasyid, M.U.H.; Enda, D.; Saputra, F.A. Smart Home System for Fire Detection Monitoring Based on Wireless Sensor Network. In Proceedings of the 2019 International Electronics Symposium (IES), Surabaya, Indonesia, 18 November 2019; pp. 189–194. [Google Scholar] [CrossRef]
- Vijayalakshmi, S.R.; Muruganand, S. A survey of Internet of Things in fire detection and fire industries. In Proceedings of the 2017 International Conference on I-SMAC (IoT in Social, Mobile, Analytics and Cloud) (I-SMAC), Palladam, India, 10–11 February 2017; pp. 703–707. [Google Scholar] [CrossRef]
- Sendra, S.; García, L.; Lloret, J.; Bosch, I.; Vega-Rodríguez, R. LoRaWAN Network for Fire Monitoring in Rural Environments. Electronics 2020, 9, 531. [Google Scholar] [CrossRef] [Green Version]
- Adnan; Salam, A.E.U.; Arifin, A.; Rizal, M. Forest Fire Detection using LoRa Wireless Mesh Topology. In Proceedings of the 2018 2nd East Indonesia Conference on Computer and Information Technology (EIConCIT), Makassar, Indonesia, 6–7 November 2018; pp. 184–187. [Google Scholar] [CrossRef]
- Available online: https://www.parallax.com/package/plx-daq (accessed on 24 November 2021).
- Available online: https://theclimatecenter.org/resources/glossary/ (accessed on 24 November 2021).
- Stec, A.A. Fire toxicity–the elephant in the room? Fire Saf. J. 2017, 91, 79–90. [Google Scholar] [CrossRef]
- Available online: https://dotnet.microsoft.com/apps/xamarin (accessed on 24 November 2021).
Figure 1.
The data are initially captured when the fire begins continuing until the fire alarm is activated. As the fire begins, the risk level gradually increases from low to medium and then high.
Figure 1.
The data are initially captured when the fire begins continuing until the fire alarm is activated. As the fire begins, the risk level gradually increases from low to medium and then high.
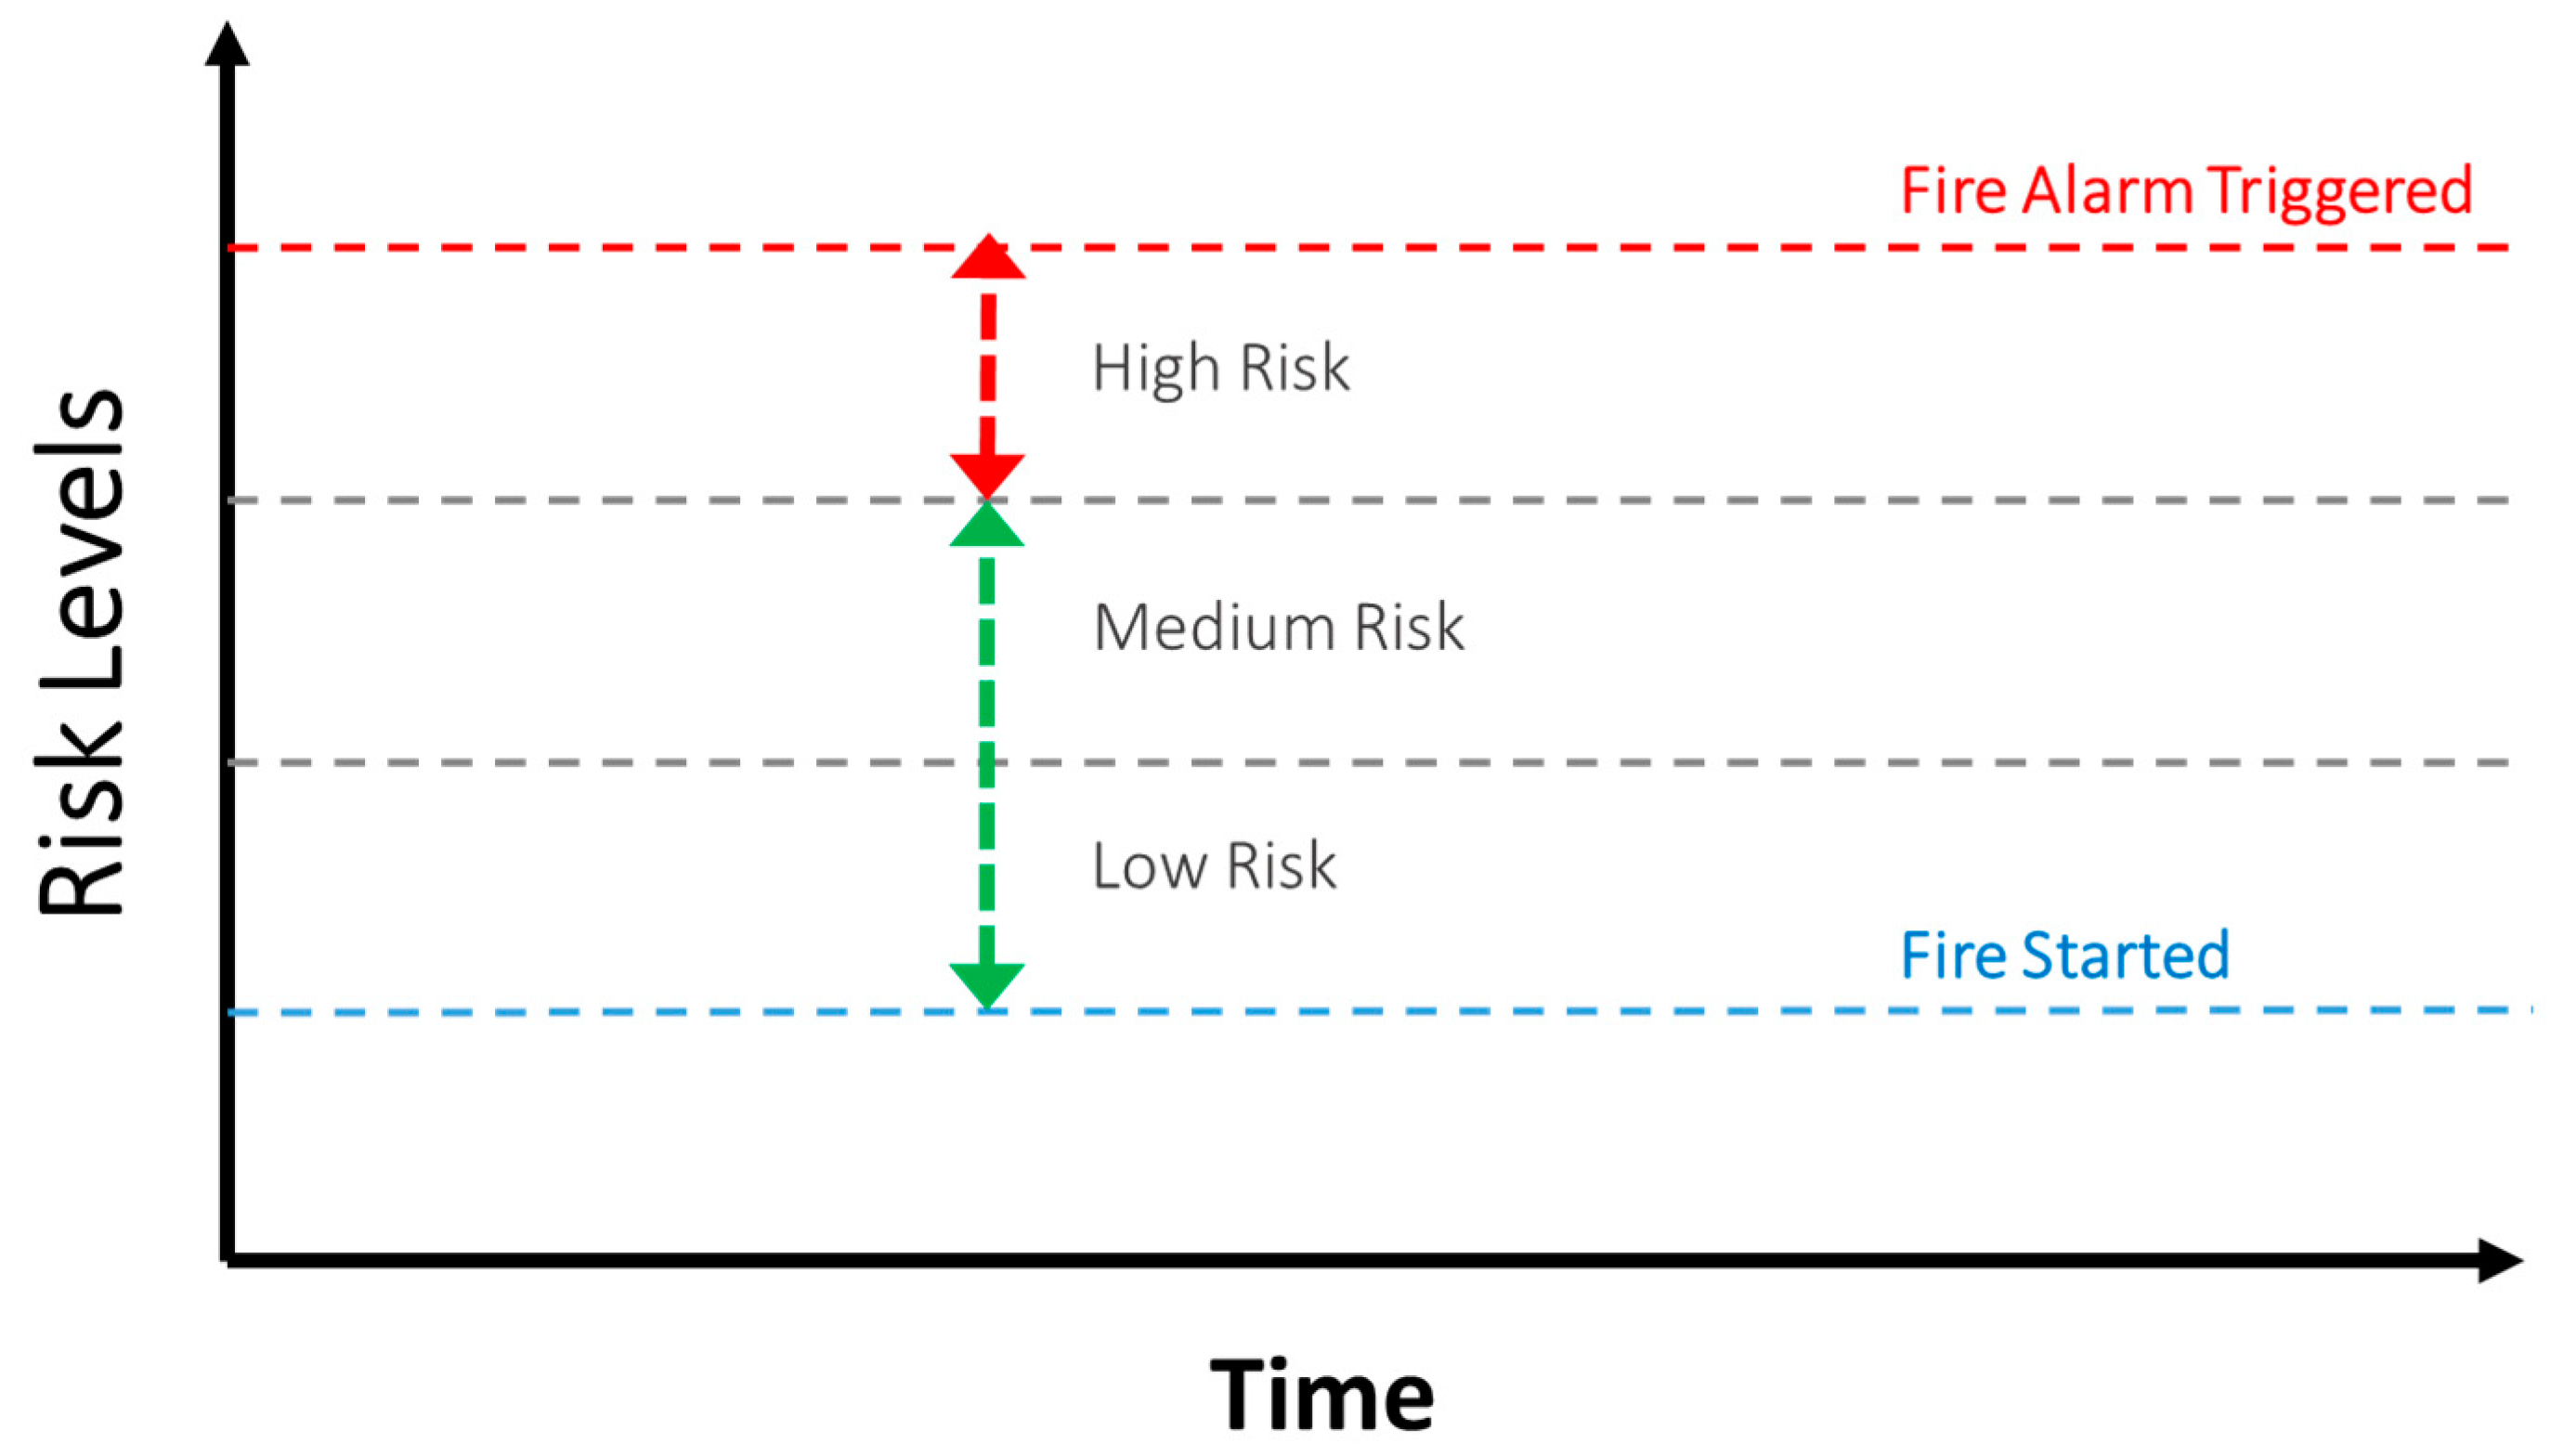
Figure 2.
Hardware Deployment setup for Experiments: (a) setup physically situated in the middle of the laboratory room; (b) experimental setup showing sensors connected to the microcontroller motherboard and the LoRa Node wireless system connecting it to the cloud.
Figure 2.
Hardware Deployment setup for Experiments: (a) setup physically situated in the middle of the laboratory room; (b) experimental setup showing sensors connected to the microcontroller motherboard and the LoRa Node wireless system connecting it to the cloud.
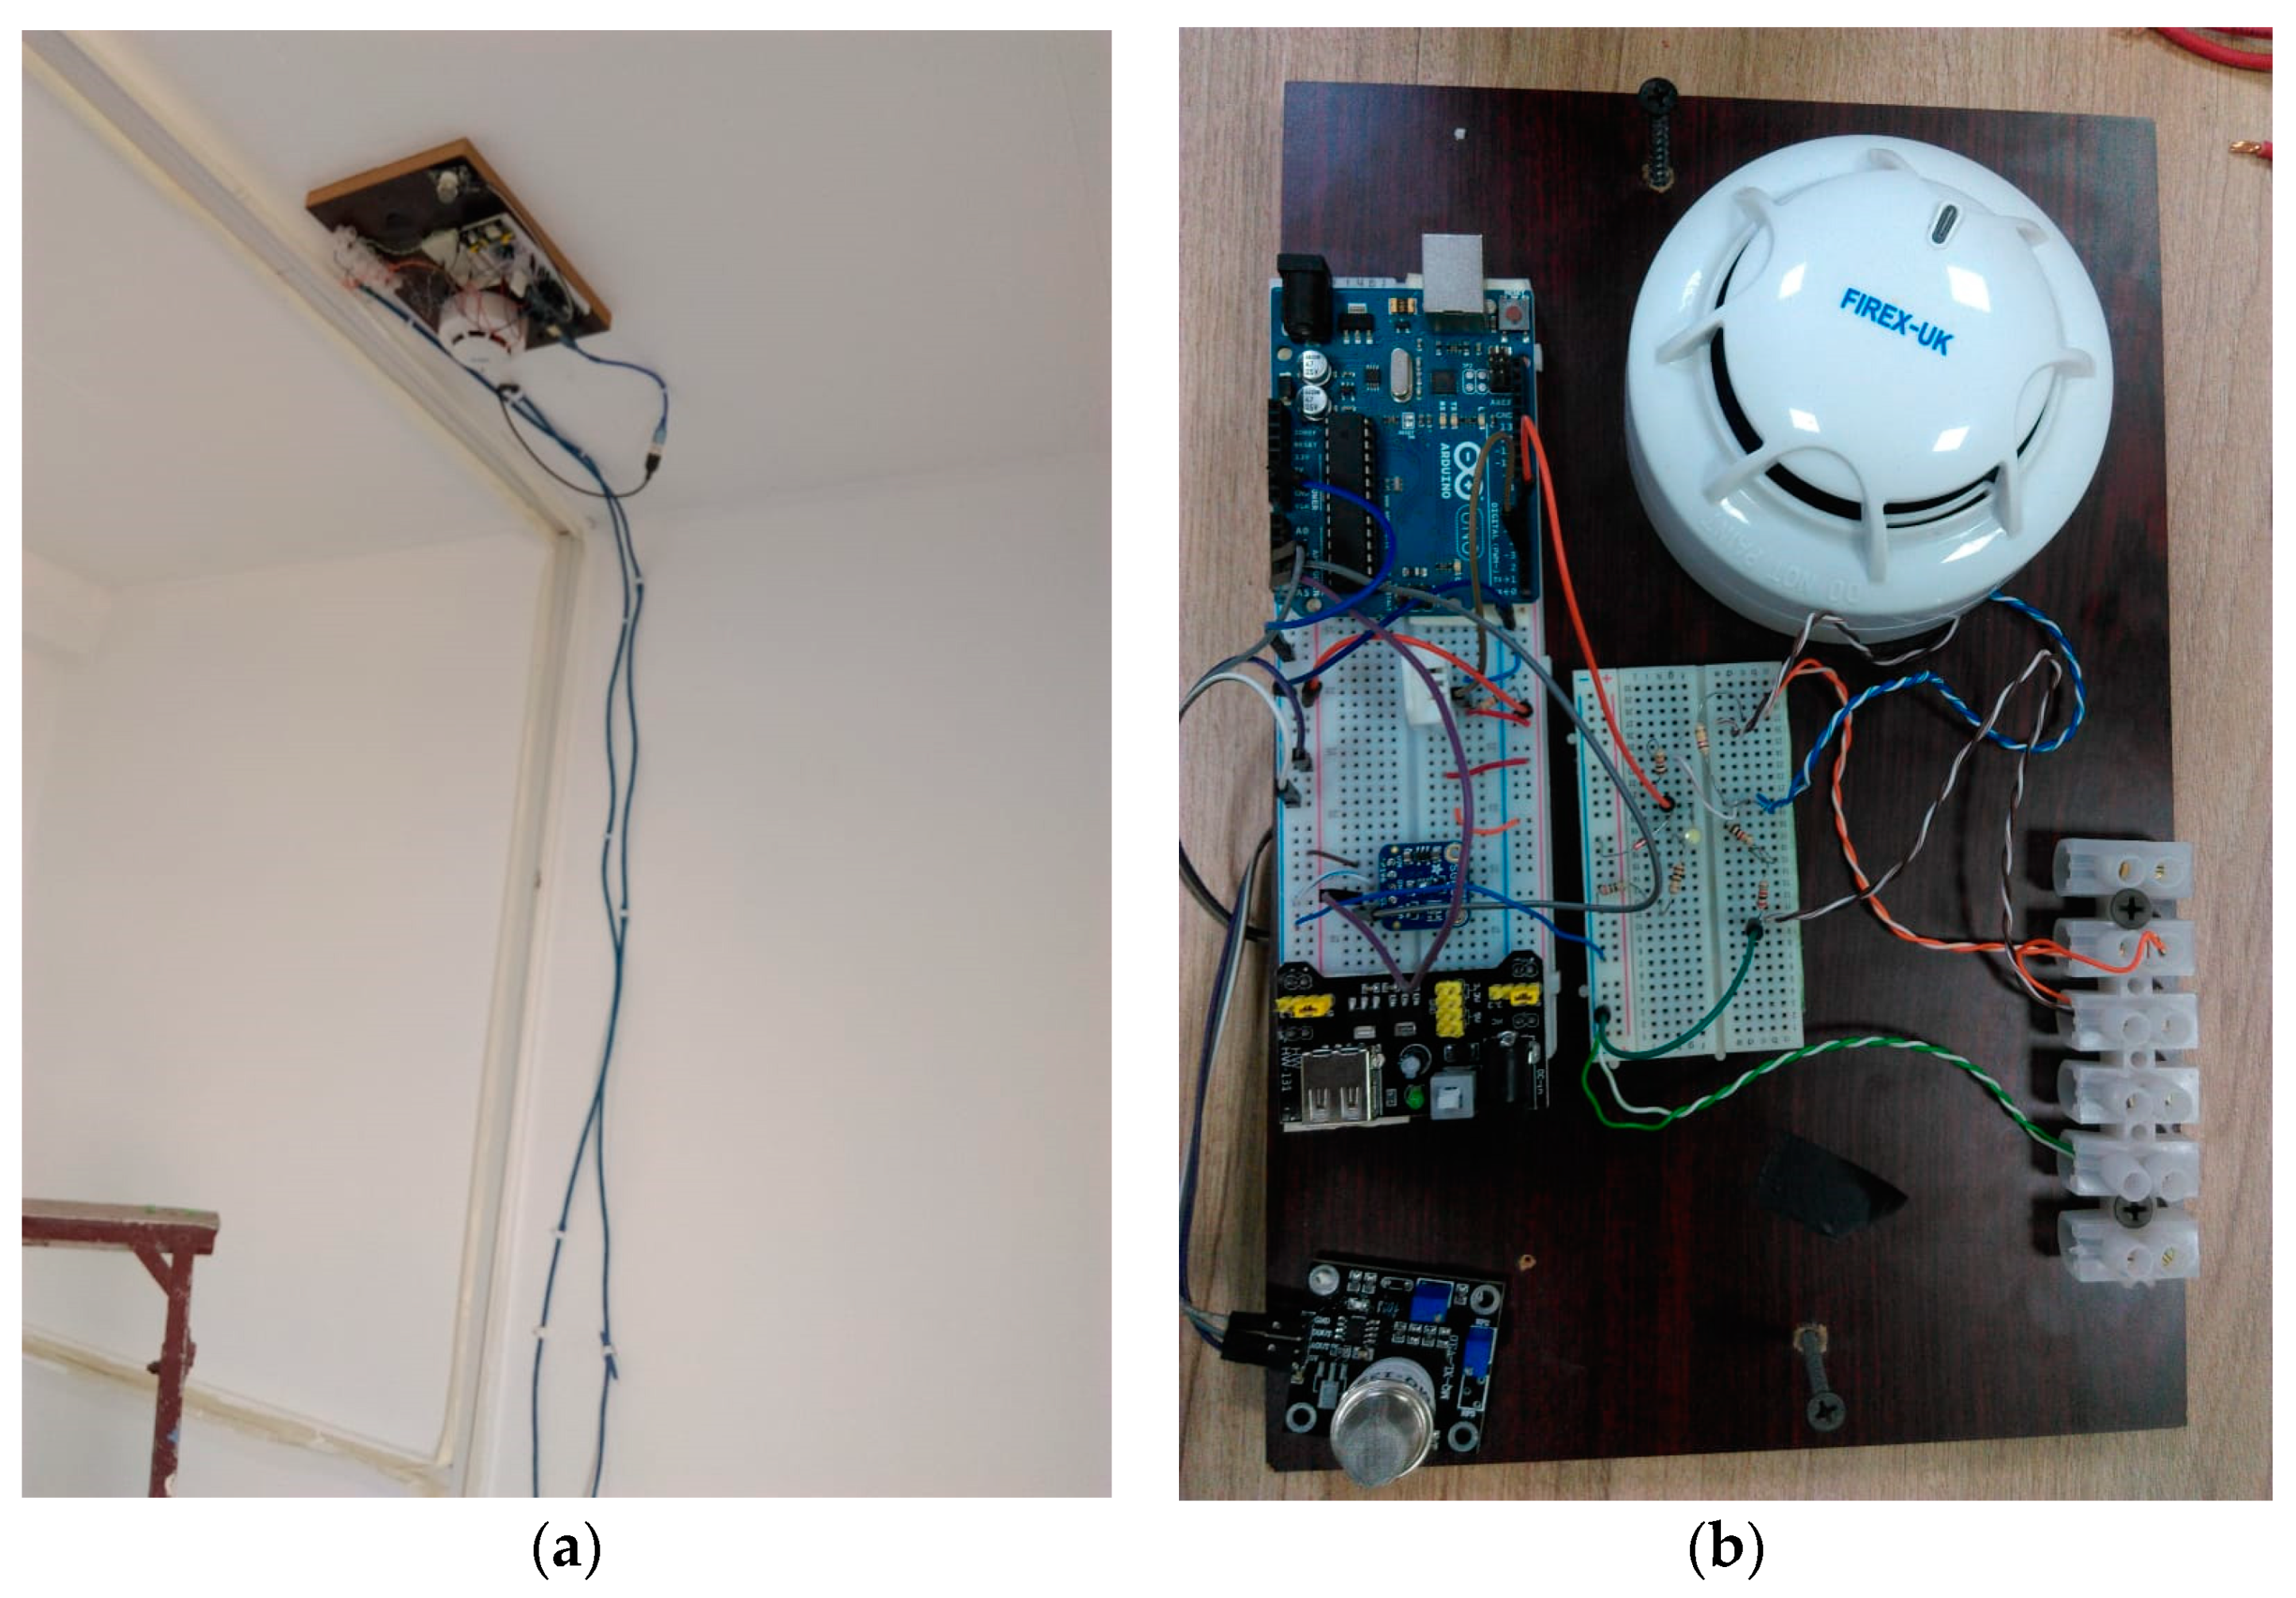
Figure 3.
Communication Architecture for the experimental setup.
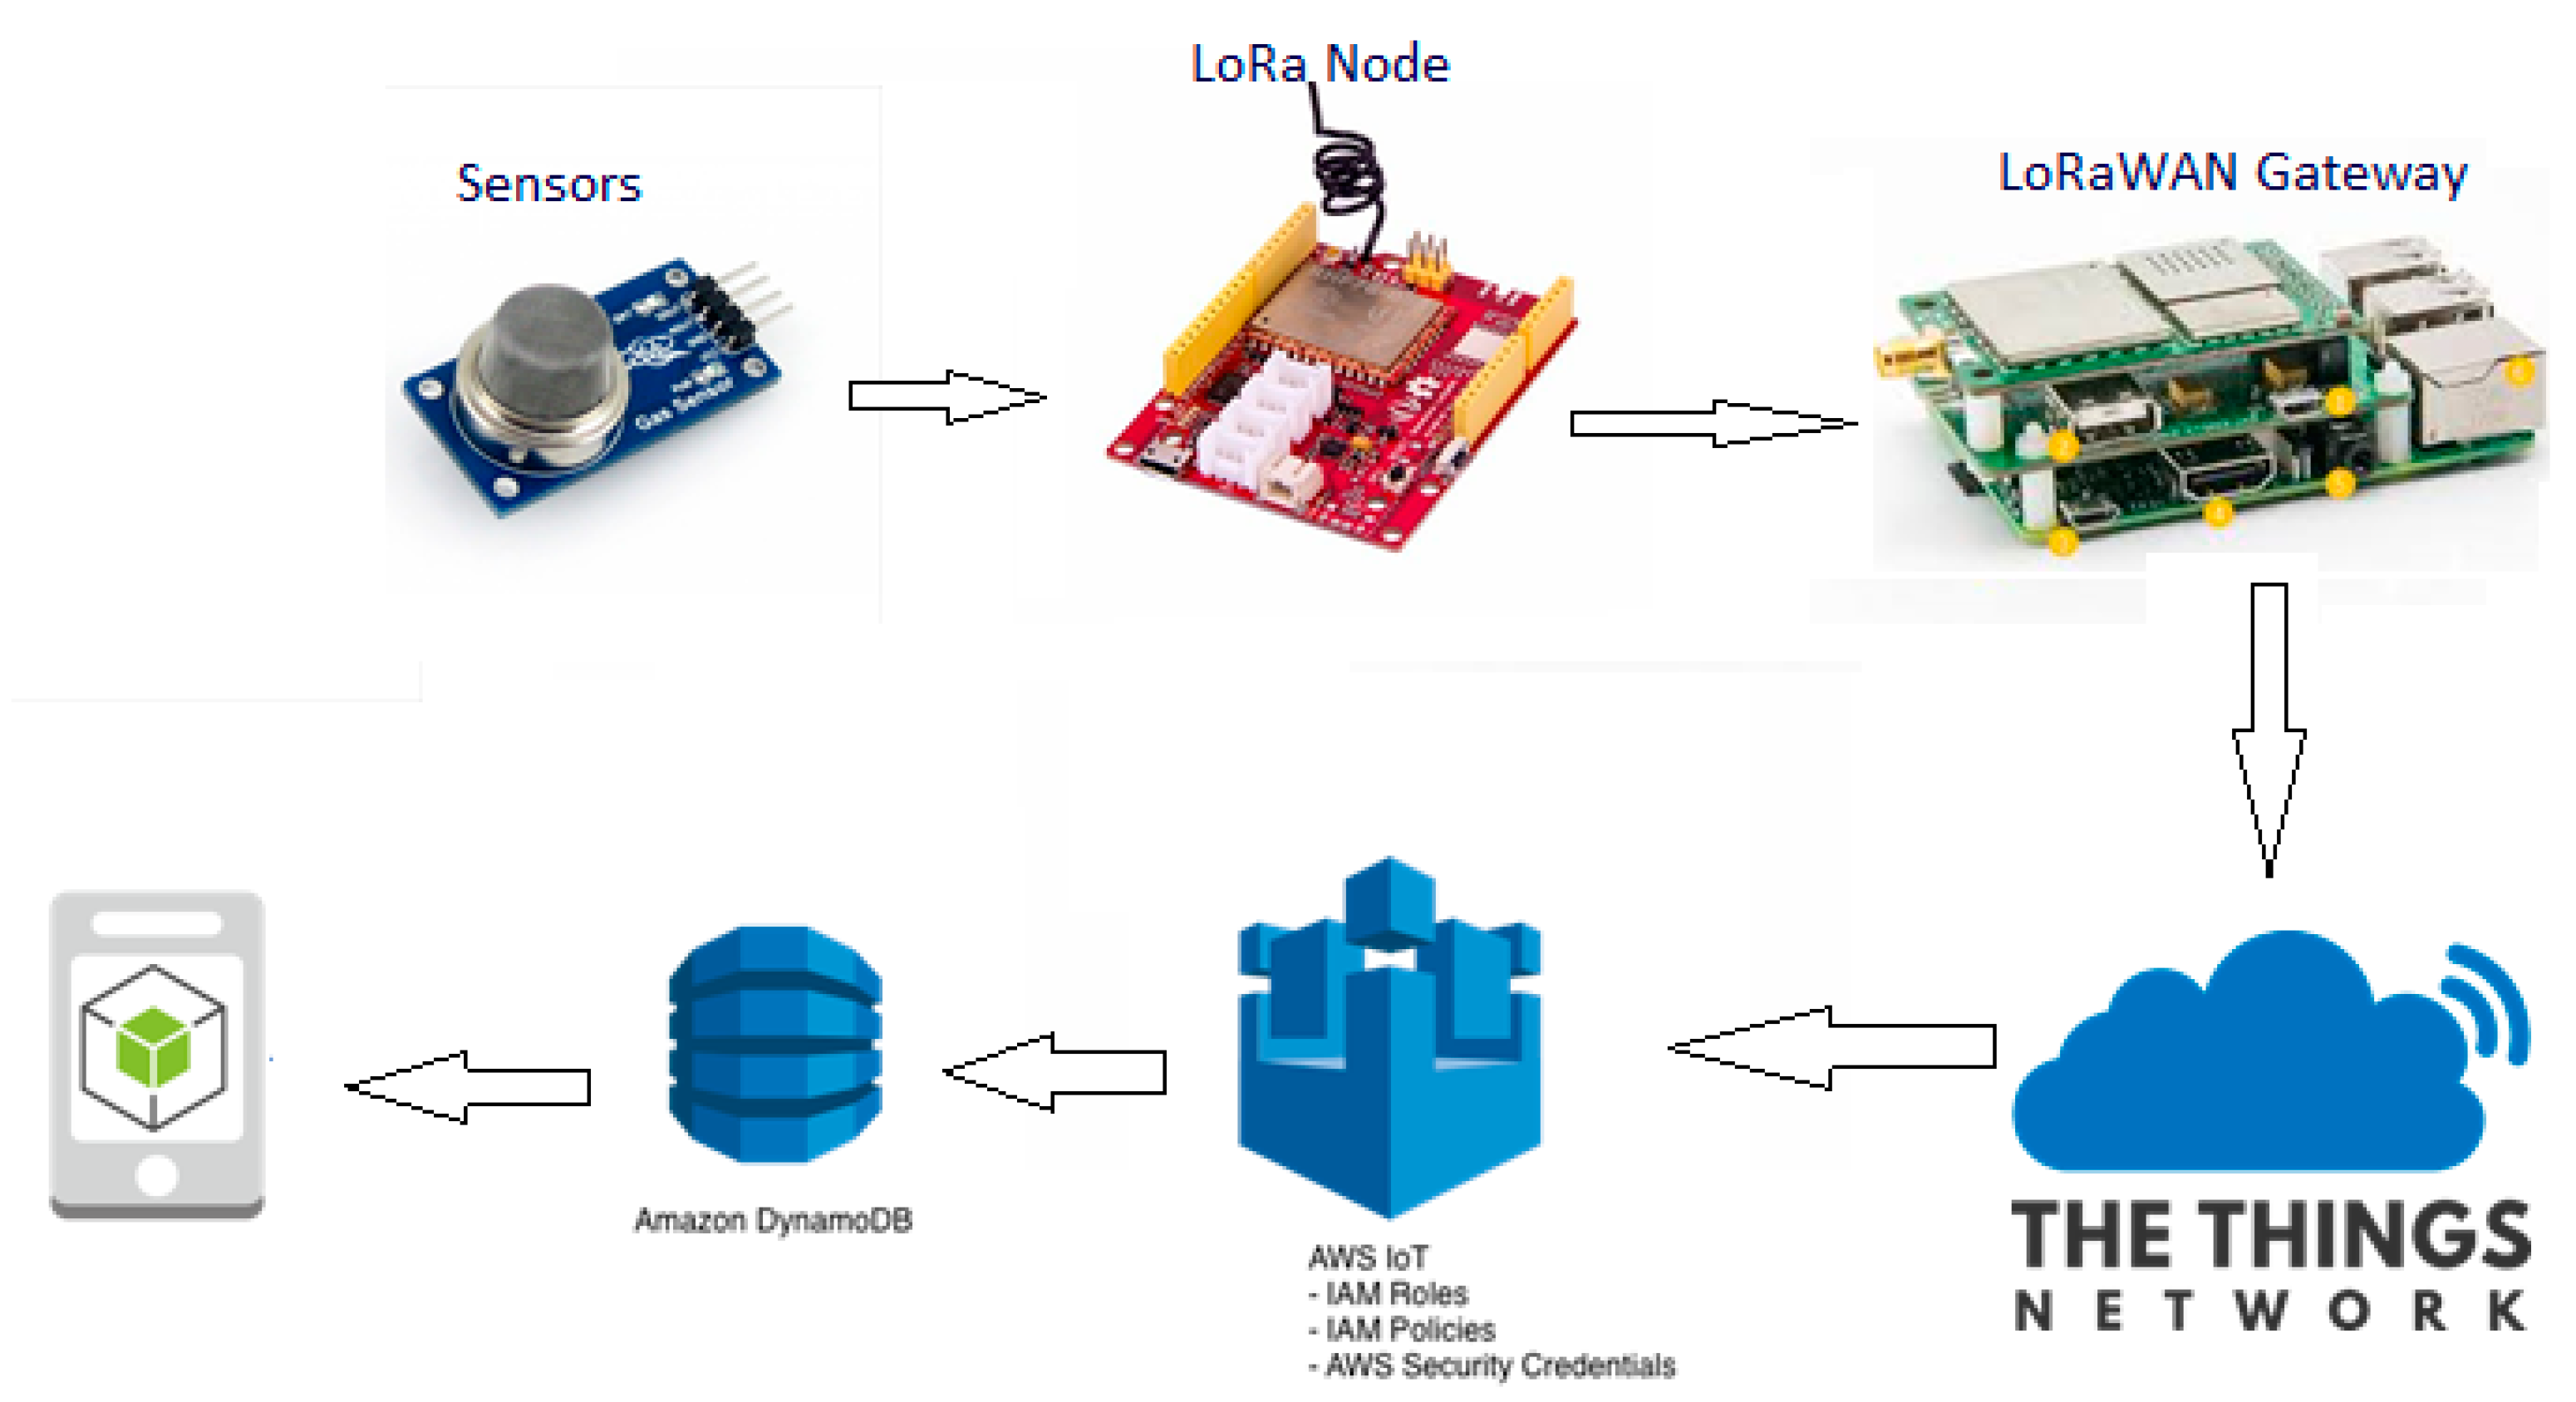
Figure 4.
Linear and log scale measurements: (a,b) Electrical/Cloth fire; (c,d) Charcoal/Cardboards fire; (e,f) Charcoal/Clothing fire.
Figure 4.
Linear and log scale measurements: (a,b) Electrical/Cloth fire; (c,d) Charcoal/Cardboards fire; (e,f) Charcoal/Clothing fire.
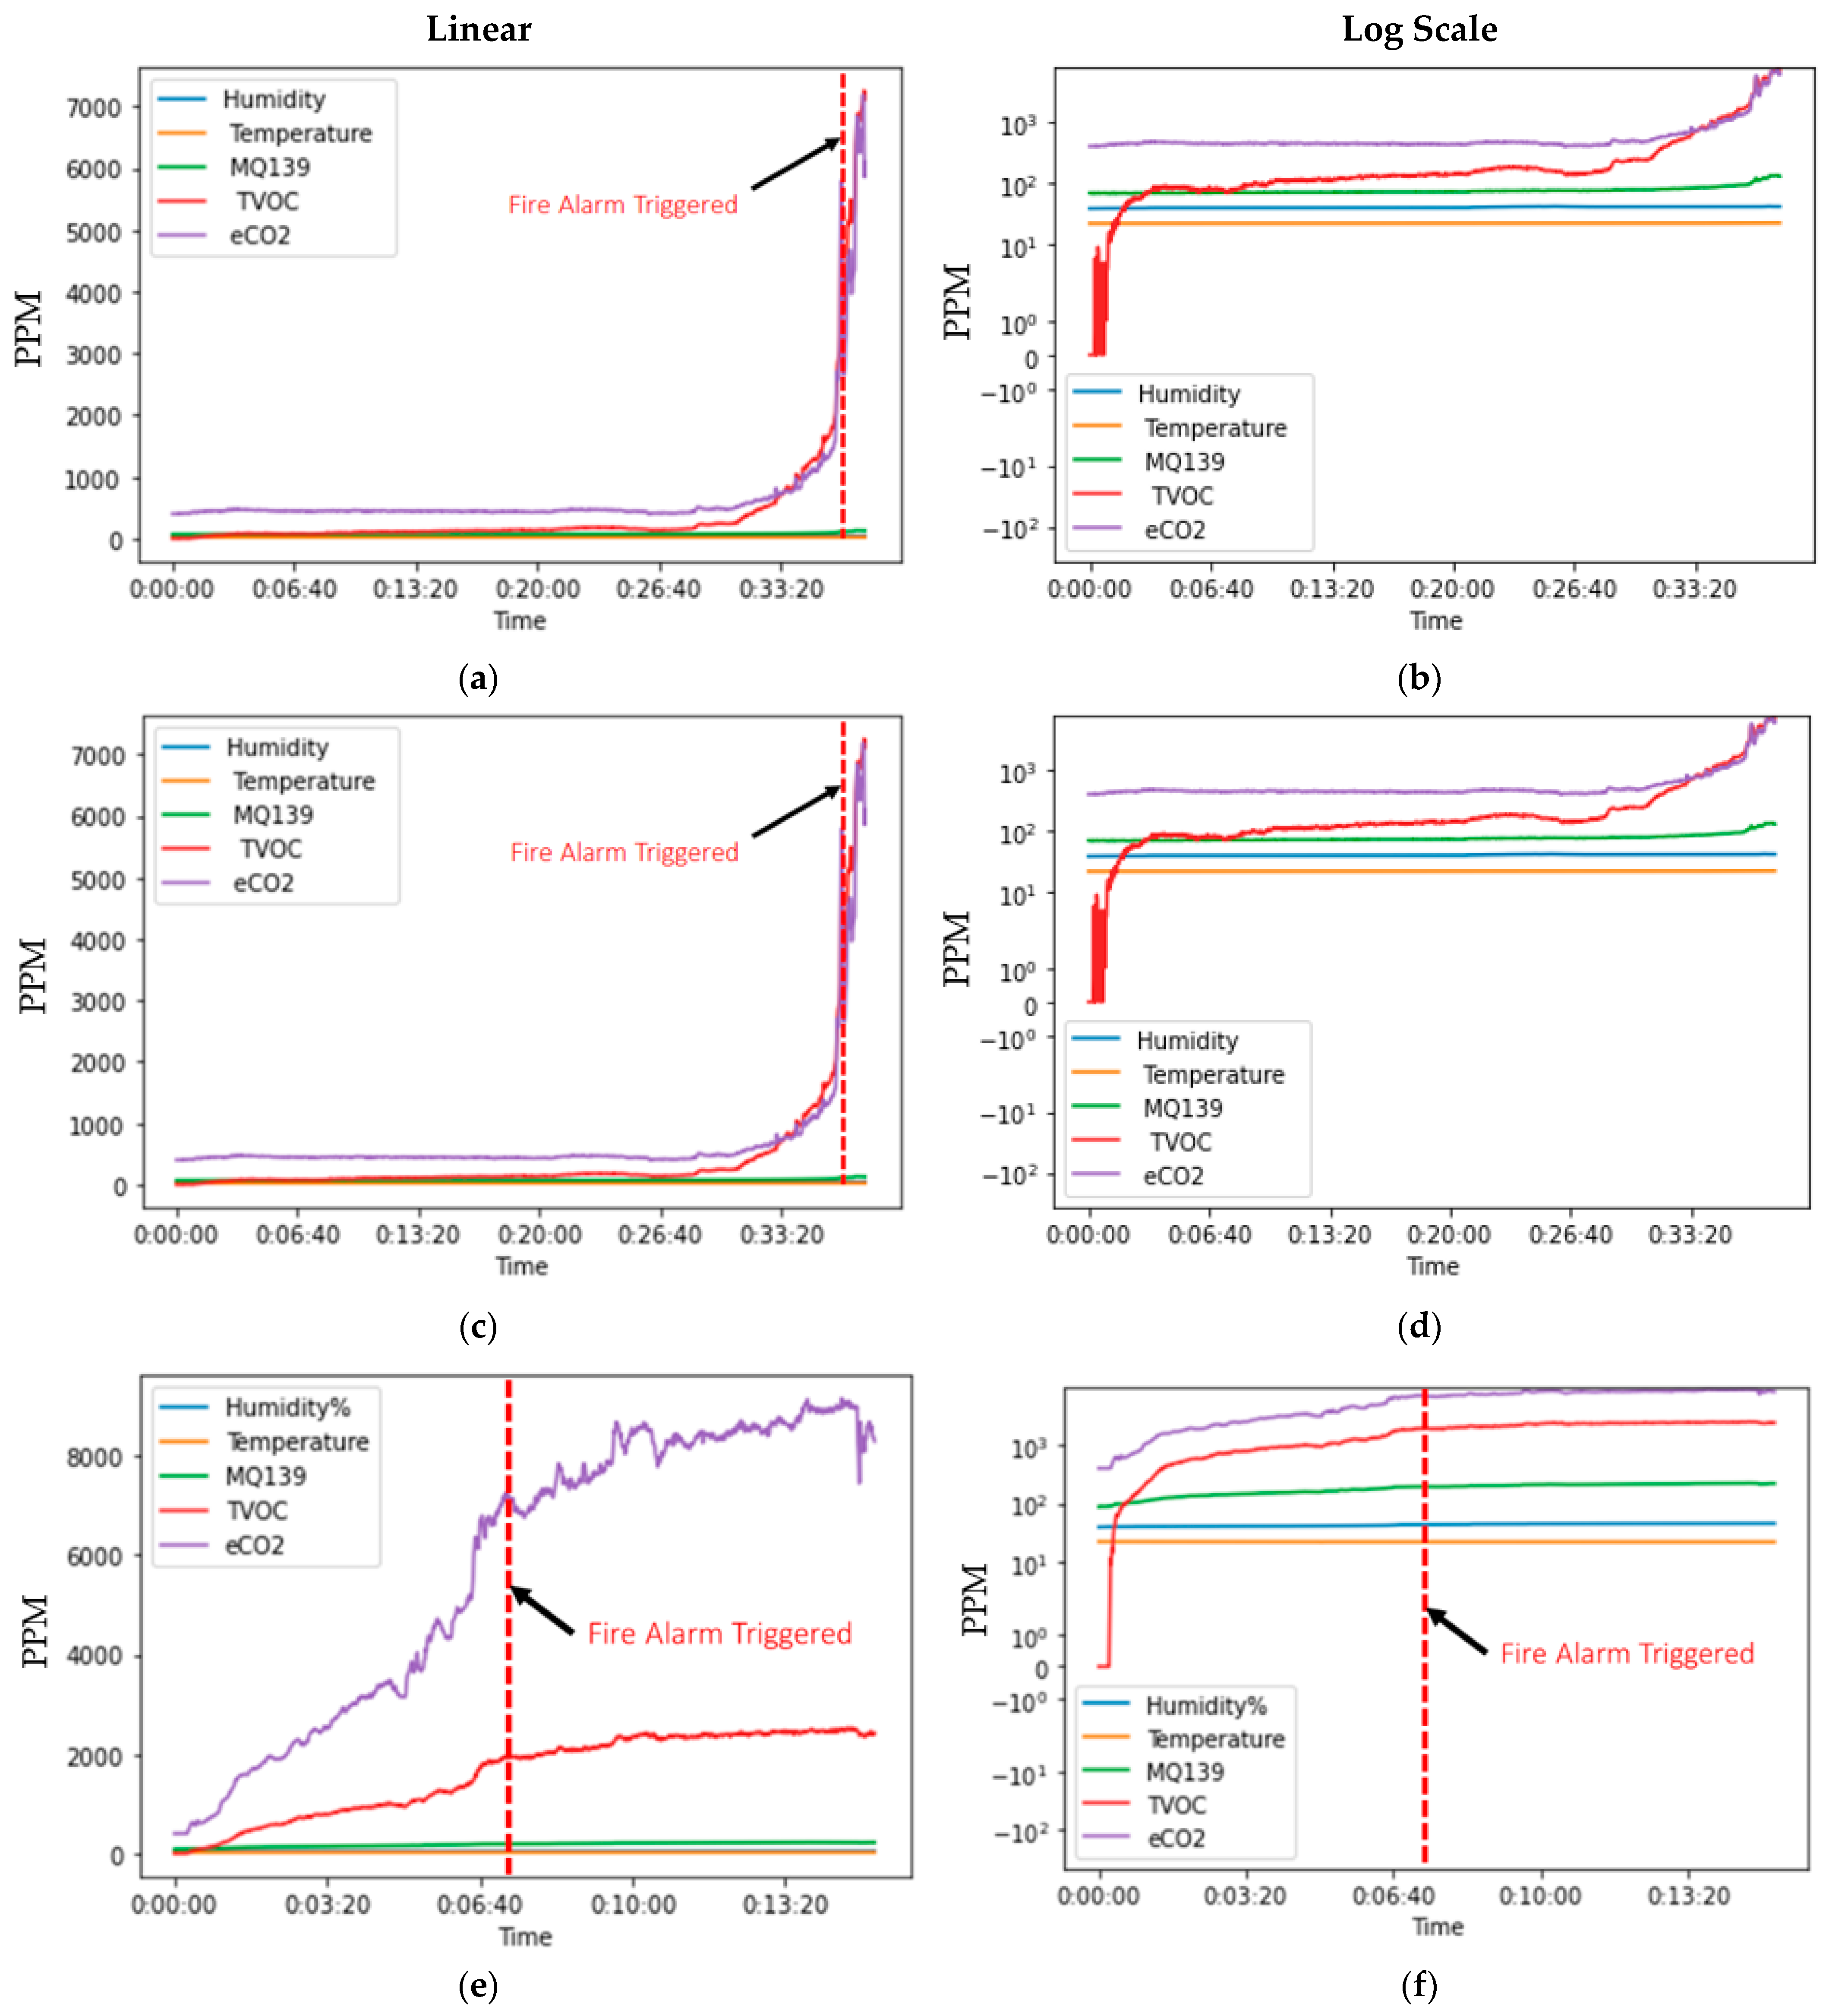
Figure 5.
The eCO2 reading measurements for four different experiments of electric fires.
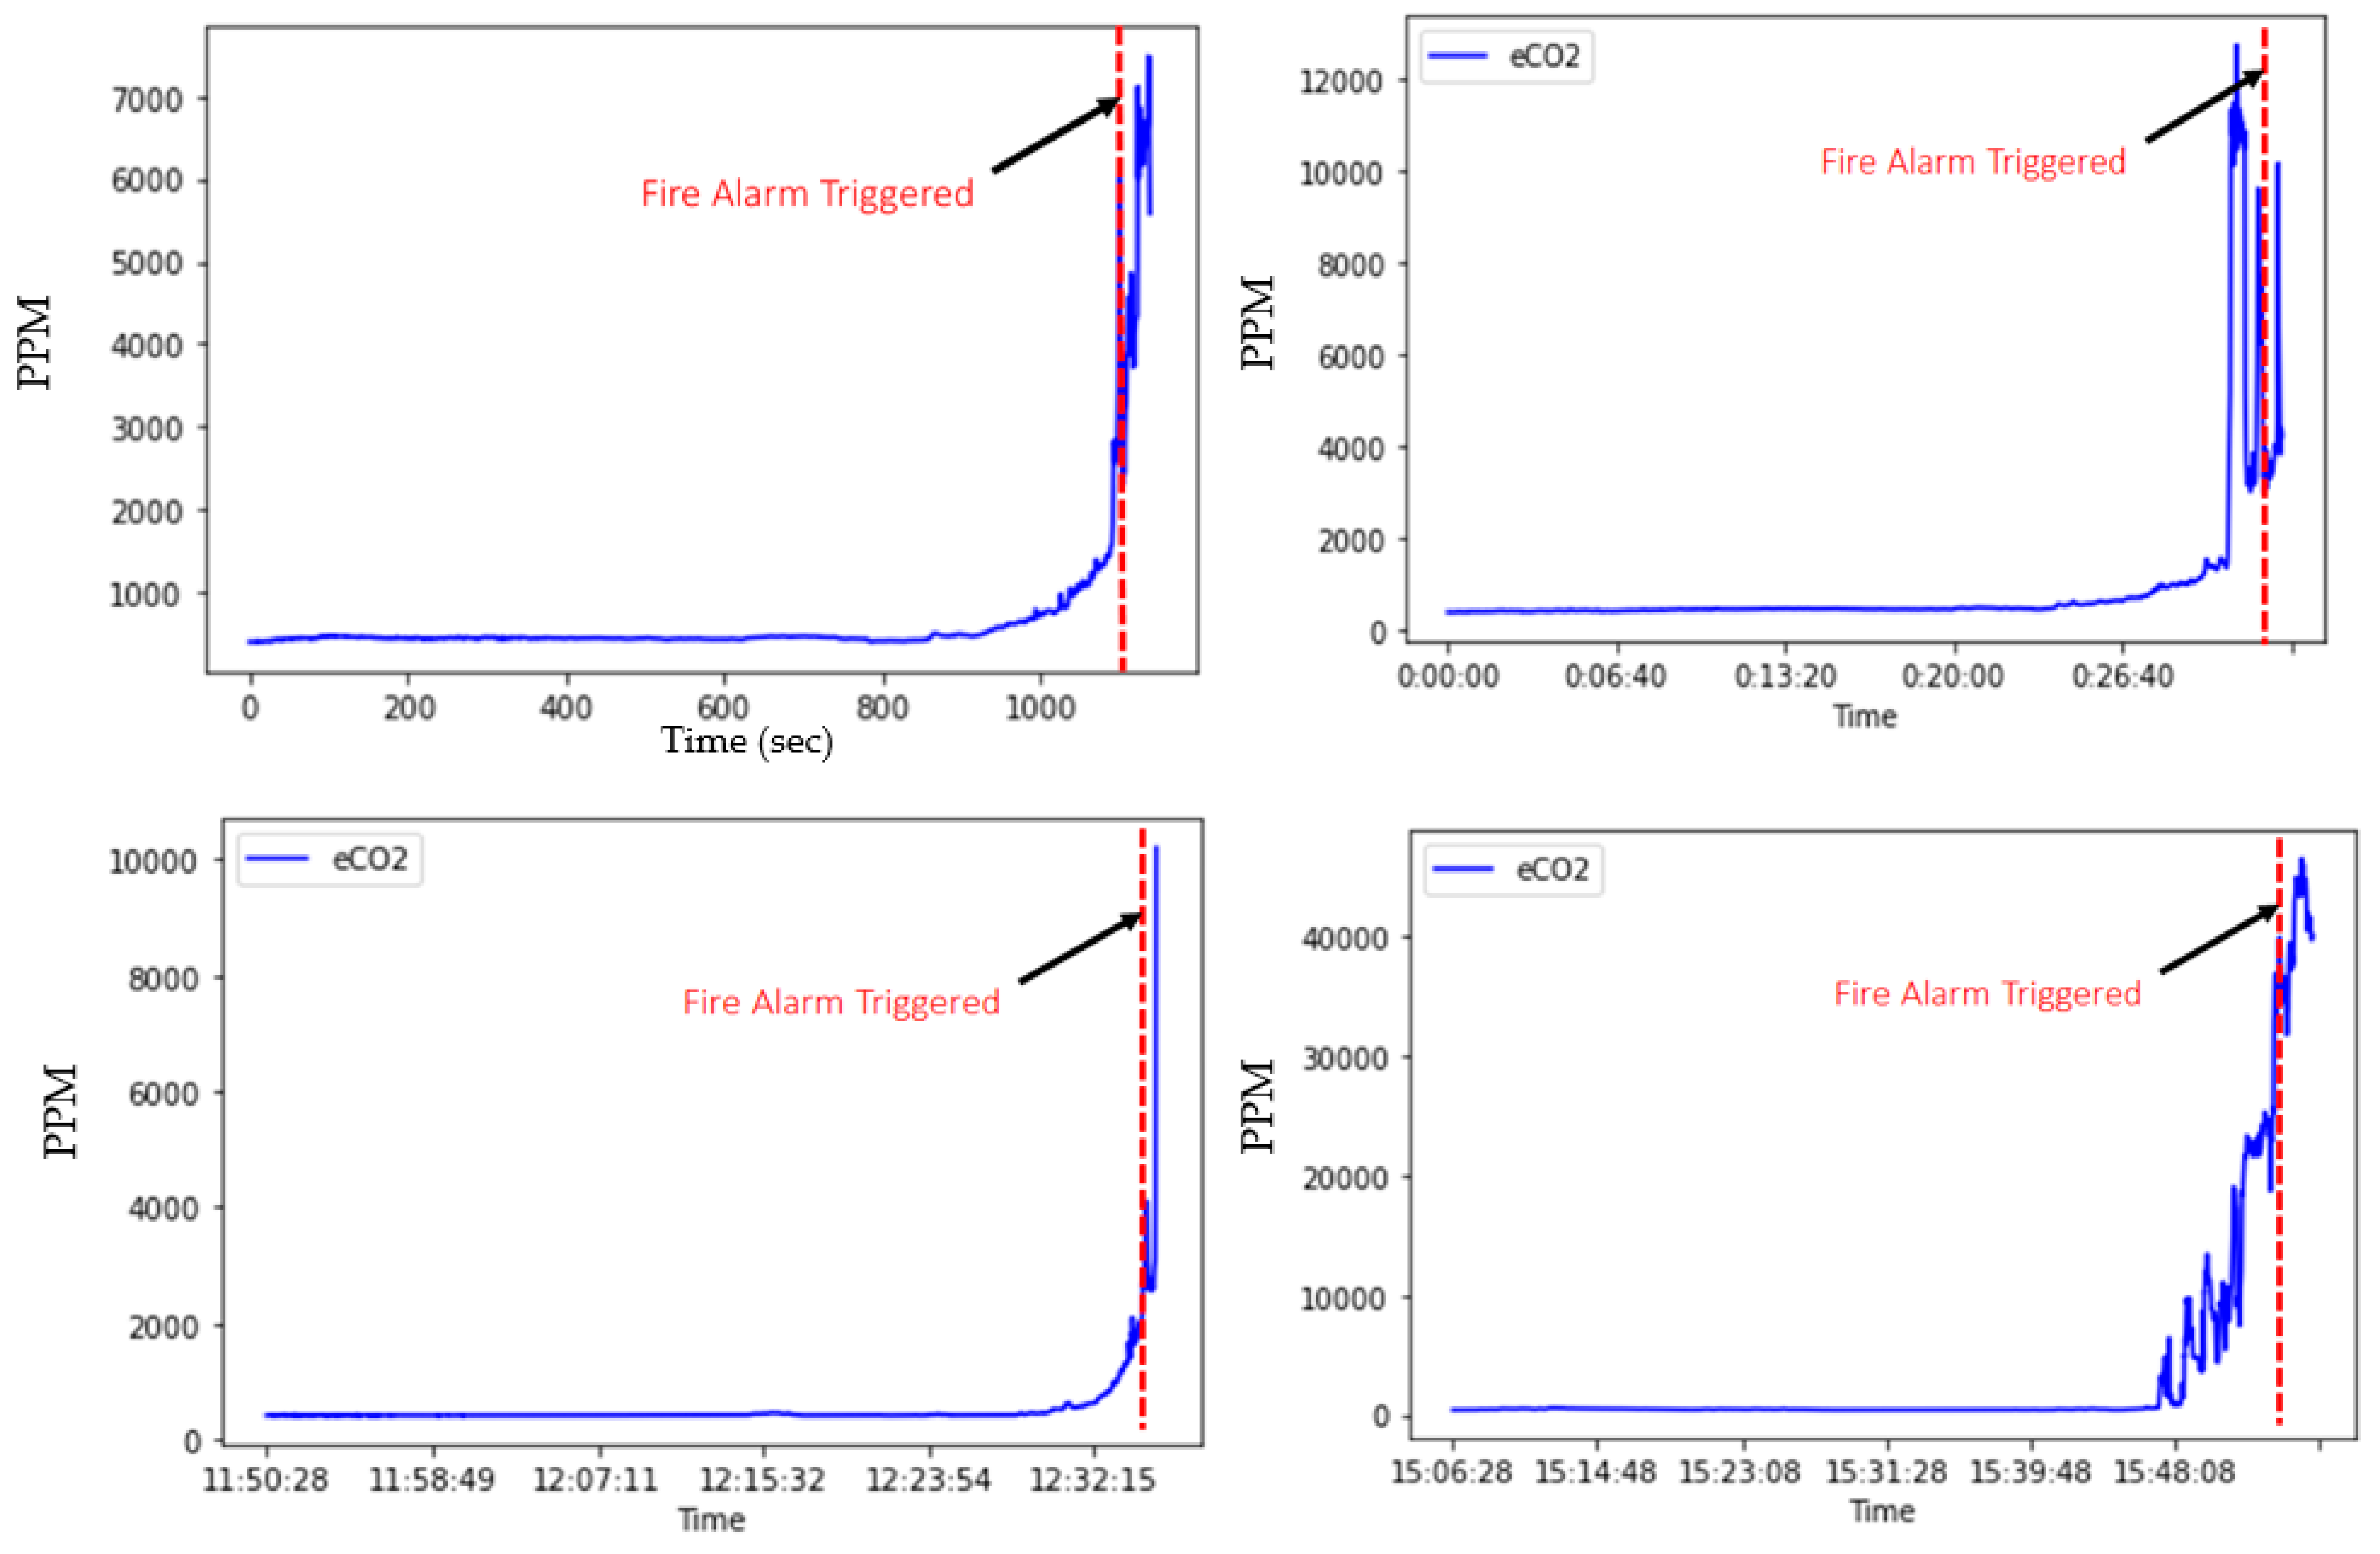
Figure 6.
Both eCO2 and TVOC are strongly correlated with MQ139. When building a machine learning predictive model, one might consider removing one of the strongly correlated features. Based on the conducted variable correlation analysis, MQ139 may be a suitable candidate for removal.
Figure 6.
Both eCO2 and TVOC are strongly correlated with MQ139. When building a machine learning predictive model, one might consider removing one of the strongly correlated features. Based on the conducted variable correlation analysis, MQ139 may be a suitable candidate for removal.
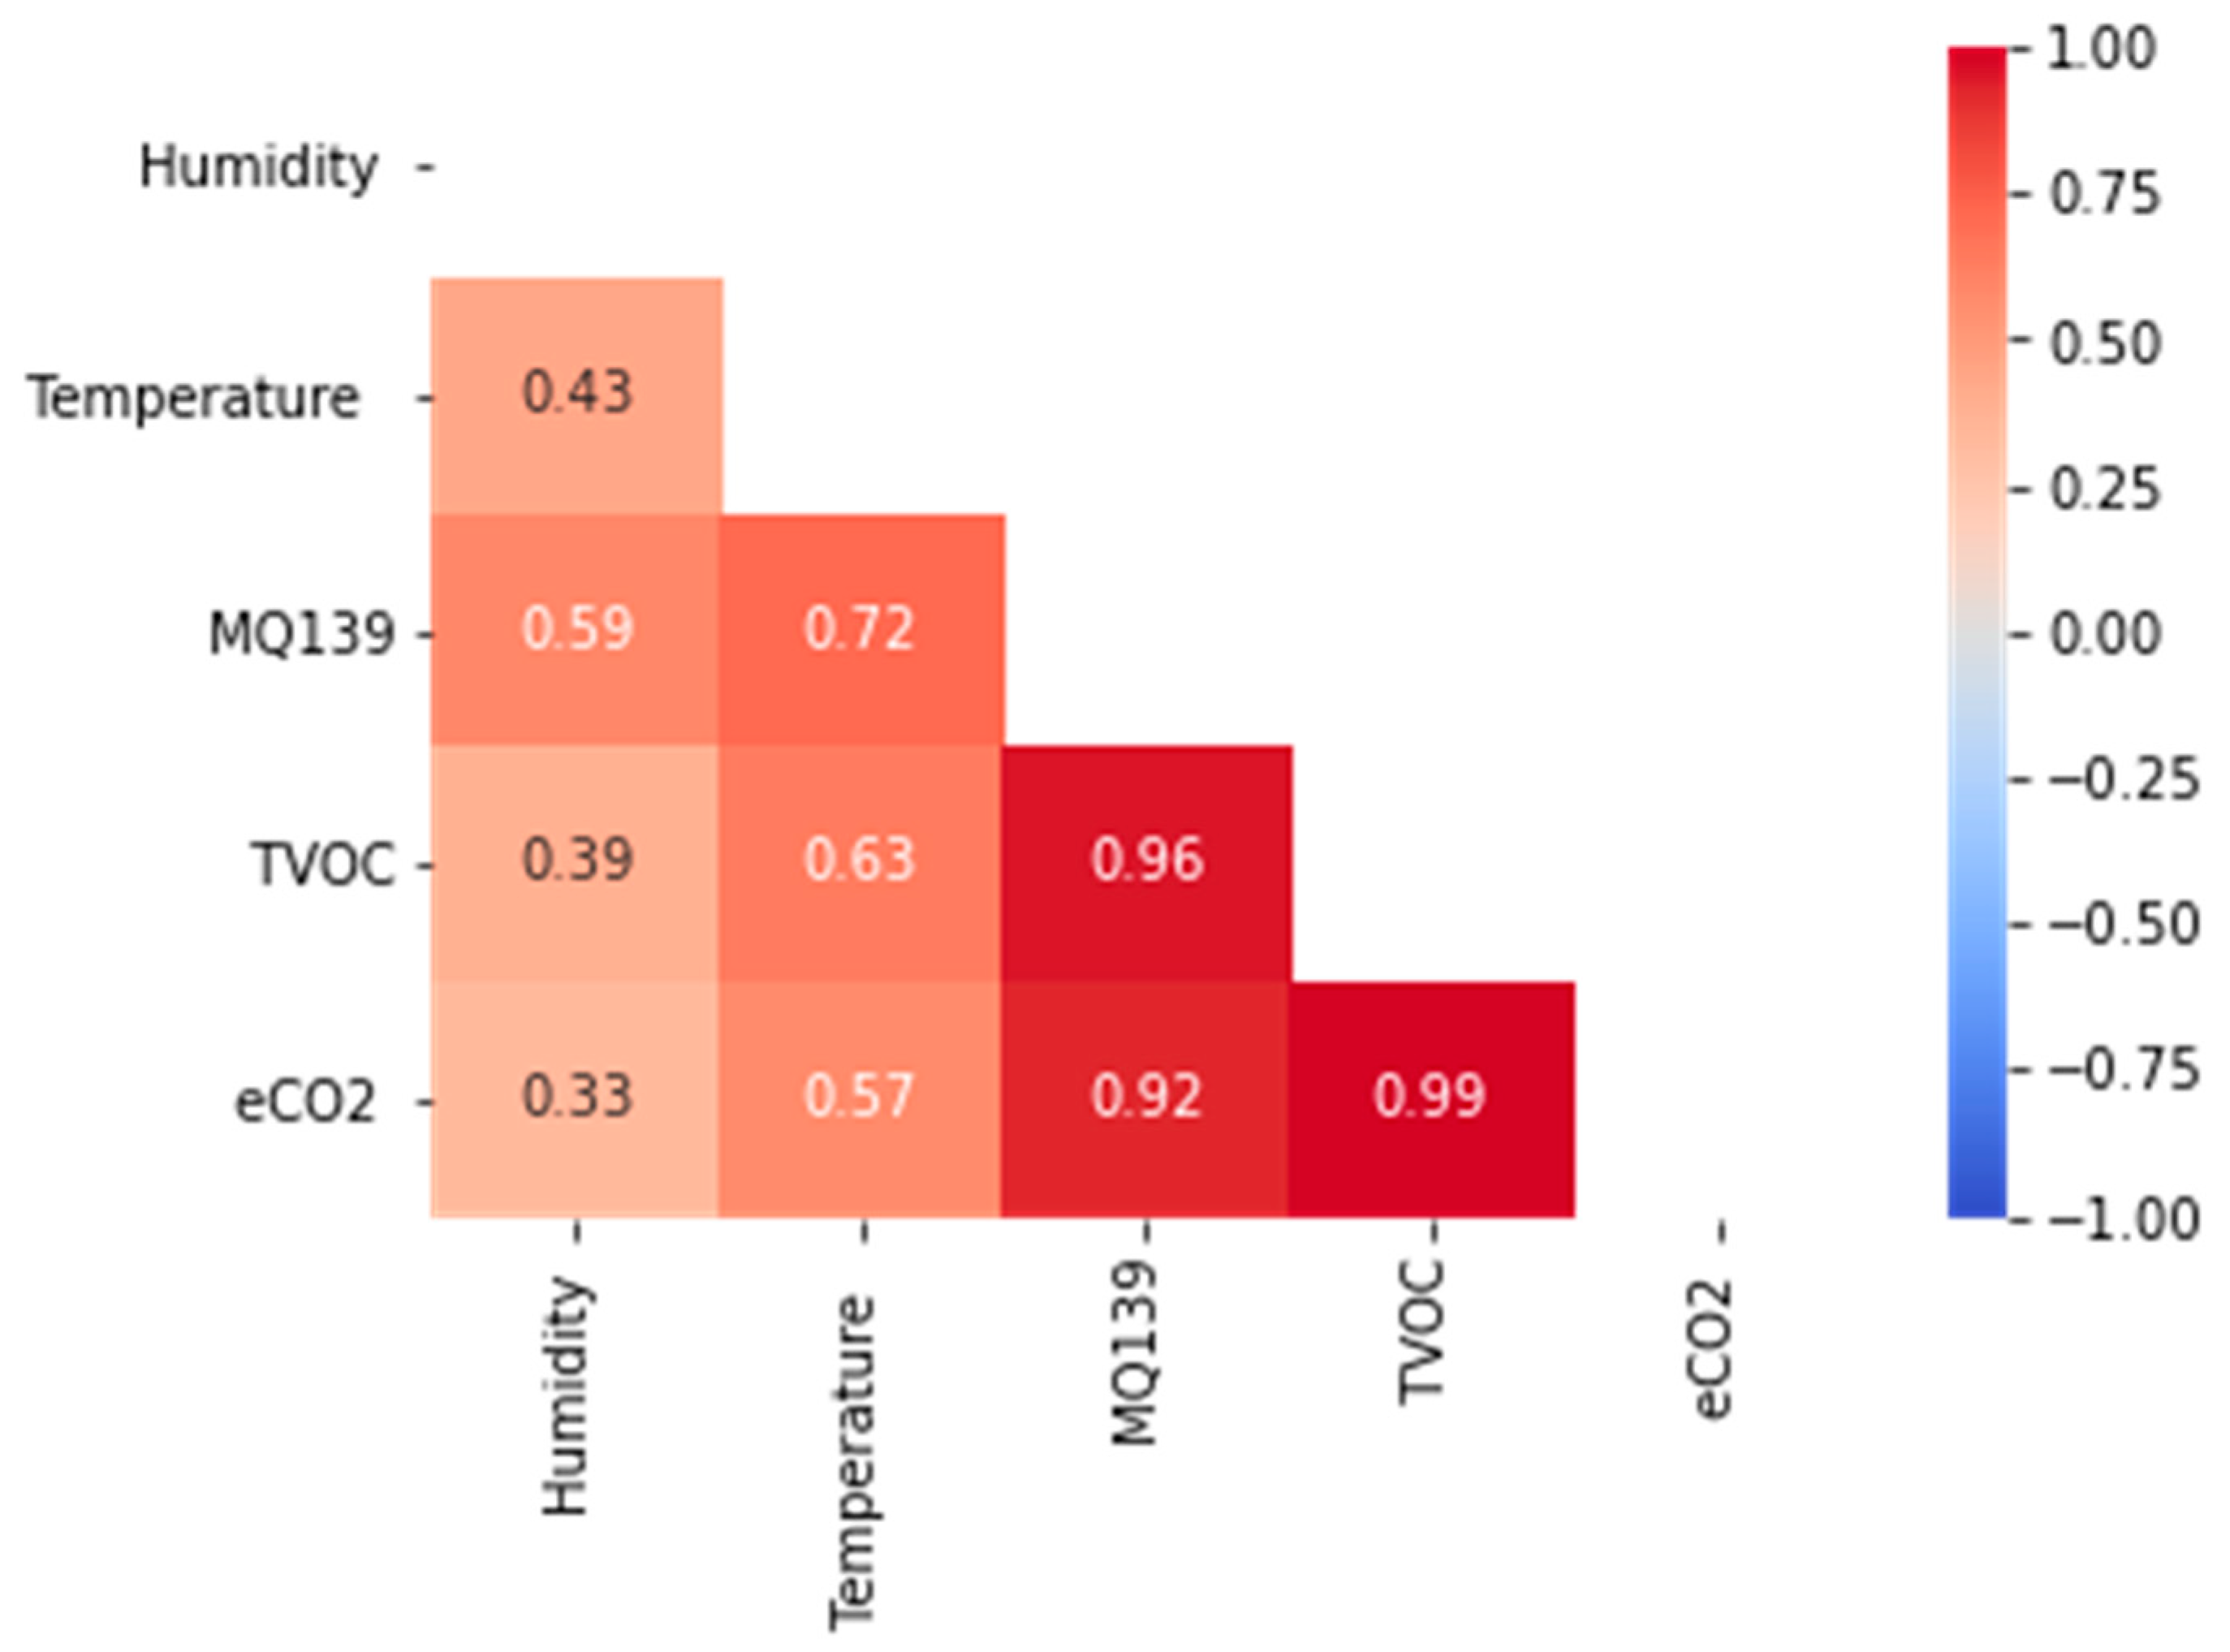
Figure 7.
All the fitted distributions for the eCO2 measurement for each fire source, namely, electrical device/clothing, charcoal/clothing, and charcoal/cardboard (a–f).
Figure 7.
All the fitted distributions for the eCO2 measurement for each fire source, namely, electrical device/clothing, charcoal/clothing, and charcoal/cardboard (a–f).


Table 1.
Time duration for each conducted experiment.
| Title 1 | Title 2 | Title 3 |
|---|---|---|
| Electrical/Clothes | Experiment 1 | 37 min 58 s |
| Experiment 2 | 33 min | |
| Experiment 3 | 12 min 35 s | |
| Experiment 4 | 15 min 56 s | |
| Charcoal/Clothes | Experiment 1 | 15 min 6 s |
| Experiment 2 | 17 min 7 s | |
| Charcoal/Cardboard Paperboard | Experiment 1 | 14 min 12 s |
| Experiment 2 | 17 min 31 s |
Table 2.
For all reading measurements in each fire source (i.e., electrical/cloth, charcoal/cardboards, and charcoal/cloth, we found the best-fitted distributions, including their best parameters.
Table 2.
For all reading measurements in each fire source (i.e., electrical/cloth, charcoal/cardboards, and charcoal/cloth, we found the best-fitted distributions, including their best parameters.
| Source of Fire | Measurement | Best Fitted Distribution | Sum of Square Errors (SSEs) |
|---|---|---|---|
| Electrical/Cloth | eCO2 | Exponentiated Weibull Distribution | 0.00011267029929785147 |
| TVOC | Double Weibull Distribution | 2.708889556679 × 10⁻⁵ | |
| Humidity | Double Weibull Distribution | 366.03915174693213 | |
| Temperature | Double Weibull Distribution | 38157.55591746159 | |
| MQ139 | Power Lognormal Distribution | 0.5513364247530835 | |
| Charcoal/cardboard | eCO2 | Exponentiated Weibull Distribution | 6.986666475369561 × 10⁻⁶ |
| TVOC | Exponentiated Weibull Distribution | 1.4865994920838973 × 10⁻⁵ | |
| Humidity | Beta Distribution | 1236.9933162581392 | |
| Temperature | Beta Distribution | 103053.45783803816 | |
| MQ139 | Power Law Distribution | 0.10289974506654861 | |
| Charcoal/Clothing | eCO2 | Log Gamma Distribution | 2.788708658959186 × 10⁻⁶ |
| TVOC | Log Gamma Distribution | 3.8246971469792034 × 10⁻⁵ | |
| Humidity | Log Gamma Distribution | 29.494137424567498 | |
| Temperature | Double Weibull Distribution | 44790.0445294828 | |
| MQ139 | Pearson type (PT) III distribution | 0.02046073738554408 |
Publisher’s Note: MDPI stays neutral with regard to jurisdictional claims in published maps and institutional affiliations. |
© 2022 by the authors. Licensee MDPI, Basel, Switzerland. This article is an open access article distributed under the terms and conditions of the Creative Commons Attribution (CC BY) license (https://creativecommons.org/licenses/by/4.0/).
Share and Cite
MDPI and ACS Style
Nazir, A.; Mosleh, H.; Takruri, M.; Jallad, A.-H.; Alhebsi, H. Early Fire Detection: A New Indoor Laboratory Dataset and Data Distribution Analysis. Fire 2022, 5, 11. https://doi.org/10.3390/fire5010011
AMA Style
Nazir A, Mosleh H, Takruri M, Jallad A-H, Alhebsi H. Early Fire Detection: A New Indoor Laboratory Dataset and Data Distribution Analysis. Fire. 2022; 5(1):11. https://doi.org/10.3390/fire5010011
Chicago/Turabian StyleNazir, Amril, Husam Mosleh, Maen Takruri, Abdul-Halim Jallad, and Hamad Alhebsi. 2022. "Early Fire Detection: A New Indoor Laboratory Dataset and Data Distribution Analysis" Fire 5, no. 1: 11. https://doi.org/10.3390/fire5010011