


Simulation of Damage Caused by Oil Fire in Cable Passage to Tunnel Cable

1
State Grid Anhui Electric Power Co., Ltd., No. 9 Huangshan Road, Baohe District, Hefei 230061, China
2
Electric Power Research Institute, State Grid Anhui Electric Power Co., Ltd., 299 Ziyun Road, Economic and Technological Development Zone, Hefei 230601, China
3
Hefei Power Supply Company, State Grid Anhui Electric Power Co., Ltd., No. 133 Susong Road, Baohe District, Hefei 230022, China
*
Author to whom correspondence should be addressed.
Fire 2024, 7(4), 147; https://doi.org/10.3390/fire7040147
Submission received: 18 December 2023
/
Revised: 8 April 2024
/
Accepted: 10 April 2024
/
Published: 19 April 2024
(This article belongs to the Special Issue Cable and Electrical Fires)
Abstract
:In order to evaluate the damage to tunnel cables caused by fire caused by leakage of transformer oil into a cable channel, the fire characteristics of different volumes of transformer oil flowing into a cable channel were analyzed by numerical simulation. The results show that when the total leakage of transformer oil is less than or equal to 3 L, the fire will end within 120 s, and when the total leakage is greater than or equal to 5 L, the fire duration will exceed 900 s. When the leakage amount is 1 L, the cable only burns slightly, and when the leakage amount is 3~12 L, the cable burns obviously. The combustion of the cable is mainly concentrated between 15 s and 75 s, and the overall combustion rate of the cable increases first and then decreases. When the total leakage is greater than or equal to 8 L, the damage distance of the middle and lower layer cable is the smallest. When the total leakage is less than or equal to 5 L, the damage distance of the lower layer cable is the smallest, and the damage distance of the lower layer cable, middle and lower layer cable, and middle and upper layer cable is less than half of the length of the cable channel.
1. Introduction
With the development of the economy and the increase in urban residents, the demand for industrial production and daily electricity in various regions of China is also increasing. The transmission lines arranged in the past cannot meet the demand for electricity today, so it is urgent to add more transmission lines to ensure the normal operation of social and economic life. In the past, power transmission lines were often laid as overhead lines. However, due to the development of urban construction and the increasing density of population distribution in China’s cities, there is a serious shortage of land resources, leading to a direct contradiction between power transmission resources and land resources. Therefore, the method of transmitting power in the form of cable channels has gradually come into people’s view. On one hand, overhead lines occupy ground space and are prone to problems such as aging, damage, and difficult maintenance due to exposure to the open air and height. On the other hand, compared to overhead lines, underground cable channels have the advantages of convenient power operation and maintenance, minimal ground space occupation, and reduced risk of cable damage, leading to an increase in the construction of underground cable channels.
The increase in the number of cable channels has also brought attention to the fire hazards associated with cable channels. Currently, a large number of power cables and communication cables are laid through underground cable channels, and some cable channels are arranged near transformers due to site and power transmission requirements, such as the terminal and end of transmission and transformation, which inevitably require proximity to transformers. However, transformer fires occur frequently [1,2], and due to limitations in current technology, transformers worldwide still use oil storage for insulation and cooling, posing a risk of oil ignition. Once deflagration occurs, burning transformer oil may flow into the cable channel and ignite the cables concentrated within, potentially leading to the spread of fire along the cable channel.
Due to the high cost of physical experiments on the spread of fire in cable passages, numerical simulation methods are primarily used for research [3,4,5,6,7,8]. Relevant scholars at home and abroad have carried out some research on cable passage fires, but the research scenarios are mostly limited to cable fault combustion in common cable passages and cable combustion in underground pipe corridors, and there are relatively few studies on the combustion of oil, especially transformer oil, into cable passages. In view of this situation, this paper uses numerical simulation to simulate fire in a cable channel caused by transformer oil, taking a cable channel as an example, in order to evaluate the damage to the tunnel cable caused by the fire caused by leaking transformer oil into the cable channel.
2. Model Building
2.1. Cable Channel Prototype and Simplified Physical Model
2.1.1. Cable Tunnel Prototype
The prototype to be studied is a cable channel near a transformer in China, and its cross-section design is shown in Figure 1. The section size of the cable channel is 1 m × 1.1 m. Eight cables are placed, and four cables are arranged on the left and right sides. The four layers of cables are defined as the lower layer cables, lower layer cables, upper layer cables, and upper layer cables from the bottom up. Two drainage ditches for ventilation are provided on the lower side of the cable passage. A firewall is installed every 60 m in the cable channel, so every 60 m is a fire protection zone. The cable is a crosslinked polyethylene (XLPE) flame retardant cable, and the flame retardant cable is placed in the cable channel in the form of a cable bundle with multiple cables, as shown in Figure 1.
2.1.2. Physical Model
A fire protection zone is considered, so the cable channel model length is 60 m, the section size is 1000 mm × 1100 mm, and the cable bracket width is 300 mm. The main fuel in the cable channel is the cable. Ignore other facilities in the cable channel. Considering the drainage ditch and its ventilation function, the equivalent area method is used to simplify the cable trench and cable. The physical simplification model is shown in Figure 2.
2.2. Cable Channel Prototype and Simplified Physical Model
The FDS (Fire Dynamics Simulator) software developed by NIST of the United States Institute of Standards and Technology (Gaithersburg, MD, USA) is used for simulation. FDS can describe the problem of low Mach number gas flow and can well solve the problems of temperature, heat flux, heat release rate, visibility, and combustion product concentration changes with the development of fire. Based on the three conservation equations of mass (component), momentum, and energy, as well as basic fluid dynamics equations such as the ideal gas equation, the region in the calculation grid is calculated, and the Arrhenius formula is used to calculate the combustion chemical reaction [9]. The details are as follows:
where is gas density (kg/m3); is the velocity vector (m/s); is the gravitational acceleration (m/s2); is the external force vector (N); is the Newtonian viscous stress tensor (N); is the sensible enthalpy (J/kg); is the pressure (Pa); is the heat release rate per unit volume (W/m3); is the heat flux vector (W/m2); is the temperature (K); is the dissipation function; is the ideal gas constant; is the relative molecular mass of the gas mixture; is the initial density of the s layer (kg/m3); is the density of component i in the s layer (kg/m3); refers to the pre-factor (1/s); is the activation energy (kJ/mol); is the mass fraction index of the s layer; and indicates the temperature of layer s (°C).
2.3. Fire Scenario Analysis
Consider burning transformer oil leaking into the cable channel and causing a fire. The leakage of burning transformer oil into the cable channel is caused by transformer deflagration, splashing, jets, and other uncertain situations, so the leakage location, leakage area, and leakage amount of burning transformer oil into the cable channel are difficult to determine. Therefore, in this study, it is assumed that the leakage center of the transformer oil burned in each working condition is the center of the cable channel (30 m away from one end of the channel), the diffusion area of the transformer oil is 1 m2, the leakage rate is equal to the burning rate of the transformer oil in an area of 1 m2, and the total leakage of the transformer oil increases from 1 L to 12 L according to different working conditions. They are 1 L, 3 L, 5 L, 8 L, 10 L, and 12 L. Since the diffusion area is constant, the total leakage can be controlled by the thickness change of the transformer oil.
2.4. Fire Source and Combustion Model
Assuming that the only possible combustibles in the cable channel are cables and the transformer oil leaking into the cable channel, the simulated initial fire source is the transformer oil, and other combustibles in the cable channel are cables.
The transformer oil in the transformer near a cable channel is KI50X transformer oil, and the heat of evaporation and combustion are 364.9 KJ/kg and 4.51 MJ/kg, respectively [10,11]. The combustion process of transformer oil is simplified to a process in which transformer oil evaporates into oil steam and oil steam continues to burn, and the combustion chemical reaction adopts the Arrhenius formula [9].
Most of the cables laid in the cable channel are flame-retardant crosslinked polyethylene cables, so their reactants are mainly crosslinked polyethylene. Therefore, referring to previous results [12], the ratio of copper to XLPE is assumed to be 6:4, and the specific heat capacity, thermal conductivity, and density of copper and XLPE are set according to [13]. For chemical reaction kinetic parameters, referring to previous experimental results [14], the pre-factor, apparent activation energy, and mass fraction index were set as 2 × 10²² (1/s), 317 (KJ/mol), and 0.8, respectively. The location of the cable bundle is the same as in the simulation prototype.
2.5. Grid Sensitivity Analysis
In FDS, the size of the grid determines the simulation accuracy and calculation time, and the simulation accuracy and calculation time are inversely proportional to the mesh size. In order to make the grid size set more reasonable, it is necessary to analyze the sensitivity of the grid to make the simulation results reasonable enough. According to the calculation method in The FDS User Guide [9], a more reasonable range of mesh size can be obtained, and the relevant formula is as follows:
where is the ambient air density, which is 1.1164 kg/m3 in this study; is the specific heat capacity of air in the environment, which is 1.013 kJ/(kg·K) in this study; is the temperature of the environment, which is 293 K in this study; is the acceleration of gravity, which is 9.8 m/s2 in this study; is the heat release rate of the fire source—the size is set according to the fire source, and the unit is kJ/s (kW); and is the characteristic diameter of the fire, expressed in m.
where represents the size of the grid, and is the recommended coefficient, generally between 4 and 16.
Since the transformer oil simulated into the cable channel is KIX50 transformer oil, according to the experimental data [15,16], the maximum heat release rate per unit area of a 100 mm × 100 mm oil pan is HRRPUA = 783.26 kW/m2. Since the area of the transformer oil in the simulation is 1 m, the heat release rate of the fire source is 783.26 kW. By bringing the data into the above equation, it can be concluded that is about 0.879 m and 0.05 m ≤ δx ≤ 0.21 m. In order to improve the simulation accuracy, the mesh size in this study is set to 0.1 m × 0.1 m. In particular, it should be noted that in this paper, the cable will have a combustion reaction, and the combustion process is controlled by the above parameters.
3. Results and Discussion
3.1. Influence of Leakage on the Fire Process of Cable Passage
The influence of leakage on the fire process of the cable channel is analyzed through the heat release rate, the change in average oxygen concentration, the burning rate of the cable, and the burning rate of the transformer oil. The change in heat release rate and average oxygen concentration in each working condition is shown in Figure 3, and the burning rate of the cable and transformer oil in each working condition is shown in Figure 4.
According to the curve of heat release rate, the fire under each working condition did not have an obvious full combustion period after a short growth period but directly entered a decline period, and the heat release rate reached about 2800 KW at the beginning of the simulation and then dropped rapidly. When the leakage amount is 3~12 L, the heat release rate will rise by about 500 KW after the decline and then continue to decline, but when the leakage amount is 1 L, the heat release rate does not rise significantly and continues to decline. When the leakage amount is 1 L and 3 L, respectively, the heat release rate decreases to 0 about 30 s and 120 s after the simulation, indicating that there is no combustion in the cable channel with this leakage amount. When the leakage amount is 5 L, 8 L, 10 L, and 12 L, the heat release rate decreases to below 100 kW after 160 s, 180 s, 210 s, and 230 s, and then starts to fluctuate up and down until the end of the simulation. According to the change in heat release rate, when the leakage amount of the transformer oil is less than or equal to 3 L, the fire will end within 120 s, and when the leakage amount is greater than or equal to 5 L, the duration of the fire will exceed 900 s.
As can be seen from the average oxygen concentration curve, when the leakage is 1 L and 3 L, the oxygen concentration on the whole first drops to the lowest value and then slowly rises to the end of the simulation. When the leakage is 1 L and 3 L, the oxygen concentration decreases to about 0.12 mol/mol and 0.015 mol/mol at about 20 s and 100 s, respectively. Then it slowly rose to about 0.15 mol/mol and 0.05 mol/mol, respectively, until the end of the simulation. When the leakage is 5 L, 8 L, 10 L, and 12 L, respectively, the oxygen content in the entire cable channel gradually decreases with the combustion of the cable, and the oxygen concentration decreases from 0.21 mol/mol to about 0.01 mol/mol after 130 s, 120 s, 110 s, and 105 s, respectively, and then begins to fluctuate up and down until the end of the simulation.
From the point of view of the cable burning rate, when the leakage is 1 L, the cable burning rate is very low, and only slight combustion occurs. When the leakage amount is 3~12 L, the cable appears to have obvious combustion; the combustion of the cable is mainly concentrated between 15 s and 75 s, and the overall burning rate of the cable shows a trend of first rising and then decreasing.
From the point of view of the burning rate of the transformer oil, at the beginning of the fire, the burning rate of the transformer oil in each working condition rapidly increased to about 0.12 kg/s, then quickly dropped to 0.3 kg/s, showing a slight recovery, and then began to continue to decline in volatility until the end of the simulation. When the leakage amount is 1 L and 3 L, respectively, the burning rate of the transformer oil is reduced to 0 kg/s at about 28 s and 110 s, respectively. When the leakage is 5~12 L, the burning rate of the transformer oil slowly decreases to about 0.01 kg/s and fluctuates up and down until the end of the simulation.
By comparing the burning rate of the cable and the transformer oil, it can be found that the burning time of the cable is within 75 s after the fire, and the main fuel in the subsequent fire is the transformer oil. Combined with the heat release rate curve and the change in average oxygen concentration, we can see the development process of the fire caused by the transformer oil entering the cable channel. Due to the combustion of the transformer oil, the oxygen near the transformer oil is rapidly consumed. If the transformer oil is insufficient, the cable will only burn slightly after the transformer oil is exhausted. If the transformer oil is sufficient, it will ignite the cable in the cable channel. With the reduction in oxygen concentration, the combustion of the cable and the transformer oil is suppressed, and after a period of time, the cable no longer burns, and only the transformer oil burns in the cable channel.
By comparing the burning rate of the cable and the transformer oil, it can be found that the burning time of the cable is within 75 s after the fire, and the main fuel in the subsequent fire is the transformer oil. Combined with the heat release rate curve and the change in average oxygen concentration, we can see the development process of the fire caused by the transformer oil entering the cable channel. Due to the combustion of the transformer oil, the oxygen near the transformer oil is rapidly consumed. If the transformer oil is insufficient, the cable will only burn slightly after the transformer oil is exhausted. If the transformer oil is sufficient, it will ignite the cable in the cable channel. With the reduction in oxygen concentration, the combustion of the cable and the transformer oil is suppressed, and after a period of time, the cable no longer burns, and only the transformer oil burns in the cable channel.
3.2. Assessment of Cable Damage Range Caused by Fire
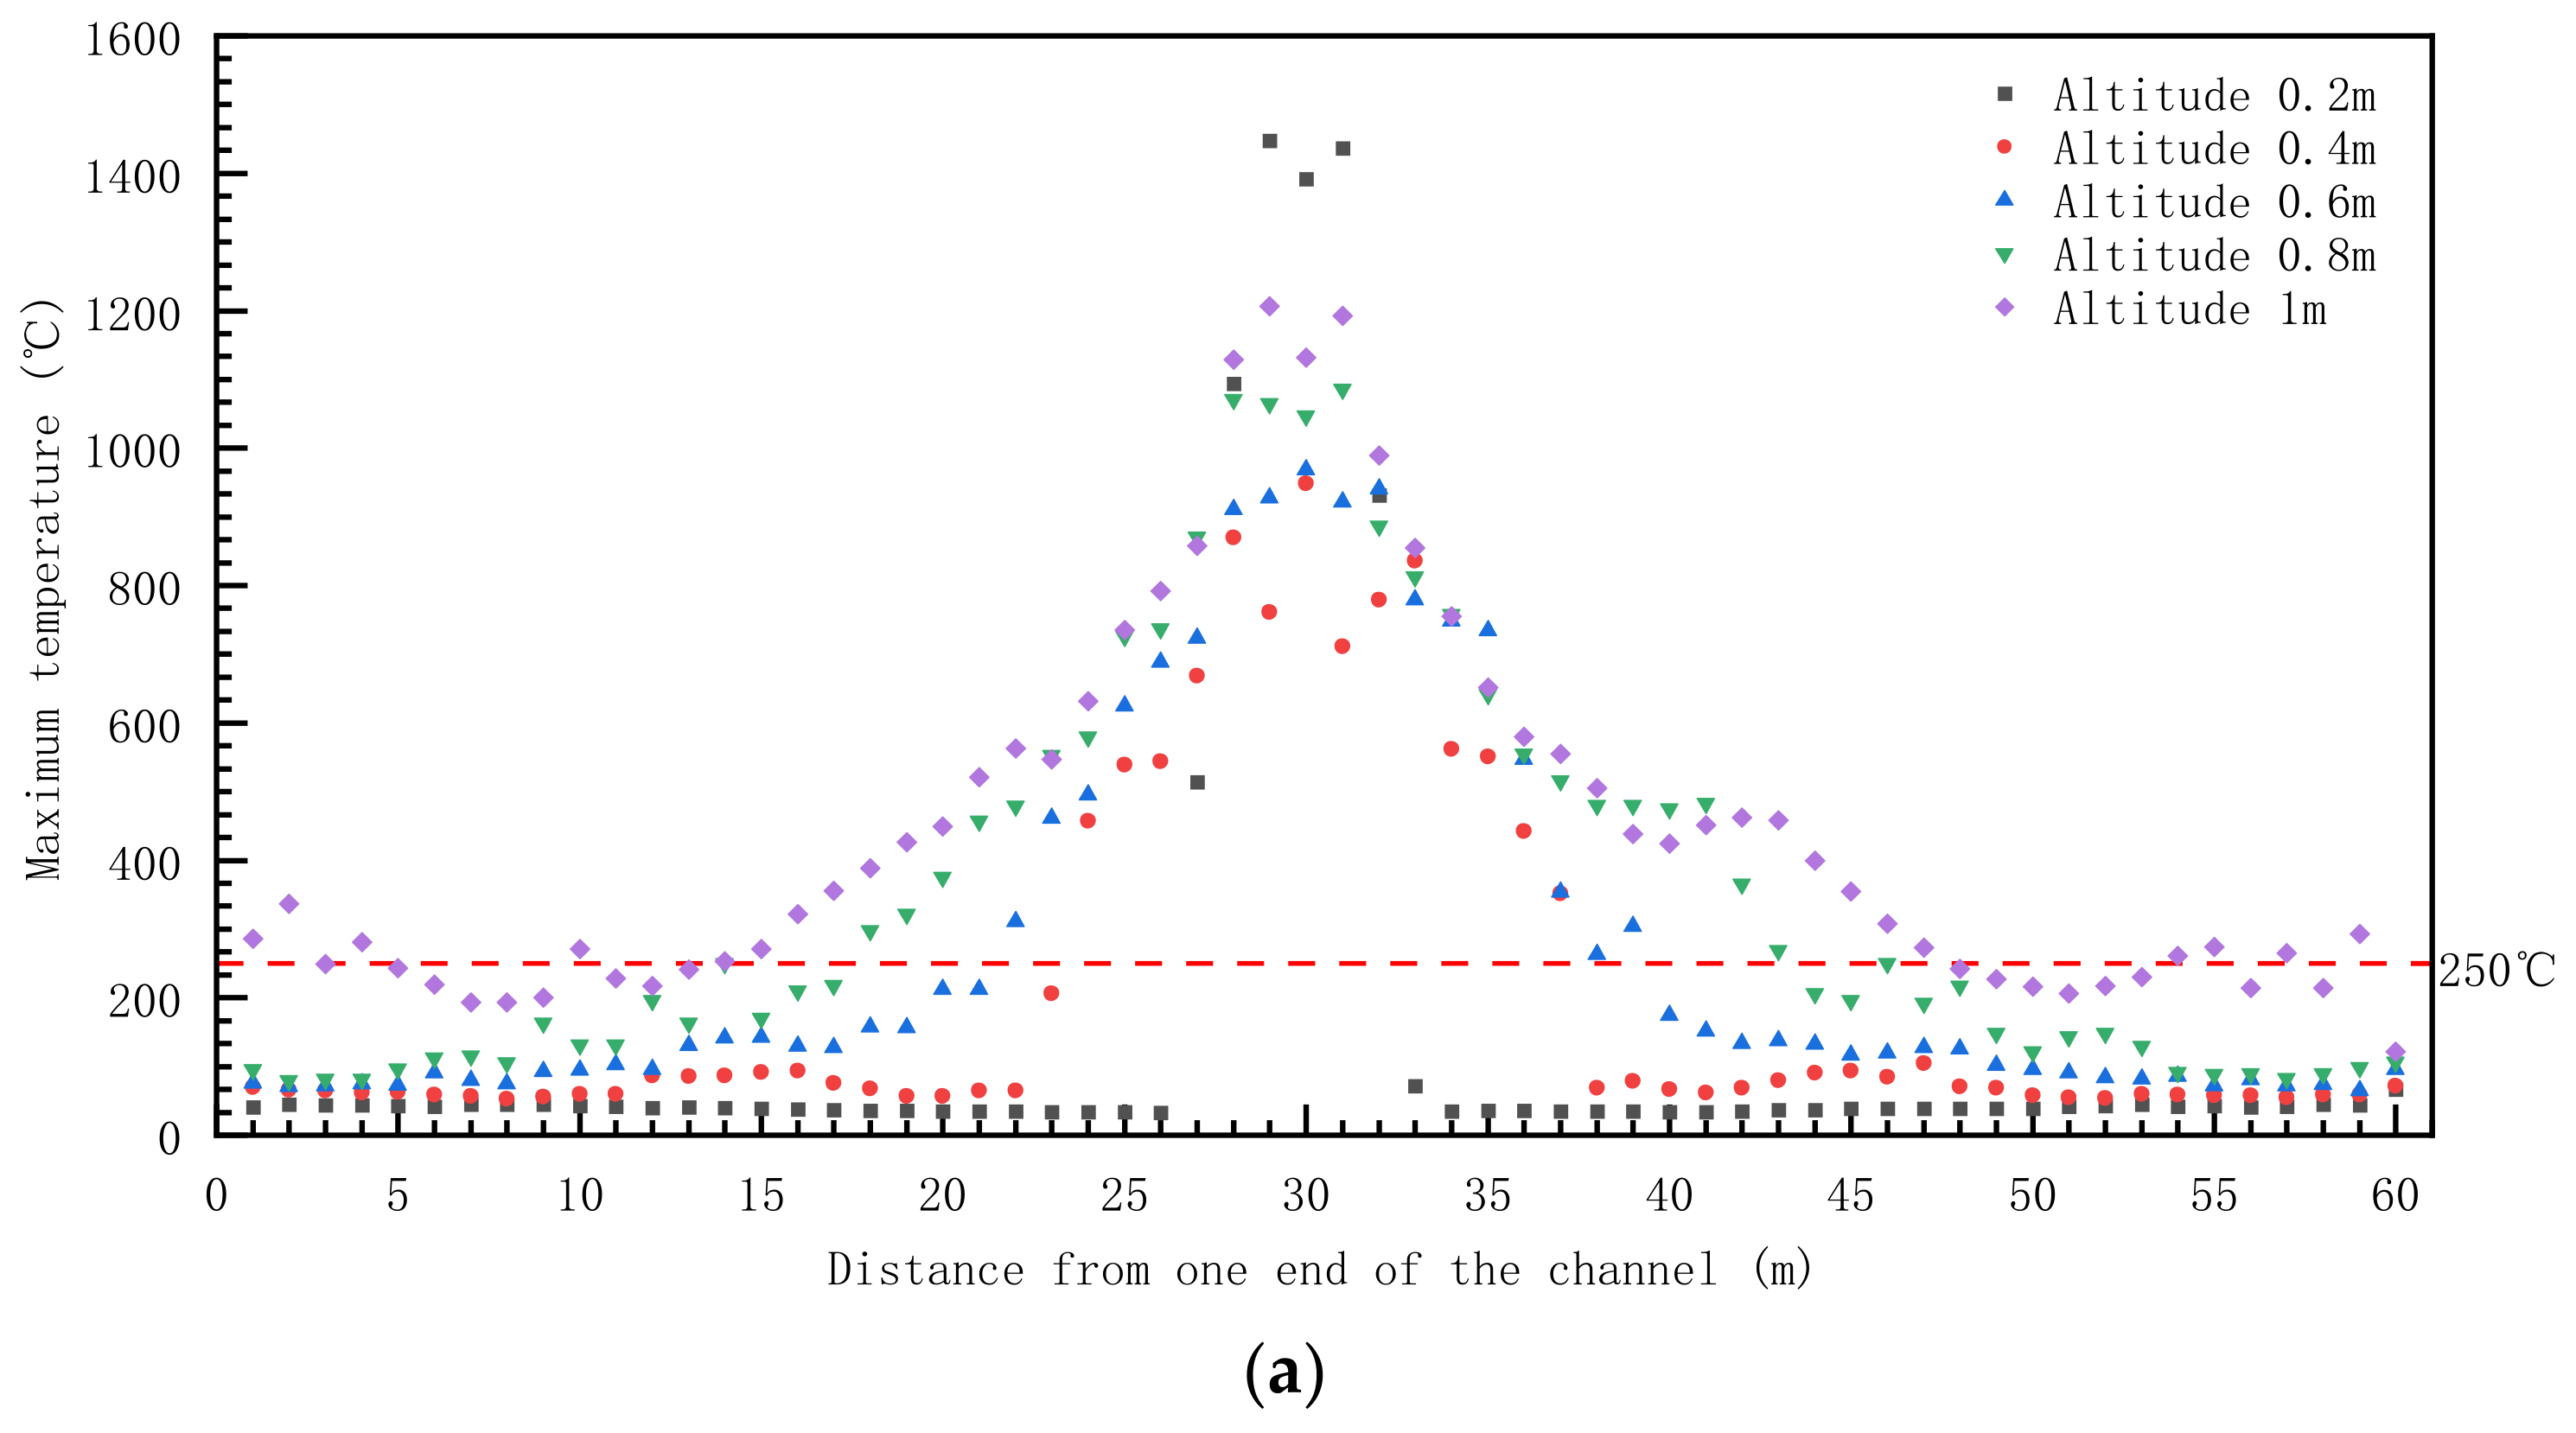
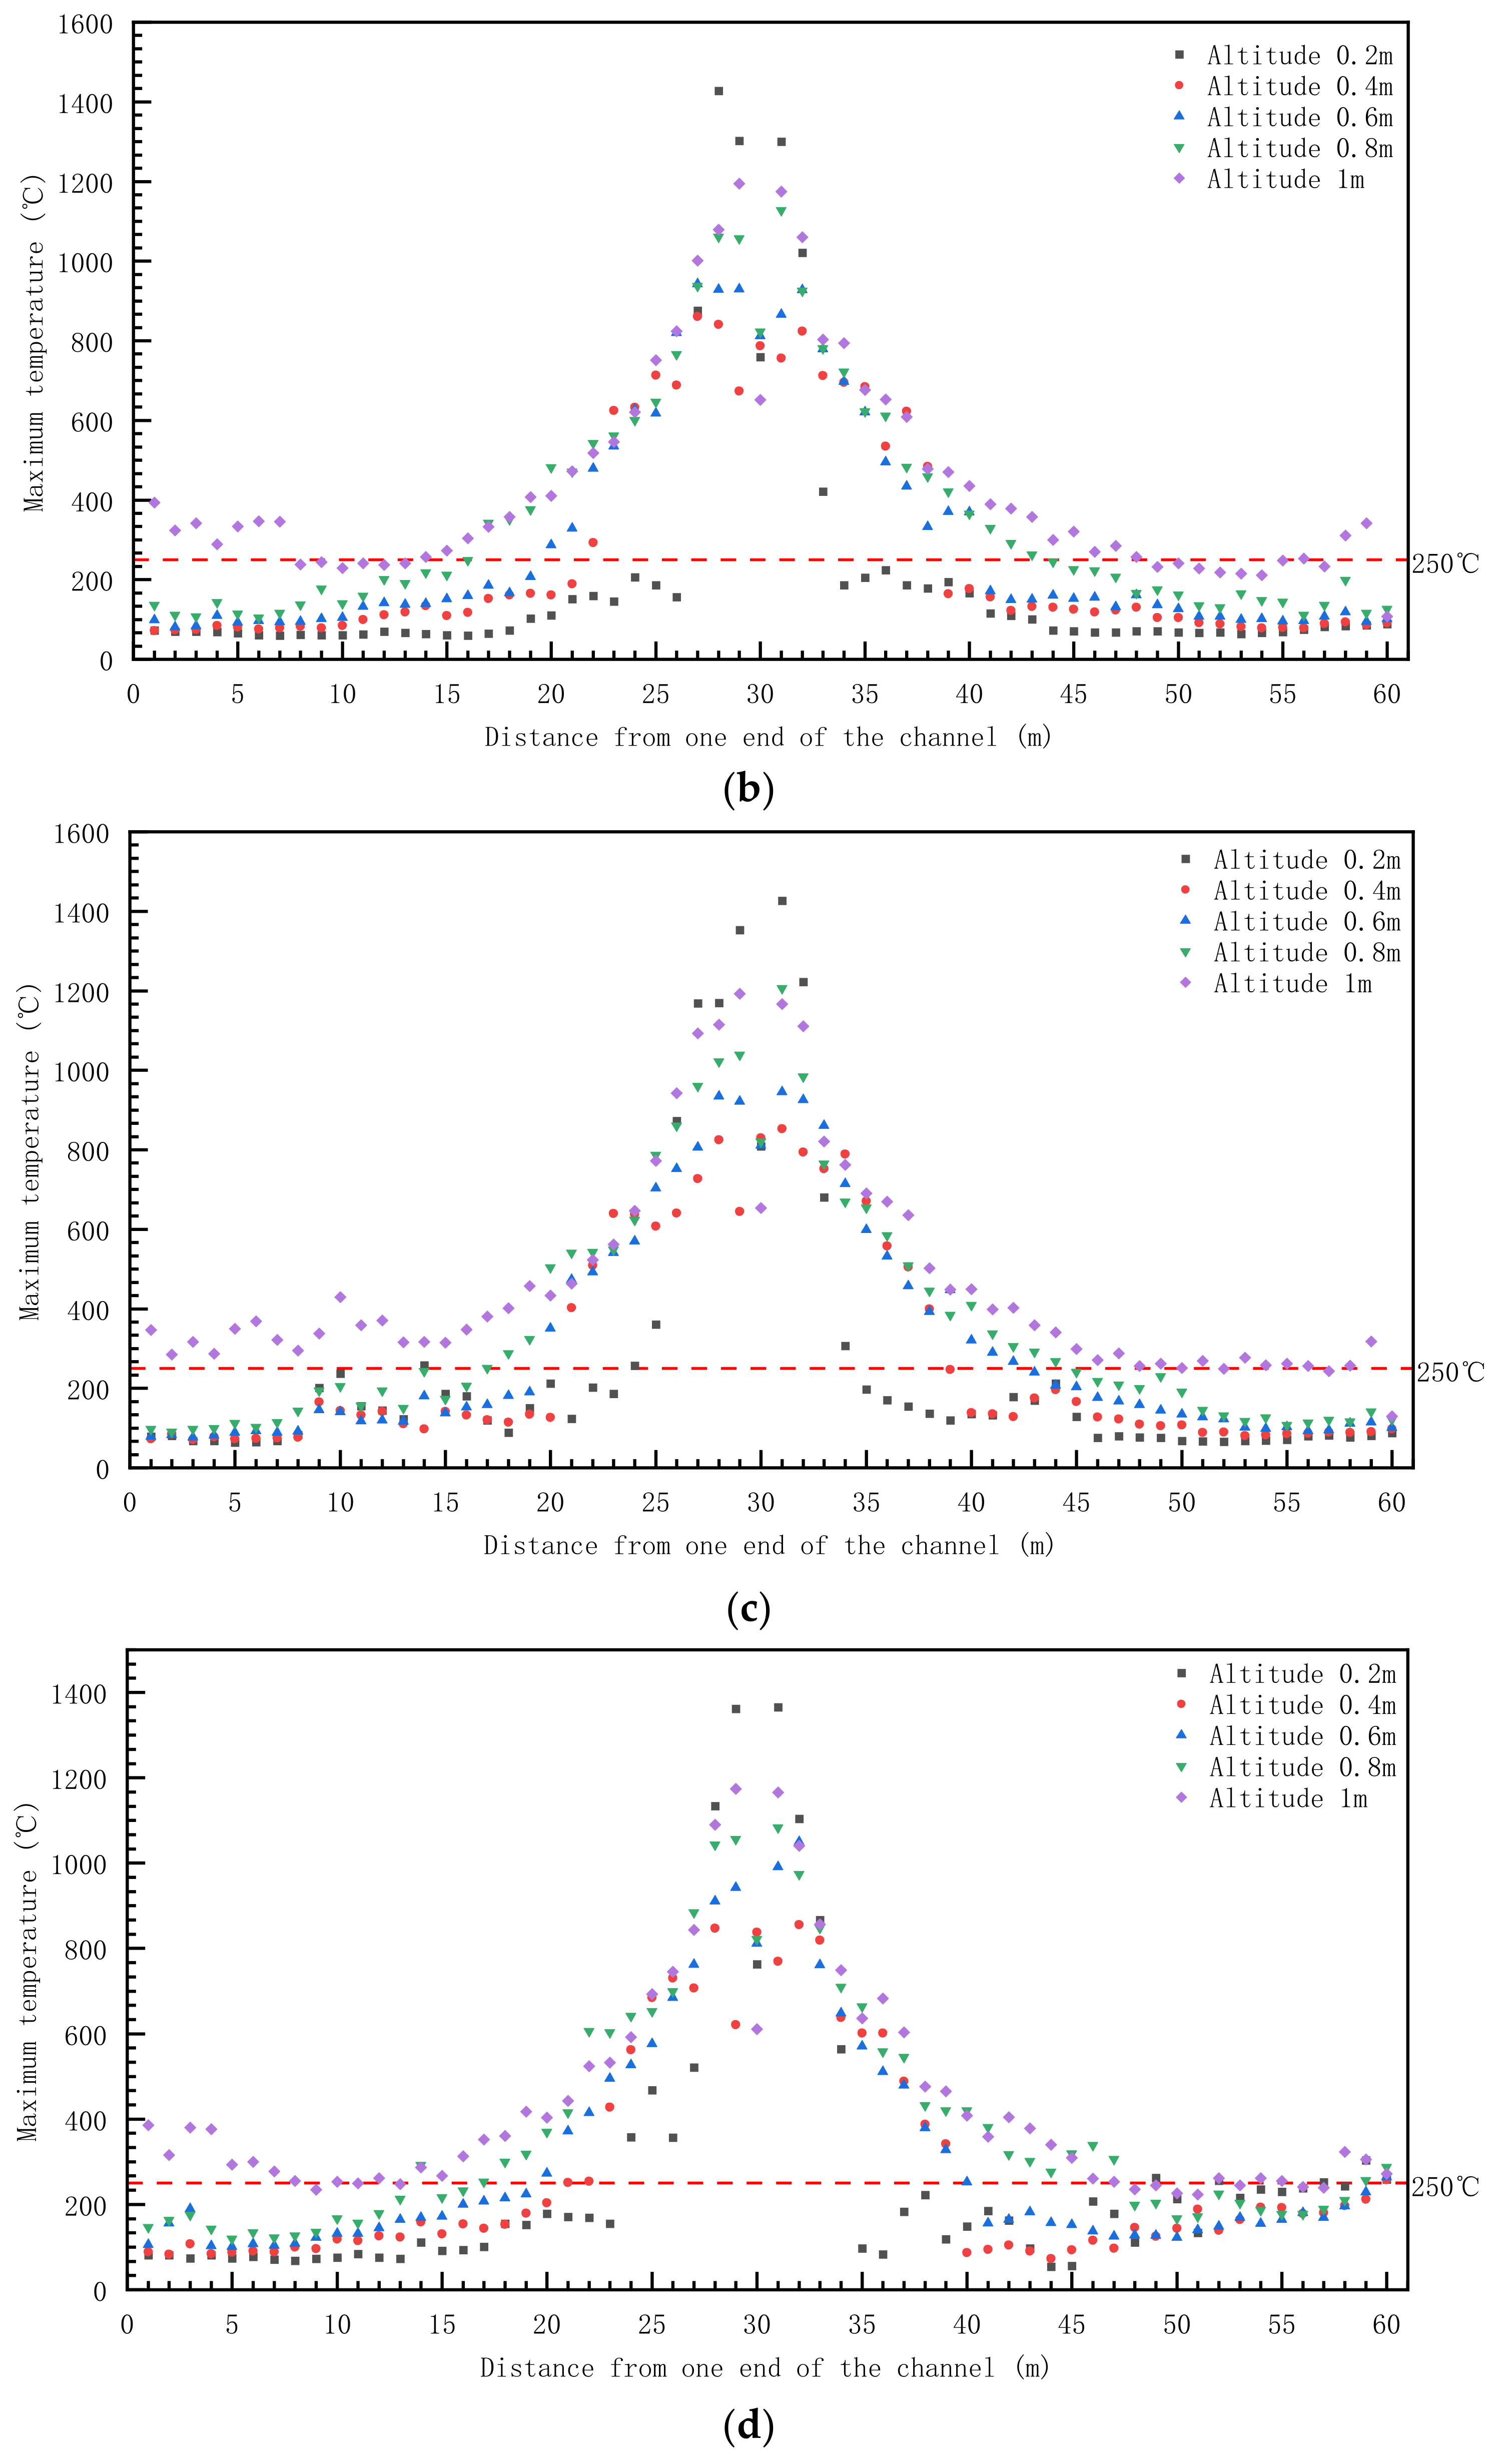
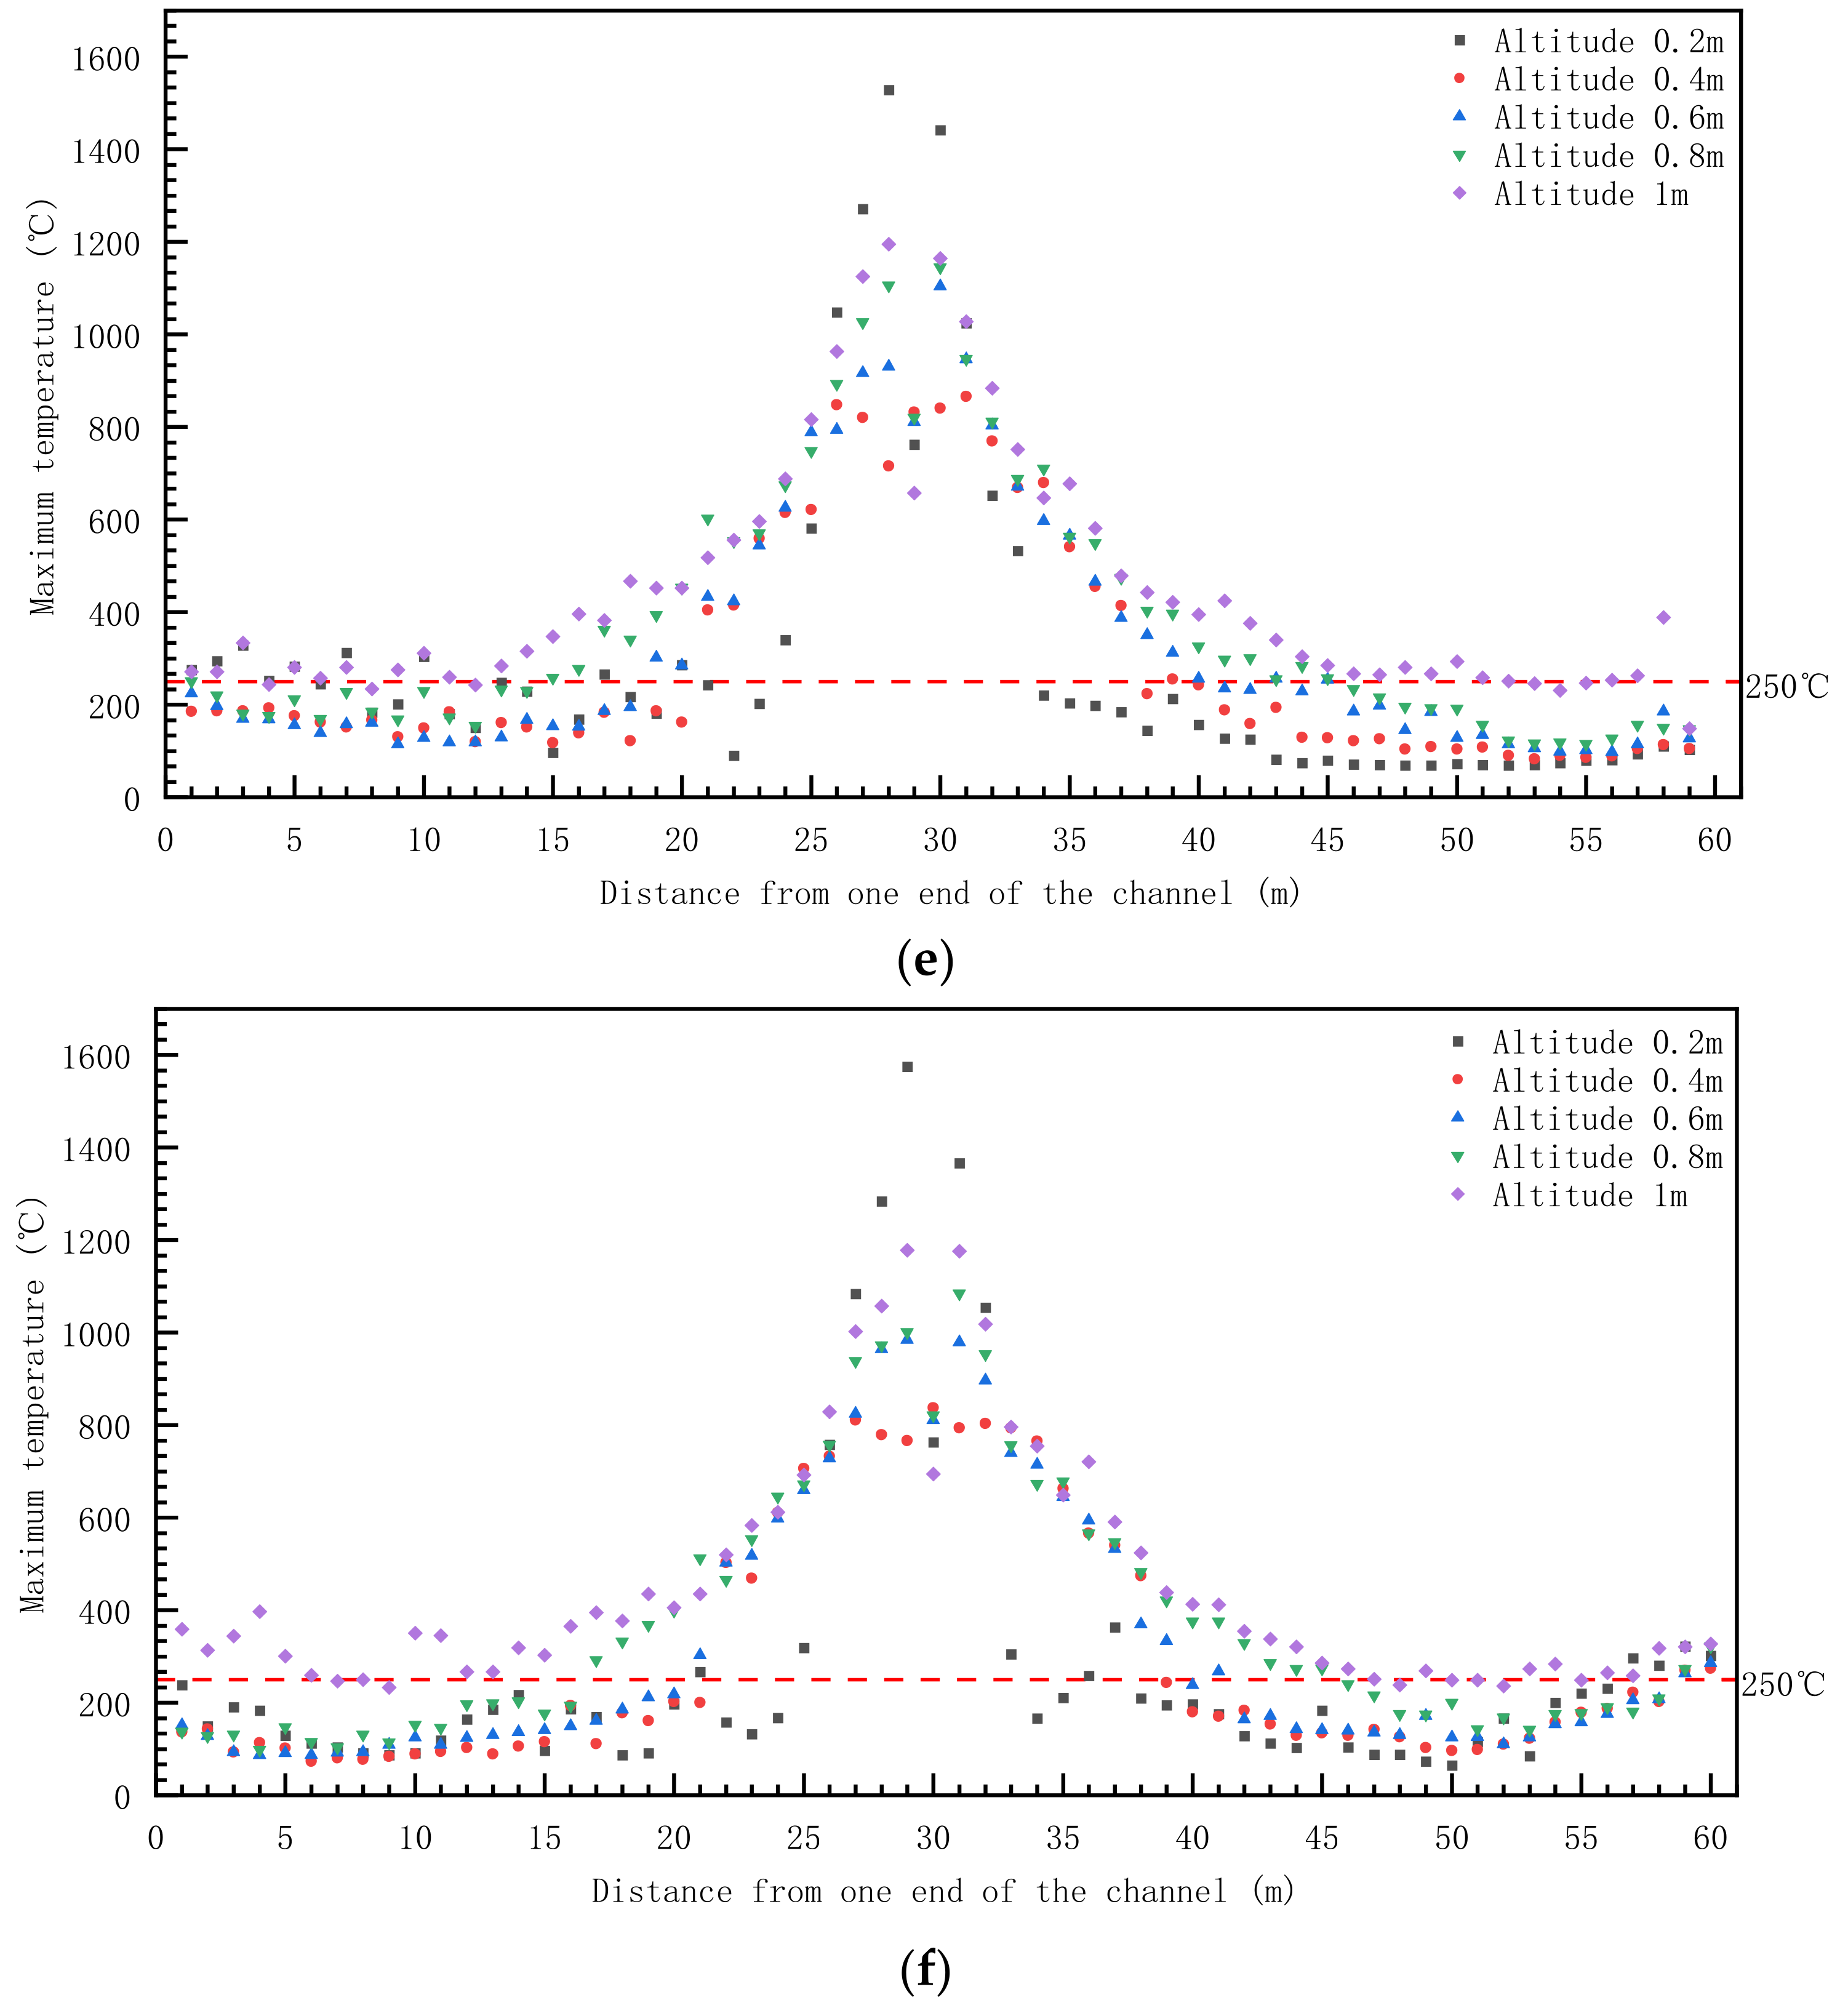
Cable channels are mostly unmanned places, so it is only necessary to pay attention to the economic losses caused by the burning transformer oil entering the cable channels. The main combustible material in the cable channel is the cable. According to the previous research [17,18], the damage to the cable starts with pyrolysis at about 250 °C, so the area with the highest temperature above 250 °C is identified as the area where the cable may be damaged. Therefore, this study can analyze the fire loss caused by the combustion of the external transformer oil entering the cable channel by analyzing the temperature changes at different horizontal and vertical positions in the simulated working conditions. The highest temperature at different horizontal and vertical positions from one end of the cable channel in each simulated working condition is shown in Figure 5.
In particular, it should be noted that although the combustion model of the cable in this paper is set, the damage to the cable and the combustion of the cable are not the same concept. When the cable is at 250 °C, the mechanical properties and insulation properties will decline, and melting (non-combustion) will also occur. Therefore, in this paper, the cable reaching 250 °C is used as the judgment standard for cable damage instead of using cable burning as the criterion for judging cable damage.
The maximum temperature of each simulated condition in the horizontal direction takes 30 m as the origin, and the temperature decreases gradually along the position far from the origin until it rises slightly near the end of the cable channel. When the leakage amount is 1 L to 5 L, the slight rise in temperature at one end of the cable channel does not exceed 250 °C, except for at a height of 1 m. When the leakage is 8 L to 12 L, the slight rise in temperature at one end of the cable channel exceeds 250 °C, which increases the length of the cable that may be damaged. In the vertical direction, the maximum temperature of each horizontal position increases with the increase in height, except where the height of one end of the channel is 0.2 m (there is a vent).
As can be seen from FIG. 5, when the leakage volume is 1 L, the maximum spacing between each position with temperatures greater than 250 °C in the cable channel at heights of 0.2 m, 0.4 m, 0.6 m, 0.8 m, and 1 m is 7 m, 15 m, 18 m, 27 m, and 59 m, respectively. When the leakage volume is 3 L, the maximum spacing between temperatures above 250 °C at heights of 0.2 m, 0.4 m, 0.6 m, 0.8 m, and 1 m is 8 m, 18 m, 22 m, 29 m, and 59 m, respectively. When the leakage volume is 5 L, the maximum spacing between temperatures above 250 °C in the cable channel at heights of 0.2 m, 0.4 m, 0.6 m, 0.8 m, and 1 m is 22 m, 20 m, 24 m, 29 m, and 59 m, respectively. When the leakage amount is 8 L, the maximum spacing between temperatures above 250 °C in the cable channel at heights of 0.2 m, 0.4 m, 0.6 m, 0.8 m, and 1 m is 27 m, 39 m, 39 m, 44 m, and 60 m, respectively. When the leakage volume is 10 L, the maximum spacing between temperatures above 250 °C in the cable channel at heights of 0.2 m, 0.4 m, 0.6 m, 0.8 m, and 1 m is 34 m, 20 m, 28 m, 45 m, and 59 m, respectively. When the leakage volume is 12 L, the maximum spacing between temperatures above 250 °C in the cable channel at heights of 0.2 m, 0.4 m, 0.6 m, 0.8 m, and 1 m is 40 m, 39 m, 40 m, 42 m, and 60 m, respectively.
Since the height of each layer of cable in the simulated working condition is between 0.2 m and 0.4 m, 0.4 m and 0.6 m, 0.6 m and 0.8 m, and 0.8 m and 1 m, the highest temperature at different horizontal positions of each layer of cable is the highest temperature in the corresponding interval. The damage distance in the horizontal direction is the maximum distance between the two ends of the channel above 250 °C. Through data analysis, the damage distance of cables in different working conditions and layers can be obtained, as shown in Table 1. Cable damage distance can measure the extent of cable damage.
It can be seen from the data in the above table that the damage distance of the upper layer cable in each working condition is the largest, and the damage distance is very close to the length of the cable channel. The maximum damage distance of the bottom cable, middle and bottom cable, middle and upper cable, and upper cable in each working condition is between 15 m and 40 m, 18 m and 41 m, 27 m and 45 m, and 59 m and 60 m. When the leakage amount is 1~8 L, the damage distance of each layer of cable gradually increases with the increase in height, and the damage distance between the lower layer cable and the middle and lower layer cable is small. With the increase in transformer oil thickness, the damage distance of each layer of cable also increases.
4. Conclusions
In evaluating the impact of transformer oil leaks on tunnel cables and the ensuing fire characteristics within cable channels, this study leverages numerical simulations. The findings lead to the following conclusions:
- (1)
- Fire Duration and Transformer Oil Leakage
Under the specified study conditions, when the transformer oil leakage is 3 L or less, the fire ceases within 120 s. Conversely, when the leakage exceeds or equals 5 L, the fire’s duration surpasses 900 s.
- (2)
- Cable Combustion Rates
In this study’s operational context, a leakage amount of 1 L results in a very low combustion rate for the cable, with only slight combustion occurring. For leakage amounts ranging from 3 L to 12 L, noticeable cable combustion is observed, predominantly concentrated between 15 s and 75 s. The overall cable burning rate exhibits an initial increase followed by a subsequent decrease.
- (3)
- Fire Development Process
Analyzing the fire’s development process caused by transformer oil leakage into the cable channel reveals rapid oxygen consumption near the transformer oil due to combustion. If the transformer oil becomes depleted, the cable experiences only minimal burning. Conversely, if there is an ample supply of transformer oil, it ignites the cable in the channel. As oxygen concentration diminishes, both cable and transformer oil combustion are suppressed. After a certain duration, the cable ceases burning, leaving only the transformer oil to burn within the cable channel.
- (4)
- Damage Distance Ranges
Under this study’s operational conditions, the damage distance range for each cable layer is delineated. When the total transformer oil leakage falls between 1 L and 12 L, the maximum damage distance for the bottom, middle and bottom, middle and upper, and upper cables ranges from 15 m to 40 m, 18 m to 41 m, 27 m to 45 m, and 59 m to 60 m, respectively.
- (5)
- Layer-specific Damage Distances
In this study’s operational context, the upper layer cable exhibits the largest damage distance. When the total transformer oil leakage equals or exceeds 8 L, the lower layer cable manifests the smallest damage distance. Conversely, when the total leakage is 5 L or less, the damage distances for the lower layer cable, middle and lower layer cable, and upper layer cable do not surpass half the length of the cable channel (30 m).
Since such an underground cable passage structure is widely used in practical engineering, these conclusions can provide technical references for practical engineering applications, such as power operation and maintenance personnel, who can estimate the duration of the fire caused by the leakage of transformer oil in the transformer near the cable passage and estimate the length of cable damage to replace the cable in the most economical way. For fire prevention and control, since the amount of transformer oil entering the cable channel has a great impact on cable damage and fire development, operation and maintenance personnel can open channels on both sides of the underground cable channel near the transformer to make transformer oil flow into it rather than into the cable channel. It can also be designed in the transformer, the oil-bearing part of the layout, so that when deflagration occurs, there is an expected direction of leakage.
These comprehensive conclusions derived from numerical simulations provide valuable insights into the intricate dynamics of fire propagation and damage patterns within cable channels affected by transformer oil leakage.
Author Contributions
Resources, F.L.; Software, M.G.; Supervision, T.S.; Writing—original draft, L.Y.; Writing—review & editing, J.Z. and Y.L. All authors have read and agreed to the published version of the manuscript.
Funding
This paper is supported by the Science and technology project of Anhui Electric Power Co., Ltd., State Grid. The project name is the key technology and application of fire spread mechanism, monitoring, prevention and control of power cabin in integrated pipe gallery (52120523001C).
Institutional Review Board Statement
Not applicable.
Informed Consent Statement
Not applicable.
Data Availability Statement
The original contributions presented in the study are included in the article material, further inquiries can be directed to the corresponding author.
Conflicts of Interest
The authors declare no conflict of interest.
References
- Mao, Z. Study and Feasibility Analysis of Bulk Strong Oil Drainage Scheme in ULTRA-High Pressure Rheological Change Fire. Ph.D. Thesis, South China University of Technology, Guangzhou, China, 2019. [Google Scholar]
- Chen, T.; Zhao, L.; Fu, X.; Zhang, J.; Wang, Q.; Hu, C.; Bao, Z.; Li, B.; Li, G. Fire accident characteristics and firefighting solutions of large converter transformer. Fire Sci. Technol. Fire Prot. 2020, 39, 1138–1141. [Google Scholar]
- Tao, L.; Zeng, Y.; Liu, Z.; Peng, J.; Zhou, X. Study on the influence of air curtain on fire temperature and flow field in subway tunnel. China Saf. Sci. J. 2021, 31, 157–163. [Google Scholar]
- Mi, H.; Zhang, X.; Yang, W.; Wang, W.; Liu, Y.; Jiao, Y. Fire probability analysis method of cable cabin in urban utility tunnel. China Saf. Sci. J. 2021, 31, 165–172. [Google Scholar]
- Liu, S.R.; Hu, Y.X.; Zheng, J.K.; Su, X.T.; Xu, Y. Dynamics simulation of 10 kV cable tunnel fire for single-phase arc grounding fault. High Volt. Eng. 2021, 47, 4341–4348. [Google Scholar] [CrossRef]
- Matala, A.; Hostikka, S. Probabilistic Simulation of Cable Performance and Water Based Protection in Cable Tunnel Fires. Nucl. Eng. Des. 2011, 241, 5263–5274. [Google Scholar] [CrossRef]
- Hao, G. Simulation Study on Fire Smoke in Cable Compartment of Integrated Pipe Gallery. Ph.D. Thesis, Xi’an University of Architecture and Technology, Xi’an, China, 2017. [Google Scholar]
- Li, X. Numerical Simulation and Optimization Design of Ventilation System After Cable Cabin fire in Integrated Pipe Gallery. Ph.D. Thesis, Xi’an University of Architecture and Technology, Xi’an, China, 2018. [Google Scholar]
- McGrattan, K.; Hostikka, S.; McDermott, R.; Floyd, J.; Weinschenk, C.; Overholt, K. Fire Dynamics Simulator User’s Guide; National Institute of Standards and Technology: Gaithersburg, MD, USA, 2013.
- Wang, Y.; Li, C.; Zhang, J.; Shang, F.; Lu, S.; Fan, M.; Cheng, D. Fire characteristic parameter analysis of KI50X UHV transformer oil. J. Saf. Environ. 2020, 20, 1361–1369. [Google Scholar]
- Anonymous. Material Safety Data Sheet of KI50X DC Transformer Oil. Available online: http://kunlunlube.cnpc.com.cn/klrhy/msdstzy/201606/fa791152f8794a6199c7ba19fa8cfd7f/files/1740388a6a3d42e69e033aa95a89db5e.pdf (accessed on 3 June 2020).
- Kai, L. Study on Fire Spreading Behavior and Smoke Flow Characteristics of Urban Underground Comprehensive Pipe Corridor. Ph.D. Thesis, China University of Mining and Technology, Xuzhou, China, 2020. [Google Scholar]
- Hamins, A.; Maranghides, A.; Johnsson, R.; Donnelly, M.; Yang, J.; Mulholland, G.; Anleitner, R.L. NIST Special Publication 1013-1. Report of Experimental Results for the International Fire Model Benchmarking and Validation Exercise #3; NIST: Gaithersburg, MD, USA, 2005.
- Tang, X. Study on Pyrolysis Kinetics And Radial One-Dimensional Thermal Expansion Model of Flame Retardant Cable. Ph.D. Thesis, University of Science and Technology of China, Langfang, China, 2018. [Google Scholar]
- Wang, Y.; Li, C.; Zhang, J.; Shang, F.; Lu, S.; Fan, M.; Wang, L. Research on characteristics and countermeasures of oil-immersed transformer fire accident. Saf. Environ. Eng. 2019, 26, 166–171. [Google Scholar]
- Wang, Y.; Li, C.; Zhang, J.; Shang, F.; Lu, S.; Fan, M.; Wang, L. Experimental Study on Combustion Characteristics of Insulating Oil of Typical Converter Transformer Based on Flame Spread Meter. Saf. Environ. Eng. 2020, 27, 190–196. [Google Scholar]
- Shen, T. Research on Fire Risk of Metro Tunnel Wire and Cable. Ph.D. Thesis, Capital University of Economics and Business, Beijing, China, 2018. [Google Scholar]
- Zhang, Z.; Wei, B. Preparation and Thermal degradation kinetics of palygorskite/silane crosslinked polyethylene composites. J. Northwest Norm. Univ. (Nat. Sci. Ed.) 2013, 49, 63–69. [Google Scholar]
Figure 1.
Cable channel size and cable layout.
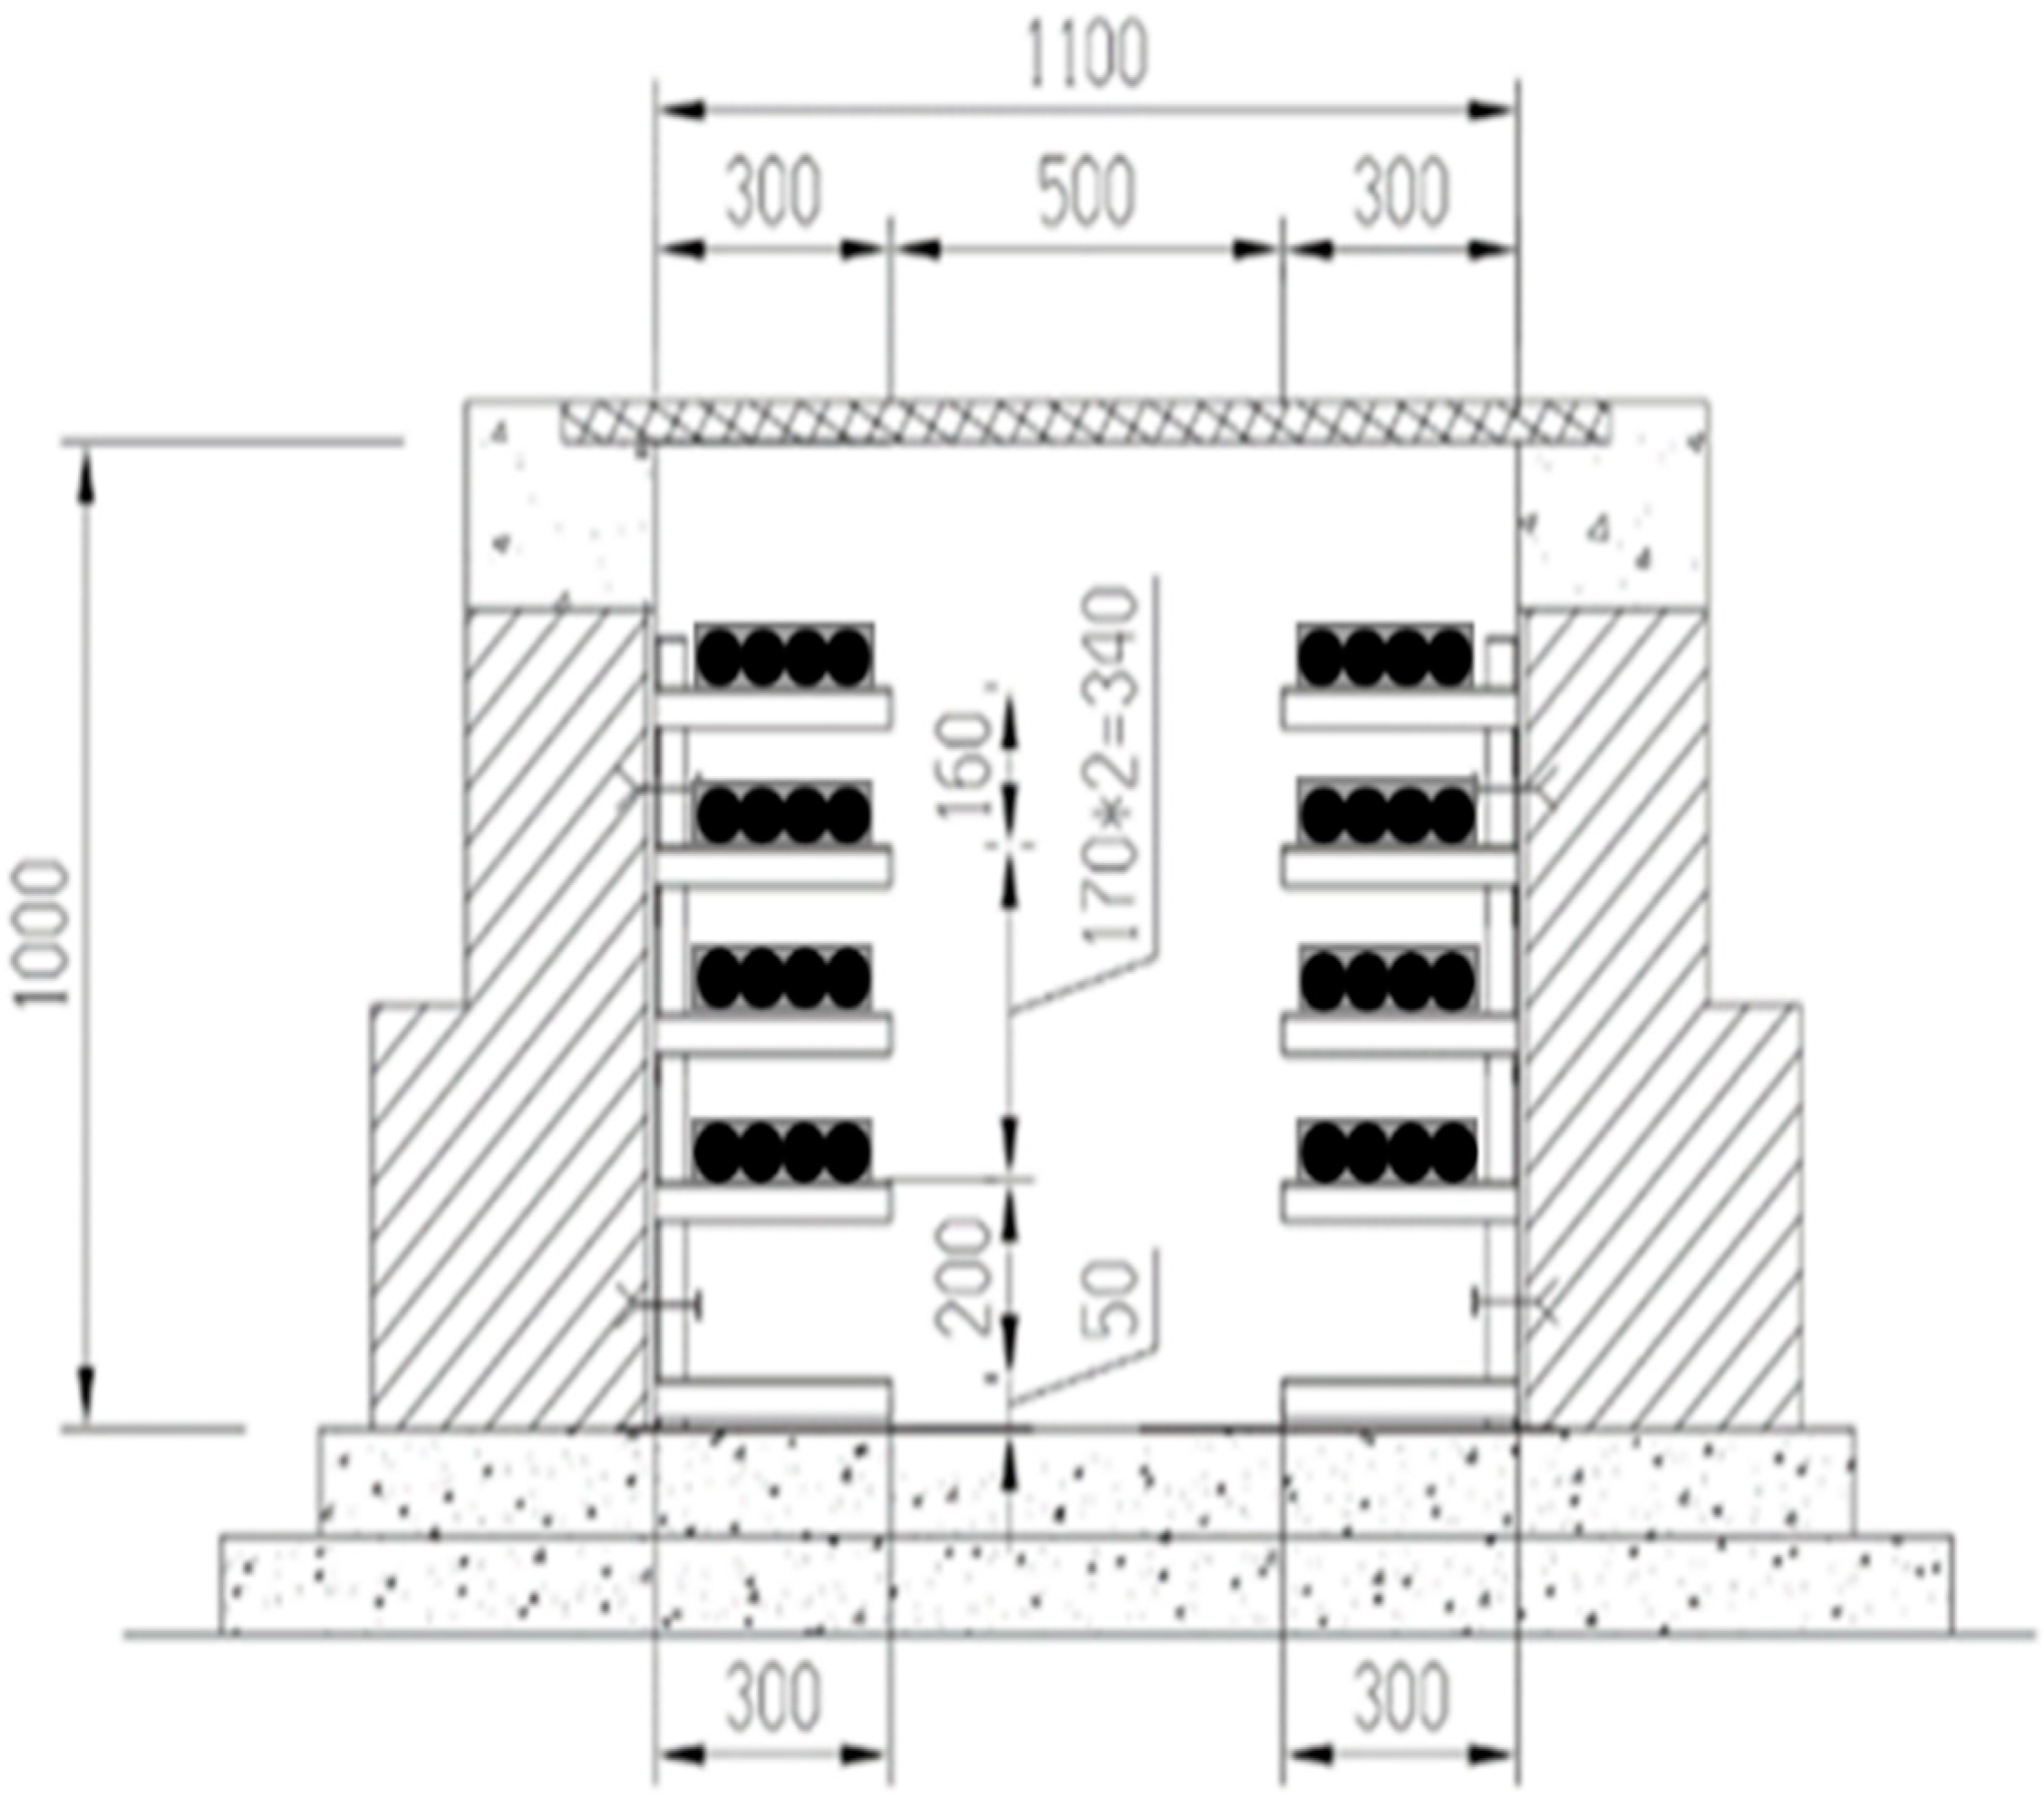
Figure 2.
Section diagram of the cable channel model.
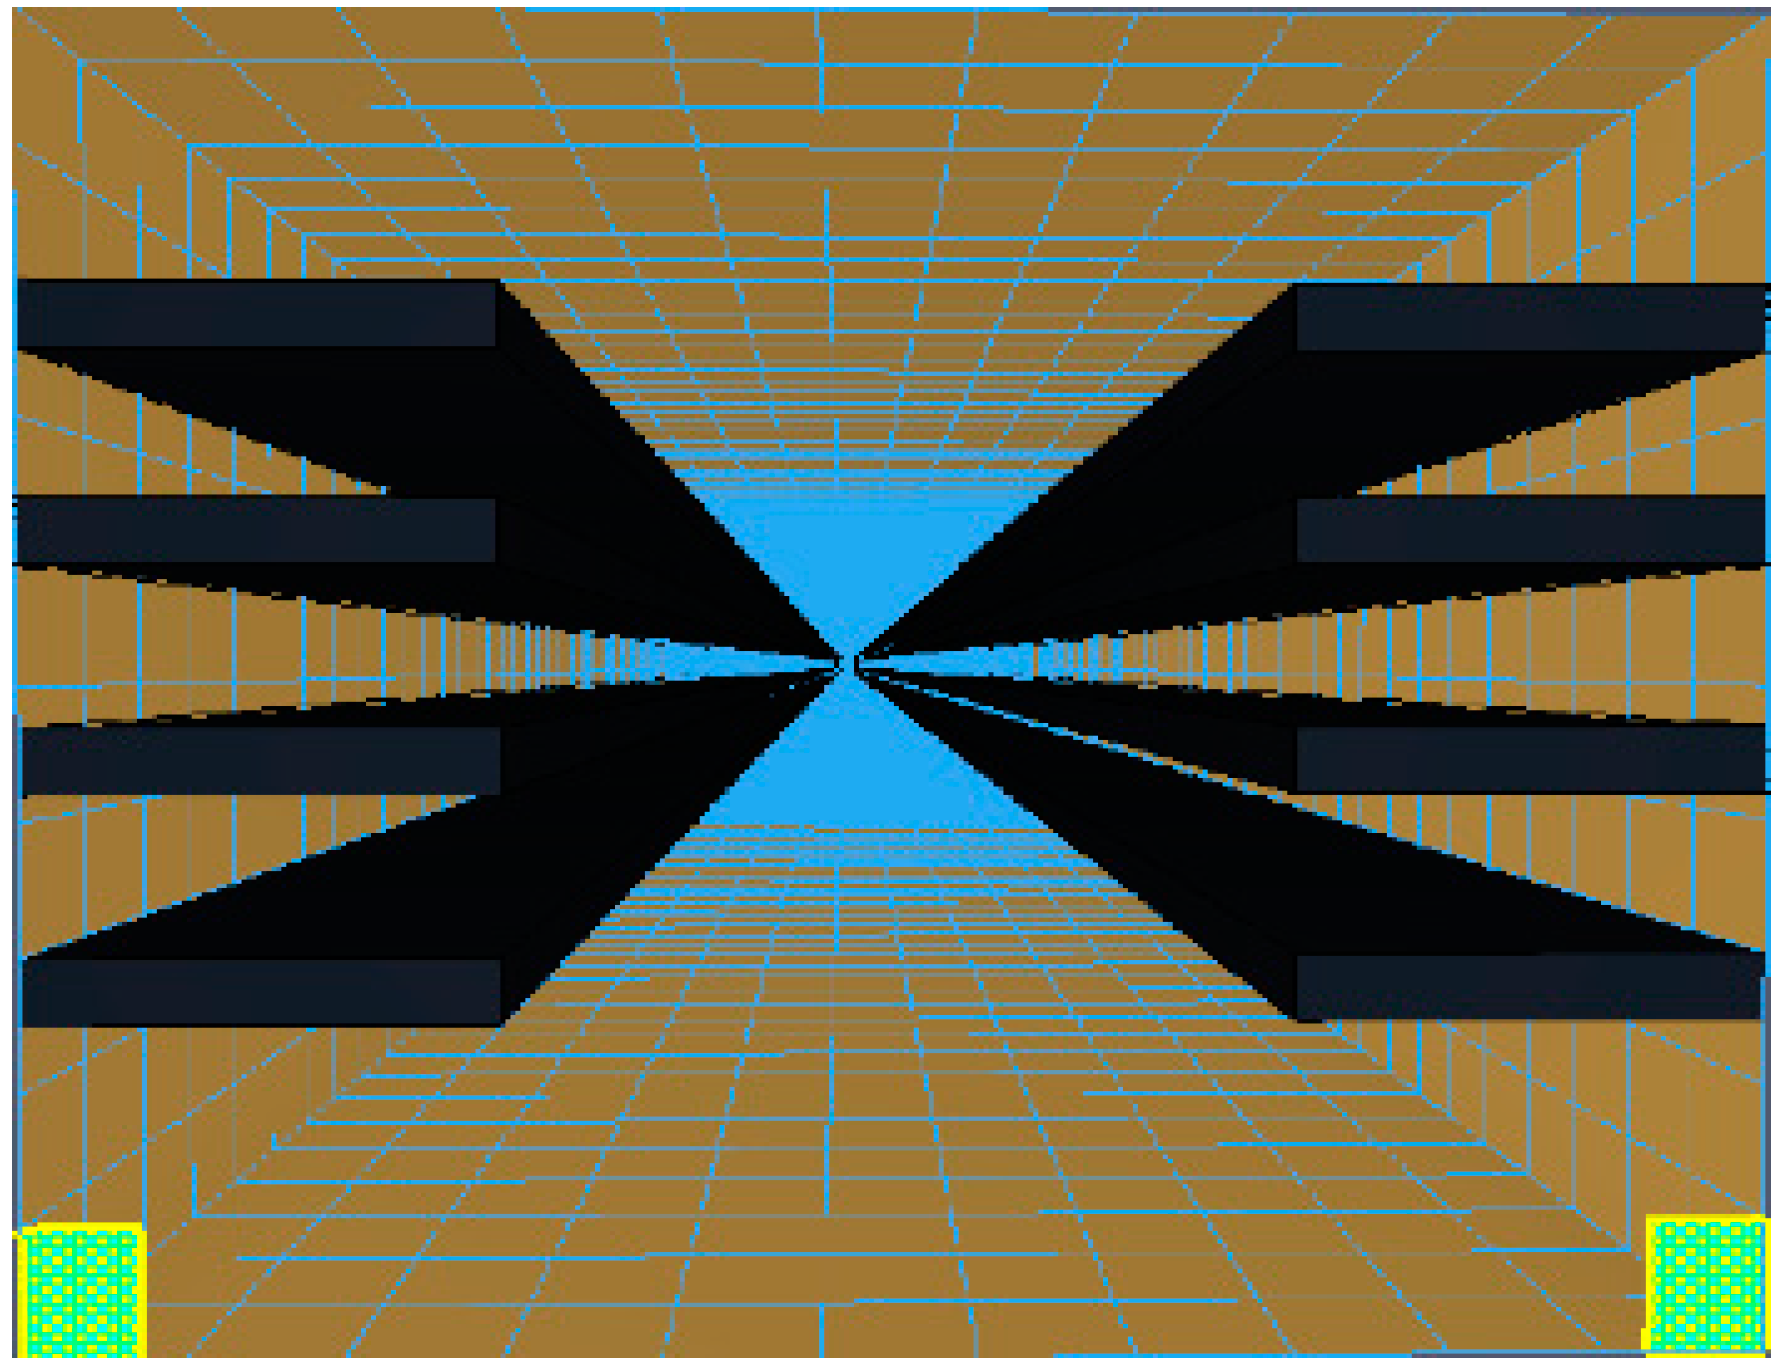
Figure 3.
Diagram of variation in heat release rate and average oxygen concentration under various working conditions: (a) variation diagram of heat release rate under different working conditions; (b) variation diagram of average oxygen concentration under different working conditions.
Figure 3.
Diagram of variation in heat release rate and average oxygen concentration under various working conditions: (a) variation diagram of heat release rate under different working conditions; (b) variation diagram of average oxygen concentration under different working conditions.

Figure 4.
Diagram of cable burning rate and transformer oil burning rate variation under various working conditions: (a) variation diagram of cable burning rate under different working conditions; (b) transformer oil burning rate variation diagram under different working conditions.
Figure 4.
Diagram of cable burning rate and transformer oil burning rate variation under various working conditions: (a) variation diagram of cable burning rate under different working conditions; (b) transformer oil burning rate variation diagram under different working conditions.
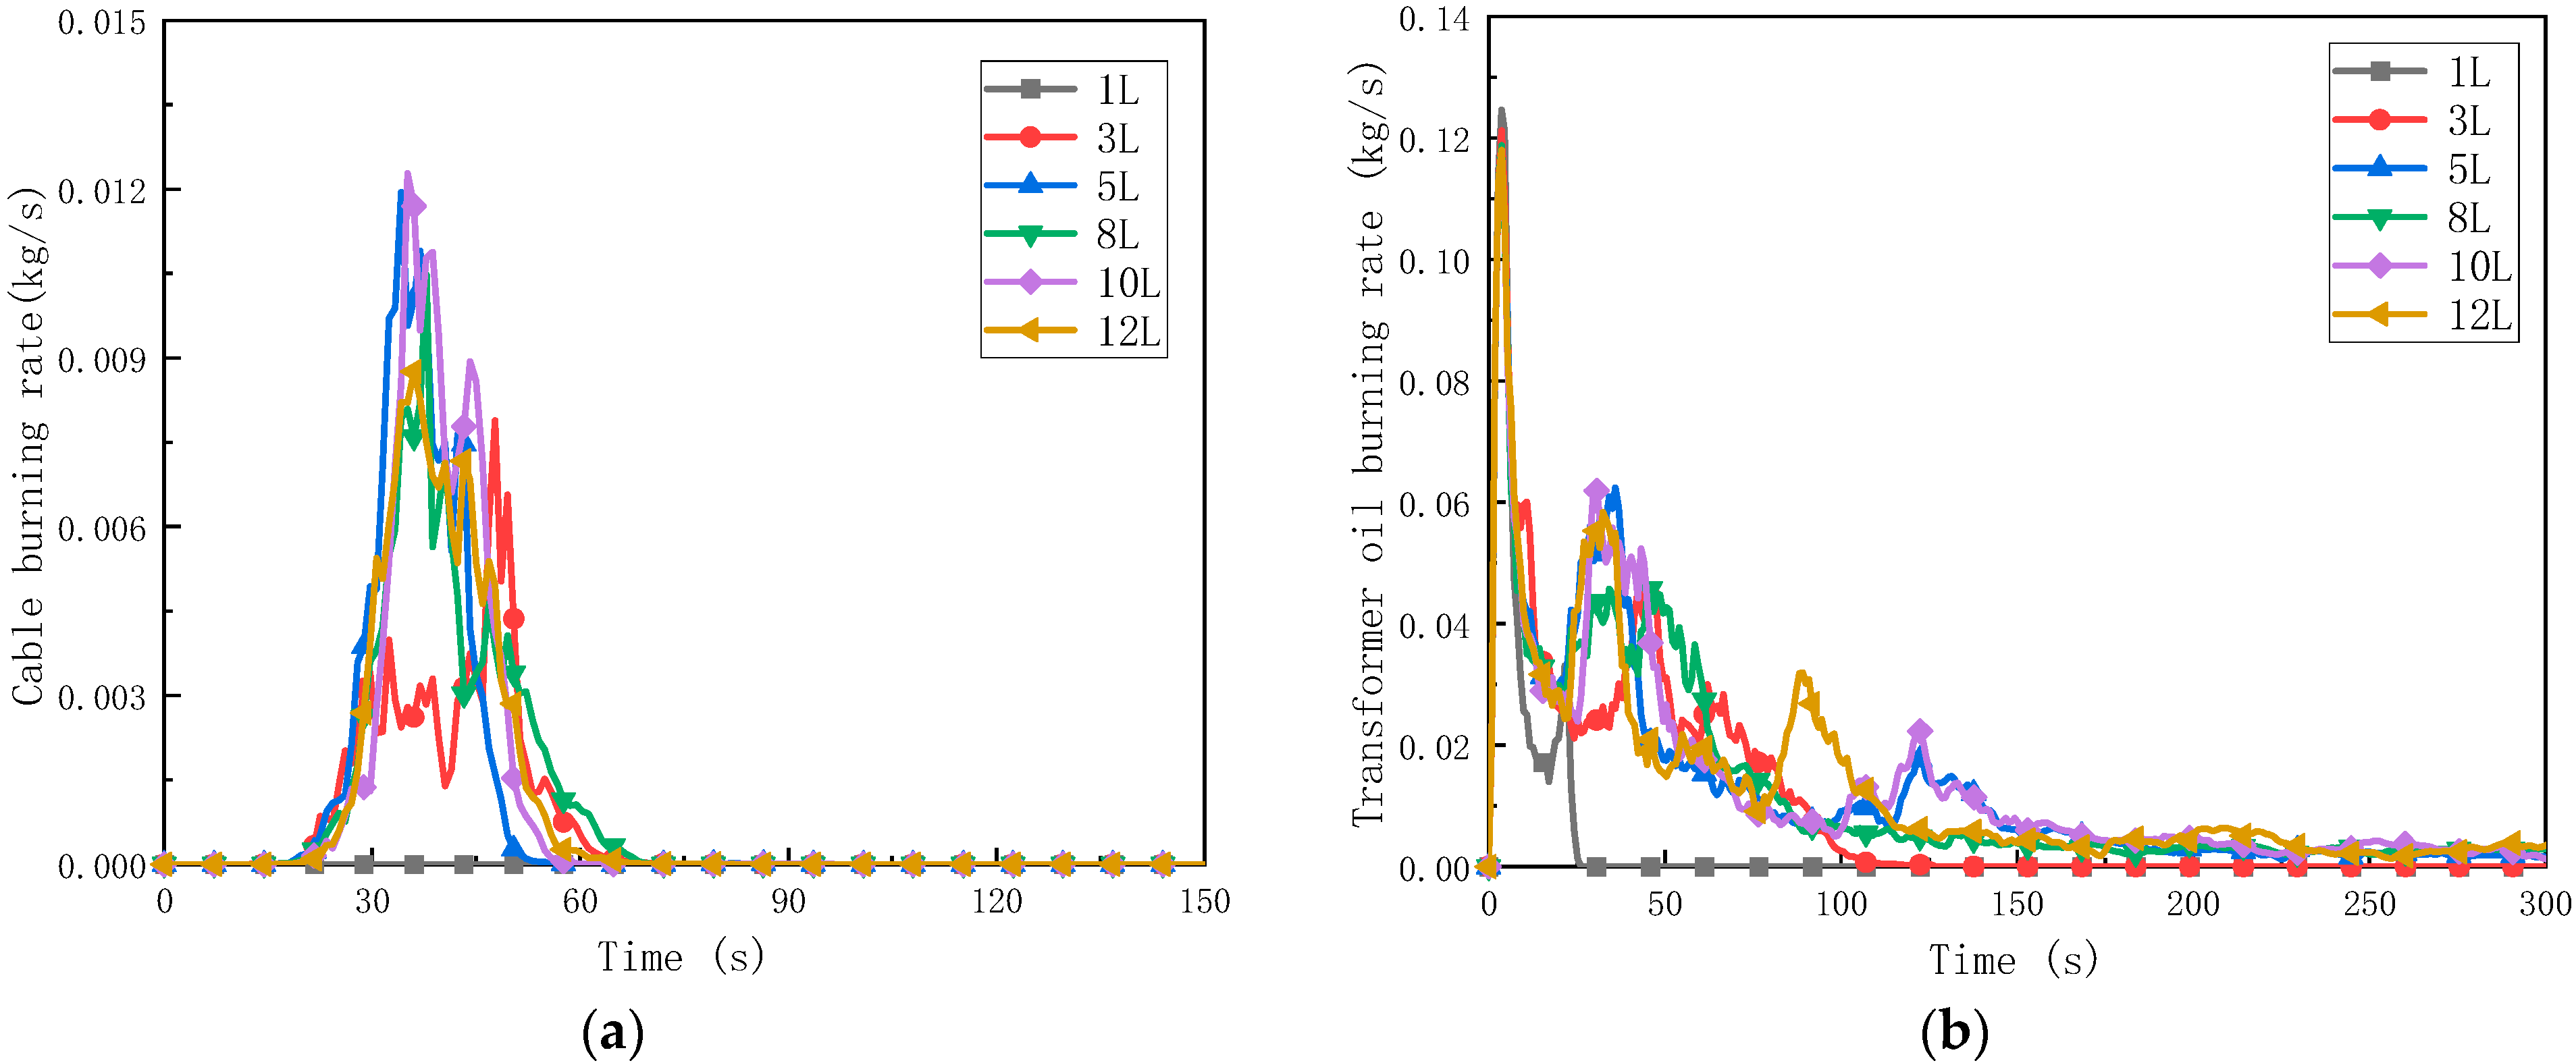
Figure 5.
Maximum temperature variation diagram at different horizontal and vertical positions under different working conditions: (a) maximum temperature diagram at each horizontal position and height when the leakage amount is 1 L; (b) maximum temperature diagram at each horizontal position and height when the leakage amount is 3 L; (c) maximum temperature diagram at each horizontal position and height when the leakage amount is 5 L; (d) maximum temperature diagram at each horizontal position and height when the leakage amount is 8 L; (e) maximum temperature diagram at each horizontal position and height when the leakage amount is 10 L; (f) maximum temperature diagram at each horizontal position and height when the leakage amount is 12 L.

Table 1.
Cable damage distance table for each layer in each working condition.
| Leakage (L) | Cable Damage Distance (m) | |||
|---|---|---|---|---|
| Bottom Cable | Middle and Bottom Cable | Upper-Middle Cable | Top Cable | |
| 1 | 15 | 18 | 27 | 59 |
| 3 | 18 | 22 | 29 | 59 |
| 5 | 22 | 24 | 29 | 59 |
| 8 | 39 | 39 | 44 | 60 |
| 10 | 34 | 28 | 45 | 59 |
| 12 | 40 | 40 | 42 | 60 |
Disclaimer/Publisher’s Note: The statements, opinions and data contained in all publications are solely those of the individual author(s) and contributor(s) and not of MDPI and/or the editor(s). MDPI and/or the editor(s) disclaim responsibility for any injury to people or property resulting from any ideas, methods, instructions or products referred to in the content. |
© 2024 by the authors. Licensee MDPI, Basel, Switzerland. This article is an open access article distributed under the terms and conditions of the Creative Commons Attribution (CC BY) license (https://creativecommons.org/licenses/by/4.0/).
Share and Cite
MDPI and ACS Style
Liu, F.; Zhang, J.; Gu, M.; Liu, Y.; Sun, T.; Ye, L. Simulation of Damage Caused by Oil Fire in Cable Passage to Tunnel Cable. Fire 2024, 7, 147. https://doi.org/10.3390/fire7040147
AMA Style
Liu F, Zhang J, Gu M, Liu Y, Sun T, Ye L. Simulation of Damage Caused by Oil Fire in Cable Passage to Tunnel Cable. Fire. 2024; 7(4):147. https://doi.org/10.3390/fire7040147
Chicago/Turabian StyleLiu, Feng, Jiaqing Zhang, Mengfei Gu, Yushun Liu, Tao Sun, and Liangpeng Ye. 2024. "Simulation of Damage Caused by Oil Fire in Cable Passage to Tunnel Cable" Fire 7, no. 4: 147. https://doi.org/10.3390/fire7040147