
A Methodology for Measuring Actual Mesh Stiffness in Gear Pairs


Abstract
1. Introduction
- Different kinds of gear pairs can be tested with the same equipment and until the limit of 500 Nm of torque;
- Runout and No Load Transmission Error do not affect the measurements of the tooth stiffness;
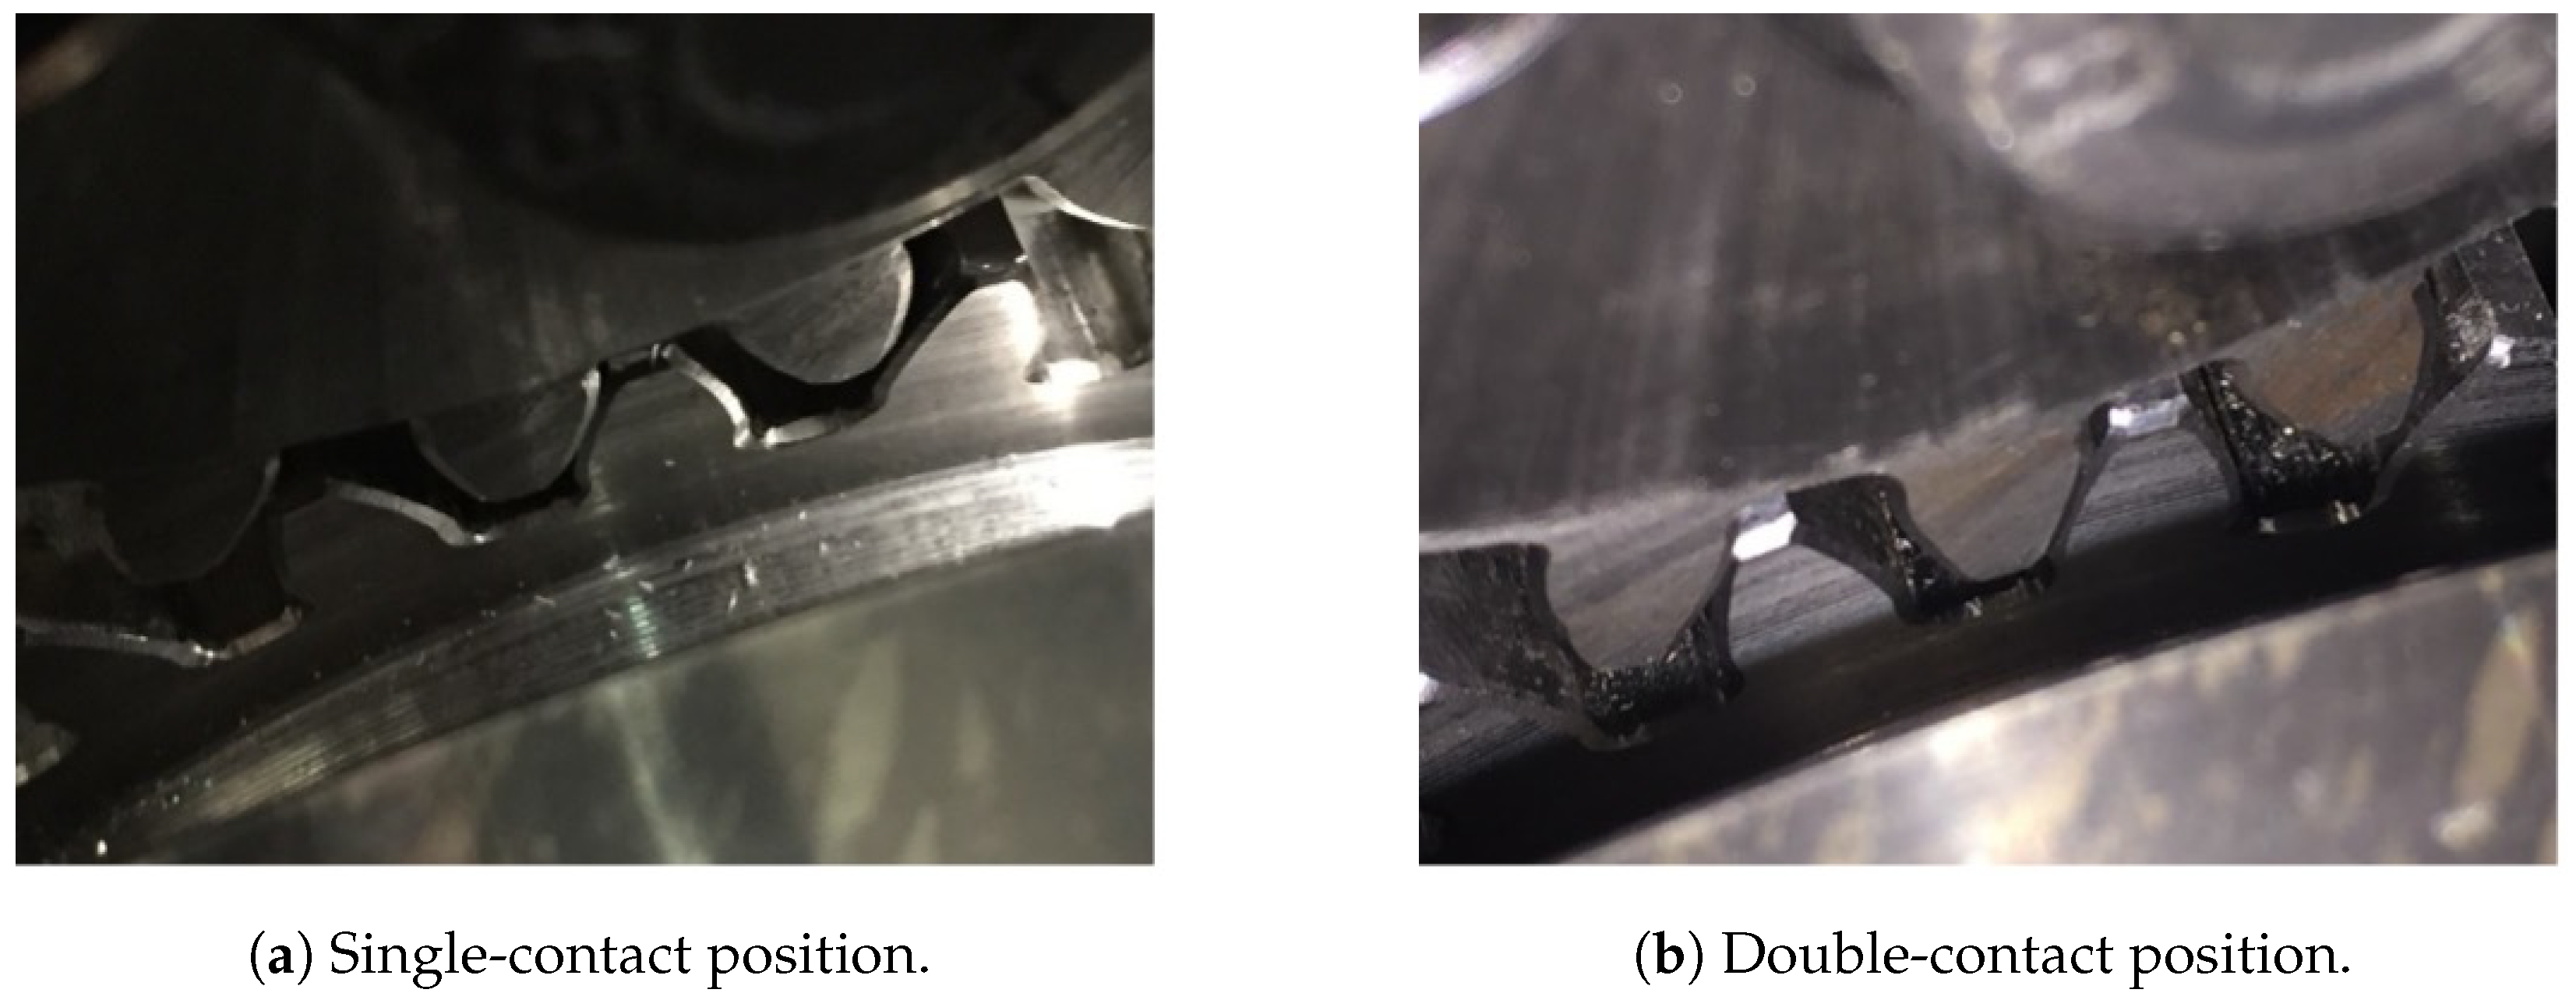
- Single or double contact (for gear pairs with a contact ratio lower than 2), n − 1 or n contact (for contact ratio higher than n) configurations can be tested separately.
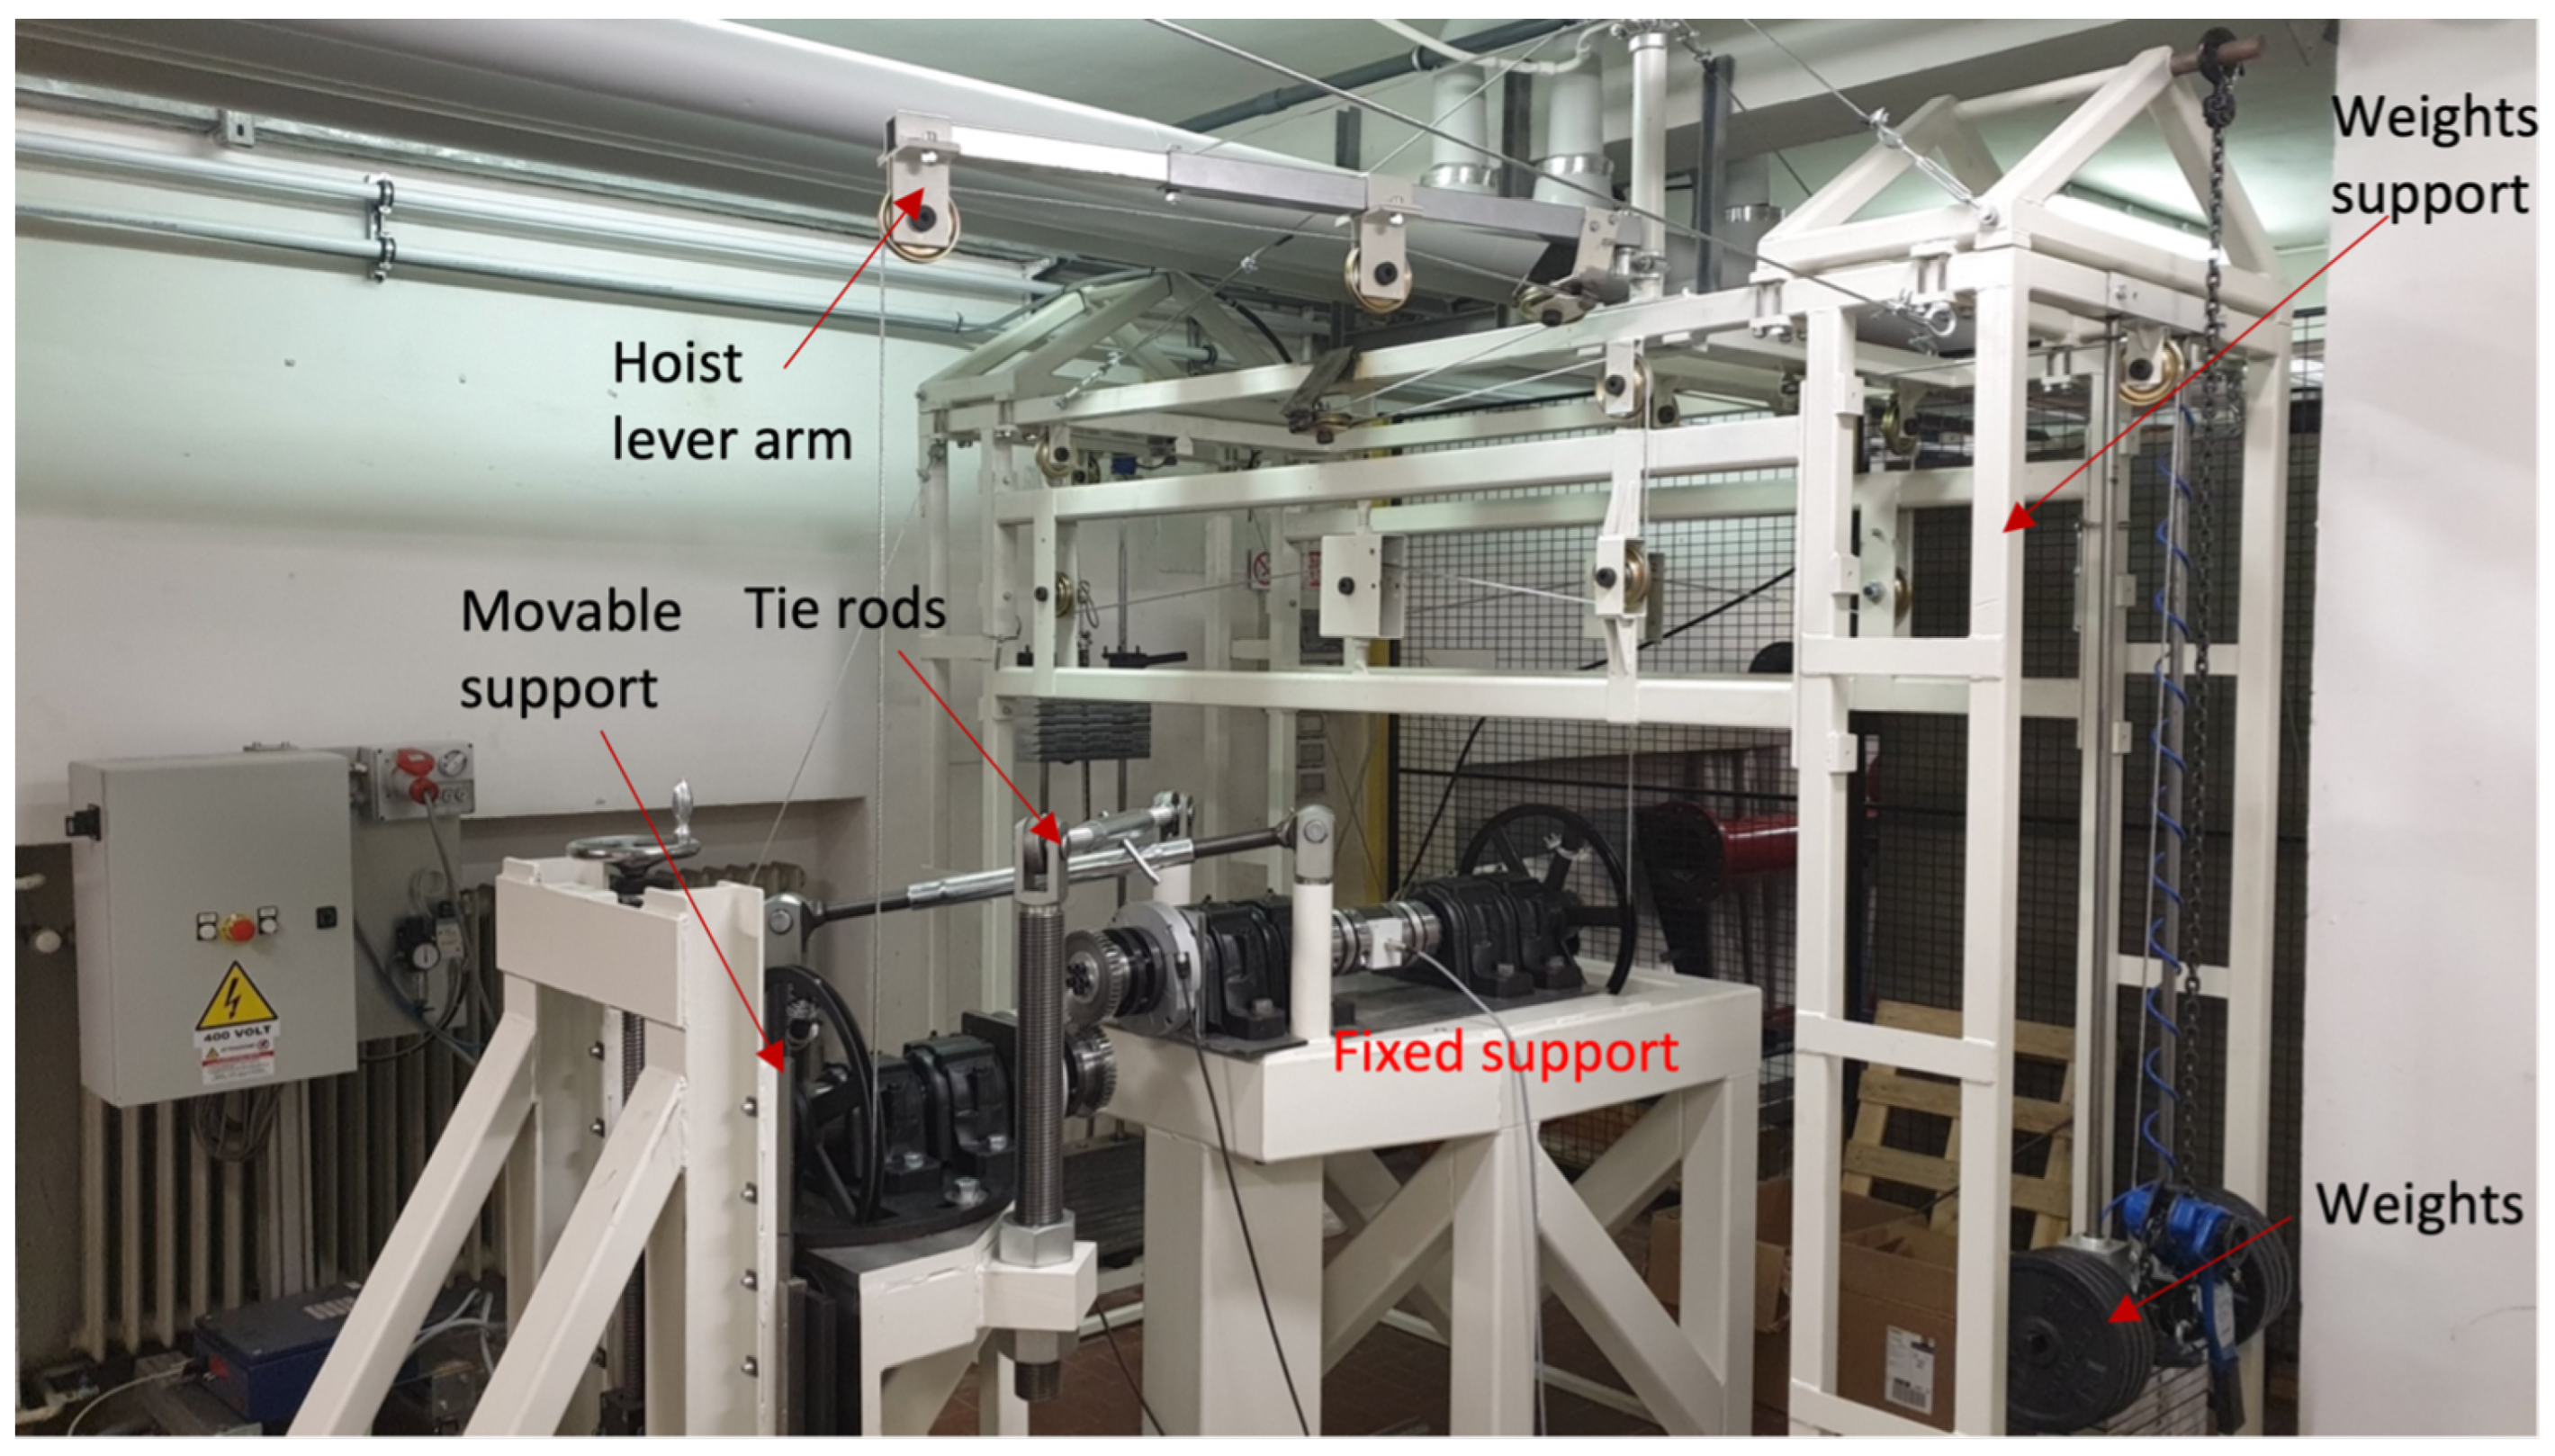
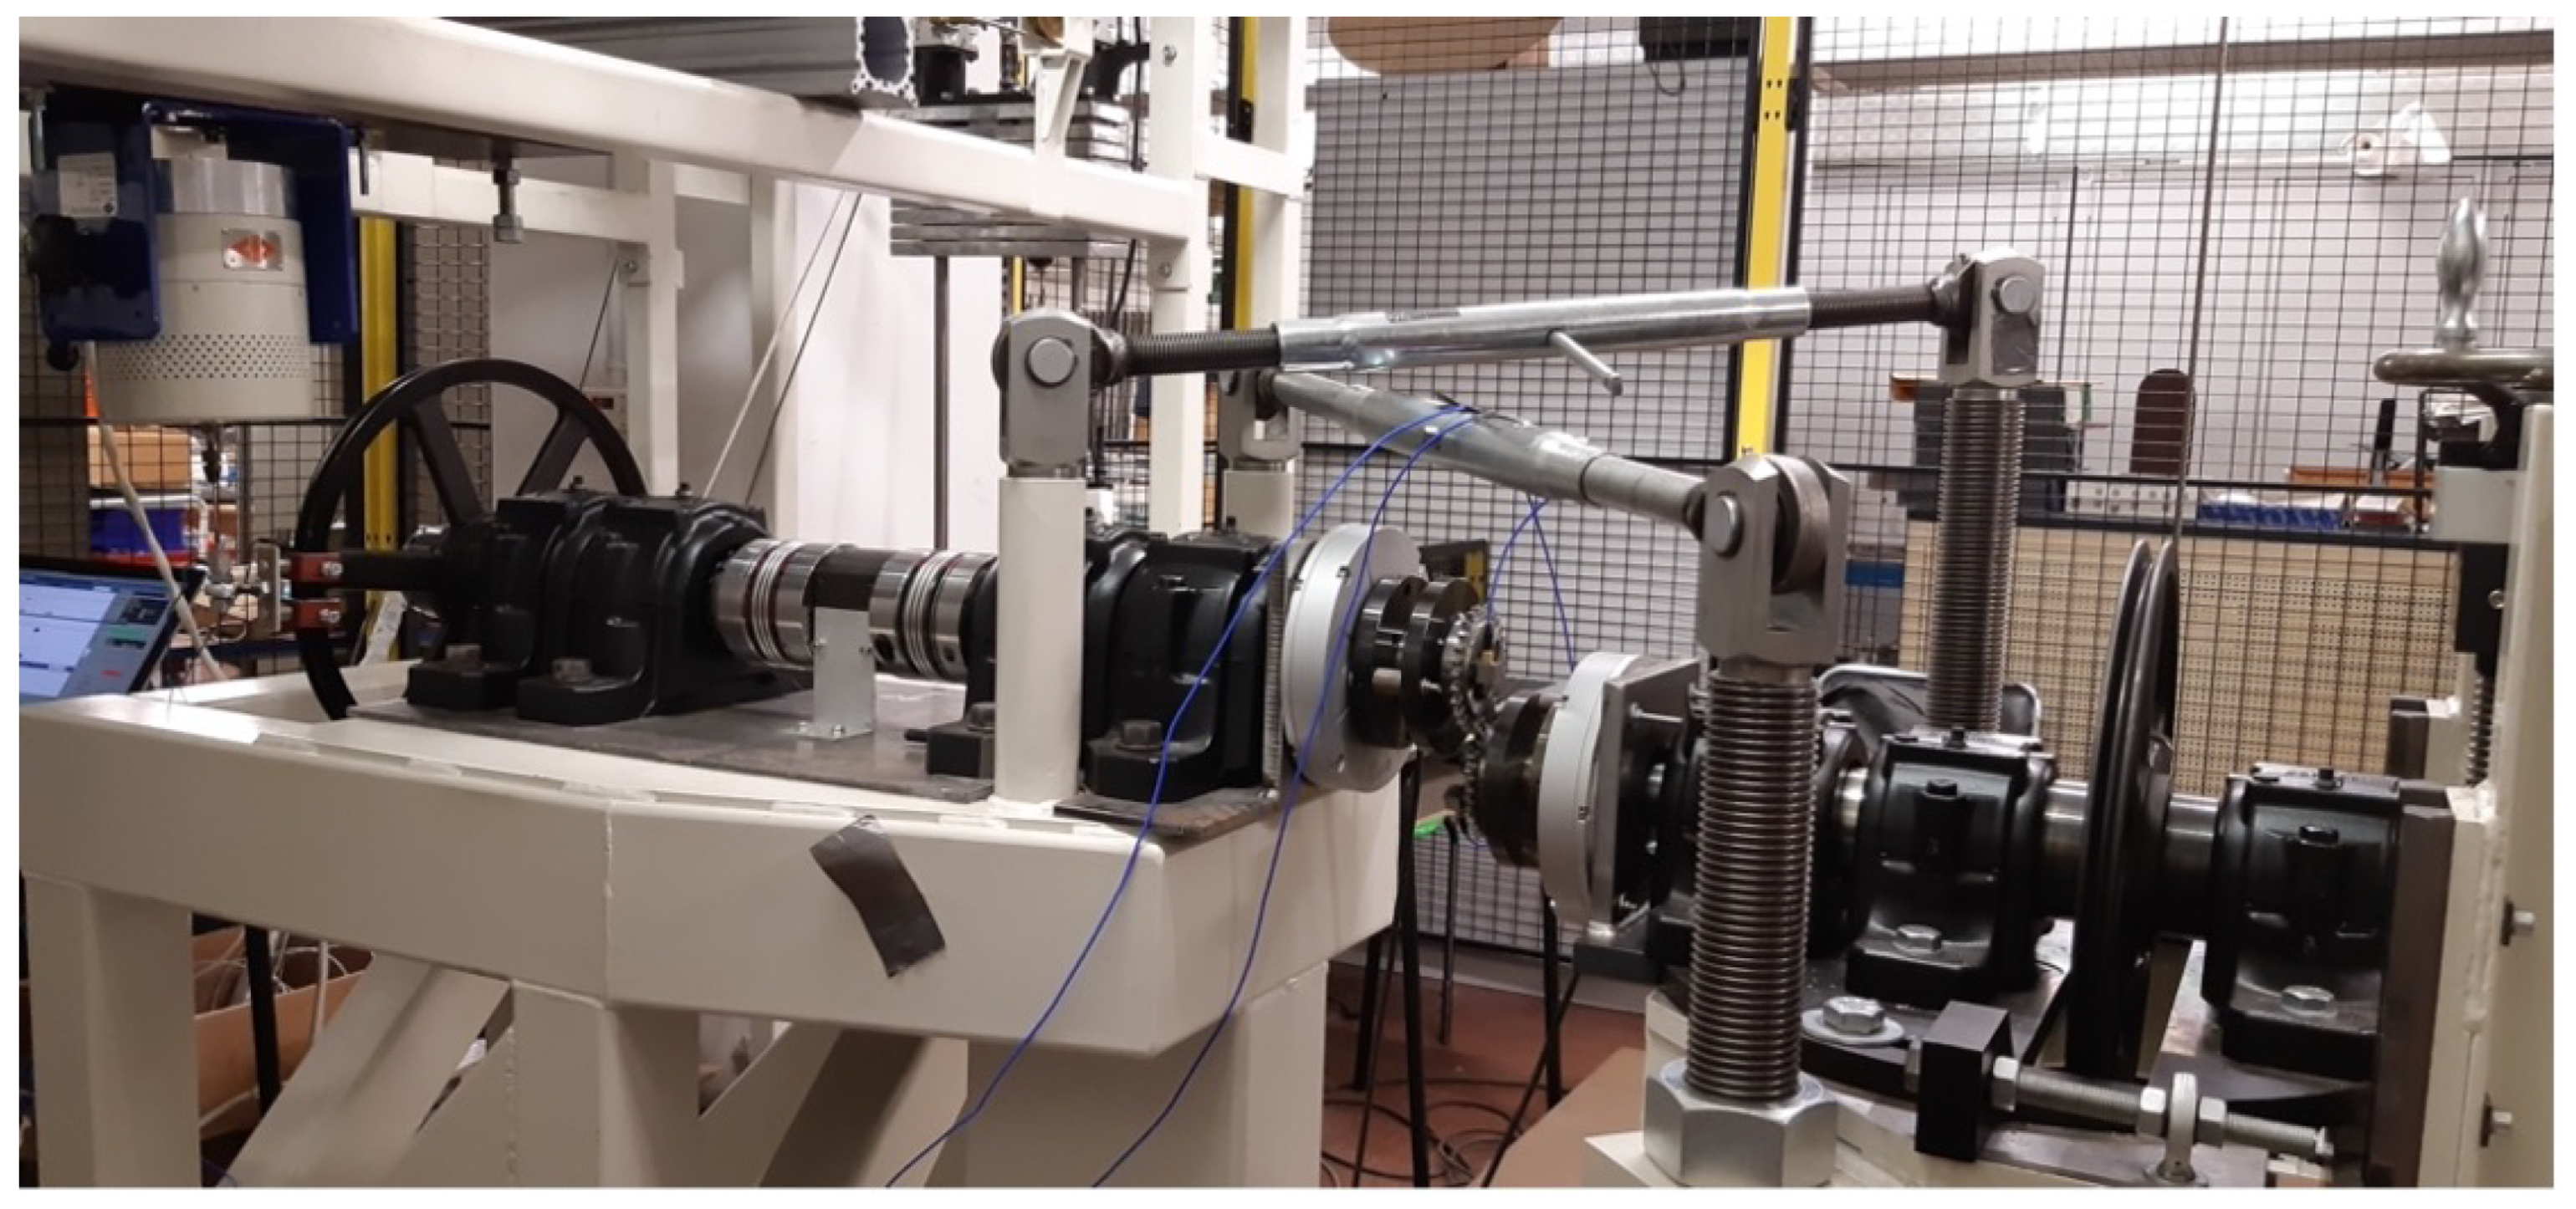
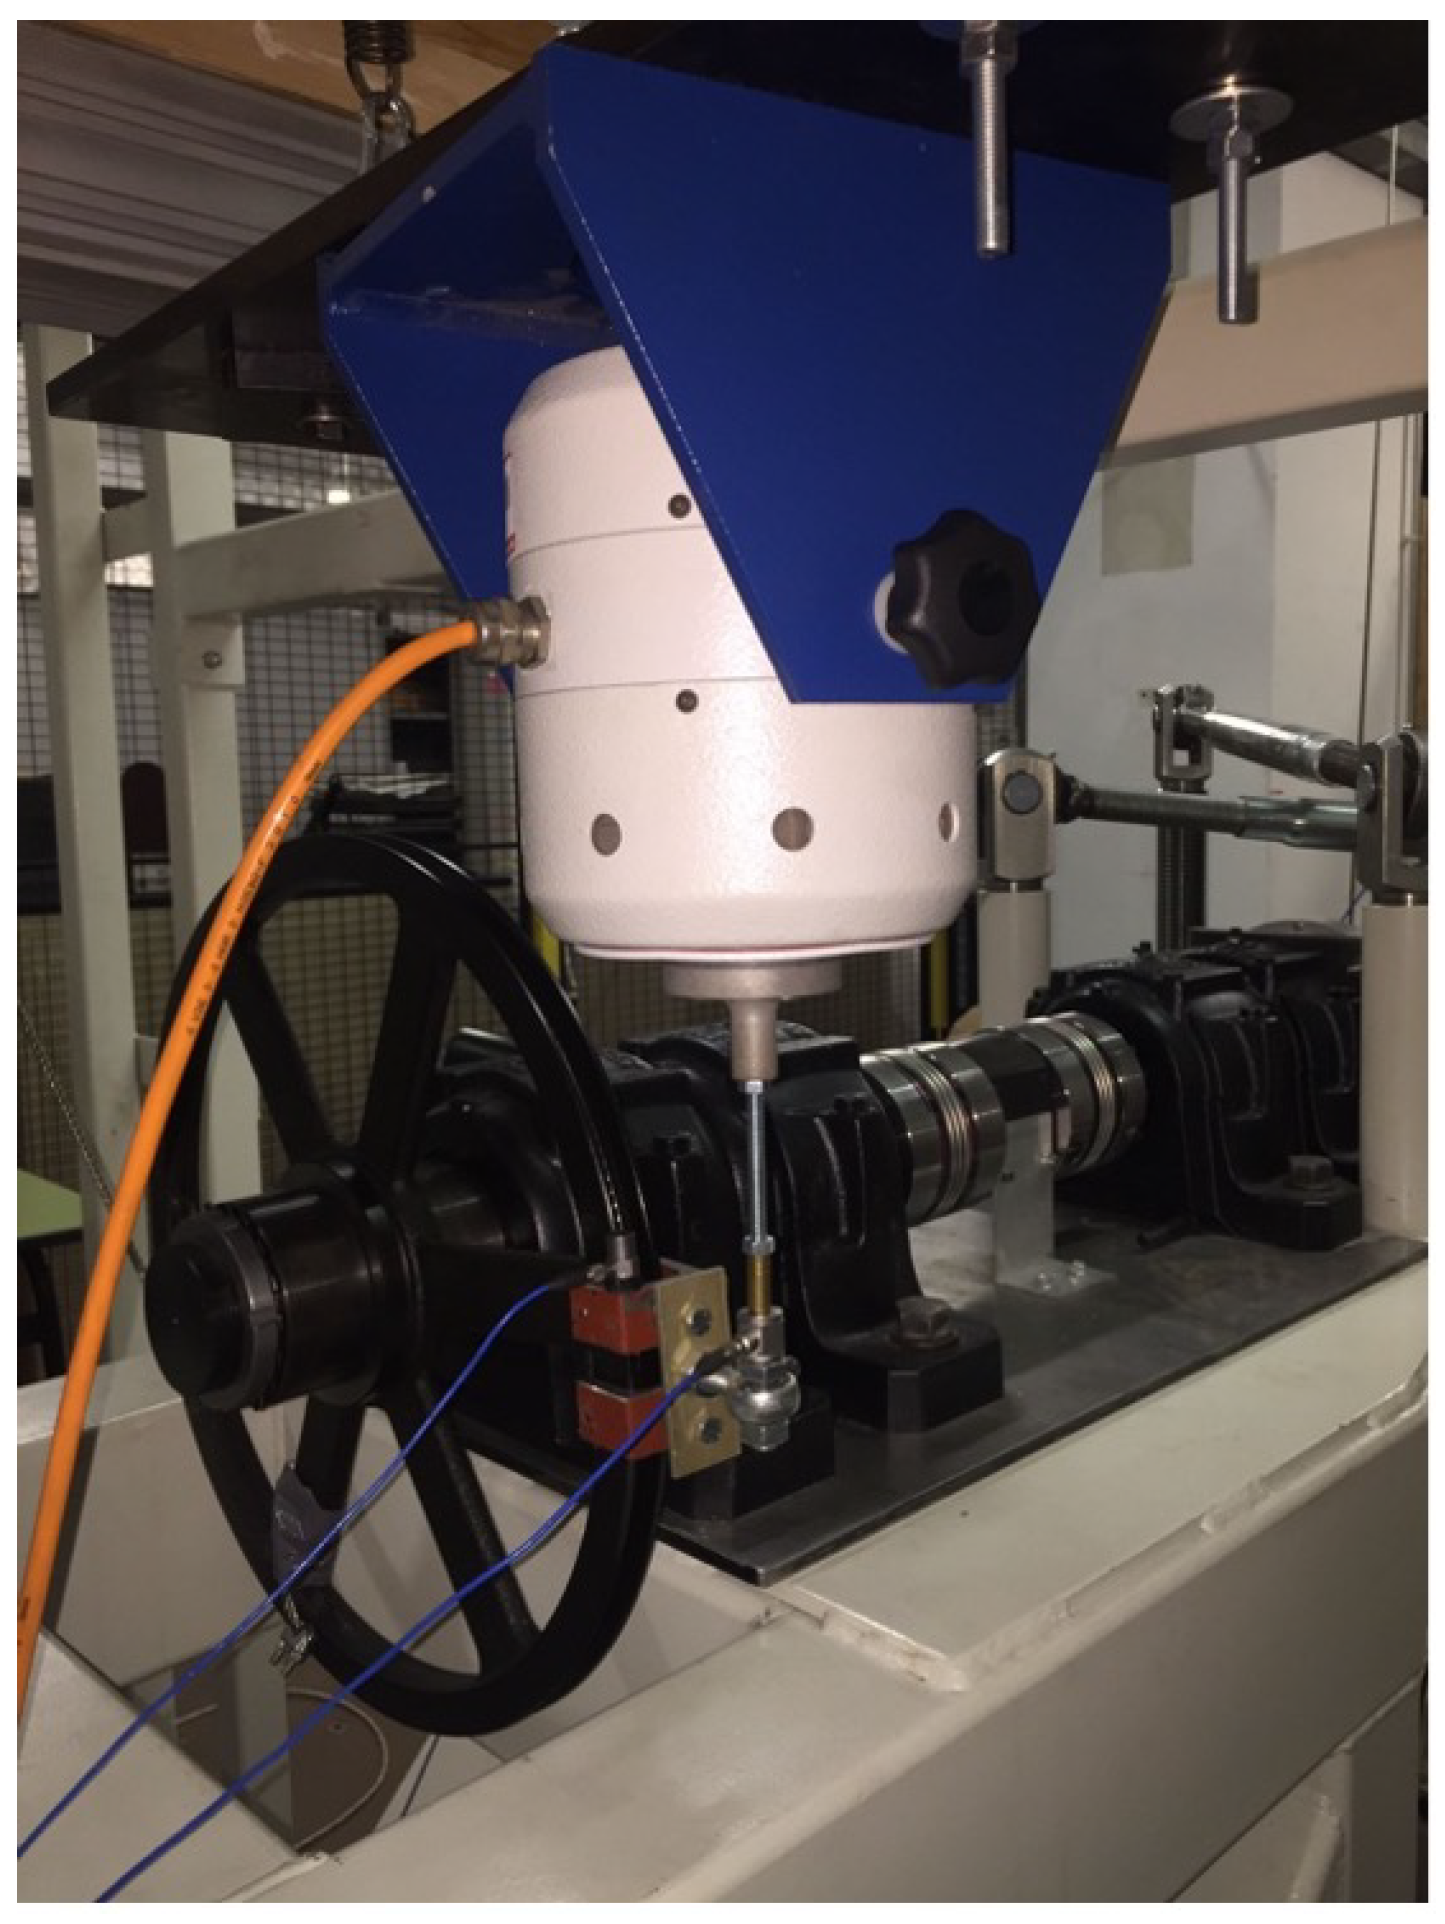
2. Test Bench Description
- Structural parts;
- Transmission of the motion;
- Measurement system;
- Security system;
- Tested gears.
2.1. Structural Parts
- Weights support;
- Fixed support;
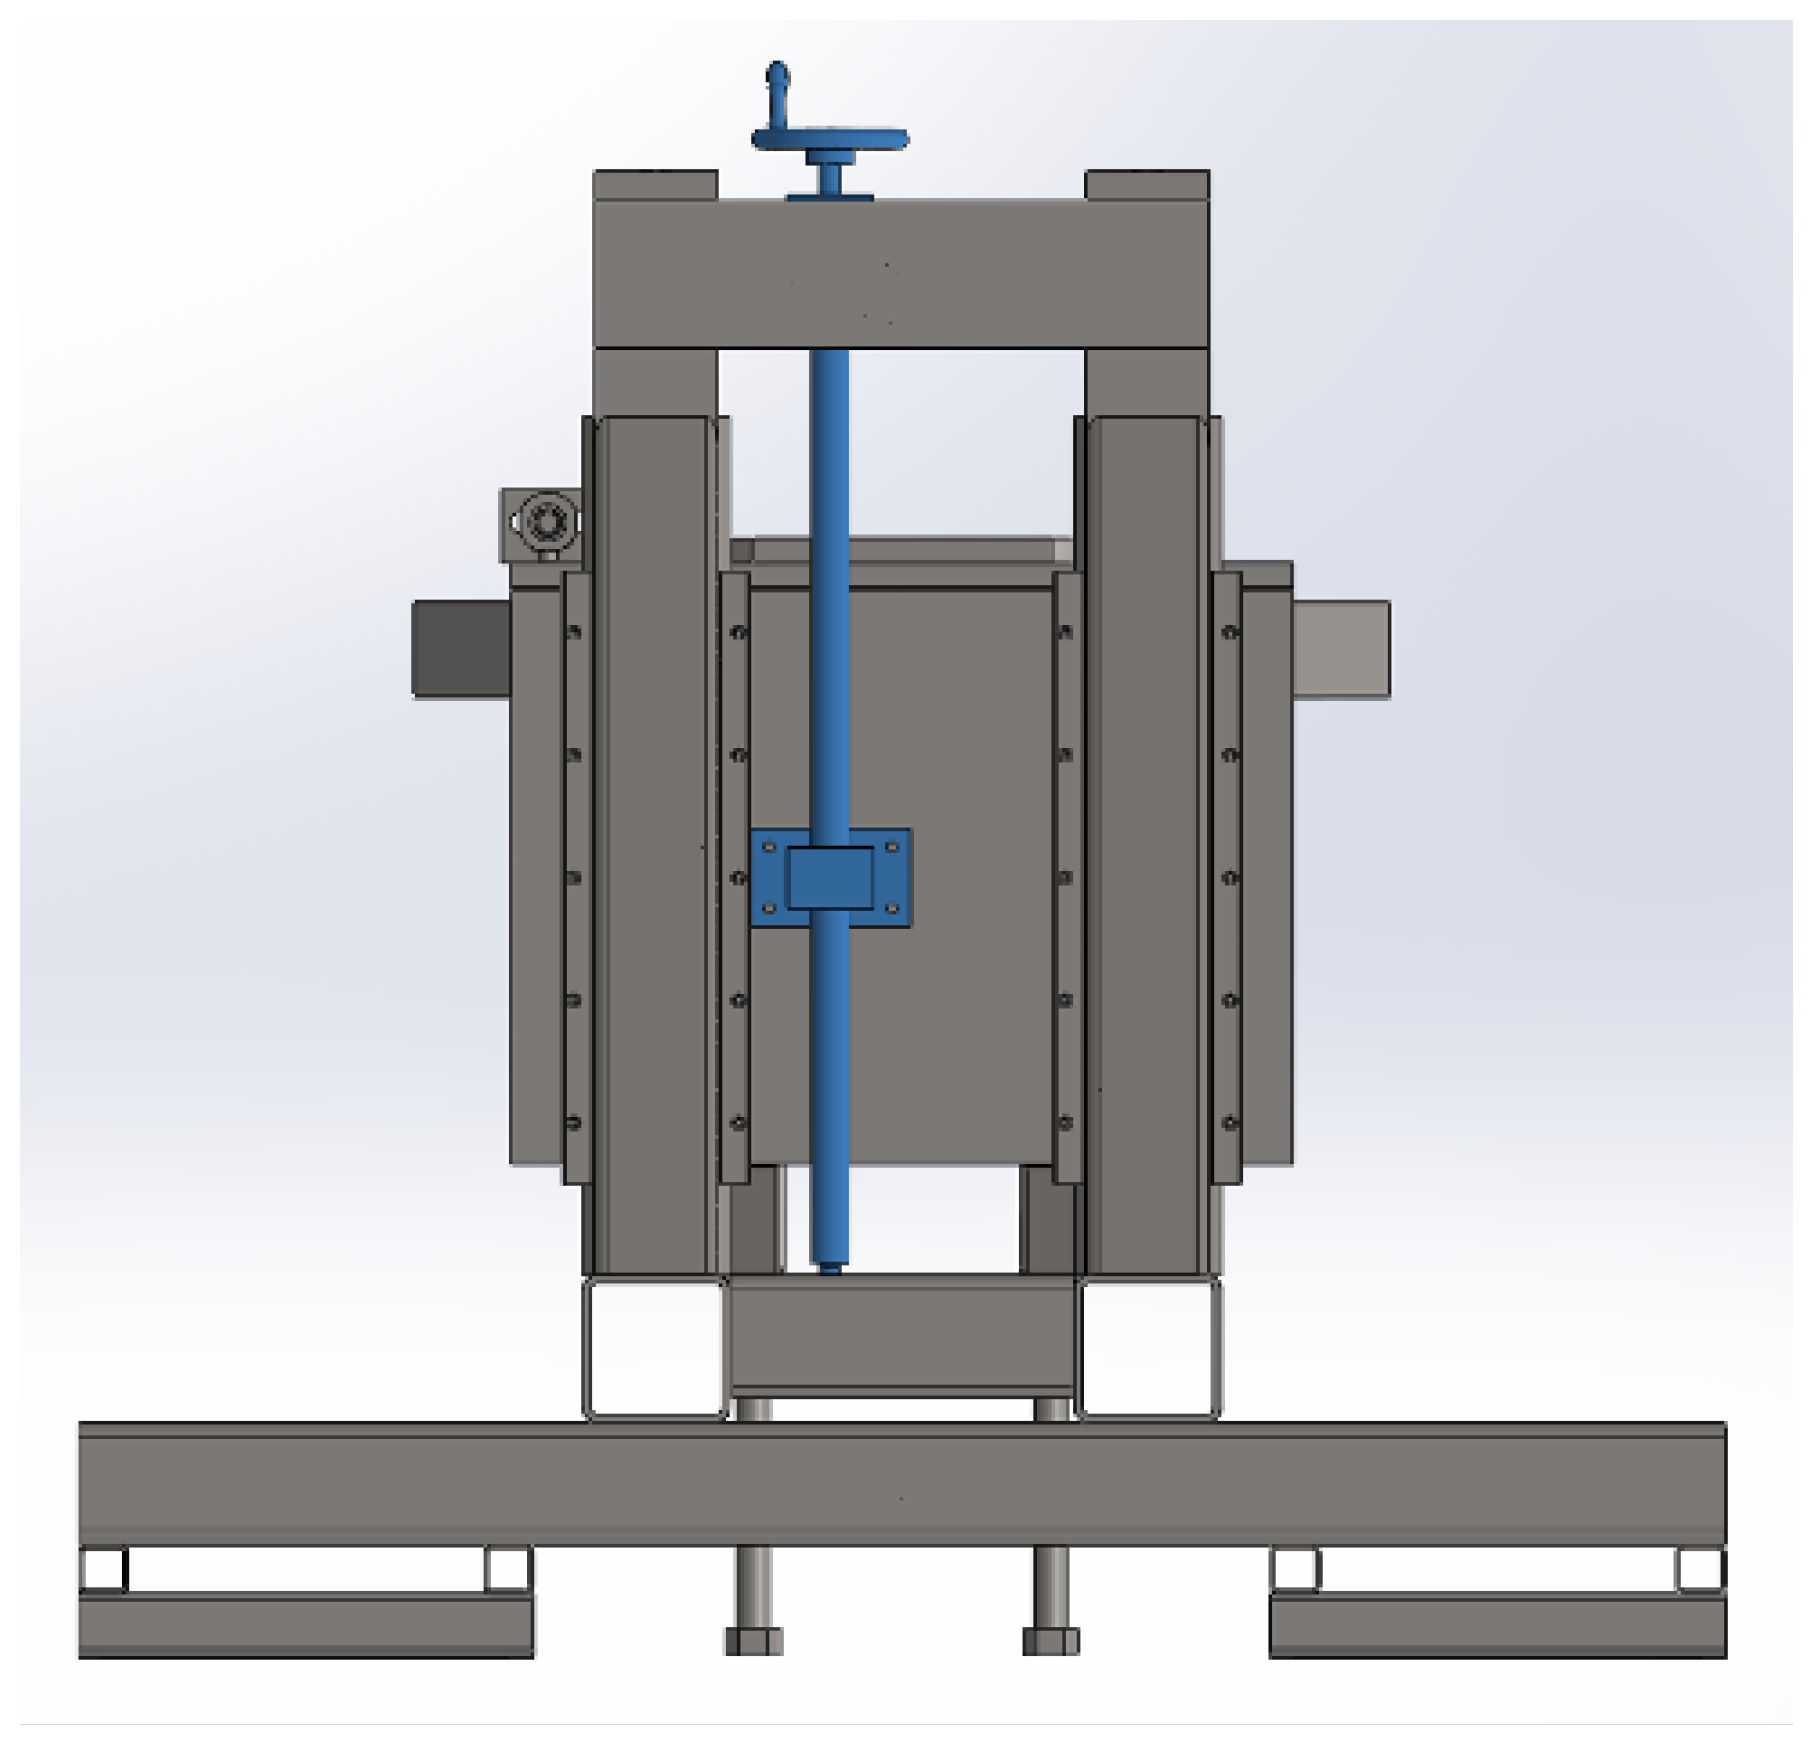
- Movable support;
- Fixed platform.
Movable Support
2.2. Transmission of the Motion
- Pulleys and brackets;
- Shaft pulleys.
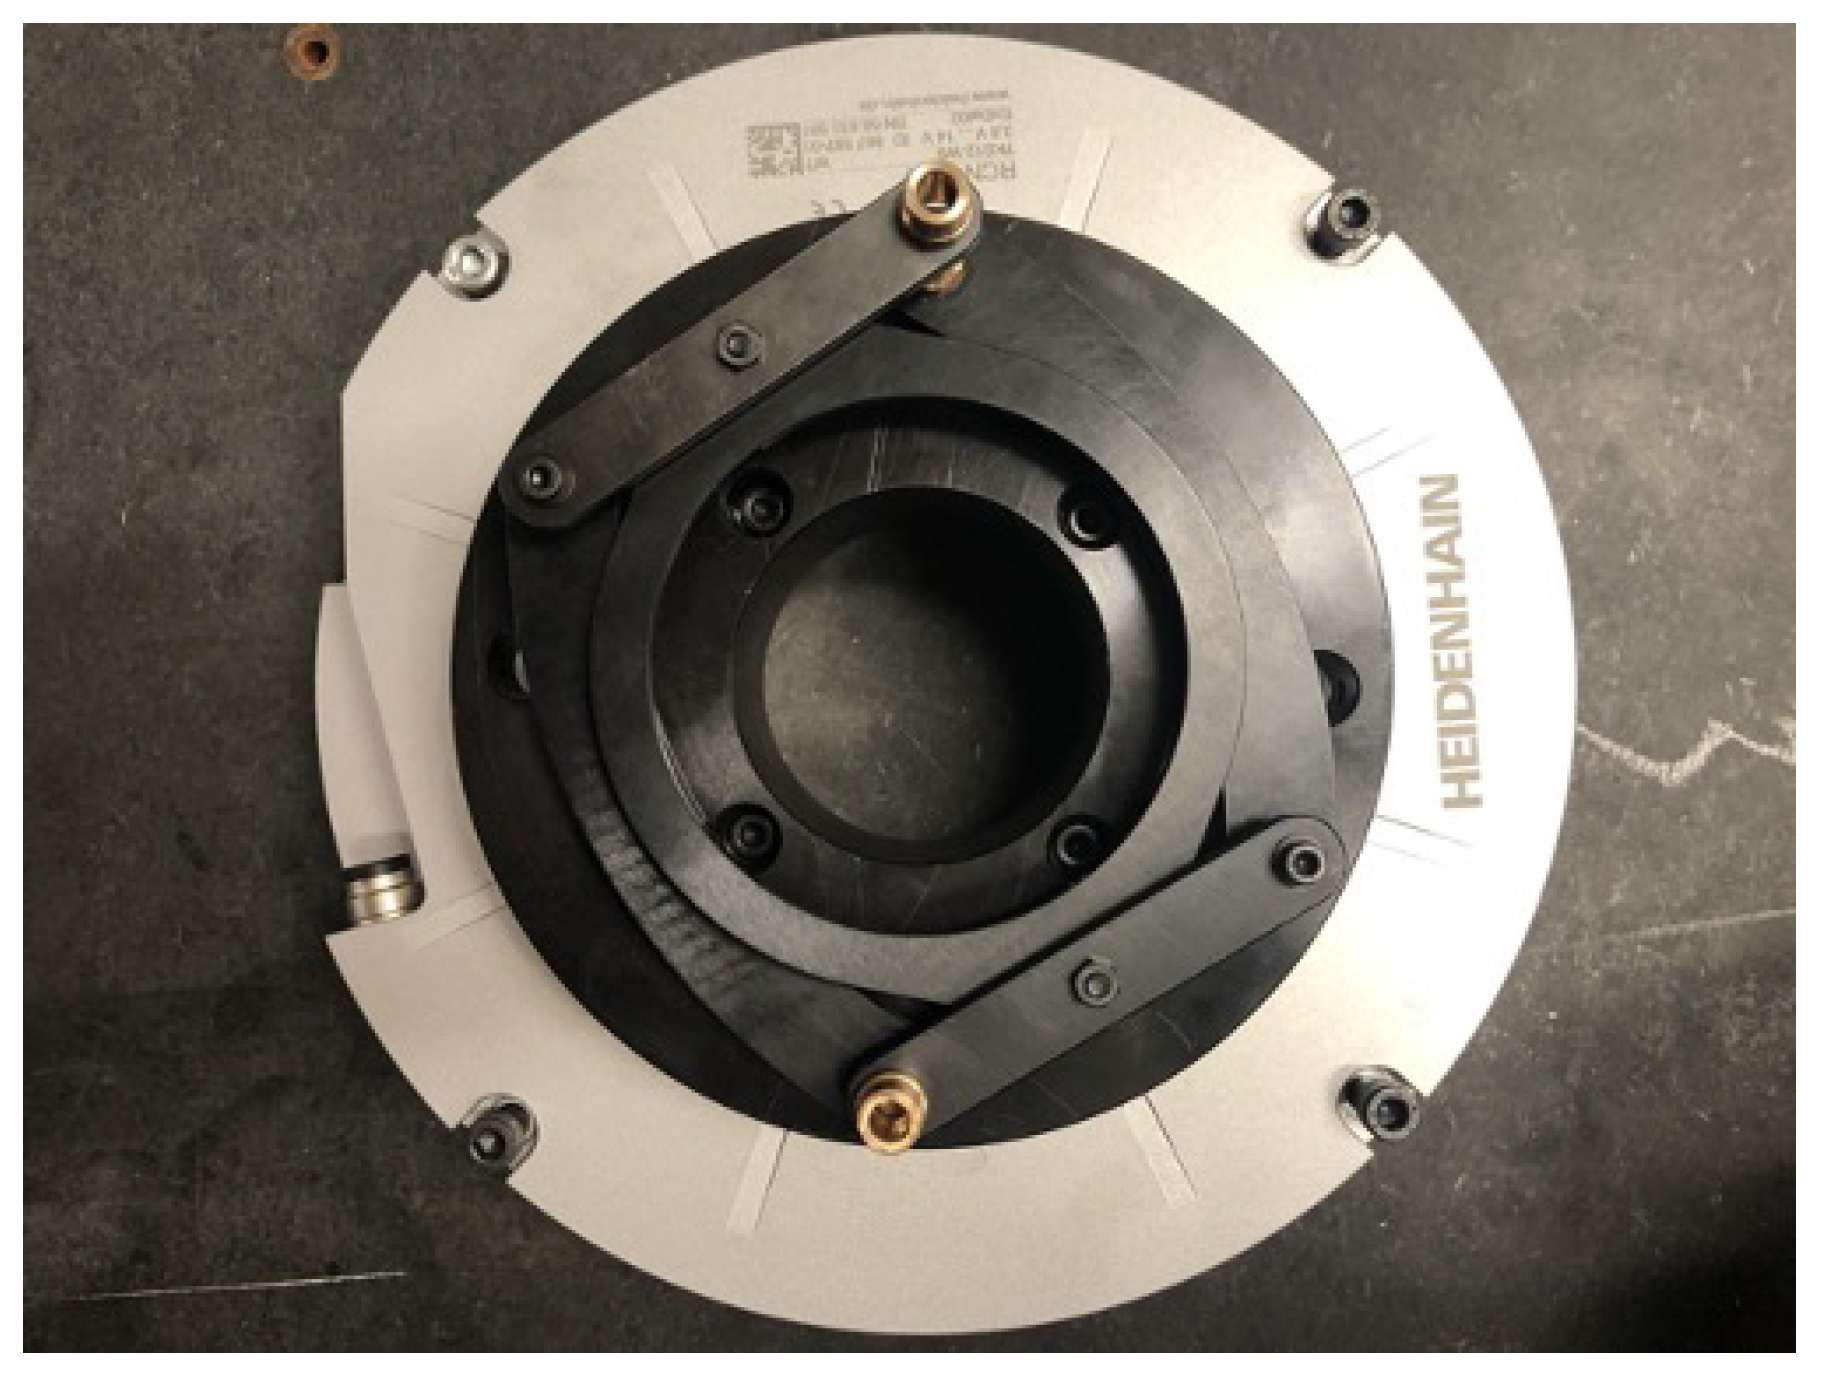
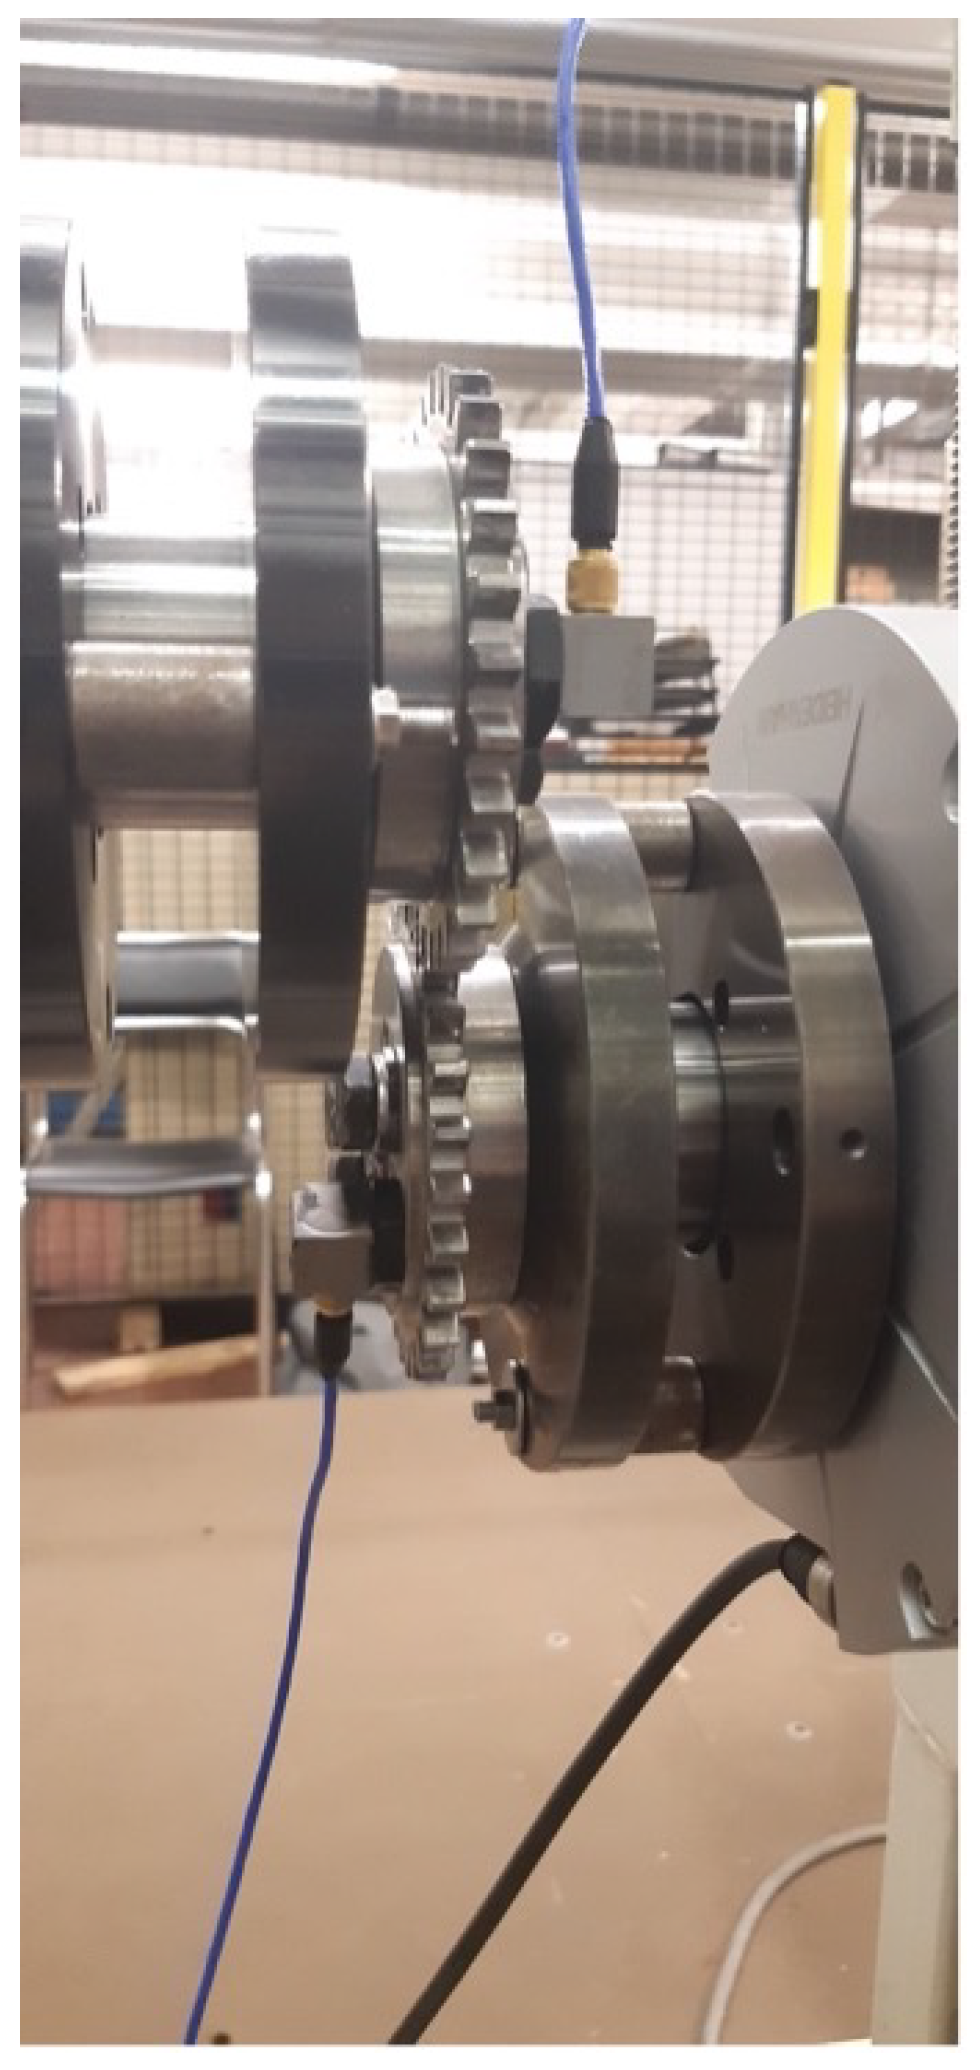
2.3. Measurement System
2.4. Tested Gears
3. Motivation of the Work
4. Proposed Methodology
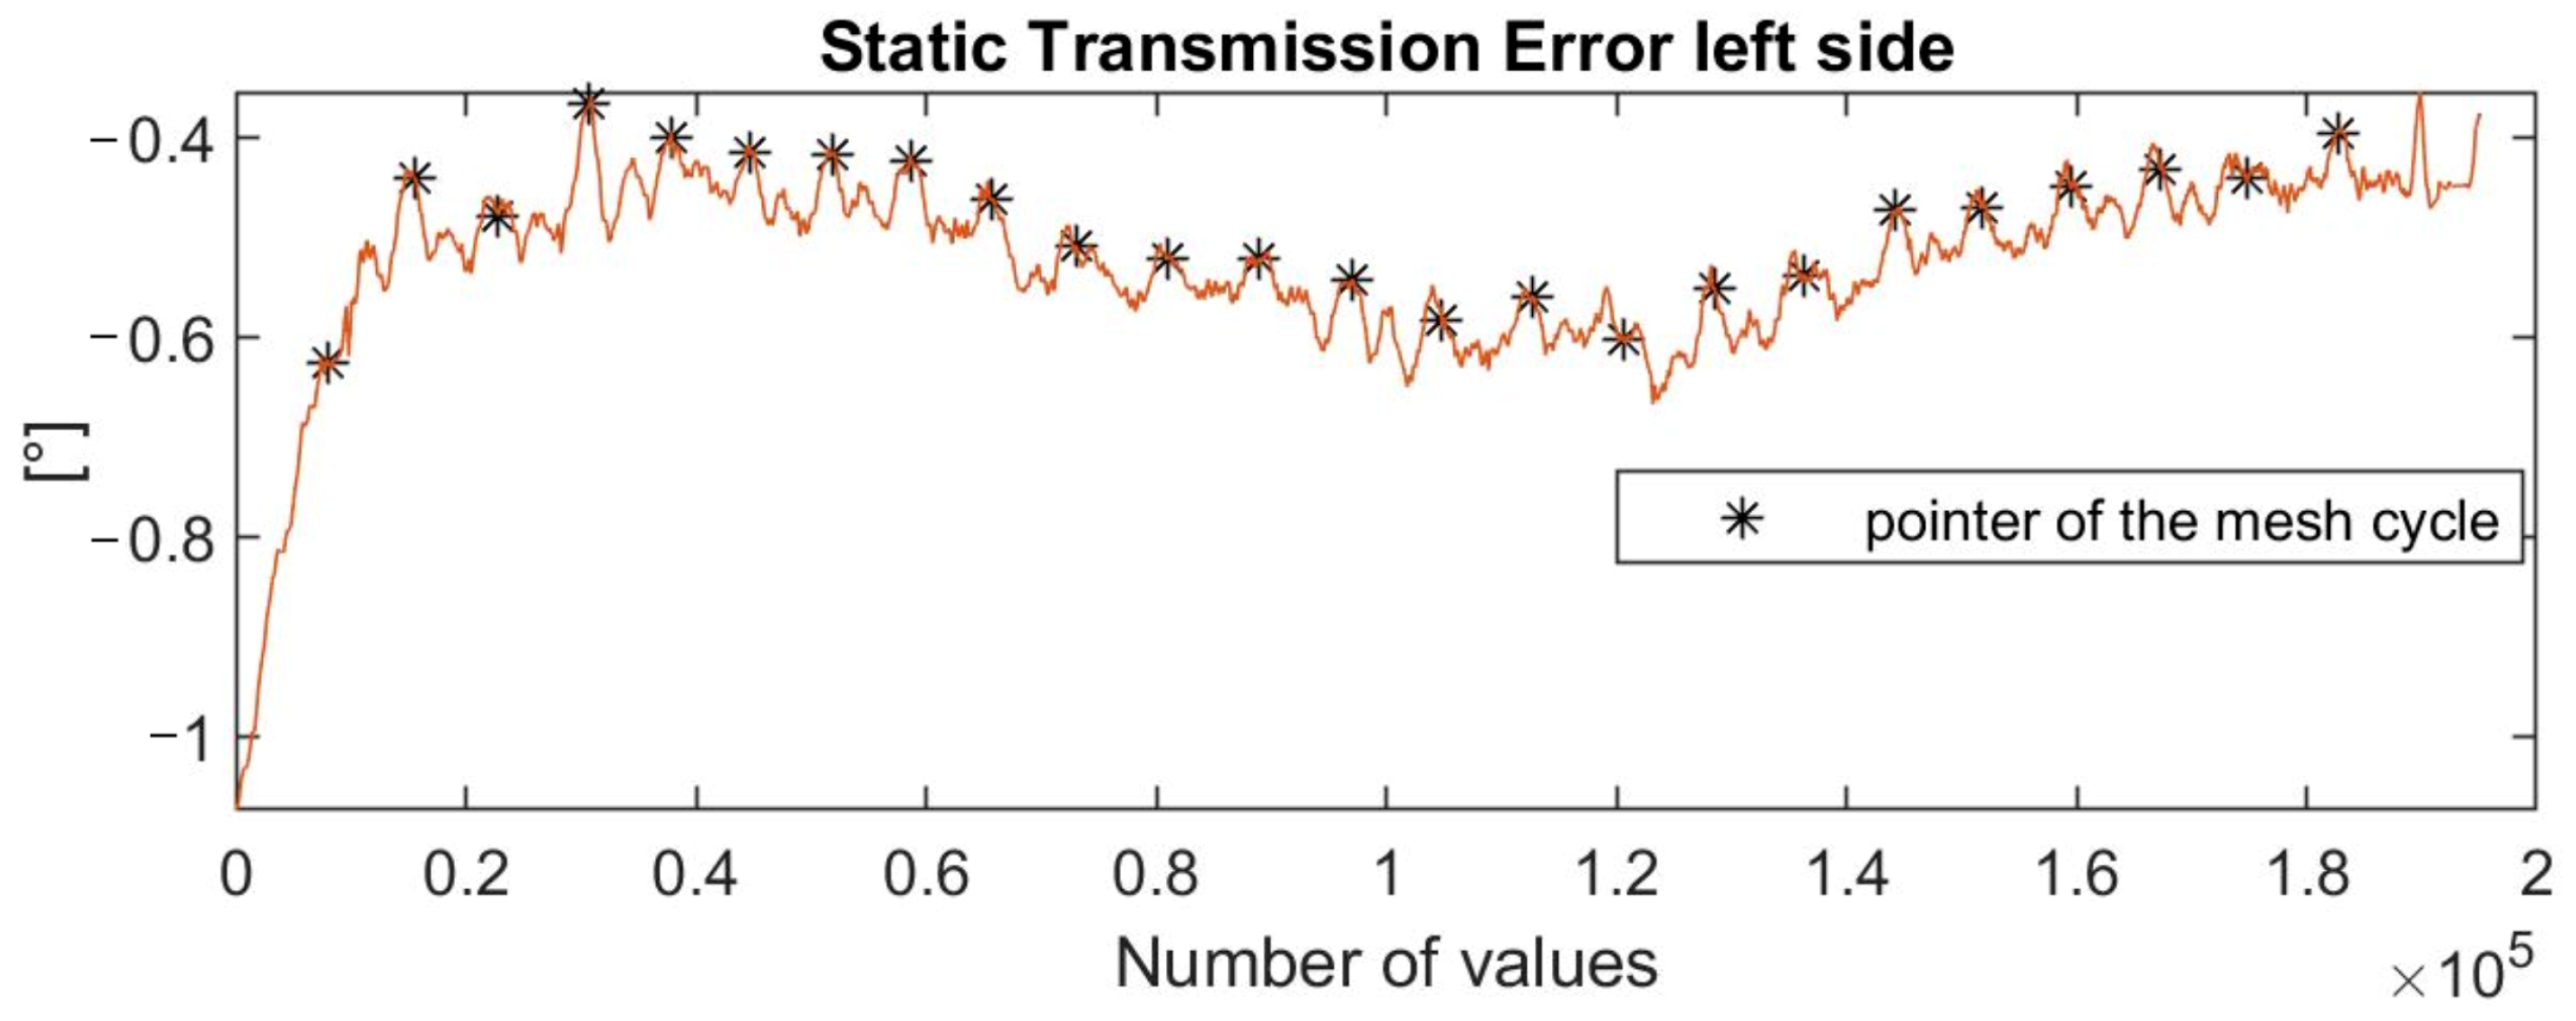
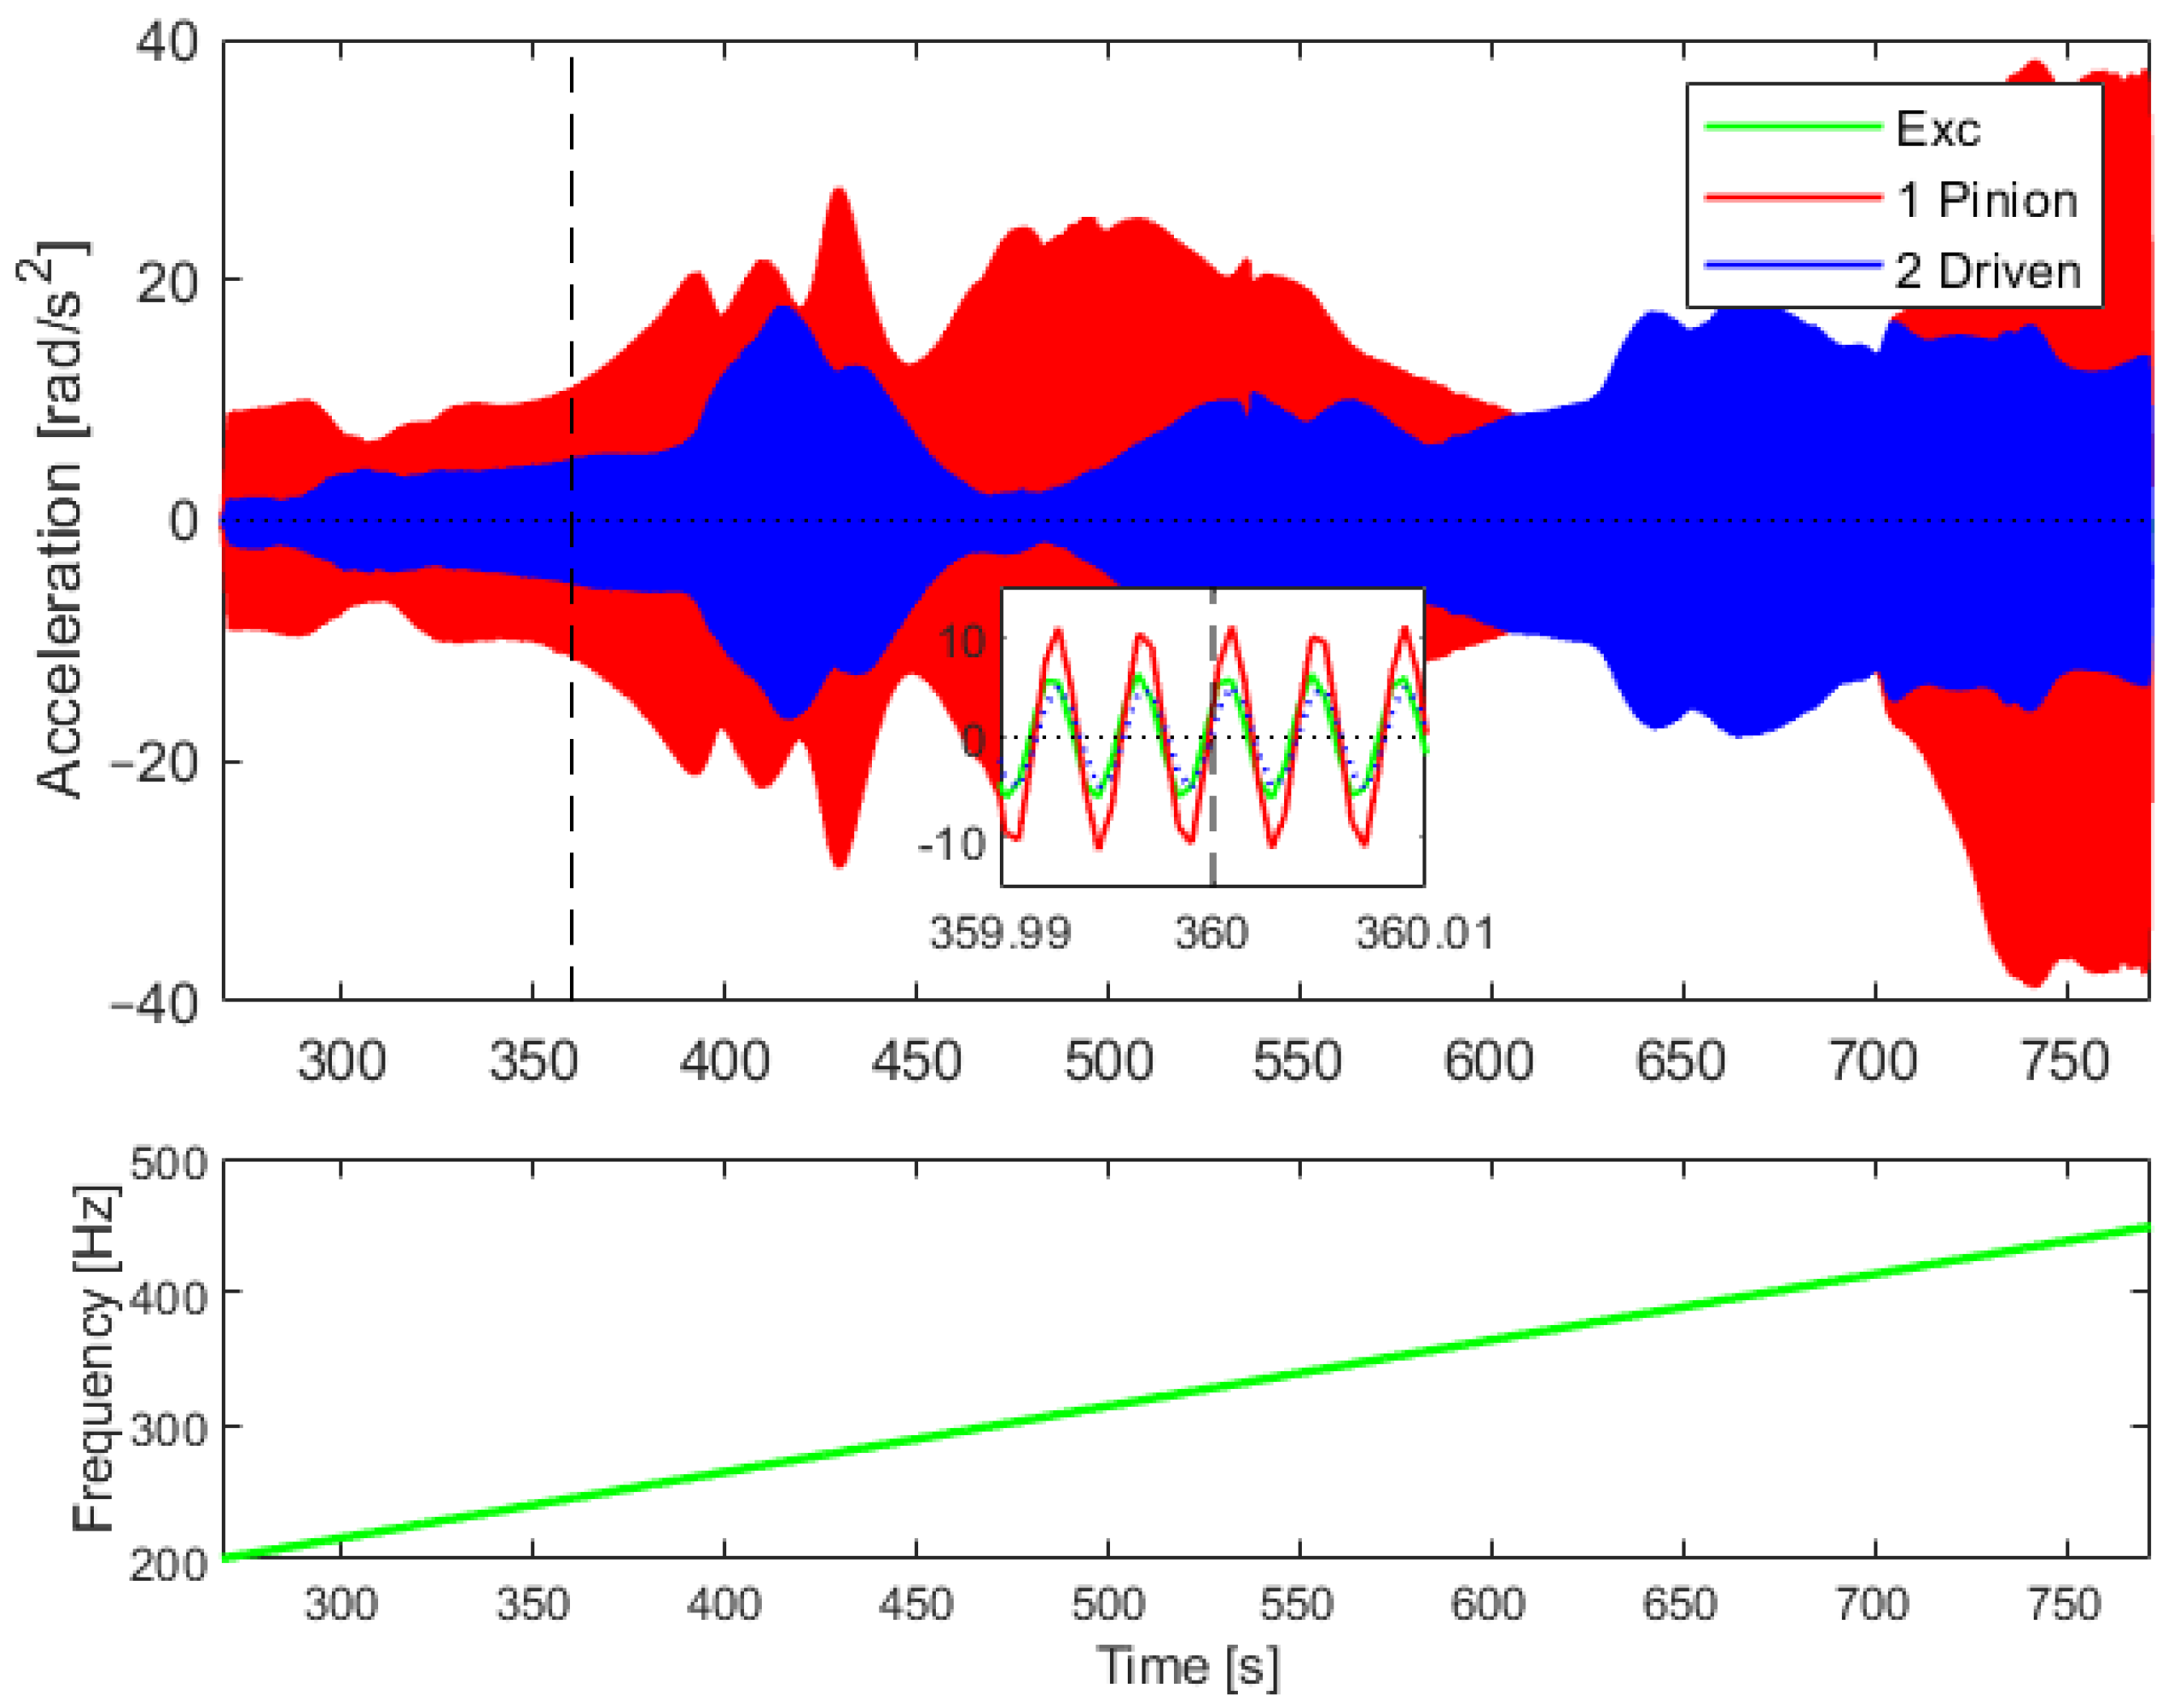
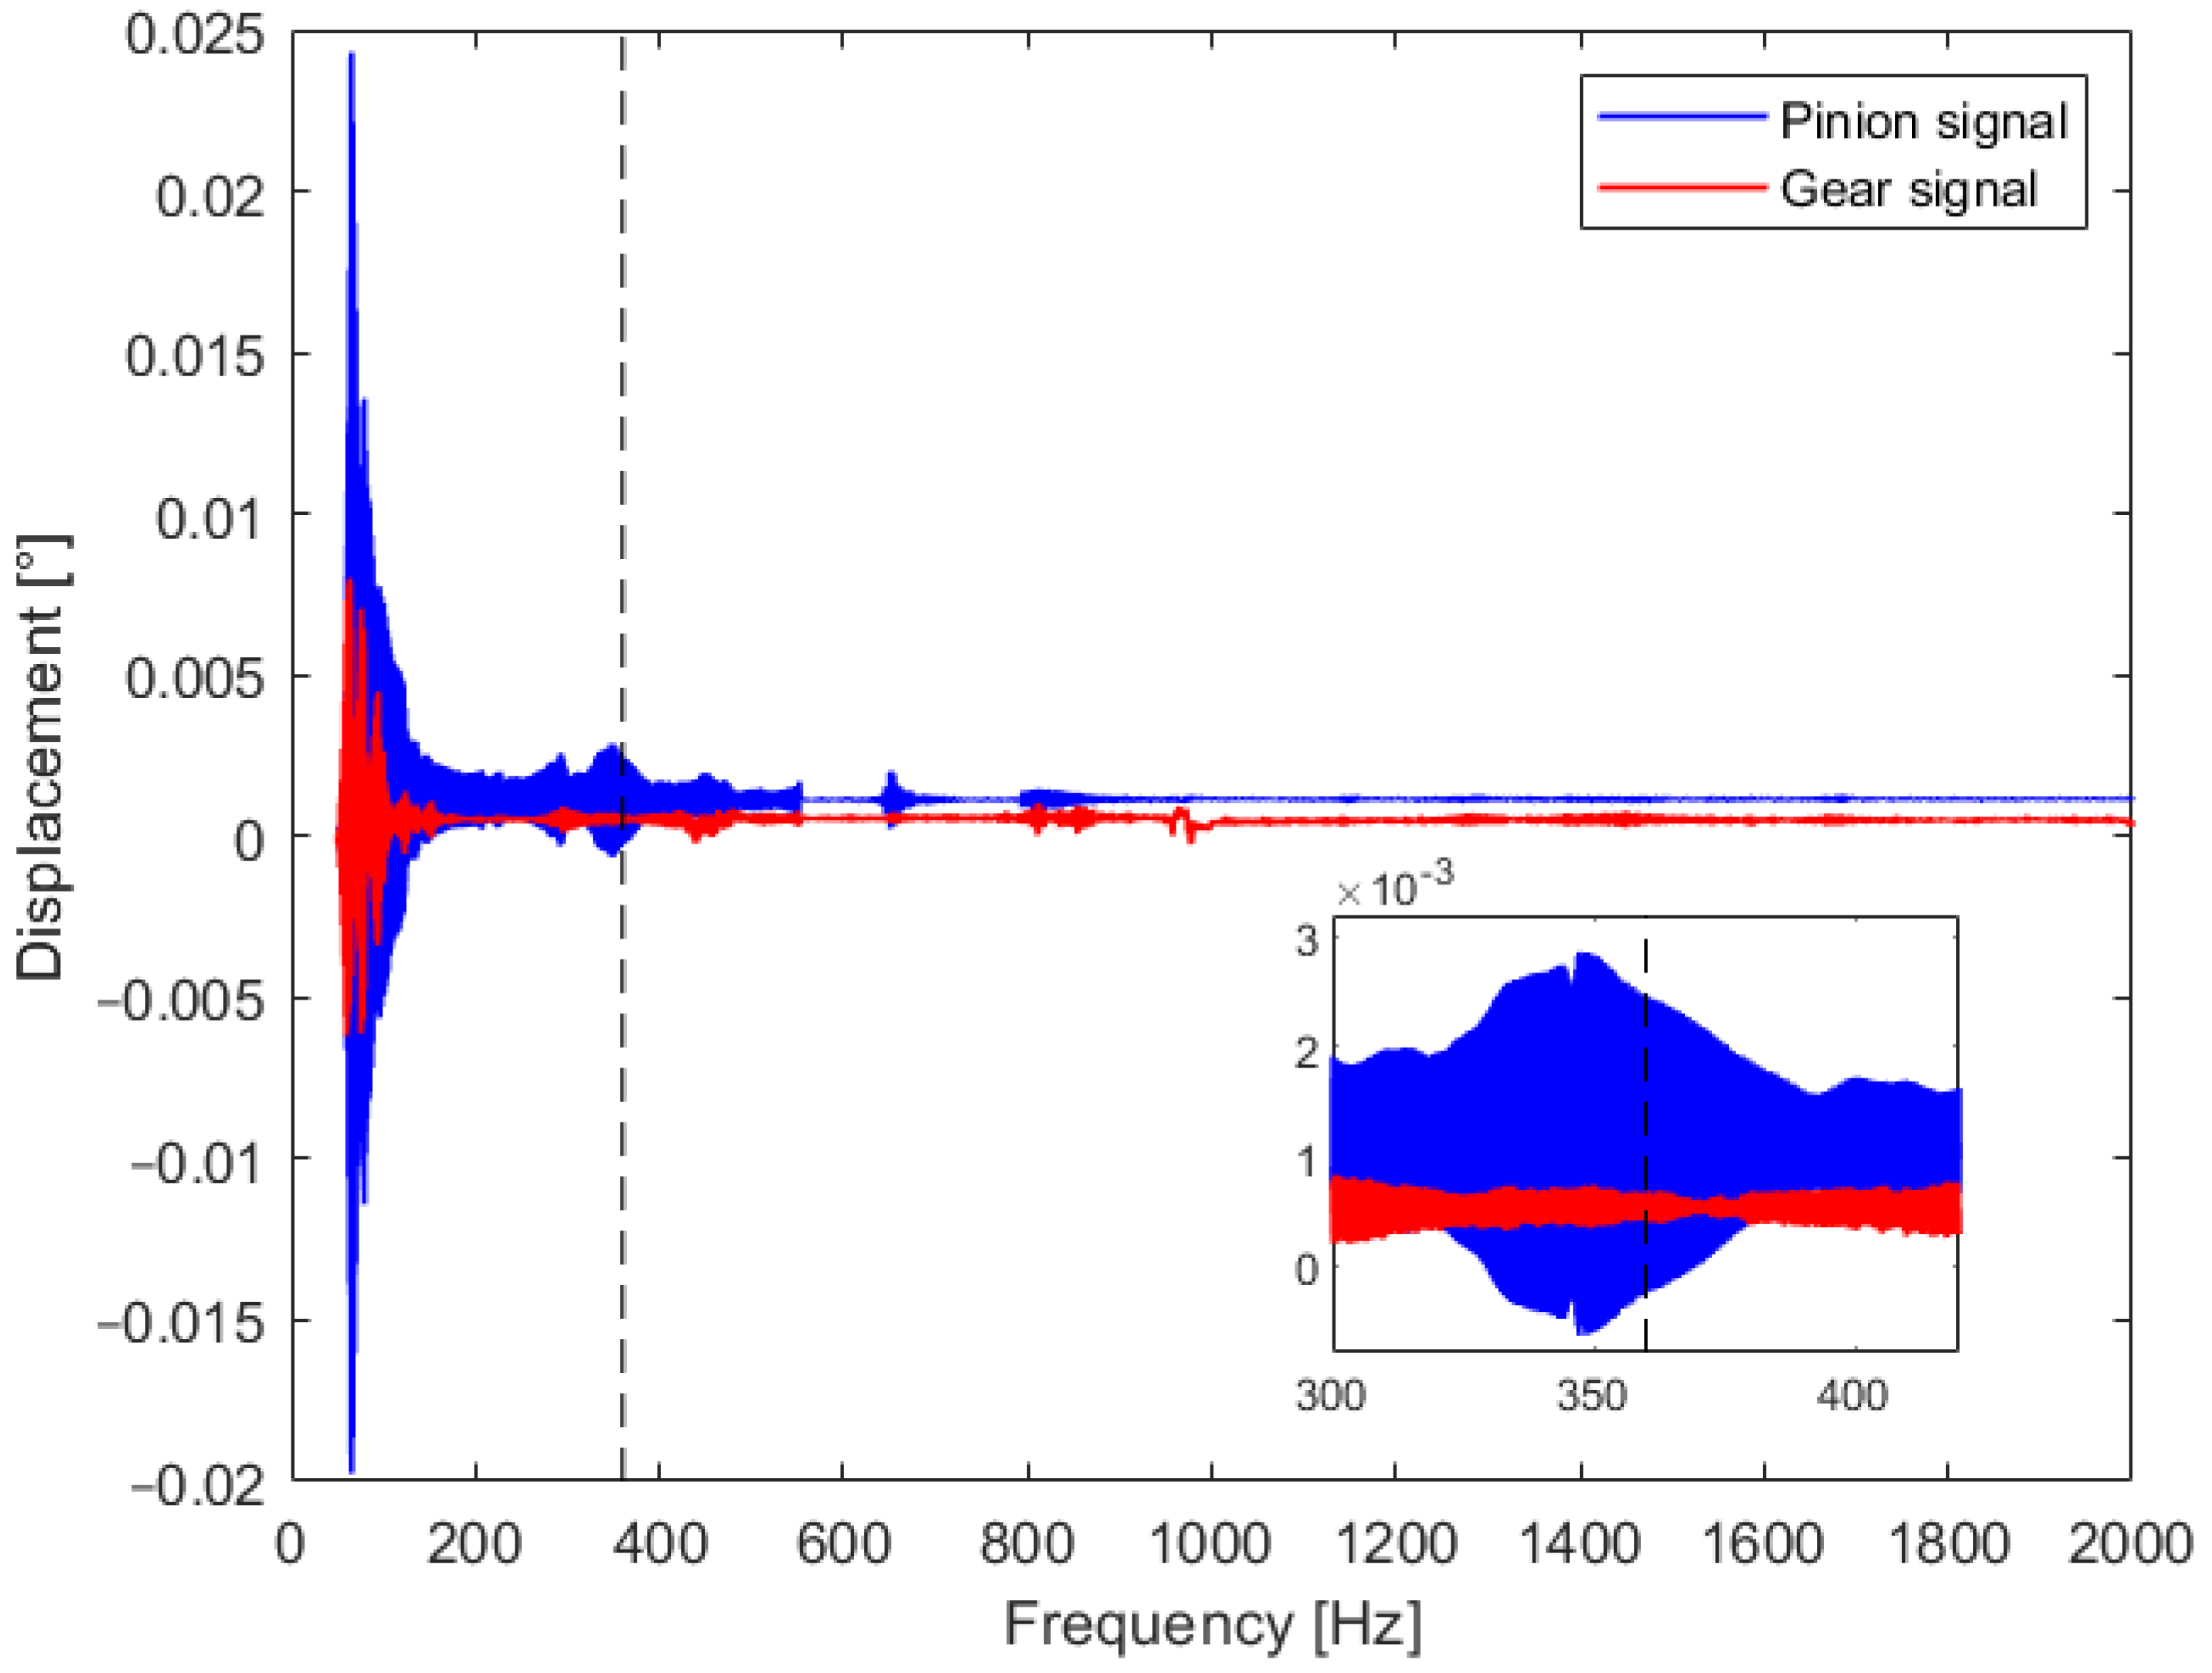
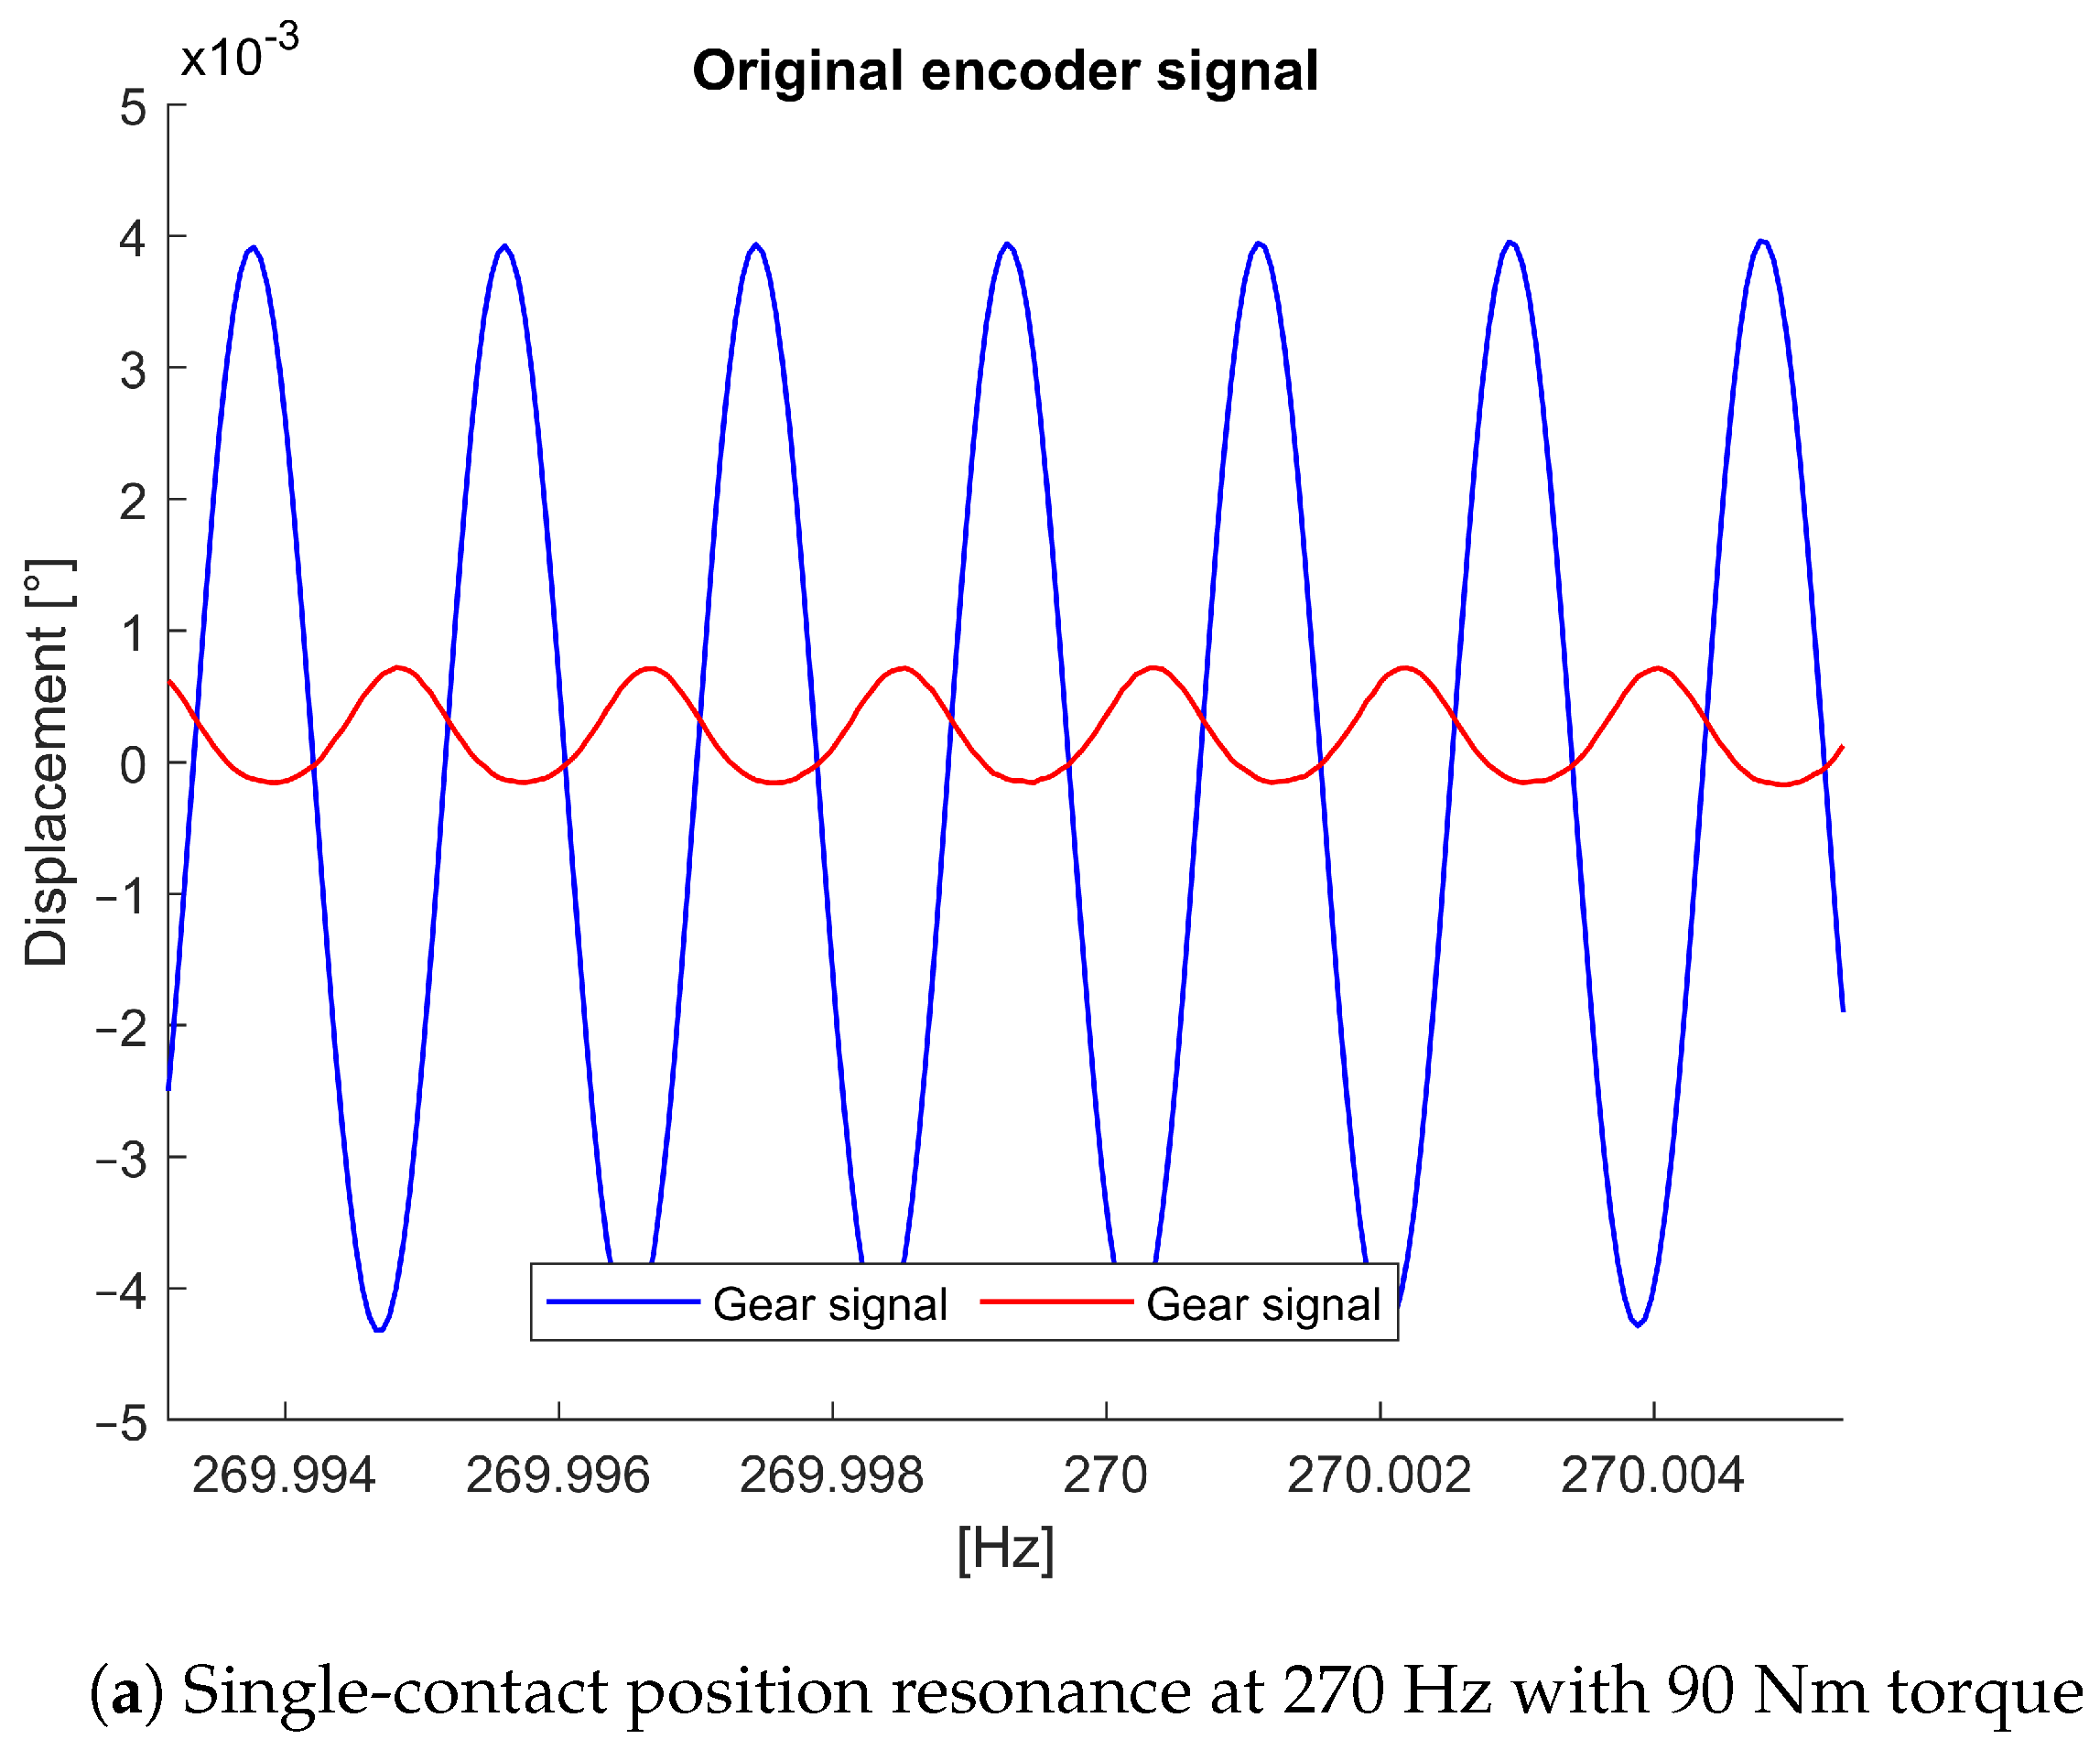
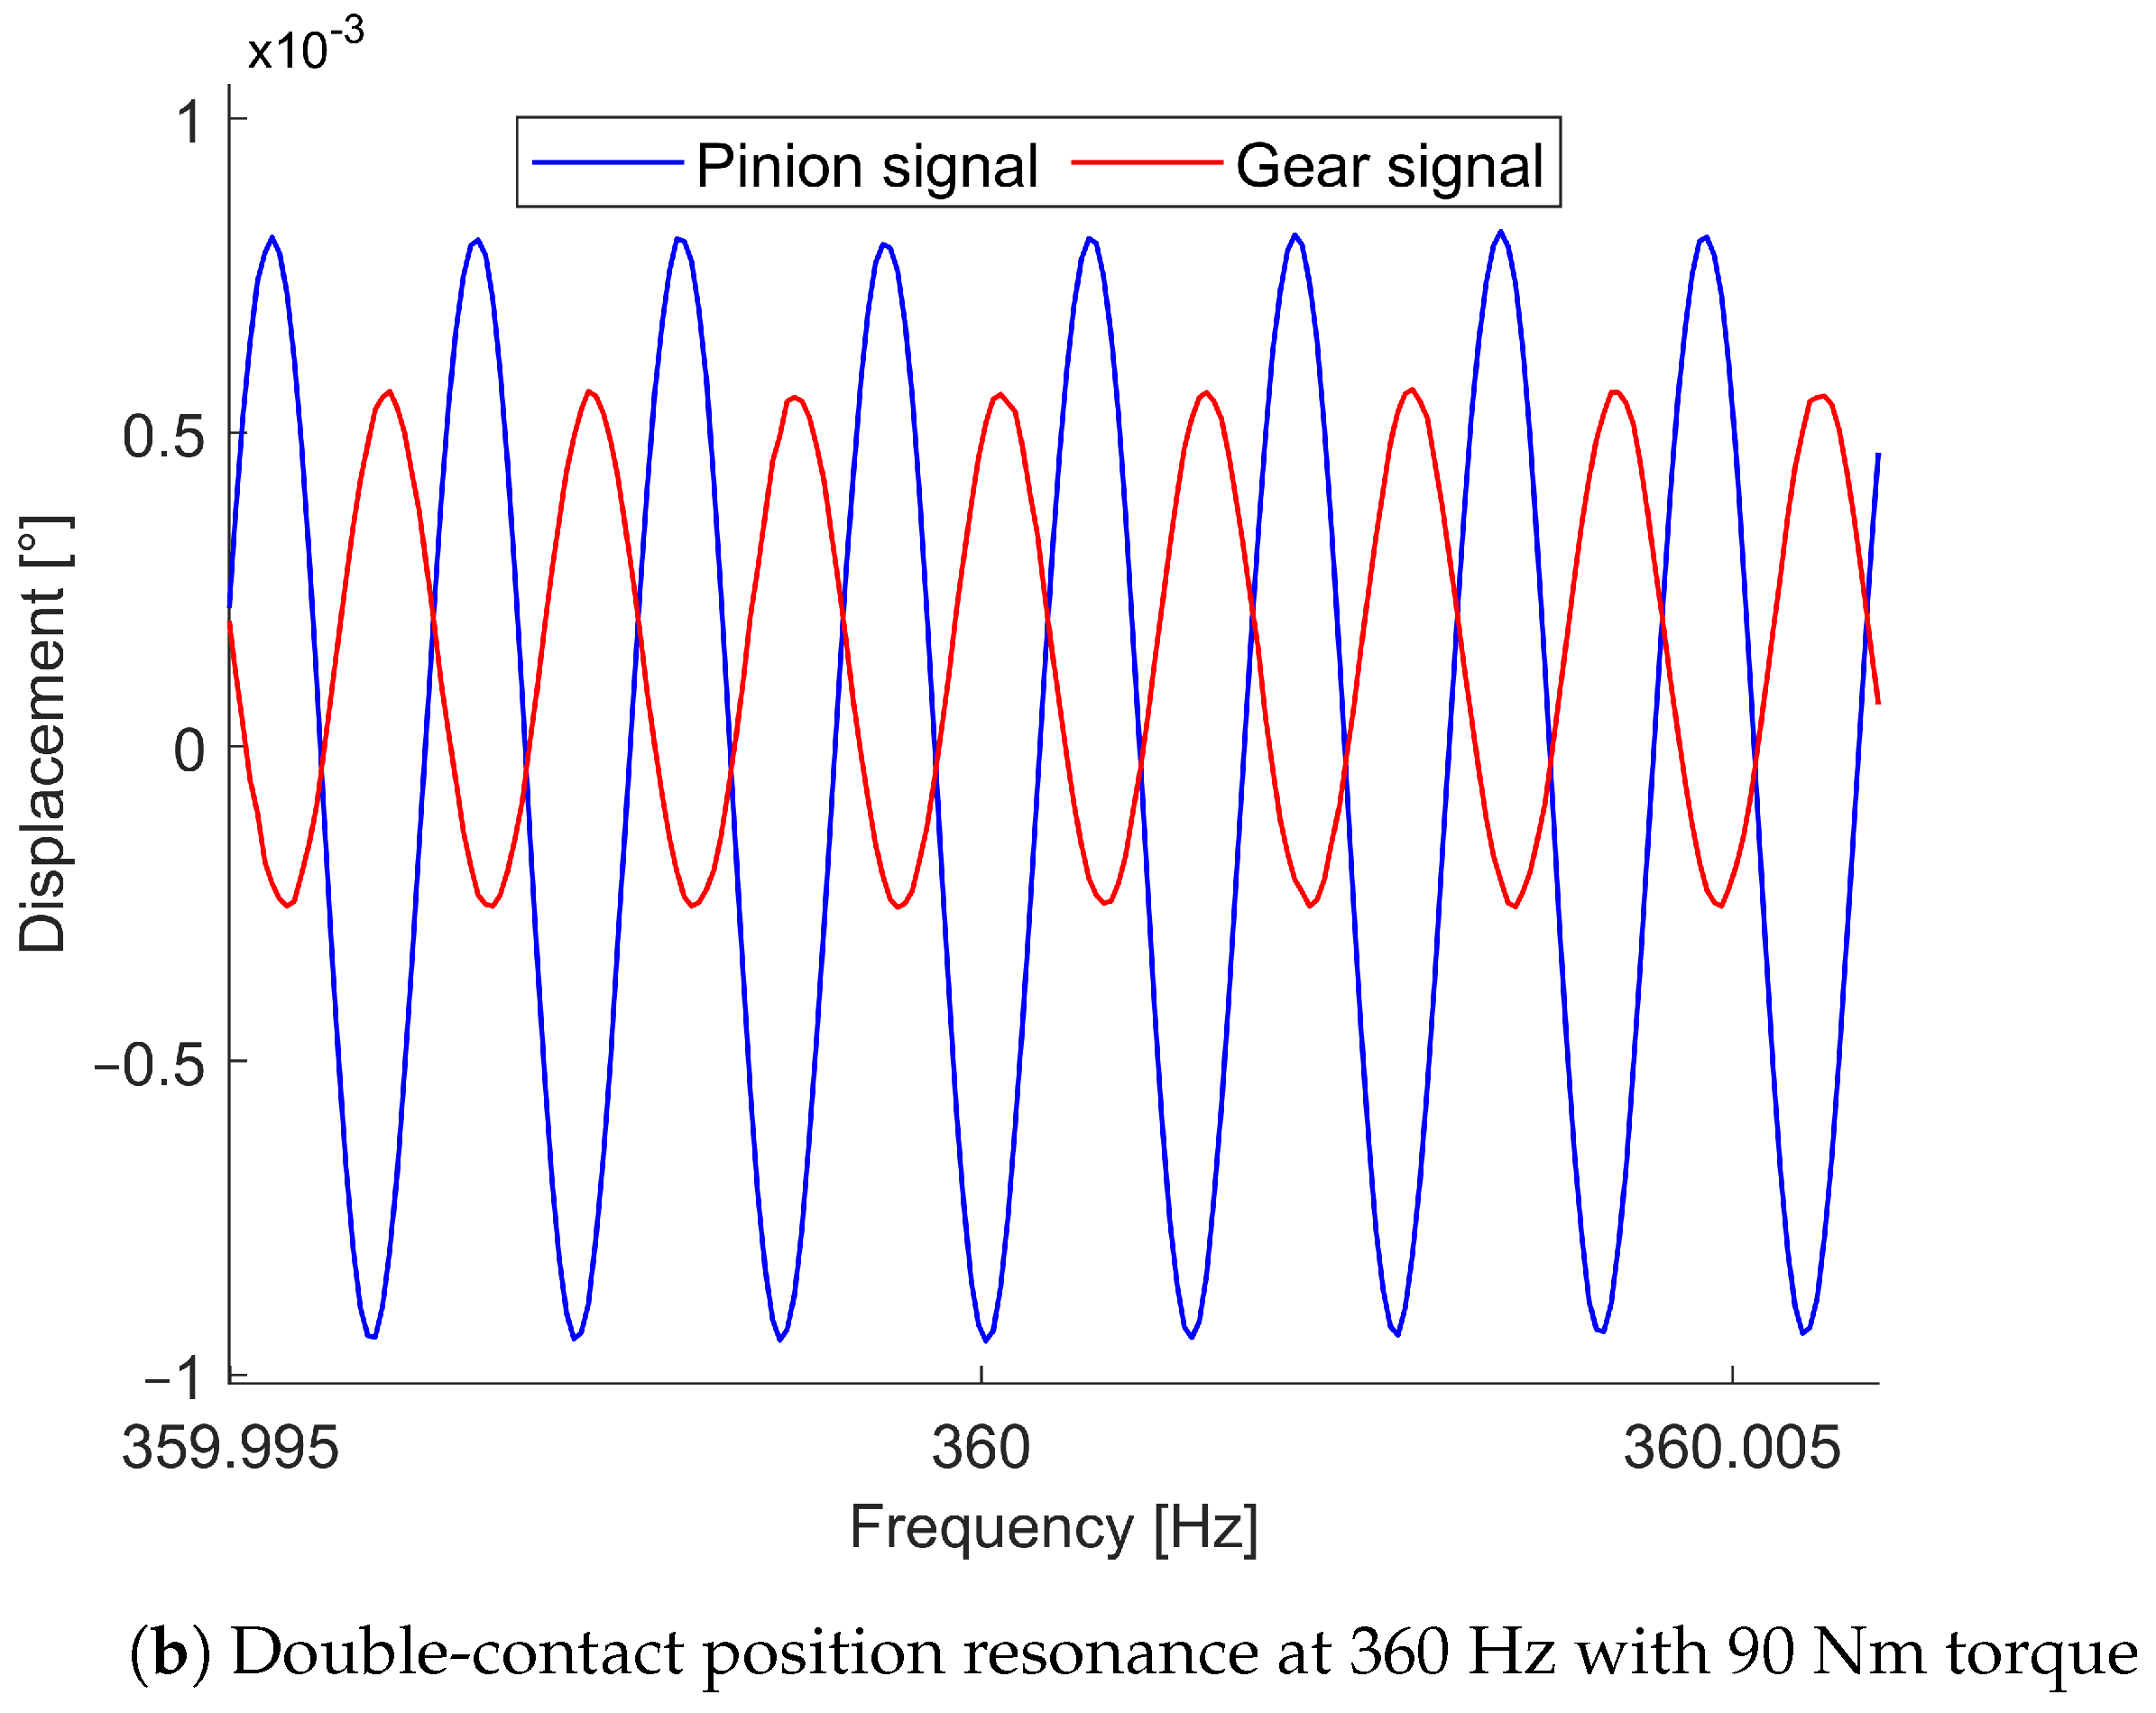
5. Experimental Results
6. Methodology Discussion
7. Conclusions
Author Contributions
Funding
Data Availability Statement
Acknowledgments
Conflicts of Interest
References
- Bruzzone, F.; Rosso, C. Sources of Excitation and Models for Cylindrical Gear Dynamics: A Review. Machines 2020, 8, 37. [Google Scholar] [CrossRef]
- Weber, C. The Deformation of Load Gears and the Effect on Their Load-Carrying Capacity; Technical Report n.3; British Department of Scientific and Industrial Research: London, UK, 1949. [Google Scholar]
- Harris, S.L. Dynamic Loads on the Teeth of Spur Gears. Proc. Inst. Mech. Eng. 1958, 172, 87–112. [Google Scholar] [CrossRef]
- Parker, R.G.; Vijayakar, S.M.; Imajo, T. Non-Linear Dynamic Response Of A Spur Gear Pair: Modelling And Experimental Comparisons. J. Sound Vib. 2000, 237, 435–455. [Google Scholar] [CrossRef]
- Abousleiman, V.; Velex, P.; Becquerelle, S. Modeling of Spur and Helical Gear Planetary Drives with Flexible Ring Gears and Planet Carriers. J. Mech. Des. 2007, 129, 95–106. [Google Scholar] [CrossRef]
- Wang, J.; Howard, I. Error Analysis on Finite Element Modeling of Involute Spur Gears. J. Mech. Des. 2006, 128, 90–97. [Google Scholar] [CrossRef]
- Bruzzone, F.; Maggi, T.; Marcellini, C.; Rosso, C. Gear Teeth Deflection Model for Spur Gears: Proposal of a 3D Nonlinear and Non-Hertzian Approach. Machines 2021, 9, 223. [Google Scholar] [CrossRef]
- Bruzzone, F.; Maggi, T.; Marcellini, C.; Rosso, C. 2D nonlinear and non-Hertzian gear teeth deflection model for static transmission error calculation. Mech. Mach. Theory 2021, 166, 104471. [Google Scholar] [CrossRef]
- Baud, S.; Velex, P. Static and dynamic tooth loading in spur and helical geared systems - Experiments and model validation. J. Mech. Des. 2002, 124, 334–346. [Google Scholar] [CrossRef]
- Benatar, M.; Handschuh, M.; Kahraman, A.; Talbot, D. Static and dynamic transmission error measurements of helical gear pairs with various tooth modifications. J. Mech. Des. 2019, 141, 103301. [Google Scholar] [CrossRef]
- Palermo, A.; Anthonis, J.; Mundo, D.; Desmet, W. A novel test rig with adjustable shaft compliance and misalignments. In Advances in Condition Monitoring of Machinery in Non-Stationary Operations; Springer: Berlin/Heidelberg, Germany, 2013; Volume 5, pp. 497–506. [Google Scholar]
- Chi, C.W.; Howard, I.; Wang, J.D. An Experimental Investigation of the Static Transmission Error and Torsional Mesh Stiffness of Nylon Gears. In Proceedings of the ASME 2007 International Design Engineering Technical Conferences and Computers and Information in Engineering Conference, Las Vegas, NV, USA, 4–7 September 2007; Volume 7: 10th International Power Transmission and Gearing Conference, pp. 207–216. [Google Scholar] [CrossRef]
- ISO 14635; Gears—FZG Test Procedures. International Organization for Standardization: Geneva, Switzerland, 2000.
- Hedlund, J.; Lehtovaara, A. Testing method for the evaluation of parametric excitation of cylindrical gears. Nondestruct. Test. Eval. 2008, 23, 285–299. [Google Scholar] [CrossRef]
- Raghuwanshi, N.K.; Parey, A. Mesh stiffness measurement of cracked spur gear by photoelasticity technique. Measurement 2015, 73, 439–452. [Google Scholar] [CrossRef]
- Raghuwanshi, N.K.; Parey, A. Experimental measurement of gear mesh stiffness of cracked spur gear by strain gauge technique. Measurement 2016, 86, 266–275. [Google Scholar] [CrossRef]
- Raghuwanshi, N.K.; Parey, A. Experimental measurement of mesh stiffness by laser displacement sensor technique. Measurement 2018, 128, 63–70. [Google Scholar] [CrossRef]
- Raghuwanshi, N.K.; Parey, A. A New Technique of Gear Mesh Stiffness Measurement Using Experimental Modal Analysis. J. Vib. Acoust. 2019, 141, 021018. [Google Scholar] [CrossRef]
- Lu, H.; Zhang, J.; Pan, K.; Lv, C.; Hou, X.; Li, Z.; Zhang, H. Quasi-Static Transmission Error Measurement Using Micro-Deformation. Iran. J. Sci. Technol. Trans. Mech. Eng. 2023. [CrossRef]
- Lu, R.; Shahriar, M.R.; Borghesani, P.; Randall, R.B.; Peng, Z. Removal of transfer function effects from transmission error measurements using cepstrum-based operational modal analysis. Mech. Syst. Signal Process. 2022, 165, 108324. [Google Scholar] [CrossRef]
- Li, K.; Yu, B.; Shi, Z.; Shu, Z.; Li, R. Development of gear dynamic performance testing machine. Int. J. Metrol. Qual. Eng. 2021, 12, 20. [Google Scholar] [CrossRef]
- Saxena, A.; Chouksey, M.; Parey, A. Measurement of FRFs of coupled geared rotor system and the development of an accurate finite element model. Mech. Mach. Theory 2018, 123, 66–75. [Google Scholar] [CrossRef]
- Dai, H.; Chen, F.; Xun, C.; Long, X. Numerical calculation and experimental measurement for gear mesh force of planetary gear transmissions. Mech. Syst. Signal Process. 2022, 162, 108085. [Google Scholar] [CrossRef]
- Qu, Y.; Hong, L.; Jiang, X.; He, M.; He, D.; Tan, Y.; Zhou, Z. Experimental study of dynamic strain for gear tooth using fiber Bragg gratings and piezoelectric strain sensors. Proc. Inst. Mech. Eng. Part C J. Mech. Eng. Sci. 2018, 232, 3992–4003. [Google Scholar] [CrossRef]
- Daffner, M.; Otto, M.; Stahl, K. Elastic deformation of a hypoid gearbox. Forsch. Ingenieurwesen 2017, 81, 215–220. [Google Scholar] [CrossRef]
- Beinstingel, A.; Parker, R.G.; Marburg, S. Experimental measurement and numerical computation of parametric instabilities in a planetary gearbox. J. Sound Vib. 2022, 536, 117160. [Google Scholar] [CrossRef]
- Karpat, F.; Yuce, C.; Doğan, O. Experimental measurement and numerical validation of single tooth stiffness for involute spur gears. Measurement 2020, 150, 107043. [Google Scholar] [CrossRef]
- Rosso, C.; Maggi, T.; Marcellini, C.; Bruzzone, F. Test Bench for Static Transmission Error Evaluation in Gears. Sae Tech. Pap. 2020. [Google Scholar] [CrossRef]
- Rosso, C.; Bruzzone, F.; Maggi, T.; Marcellini, C. A proposal for semi-analytical model of teeth contact with application to gear dynamics. In Proceedings of the 2019 JSAE/SAE Powertrains, Fuels and Lubricants, Kyoto, Japan, 26–29 August 2019. [Google Scholar] [CrossRef]
- Bruzzone, F.; Rosso, C. Effect of Web Flexibility in Gear Engagement: A Proposal of Analysis Strategy. Vibration 2022, 5, 200–212. [Google Scholar] [CrossRef]
- Oswald, F.B.; Lin, H.H.; Delgado I., R. Dynamic Analysis of Spur Gear Transmissions (DANST). PC Version 3.00 User Manual; NASA Technical Report 107291; NASA: Washington, DC, USA, 1996; pp. 1–26.
- ISO 53; Cylindrical Gears for General and Heavy Engineering—Standard Basic Rack Tooth Profile. International Organization for Standardization: Geneva, Switzerland, 1998.
- Bonisoli, E. LUPOS—LUmped Parameters Open Source FEM Code; Internal Report; Politecnico di Torino: Torino, Italy, 2021. [Google Scholar]
- Rosso, C.; Bonisoli, E. An Unified Framework for Studying Gear Dynamics Through Model Reduction Techniques. In Special Topics in Structural Dynamics; Conference Proceedings of the Society for Experimental Mechanics Series; Springer: Cham, Switzerland, 2016; Volume 6, pp. 233–242. [Google Scholar]
- Lisitano, D.; Bonisoli, E.; Mottershead, J.E. Experimental direct spatial damping identification by the Stabilised Layers Method. J. Sound Vib. 2018, 437, 325–339. [Google Scholar] [CrossRef]


| Gear 1 | Gear 2 | |
|---|---|---|
| Number of teeth [-] | 28 | 28 |
| Modulus [mm] | 3.175 | |
| Face width [mm] | 6.35 | |
| Gear body width [mm] | 6.35 | |
| Pressure angle [] | 20 | |
| Helix angle [] | 0 | |
| Contact ratio | 1.638 | |
| Rack | ISO 53/A [32] | |
| Maximum input torque [N mm] | 101686 | |
| Material | AISI 1040 | |
| Young’s modulus [GPa] | 207 | |
| Density [] | 7800 | |
| Single Pair Contact | Double Pair Contact | |||||
|---|---|---|---|---|---|---|
| Torque [Nm] | 50 | 70 | 90 | 50 | 70 | 90 |
| Mesh stiffness [kN/m] | 2.085 | 2.31 | 2.33 | 3.57 | 3.97 | 4.01 |
| Mode 1 Freq. [Hz] | 53 | 53 | 53 | 53 | 53 | 53 |
| Mode 2 Freq. [Hz] | 293 | 305 | 306 | 355 | 367 | 368 |
| Mode 3 Freq. [Hz] | 799 | 802 | 801 | 810 | 813 | 813 |
| Mode 4 Freq. [Hz] | 952 | 958 | 959 | 1001 | 1015 | 1016 |
| Mode 5 Freq. [Hz] | 1285 | 1286 | 1286 | 1294 | 1298 | 1281 |
| Mode 6 Freq. [Hz] | 20,413 | 20,413 | 20,413 | 20,413 | 20,413 | 20,413 |
| Mode Shapes for Single-Pair Contact | Mode Shapes for Double-Pair Contact | |||||||||||
|---|---|---|---|---|---|---|---|---|---|---|---|---|
| 1st | 2nd | 3rd | 4th | 5th | 6th | 1st | 2nd | 3rd | 4th | 5th | 6th | |
| 1 | 3.29 | 4.60 | 4.54 | −1.00 | 0.08 | ≈0 | 3.29 | 4.91 | 4.14 | −1.21 | 0.16 | ≈0 |
| 2 | 3.336 | 3.25 | −5.24 | 2.09 | −0.37 | ≈0 | 3.34 | 2.76 | −5.03 | 3.00 | −0.77 | ≈0 |
| 3 | −3.36 | 2.08 | 1.62 | 5.58 | −3.28 | −0.01 | −3.36 | 1.68 | 2.34 | 5.16 | −3.73 | −0.01 |
| 4 | −3.36 | 2.99 | −0.77 | −0.48 | 4.13 | 4.69 | −3.35 | 3.05 | −1.04 | 0.23 | 4.06 | 4.69 |
| 5 | −3.36 | 2.99 | −0.78 | −0.50 | 4.12 | −8.11 | −3.35 | 3.05 | −1.04 | 0.21 | 4.04 | −8.11 |
| 6 | −3.32 | 3.26 | −2.16 | −6.25 | −6.20 | 0.02 | −3.32 | 3.49 | −3.05 | −6.12 | −5.83 | 0.02 |
Disclaimer/Publisher’s Note: The statements, opinions and data contained in all publications are solely those of the individual author(s) and contributor(s) and not of MDPI and/or the editor(s). MDPI and/or the editor(s) disclaim responsibility for any injury to people or property resulting from any ideas, methods, instructions or products referred to in the content. |
© 2024 by the authors. Licensee MDPI, Basel, Switzerland. This article is an open access article distributed under the terms and conditions of the Creative Commons Attribution (CC BY) license (https://creativecommons.org/licenses/by/4.0/).
Share and Cite
Rosso, C.; Bruzzone, F.; Lisitano, D.; Bonisoli, E. A Methodology for Measuring Actual Mesh Stiffness in Gear Pairs. Vibration 2024, 7, 196-211. https://doi.org/10.3390/vibration7010011
Rosso C, Bruzzone F, Lisitano D, Bonisoli E. A Methodology for Measuring Actual Mesh Stiffness in Gear Pairs. Vibration. 2024; 7(1):196-211. https://doi.org/10.3390/vibration7010011
Chicago/Turabian StyleRosso, Carlo, Fabio Bruzzone, Domenico Lisitano, and Elvio Bonisoli. 2024. "A Methodology for Measuring Actual Mesh Stiffness in Gear Pairs" Vibration 7, no. 1: 196-211. https://doi.org/10.3390/vibration7010011
APA StyleRosso, C., Bruzzone, F., Lisitano, D., & Bonisoli, E. (2024). A Methodology for Measuring Actual Mesh Stiffness in Gear Pairs. Vibration, 7(1), 196-211. https://doi.org/10.3390/vibration7010011