
Detection of Ulcerative Colitis Lesions from Weakly Annotated Colonoscopy Videos Using Bounding Boxes

 , , , , and
Abstract
1. Introduction
- -
- We first propose a sampling strategy to effectively explore the set of linear models by only considering nontrivial models. This will be done in Section 3.2.3.
- -
- Then, we introduce performance criteria that can deal with bounding box annotation problems. In Section 3.2.4, we show its effectiveness with the help of some examples.
- -
- Finally, we study the variability of the detectors across the patients using small subsets of endoscopic images. Our study shows that the models used are not universal and personalized models should be developed for each patient. We illustrate the results in Section 5.
2. Related Work
2.1. Automatic Detection of Bleeding
2.2. Automatic Detection of Ulcers
3. Materials and Method
3.1. Colonoscopy Videos Dataset
3.2. Proposed Method
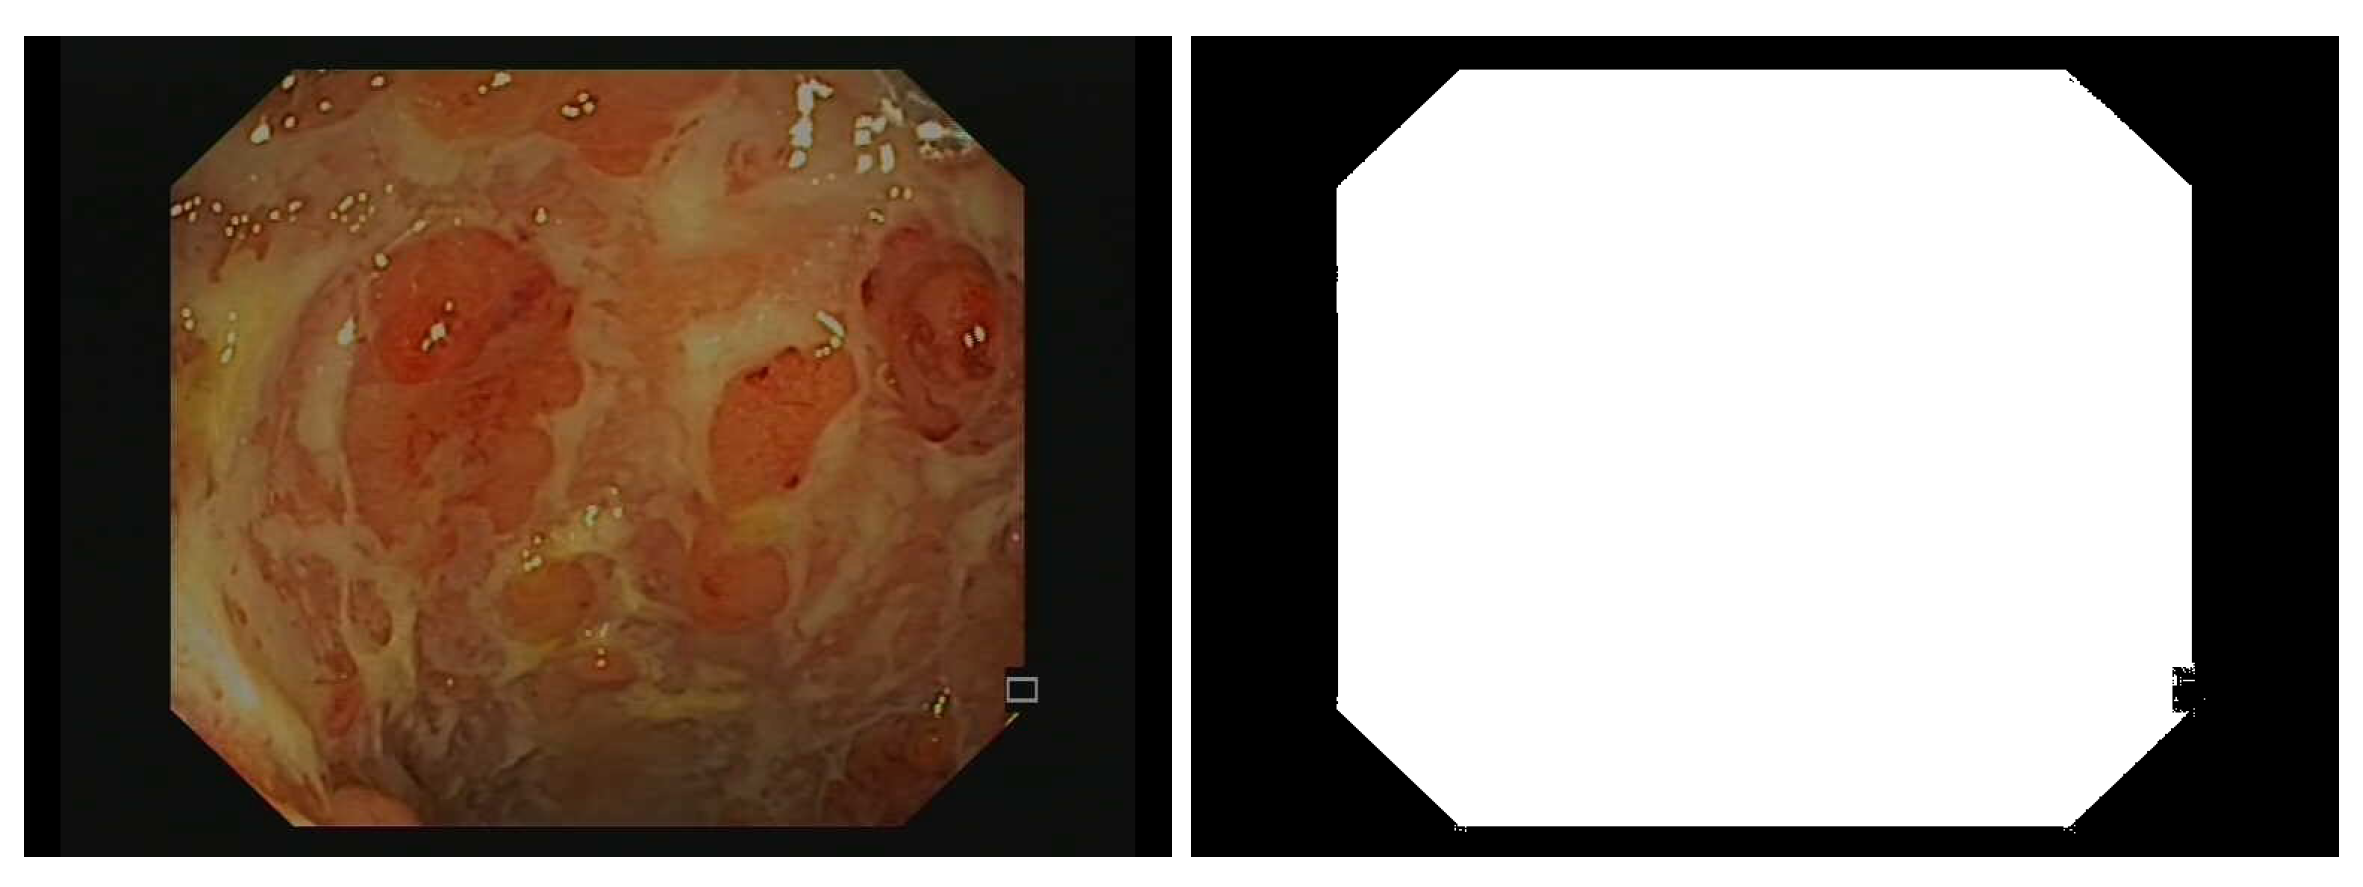
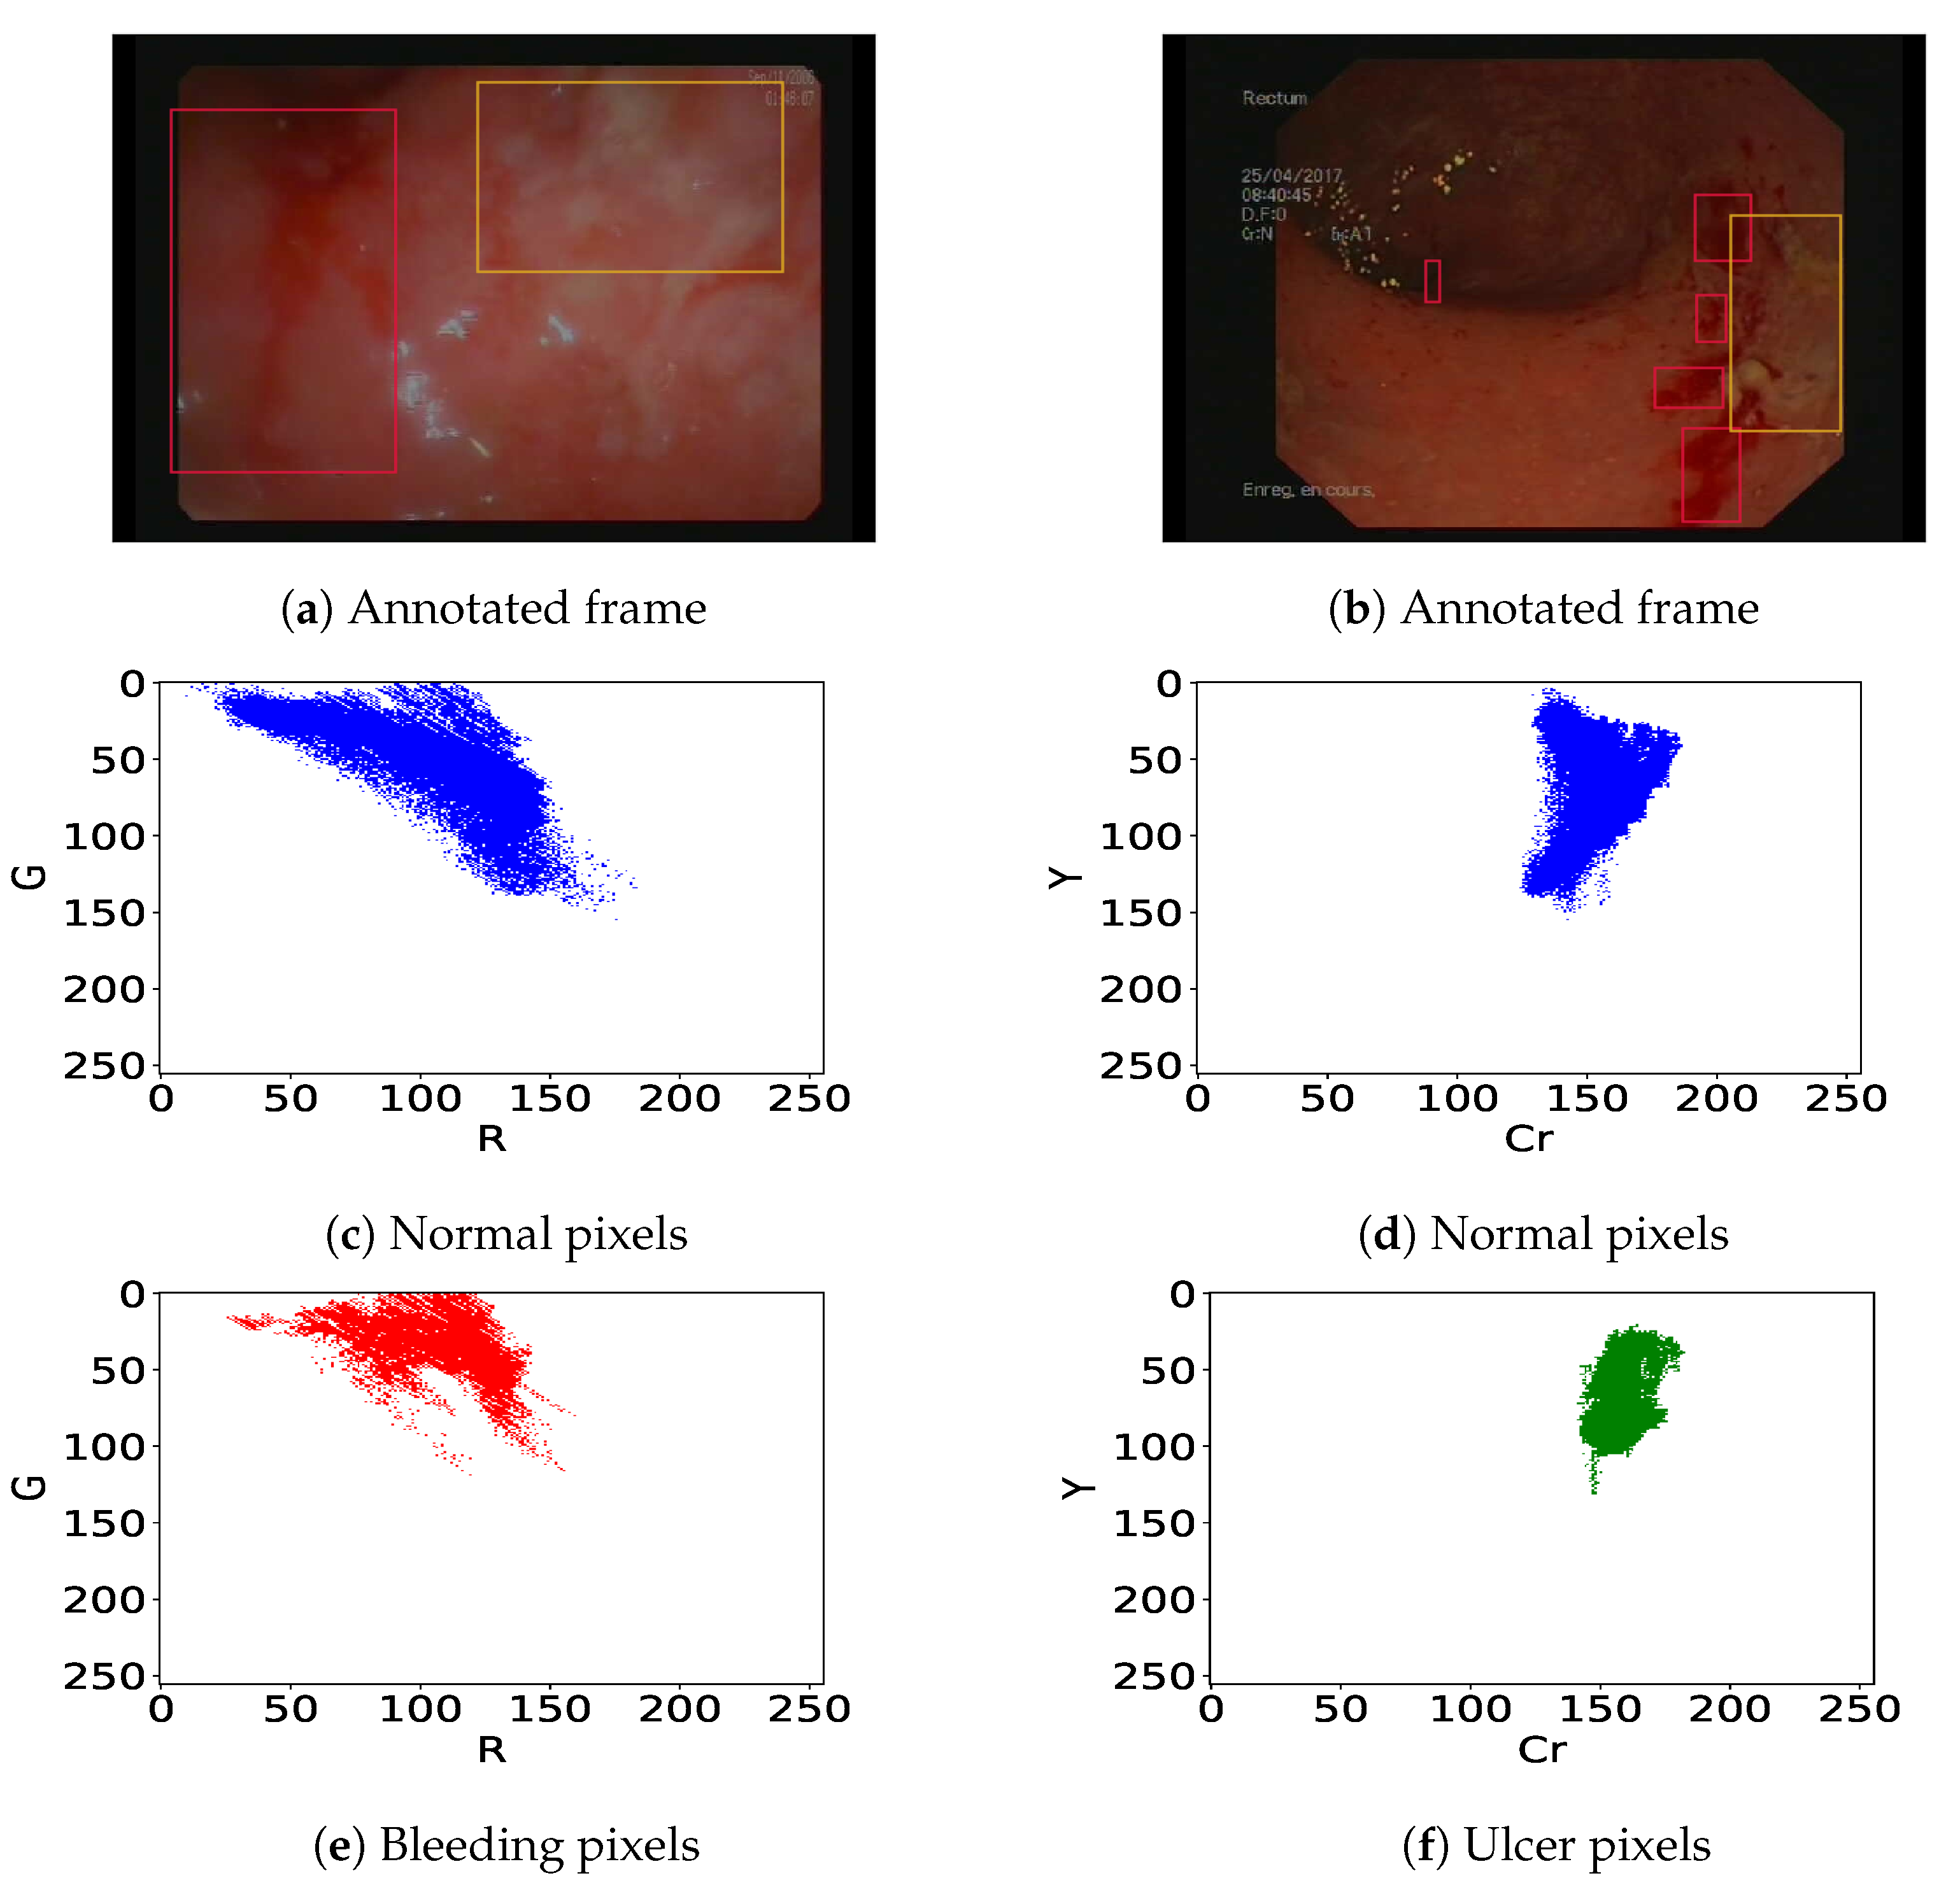
3.2.1. Image Preprocessing
3.2.2. Definition of Bleeding and Ulcer Detectors
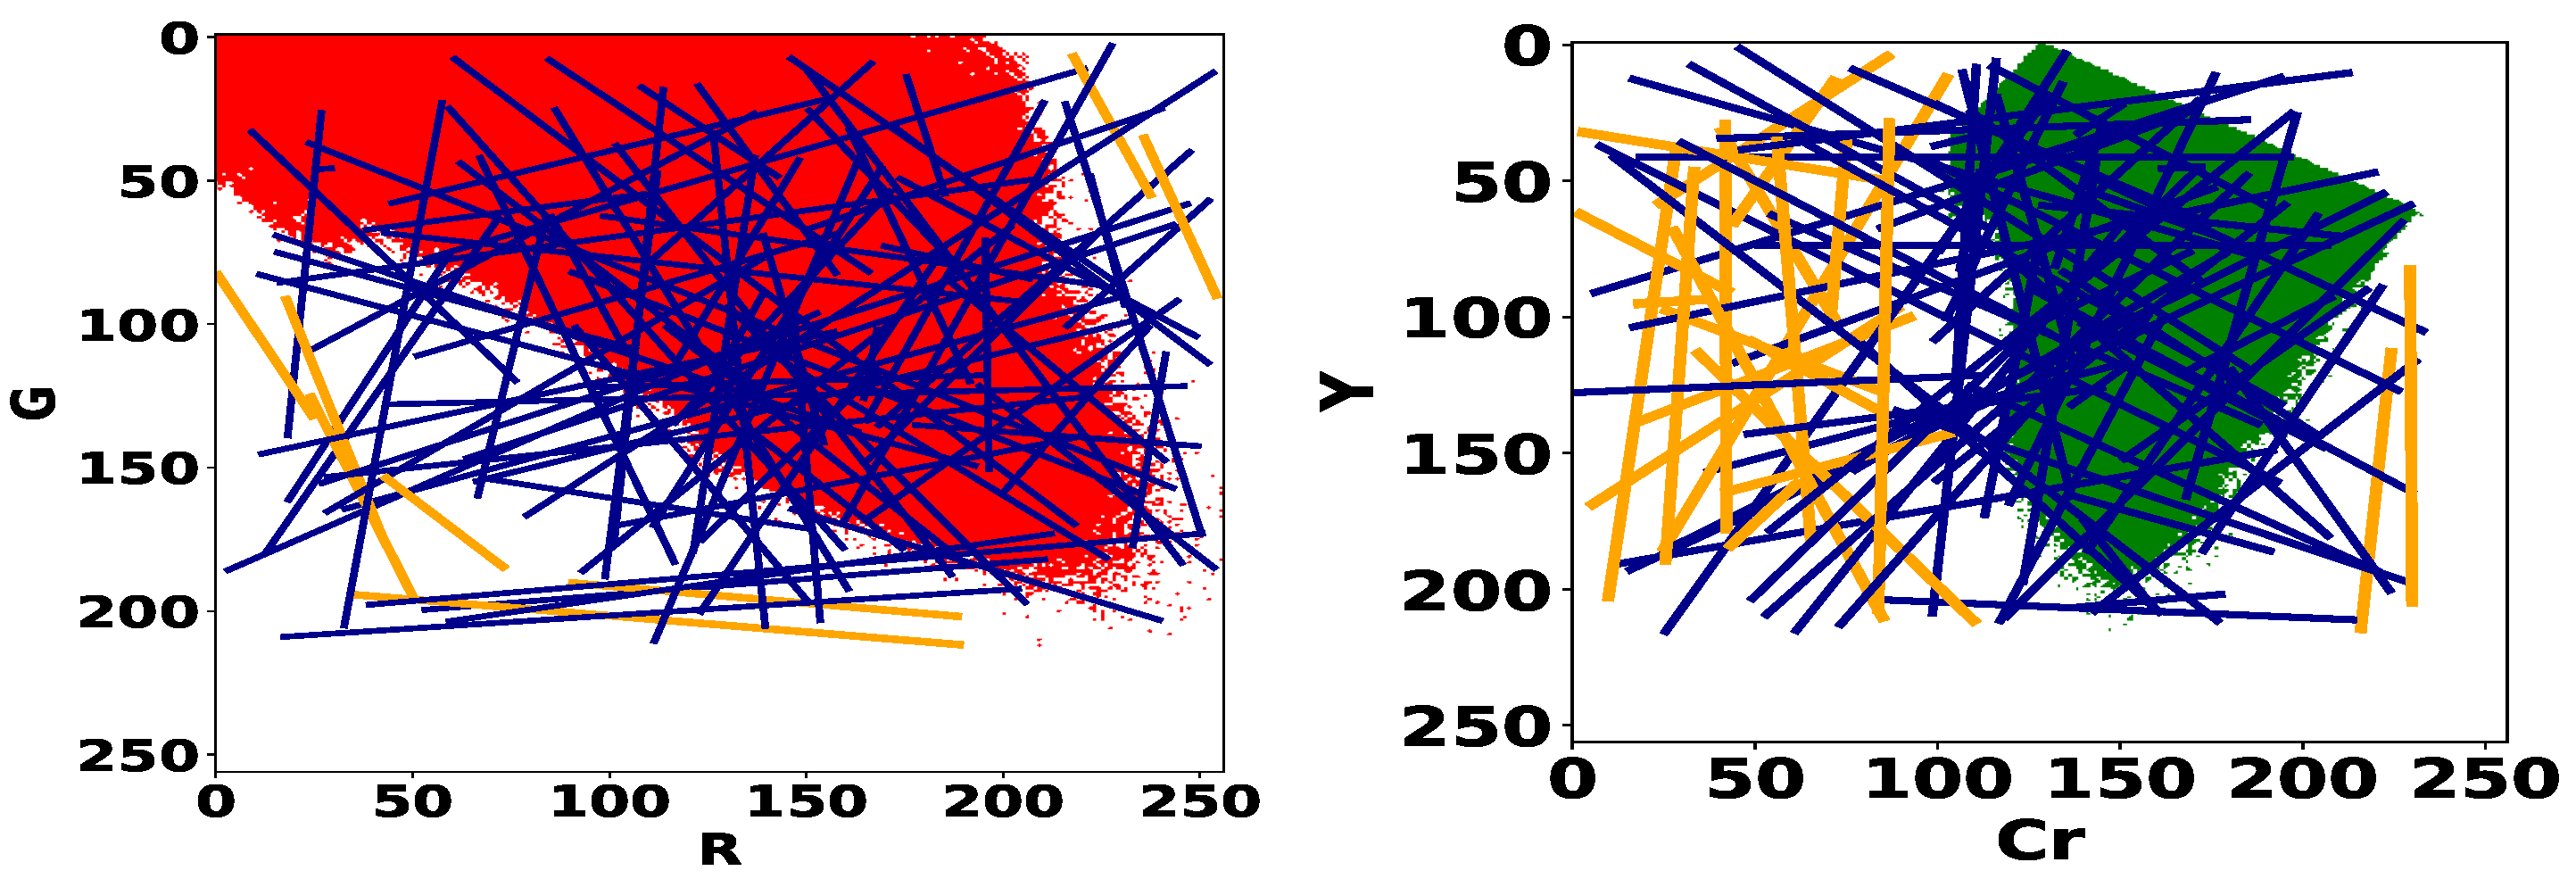
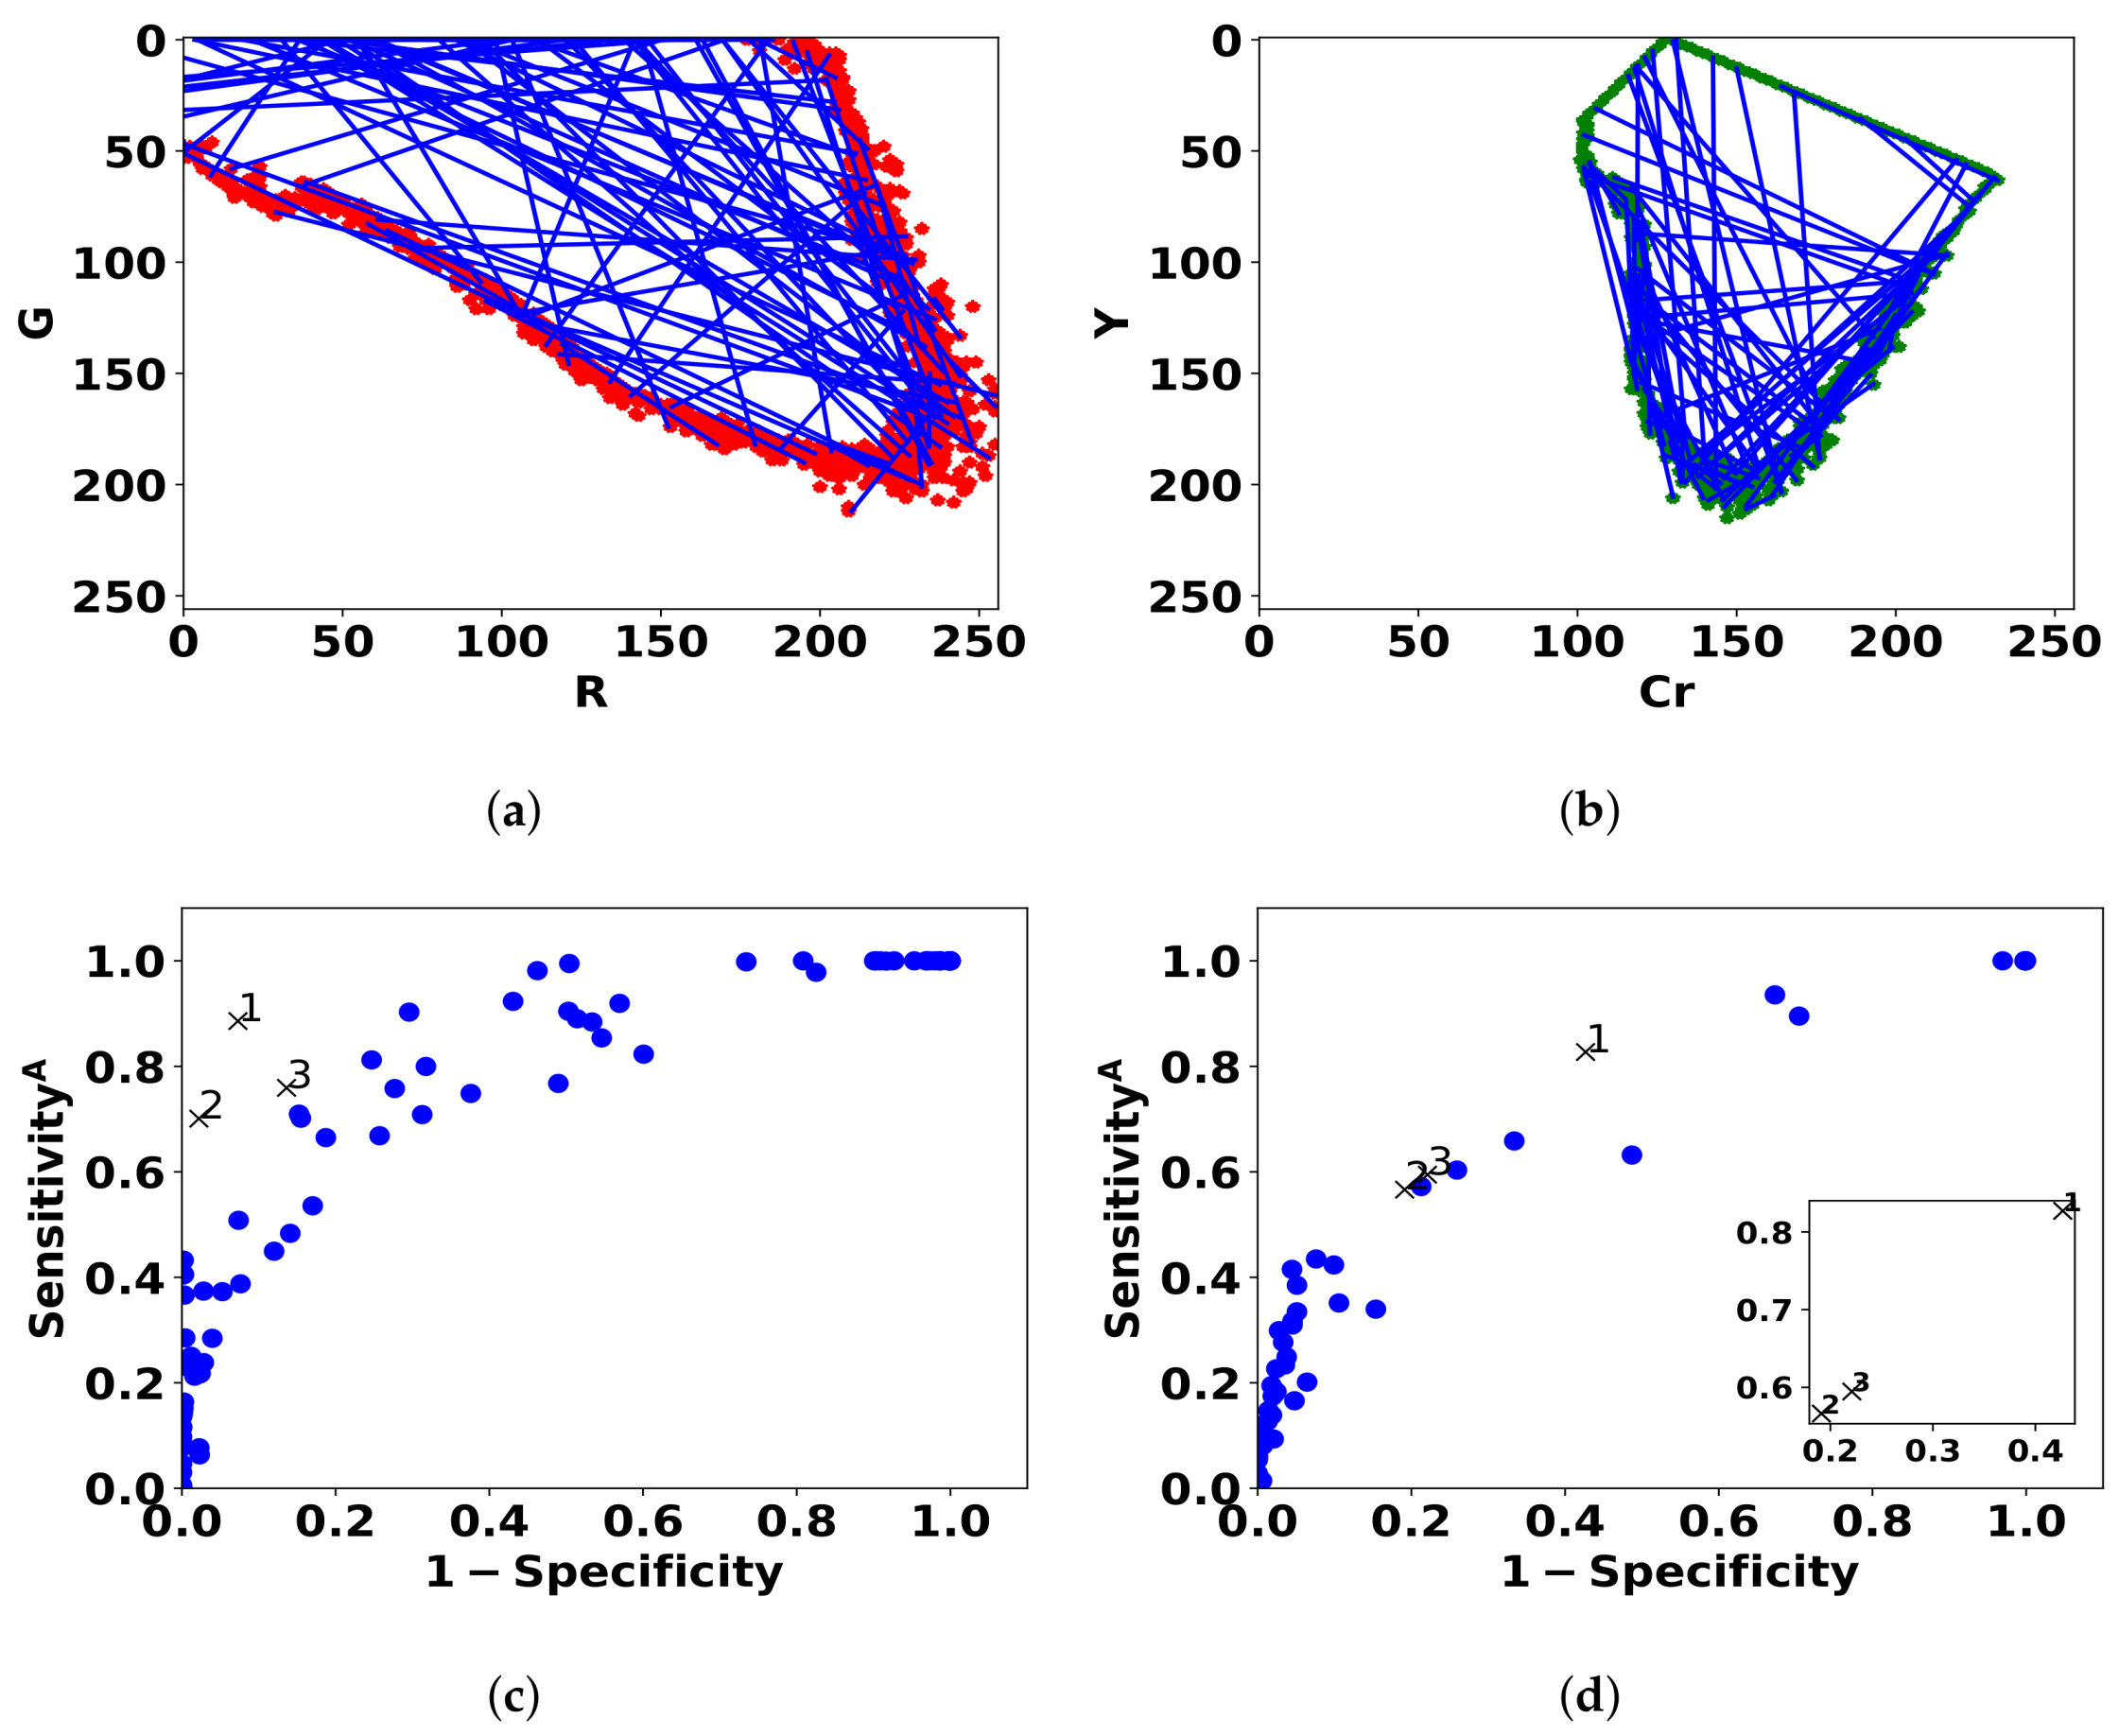
3.2.3. Proposed Sampling Strategy
3.2.4. Proposed Performance Metric of the Detectors
4. Results
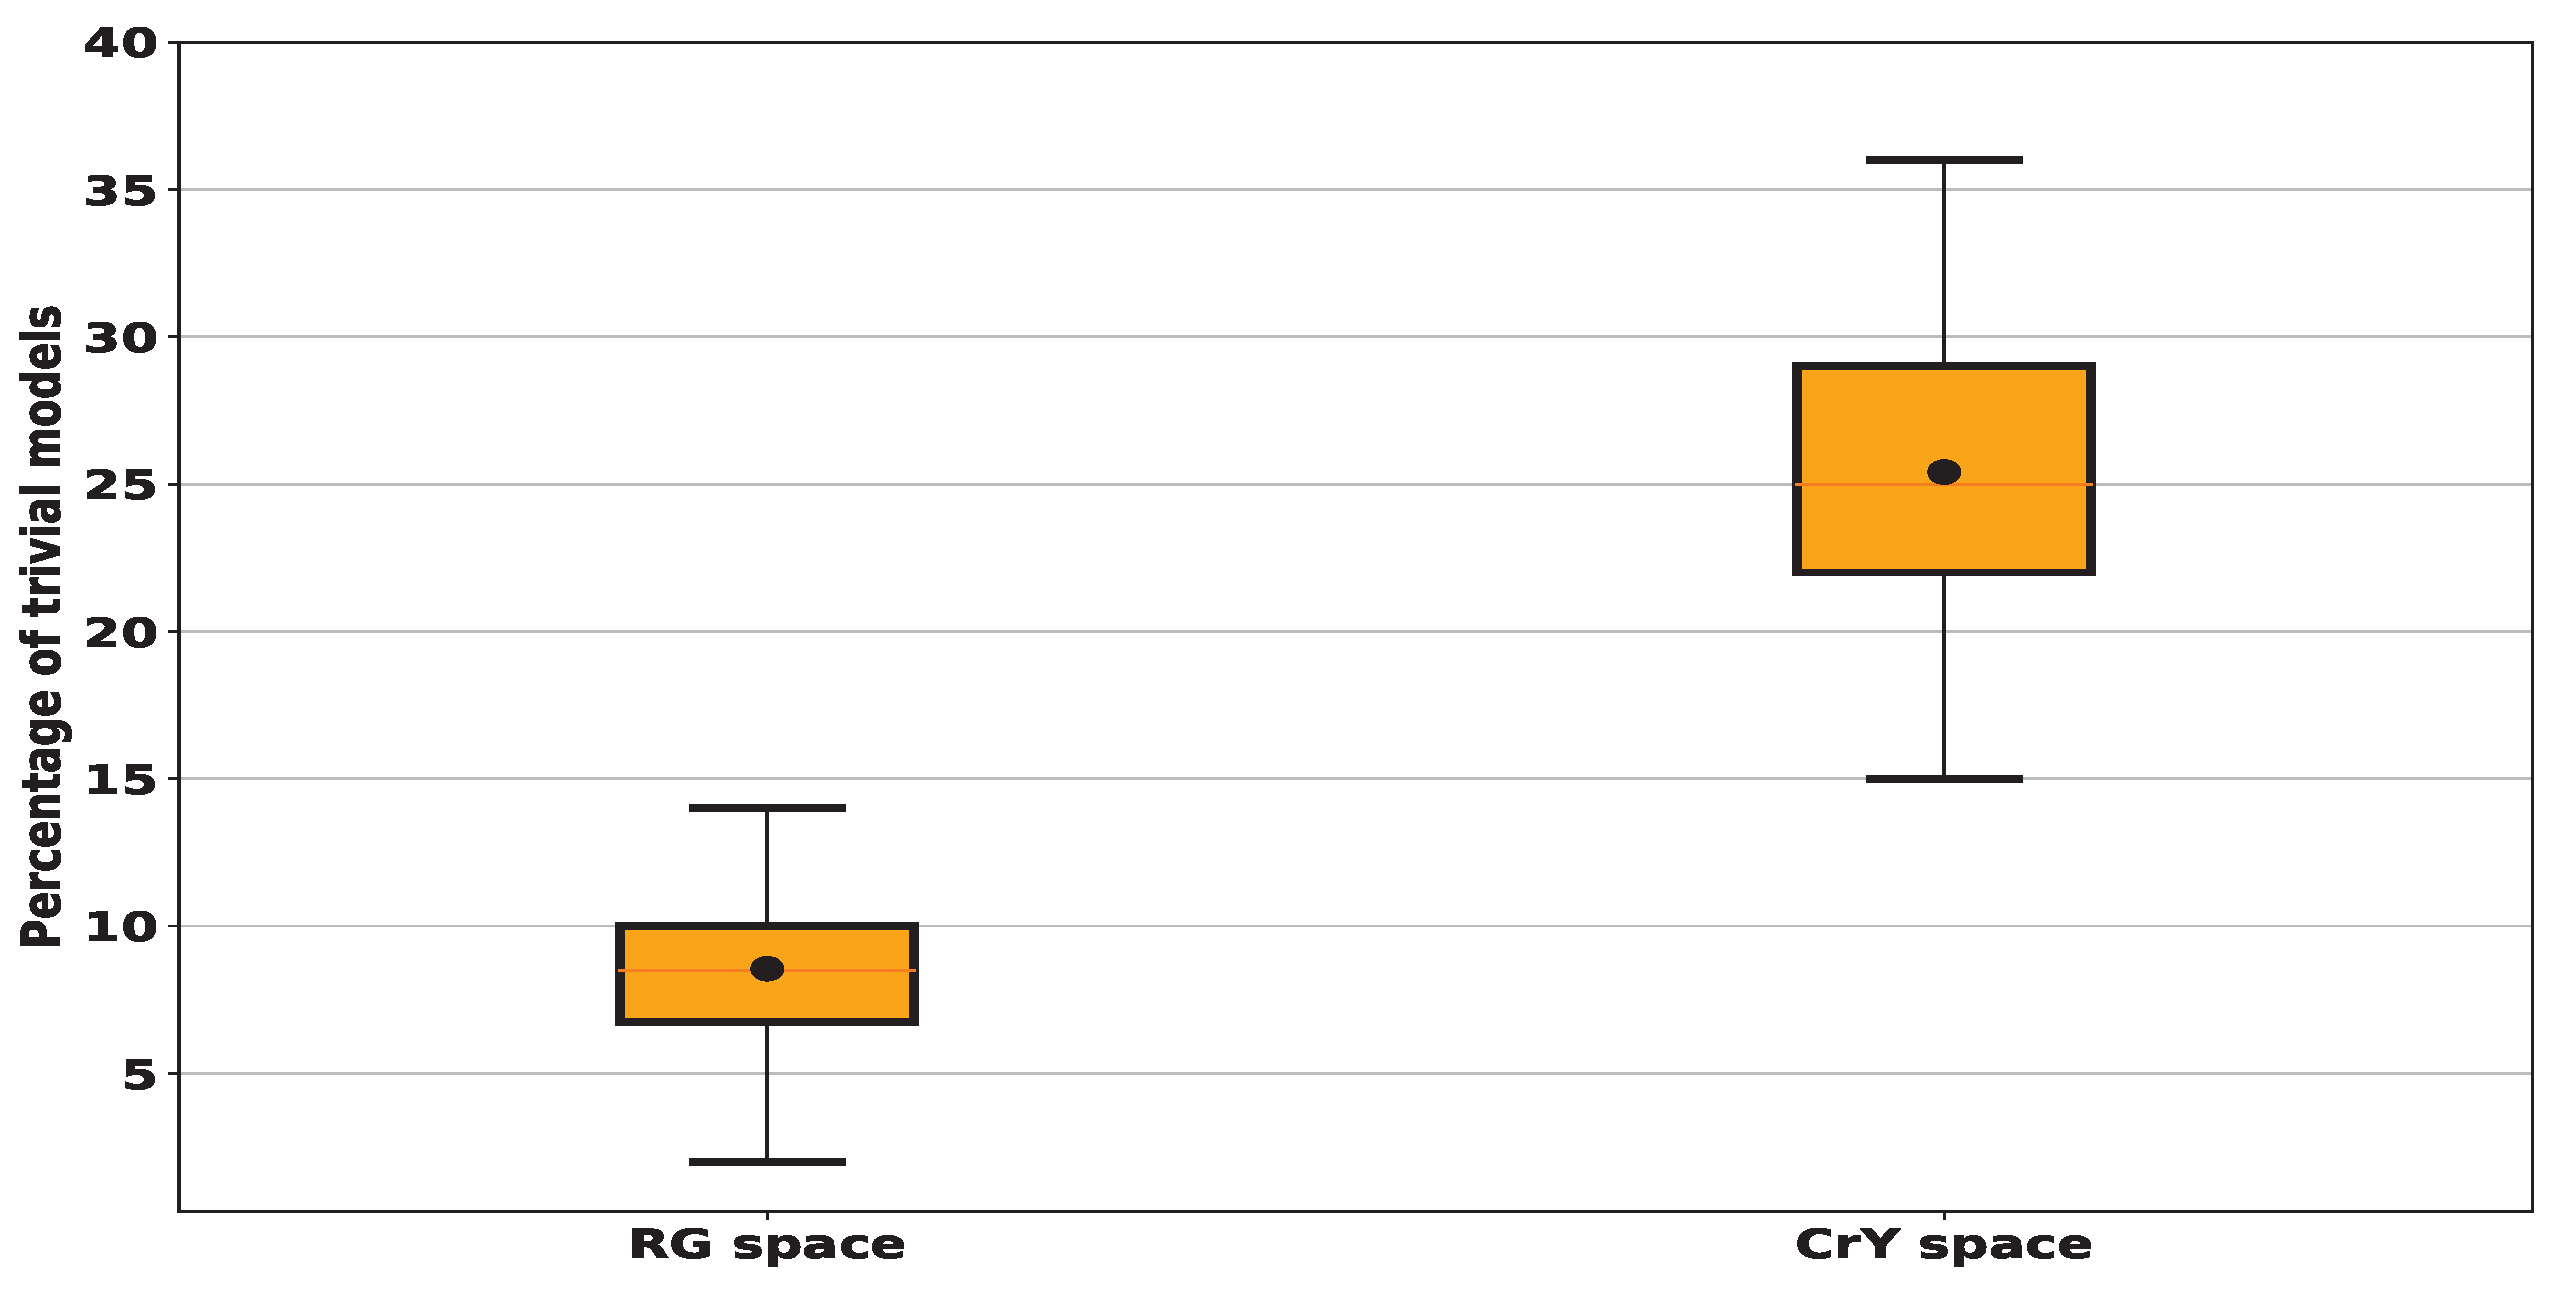
4.1. Computation of the Proportion of Trivial Models
4.2. Is Better Than Standard Sensitivity in the Context of Bounding Box Annotations
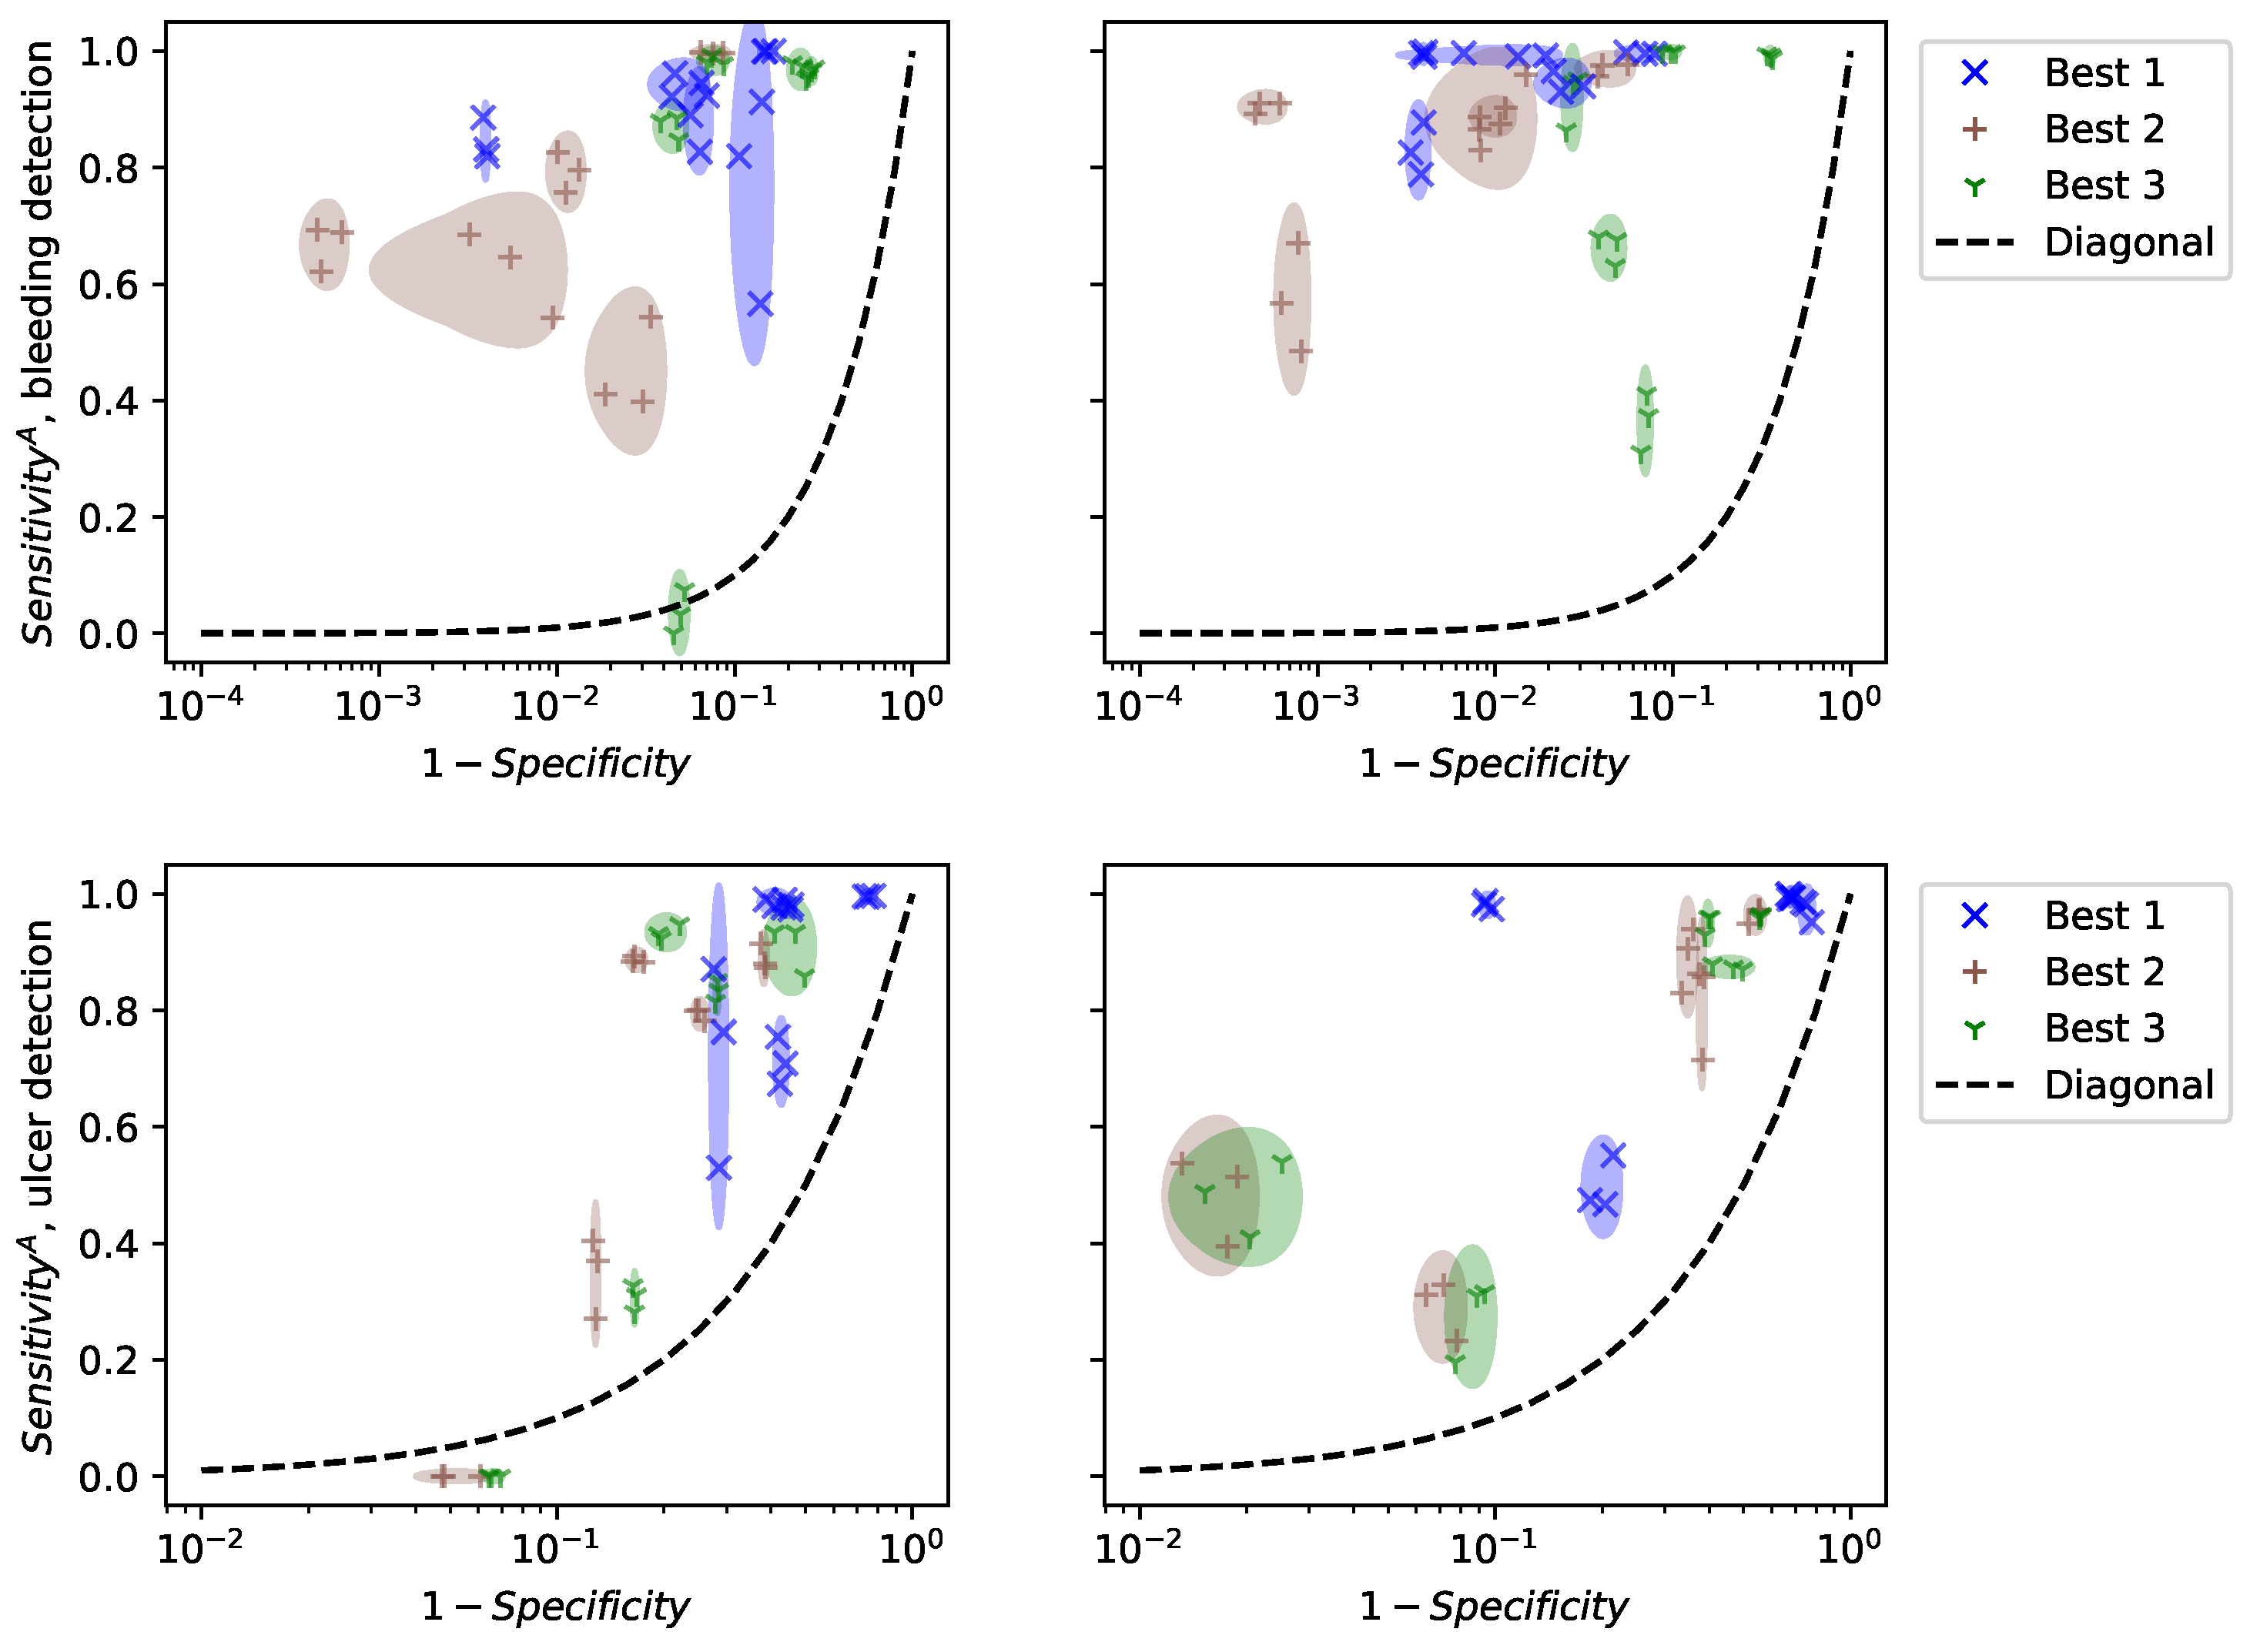
4.3. Best Lesions Detectors
5. Discussion
6. Limitations of the Study
7. Conclusions
Author Contributions
Funding
Institutional Review Board Statement
Informed Consent Statement
Data Availability Statement
Acknowledgments
Conflicts of Interest
Abbreviations
| IBD | Inflammatory bowel disease |
| CD | Crohn’s disease |
| UC | Ulcerative Colitis |
| WCE | Wireless Capsule Endoscopy |
| ROI | Region Of Interest |
| CNN | Convolutional Neural Network |
| ROC | Receiver Operating Characteristic space |
| RGB | (Red, Green, Blue) color space |
| SVM | Directory of open access journals |
| KNN | K-Nearest Neighbors |
| YIQ | Luma In-phase Quadrature color space |
| HSV | Hue-Saturation-Value color space |
| HSI | Hue-Saturation-Intensity |
| CIElab, CMYK, YUV, CIElab, XYZ | diverse color spaces |
| TN | True Negative |
| TP | True Positive |
| FN | False Negative |
| FP | False Positive |
| TPA | Total number of pixels within the detected annotations |
| PA | Total number of pixels of all the annotations |
| RBF | Radial Basis Function |
| CrY | (Cr,Y) color space |
| RG | (R,G) color space |
| AI | Artificial Intelligence |
References
- Popa, D.; Neamtu, B.; Mihalache, M.; Boicean, A.; Banciu, A.; Banciu, D.D.; Moga, D.F.; Birlutiu, V. Fecal Microbiota Transplant in Severe and Non-Severe Clostridioides difficile Infection. Is There a Role of FMT in Primary Severe CDI? J. Clin. Med. 2021, 10, 5822. [Google Scholar] [CrossRef] [PubMed]
- Popa, D.; Neamtu, B.; Mihalache, M.; Boicean, A.; Banciu, A.; Banciu, D.D.; Moga, D.F.; Birlutiu, V. The microbiome and inflammatory bowel disease: Is there a therapeutic role for fecal microbiota transplantation? Off. J. Am. Coll. Gastroenterol. ACG 2012, 107, 1452–1459. [Google Scholar]
- Boicean, A.; Birlutiu, V.; Ichim, C.; Anderco, P.; Birsan, S. Fecal Microbiota Transplantation in Inflammatory Bowel Disease. Biomedicines 2023, 11, 1016. [Google Scholar] [CrossRef] [PubMed]
- Jäger, S.; Stange, E.F.; Wehkamp, J. Inflammatory bowel disease: An impaired barrier disease. Langenbeck’s Arch. Surg. 2013, 39, 1–12. [Google Scholar] [CrossRef] [PubMed]
- Lamb, C.A.; Kennedy, N.A.; Raine, T.; Hendy, P.A.; Smith, P.J.; Limdi, J.K.; Hayee, B.; Lomer, M.C.E.; Parkes, G.C.; Selinger, C.; et al. British Society of Gastroenterology consensus guidelines on the management of inflammatory bowel disease in adults. Gut 2019, 68, s1–s106. [Google Scholar] [CrossRef] [PubMed]
- Probert, F.; Walsh, A.; Jagielowicz, M.; Yeo, T.; Claridge, T.D.; Simmons, A.; Travis, S.; Anthony, D.C. Plasma nuclear magnetic resonance metabolomics discriminates between high and low endoscopic activity and predicts progression in a prospective cohort of patients with ulcerative colitis. J. Crohn’s Colitis 2018, 12, 1326–1337. [Google Scholar] [CrossRef]
- Iddan, G.; Meron, G.; Glukhovsky, A.; Swain, P. Wireless capsule endoscopy. Nature 2000, 405, 417. [Google Scholar] [CrossRef] [PubMed]
- Panaccione, R. Mechanisms of inflammatory bowel disease. Gastroenterol. Hepatol. 2013, 9, 29–32. [Google Scholar]
- Du, W.; Rao, N.; Liu, D.; Jiang, H.; Luo, C.; Li, Z.; Gan, T.; Zeng, B. Review on the Applications of Deep Learning in the Analysis of Gastrointestinal Endoscopy Images. IEEE Access 2019, 7, 142053–142069. [Google Scholar] [CrossRef]
- Achanta, R.; Shaji, A.; Smith, K.; Lucchi, A.; Fua, P.; Süsstrunk, S. SLIC superpixels compared to state-of-the-art superpixel methods. IEEE Trans. Pattern Anal. Mach. Intell. 2012, 34, 2274–2282. [Google Scholar] [CrossRef]
- Deeba, F.; Islam, M.; Bui, F.M.; Wahid, K.A. Performance assessment of a bleeding detection algorithm for endoscopic video based on classifier fusion method and exhaustive feature selection. Biomed. Signal Process. Control 2018, 40, 415–424. [Google Scholar] [CrossRef]
- Fu, Y.; Zhang, W.; Mandal, M.; Meng, M.Q. Computer-Aided Bleeding Detection in WCE Video. IEEE J. Biomed. Health Inform. 2014, 18, 636–642. [Google Scholar] [CrossRef] [PubMed]
- Ghosh, T.; Fattah, S.A.; Wahid, K.A.; Zhu, W.P.; Ahmad, M.O. Cluster based statistical feature extraction method for automatic bleeding detection in wireless capsule endoscopy video. Comput. Biol. Med. 2018, 94, 41–54. [Google Scholar] [CrossRef] [PubMed]
- Suman, S.; Hussin, F.A.; Malik, A.S.; Ho, S.H.; Hilmi, I.; Leow, A.H.R.; Goh, K.L. Feature selection and classification of ulcerated lesions using statistical analysis for WCE images. Appl. Sci. 2017, 7, 1097. [Google Scholar] [CrossRef]
- Pogorelov, K.; Suman, S.; Azmadi Hussin, F.; Saeed Malik, A.; Ostroukhova, O.; Riegler, M.; Halvorsen, P.; Hooi Ho, S.; Goh, K.L. Bleeding detection in wireless capsule endoscopy videos—Color versus texture features. J. Appl. Clin. Med. Phys. 2019, 20, 141–154. [Google Scholar] [CrossRef]
- Yeh, J.Y.; Wu, T.H.; Tsai, W.J. Bleeding and ulcer detection using wireless capsule endoscopy images. J. Softw. Eng. Appl. 2014, 7, 422. [Google Scholar] [CrossRef]
- Yuan, Y.; Wang, J.; Li, B.; Meng, M.Q.H. Saliency based ulcer detection for wireless capsule endoscopy diagnosis. IEEE Trans. Med. Imaging 2015, 34, 2046–2057. [Google Scholar] [CrossRef] [PubMed]
- Jheng, Y.; Wang, Y.; Lin, H.; Sung, K.; Chu, Y.; Wang, H.; Jiang, J.; Hou, M.; Lee, F.; Lu, C. A novel machine learning-based algorithm to identify and classify lesions and anatomical landmarks in colonoscopy images. Surg. Endosc. 2022, 36, 640–650. [Google Scholar] [CrossRef] [PubMed]
- Ghosh, T.; Fattah, S.A.; Wahid, K.A. CHOBS: Color histogram of block statistics for automatic bleeding detection in wireless capsule endoscopy video. IEEE J. Transl. Eng. Health Med. 2018, 6, 1800112. [Google Scholar] [CrossRef] [PubMed]
- Hassan, A.R.; Haque, M.A. Computer-aided gastrointestinal hemorrhage detection in wireless capsule endoscopy videos. Comput. Methods Programs Biomed. 2015, 122, 341–353. [Google Scholar] [CrossRef] [PubMed]
- Liu, D.Y.; Gan, T.; Rao, N.N.; Xing, Y.W.; Zheng, J.; Li, S.; Luo, C.S.; Zhou, Z.J.; Wan, Y.L. Identification of lesion images from gastrointestinal endoscope based on feature extraction of combinational methods with and without learning process. Med. Image Anal. 2016, 32, 281–294. [Google Scholar] [CrossRef]
- Nawarathna, R.; Oh, J.; Muthukudage, J.; Tavanapong, W.; Wong, J.; De Groen, P.C.; Tang, S.J. Abnormal image detection in endoscopy videos using a filter bank and local binary patterns. Neurocomputing 2014, 144, 70–91. [Google Scholar] [CrossRef] [PubMed]
- Vasilakakis, M.D.; Iakovidis, D.K.; Spyrou, E.; Koulaouzidis, A. DINOSARC: Color features based on selective aggregation of chromatic image components for wireless capsule endoscopy. Comput. Math. Methods Med. 2018, 2018, 2026962. [Google Scholar] [CrossRef] [PubMed]
- Vondrick, C.; Patterson, D.; Ramanan, D. Efficiently scaling up crowdsourced video annotation. Int. J. Comput. Vis. 2013, 101, 184–204. [Google Scholar] [CrossRef]
- Ghosh, T.; Bashar, S.K.; Alam, M.S.; Wahid, K.; Fattah, S.A. A statistical feature-based novel method to detect bleeding in wireless capsule endoscopy images. In Proceedings of the 2014 International Conference on Informatics, Electronics & Vision (ICIEV), Dhaka, Bangladesh, 23–24 May 2014; IEEE: New York, NY, USA, 2014; pp. 1–4. [Google Scholar]
- Koshy, N.E.; Gopi, V.P. A new method for ulcer detection in endoscopic images. In Proceedings of the 2015 2nd International Conference on Electronics and Communication Systems (ICECS), Coimbatore, India, 26–27 February 2015; IEEE: New York, NY, USA, 2015; pp. 1725–1729. [Google Scholar]
- Fu, Y.; Mandal, M.; Guo, G. Bleeding region detection in WCE images based on color features and neural network. In Proceedings of the 2011 IEEE 54th International Midwest Symposium on Circuits and Systems (MWSCAS), Seoul, Republic of Korea, 7–10 August 2011; IEEE: New York, NY, USA, 2011; pp. 1–4. [Google Scholar]
- Kundu, A.K.; Fattah, S.A.; Rizve, M.N. An automatic bleeding frame and region detection scheme for wireless capsule endoscopy videos based on interplane intensity variation profile in normalized RGB color space. J. Healthc. Eng. 2018, 2018, 9423062. [Google Scholar] [CrossRef] [PubMed]
- Ghosh, T.; Fattah, S.A.; Shahnaz, C.; Wahid, K.A. An automatic bleeding detection scheme in wireless capsule endoscopy based on histogram of an RGB-indexed image. In Proceedings of the 2014 36th Annual International Conference of the IEEE Engineering in Medicine and Biology Society, Chicago, IL, USA, 26–30 August 2014; IEEE: New York, NY, USA, 2014; pp. 4683–4686. [Google Scholar]
- Ghosh, T.; Fattah, S.A.; Bashar, S.; Shahnaz, C.; Wahid, K.A.; Zhu, W.P.; Ahmad, M.O. An automatic bleeding detection technique in wireless capsule endoscopy from region of interest. In Proceedings of the 2015 IEEE International Conference on Digital Signal Processing (DSP), Singapore, 21–24 July 2015; IEEE: New York, NY, USA, 2015; pp. 1293–1297. [Google Scholar]
- Pan, G.; Yan, G.; Qiu, X.; Cui, J. Bleeding detection in wireless capsule endoscopy based on probabilistic neural network. J. Med. Syst. 2011, 35, 1477–1484. [Google Scholar] [CrossRef] [PubMed]
- Suman, S.; Walter, N.; Hussin, F.A.; Malik, A.S.; Ho, S.H.; Goh, K.L.; Hilmi, I. Optimum colour space selection for ulcerated regions using statistical analysis and classification of ulcerated frames from wce video footage. In Proceedings of the International Conference on Neural Information Processing, Istanbul, Turkey, 9–12 November 2015; Springer: Berlin/Heidelberg, Germany, 2015; pp. 373–381. [Google Scholar]
- Leung, T.; Malik, J. Representing and recognizing the visual appearance of materials using three-dimensional textons. Int. J. Comput. Vis. 2001, 43, 29–44. [Google Scholar] [CrossRef]
- Al Ali, S. Mathematical Modelling of Chronic Inflammatory Bowel Diseases. Ph.D. Thesis, Université Paris-Nord-Paris XIII, Villetaneuse, France, 2022. [Google Scholar]
- Youden, W.J. Index for rating diagnostic tests. Cancer 1950, 3, 32–35. [Google Scholar] [CrossRef]
- Chang, Y.W.; Hsieh, C.J.; Chang, K.W.; Ringgaard, M.; Lin, C.J. Training and Testing Low-degree Polynomial Data Mappings via Linear SVM. J. Mach. Learn. Res. 2010, 11, 1471–1490. [Google Scholar]
- Sainju, S.; Bui, F.M.; Wahid, K.A. Automated bleeding detection in capsule endoscopy videos using statistical features and region growing. J. Med. Syst. 2014, 38, 25. [Google Scholar] [CrossRef]
- Tseng, D.C.; Chang, C.H. Color segmentation using perceptual attributes. In Proceedings of the 11th IAPR International Conference on Pattern Recognition, The Hague, The Netherlands, 30 August–1 September 1992; Volume III. Conference C: Image, Speech and Signal Analysis. IEEE Computer Society: Washington, DC, USA, 1992; pp. 228–231. [Google Scholar]
- Badrinarayanan, V.; Kendall, A.; Cipolla, R. SegNet: A deep convolutional encoder-decoder architecture for image segmentation. IEEE Trans. Pattern Anal. Mach. Intell. 2017, 39, 2481–2495. [Google Scholar] [CrossRef] [PubMed]
- Chen, L.-C.; Papandreou, G.; Kokkinos, I.; Murphy, K.; Yuille, A.L. Semantic image segmentation with deep convolutional nets atrous convolution and fully connected CRFs. IEEE Trans. Pattern Anal. Mach. Intell. 2018, 40, 834–848. [Google Scholar] [CrossRef] [PubMed]
- Al-Ali, S.; Shahin, A.; Chakik, F. Influence of Ambiguity Cluster on Quality Improvement in Image Compression. Int. J. Comput. Inf. Eng. 2013, 7, 232–236. [Google Scholar]
- Shahin, A.; Chakik, F.; Al-Ali, S. Complexity Reduction and Quality Enhancement in Image Coding. Int. J. Future Comput. Commun. 2013, 2, 205. [Google Scholar] [CrossRef]
- Ali, S.; Zhou, F.; Braden, B.; Bailey, A.; Yang, S.; Cheng, G.; Zhang, P.; Li, X.; Kayser, M.; Soberanis-Mukul, R.D.; et al. An objective comparison of detection and segmentation algorithms for artefacts in clinical endoscopy. Sci. Rep. 2020, 10, 2748. [Google Scholar] [CrossRef] [PubMed]


| Bleeding Frames | Ulcer Frames | Total Number of Frames | |
|---|---|---|---|
| Video 1 | 671 | 554 | 812 |
| Video 2 | 224 | 378 | 378 |
| Video 3 | 254 | 86 | 1116 |
| Video 4 | 140 | 204 | 910 |
| Video 5 | 340 | 538 | 1133 |
| Total | 1629 | 1760 | 4349 |
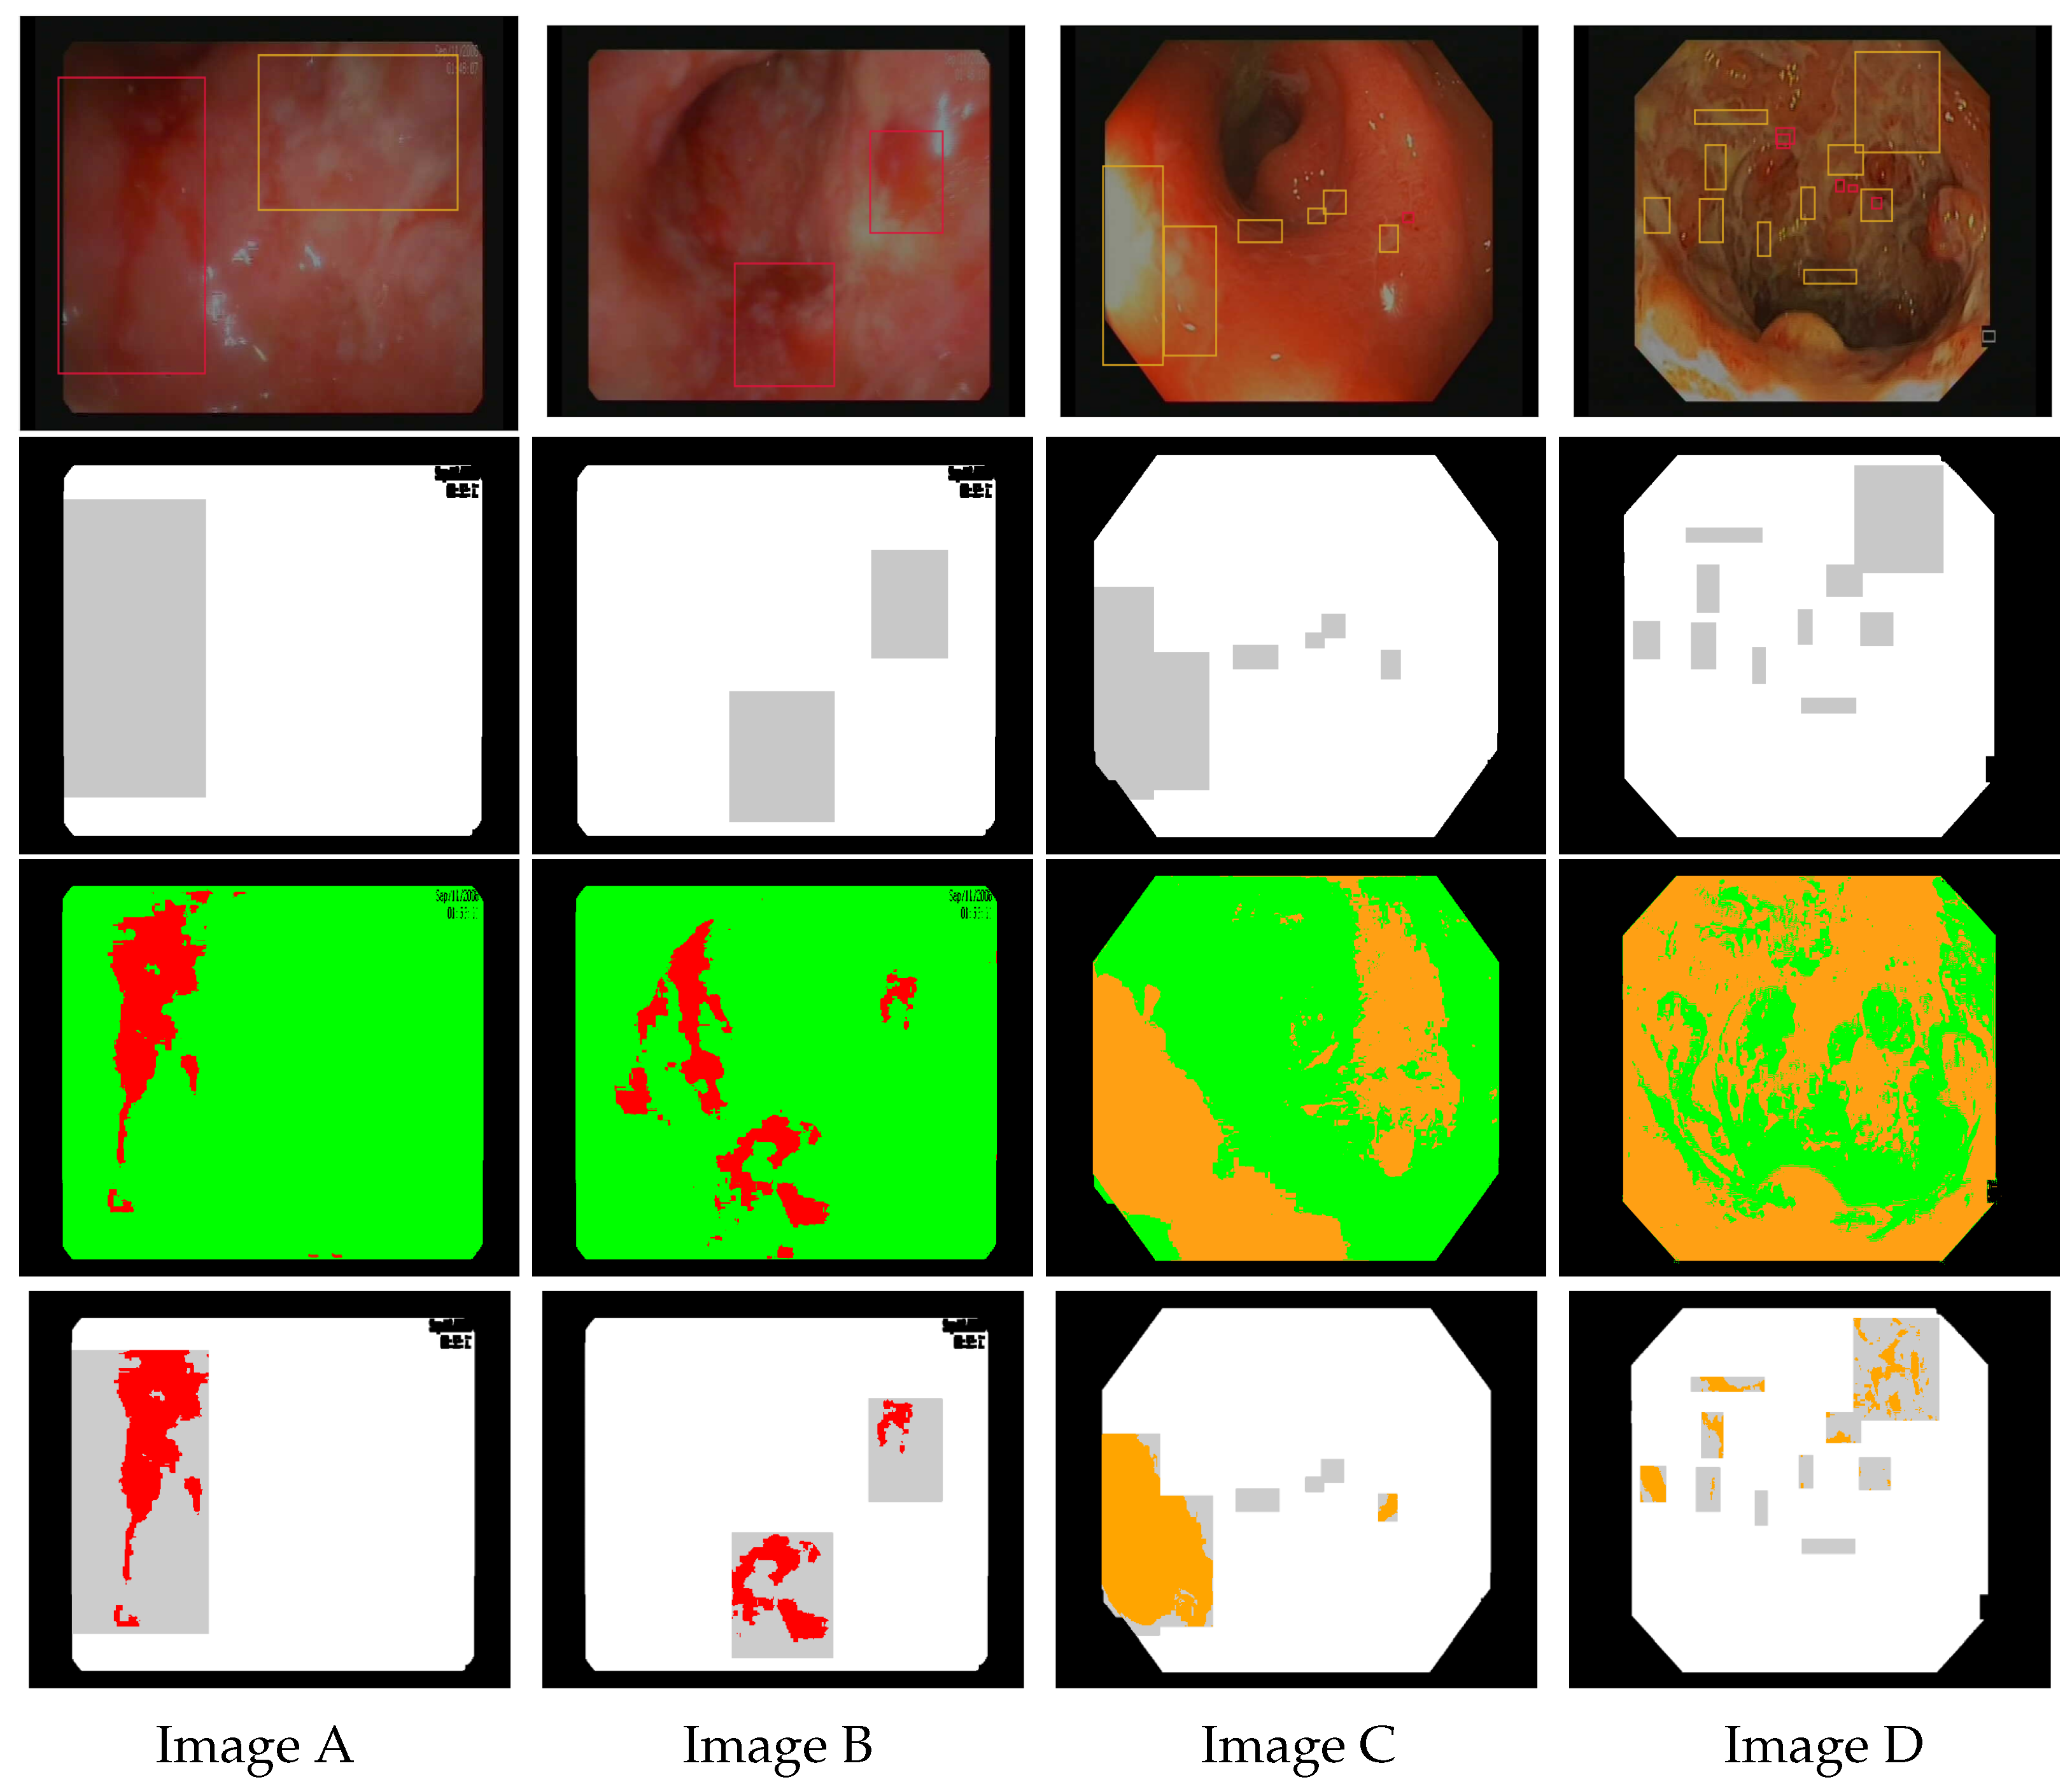
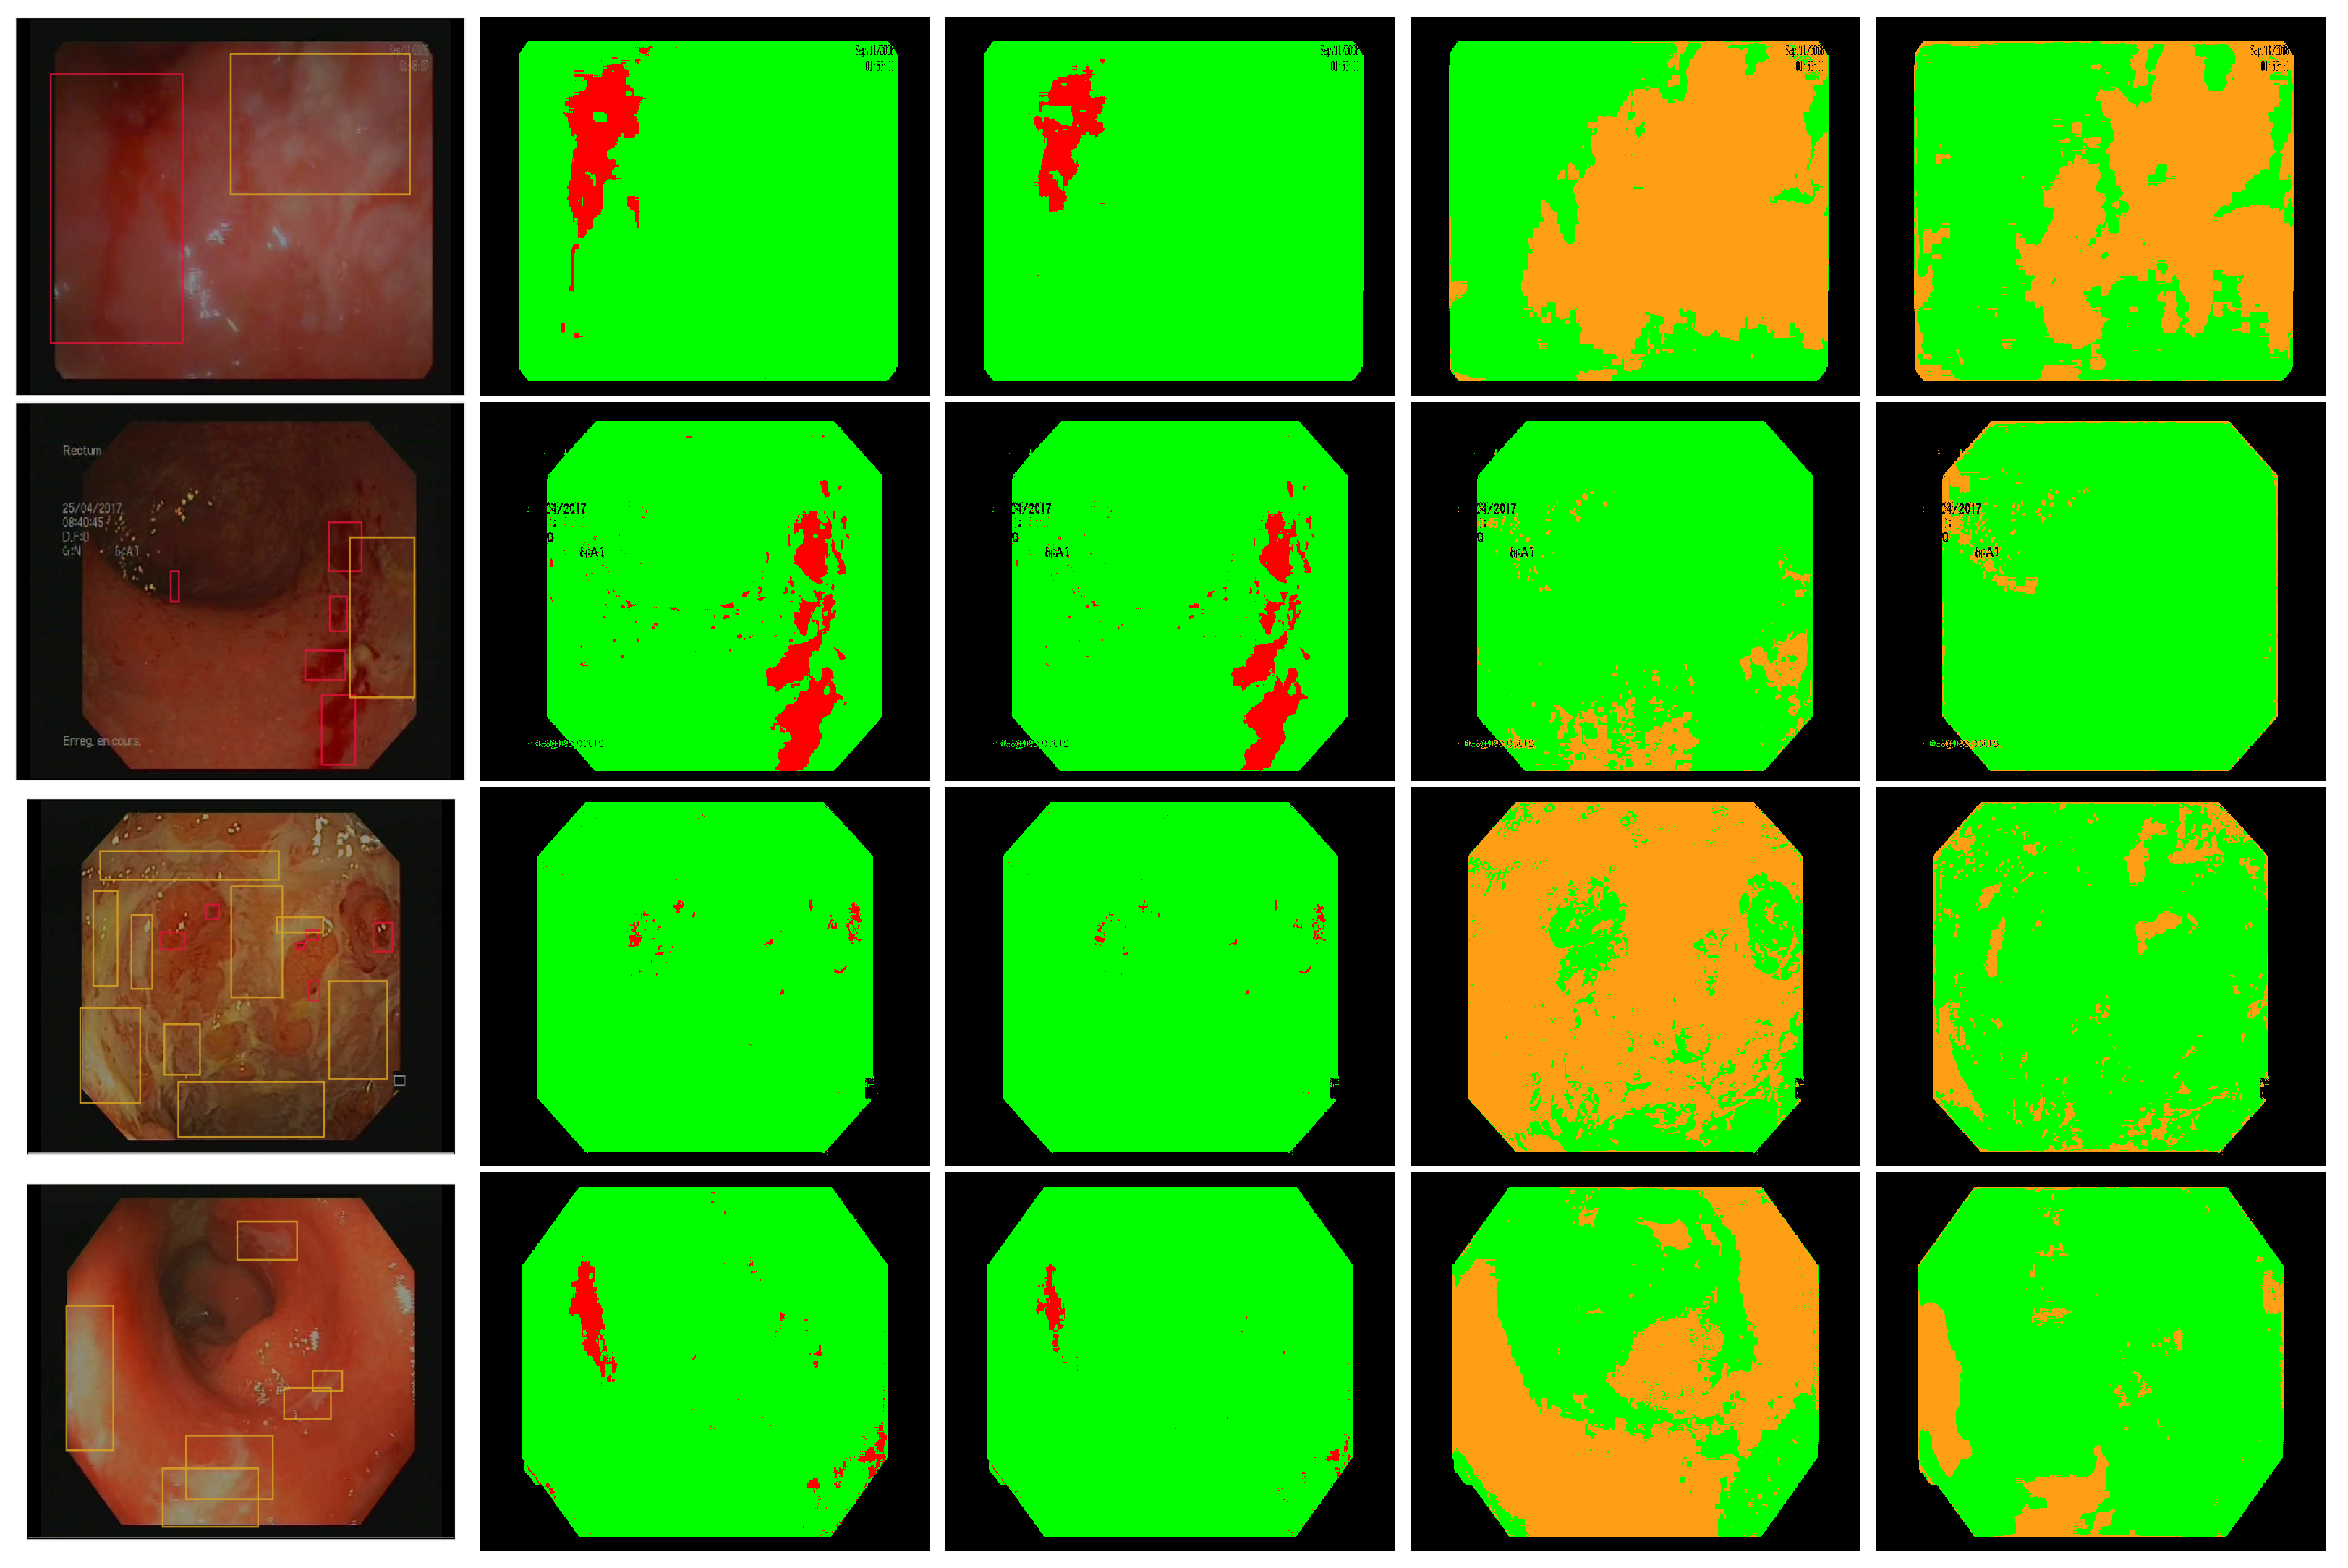
| Image Identity | TP | TN | FP | FN | TPA | PA | Spec. 1 | Sens. 2 | Sens |
|---|---|---|---|---|---|---|---|---|---|
| Image A | 23,229 | 234,006 | 2161 | 6942 | 93,936 | 93,936 | 99.08% | 25.76% | 100% |
| Image B | 11,181 | 263,133 | 16,183 | 35,841 | 47,022 | 47,022 | 94.81% | 23.78% | 100% |
| Image C | 36,692 | 238,390 | 18,724 | 10,619 | 46,318 | 50,616 | 92.72% | 77.55% | 91.51% |
| Image D | 8556 | 192,292 | 54,952 | 30,270 | 36,041 | 38,982 | 77.77% | 22.04% | 92.46% |
| Best Models for Bleeding | Specificity (%) | (%) | Sensitivity (%) |
|---|---|---|---|
| 92.29 ± 0.44 | 88.59 ± 2.98 | 10.01 ± 0.61 | |
| 97.75 ± 0.13 | 69.95 ± 1.50 | 4.12 ± 0.21 | |
| 86.44 ± 0.39 | 75.59 ± 1.13 | 13.56 ± 0.63 | |
| Best Models for Ulcers | Specificity (%) | (%) | Sensitivity (%) |
| 58.22 ± 0.39 | 81.68 ± 4.17 | 38.59 ± 0.98 | |
| 81.72 ± 0.46 | 56.06 ± 0.67 | 13.93 ± 0.40 | |
| 78.26 ± 0.50 | 59.24 ± 1.13 | 17.58 ± 0.33 |
| Models | Specificity (%) | (%) |
|---|---|---|
| Proposed bleeding detector | 92.29 ± 0.44 | 88.59 ± 2.98 |
| Linear model-Kundu [28] | 94.82 ± 0.01 | 85.23 ± 0.02 |
| Proposed ulcer detector | 58.22 ± 0.39 | 81.68 ± 4.17 |
| SVM algorithm-Suman [14] | 99.84 ± 0.00 | 21.25 ± 2.27 |
Disclaimer/Publisher’s Note: The statements, opinions and data contained in all publications are solely those of the individual author(s) and contributor(s) and not of MDPI and/or the editor(s). MDPI and/or the editor(s) disclaim responsibility for any injury to people or property resulting from any ideas, methods, instructions or products referred to in the content. |
© 2024 by the authors. Licensee MDPI, Basel, Switzerland. This article is an open access article distributed under the terms and conditions of the Creative Commons Attribution (CC BY) license (https://creativecommons.org/licenses/by/4.0/).
Share and Cite
Al-Ali, S.; Chaussard, J.; Li-Thiao-Té, S.; Ogier-Denis, É.; Percy-du-Sert, A.; Treton, X.; Zaag, H. Detection of Ulcerative Colitis Lesions from Weakly Annotated Colonoscopy Videos Using Bounding Boxes. Gastrointest. Disord. 2024, 6, 292-307. https://doi.org/10.3390/gidisord6010020
Al-Ali S, Chaussard J, Li-Thiao-Té S, Ogier-Denis É, Percy-du-Sert A, Treton X, Zaag H. Detection of Ulcerative Colitis Lesions from Weakly Annotated Colonoscopy Videos Using Bounding Boxes. Gastrointestinal Disorders. 2024; 6(1):292-307. https://doi.org/10.3390/gidisord6010020
Chicago/Turabian StyleAl-Ali, Safaa, John Chaussard, Sébastien Li-Thiao-Té, Éric Ogier-Denis, Alice Percy-du-Sert, Xavier Treton, and Hatem Zaag. 2024. "Detection of Ulcerative Colitis Lesions from Weakly Annotated Colonoscopy Videos Using Bounding Boxes" Gastrointestinal Disorders 6, no. 1: 292-307. https://doi.org/10.3390/gidisord6010020
APA StyleAl-Ali, S., Chaussard, J., Li-Thiao-Té, S., Ogier-Denis, É., Percy-du-Sert, A., Treton, X., & Zaag, H. (2024). Detection of Ulcerative Colitis Lesions from Weakly Annotated Colonoscopy Videos Using Bounding Boxes. Gastrointestinal Disorders, 6(1), 292-307. https://doi.org/10.3390/gidisord6010020