
Current and Stray Flux Combined Analysis for Sparking Detection in DC Motors/Generators Using Shannon Entropy


Abstract
:1. Introduction
2. Materials and Methods
2.1. Advanced Transient Current Signature Analysis (ATCSA)
2.2. Stray Flux Signals Analysis
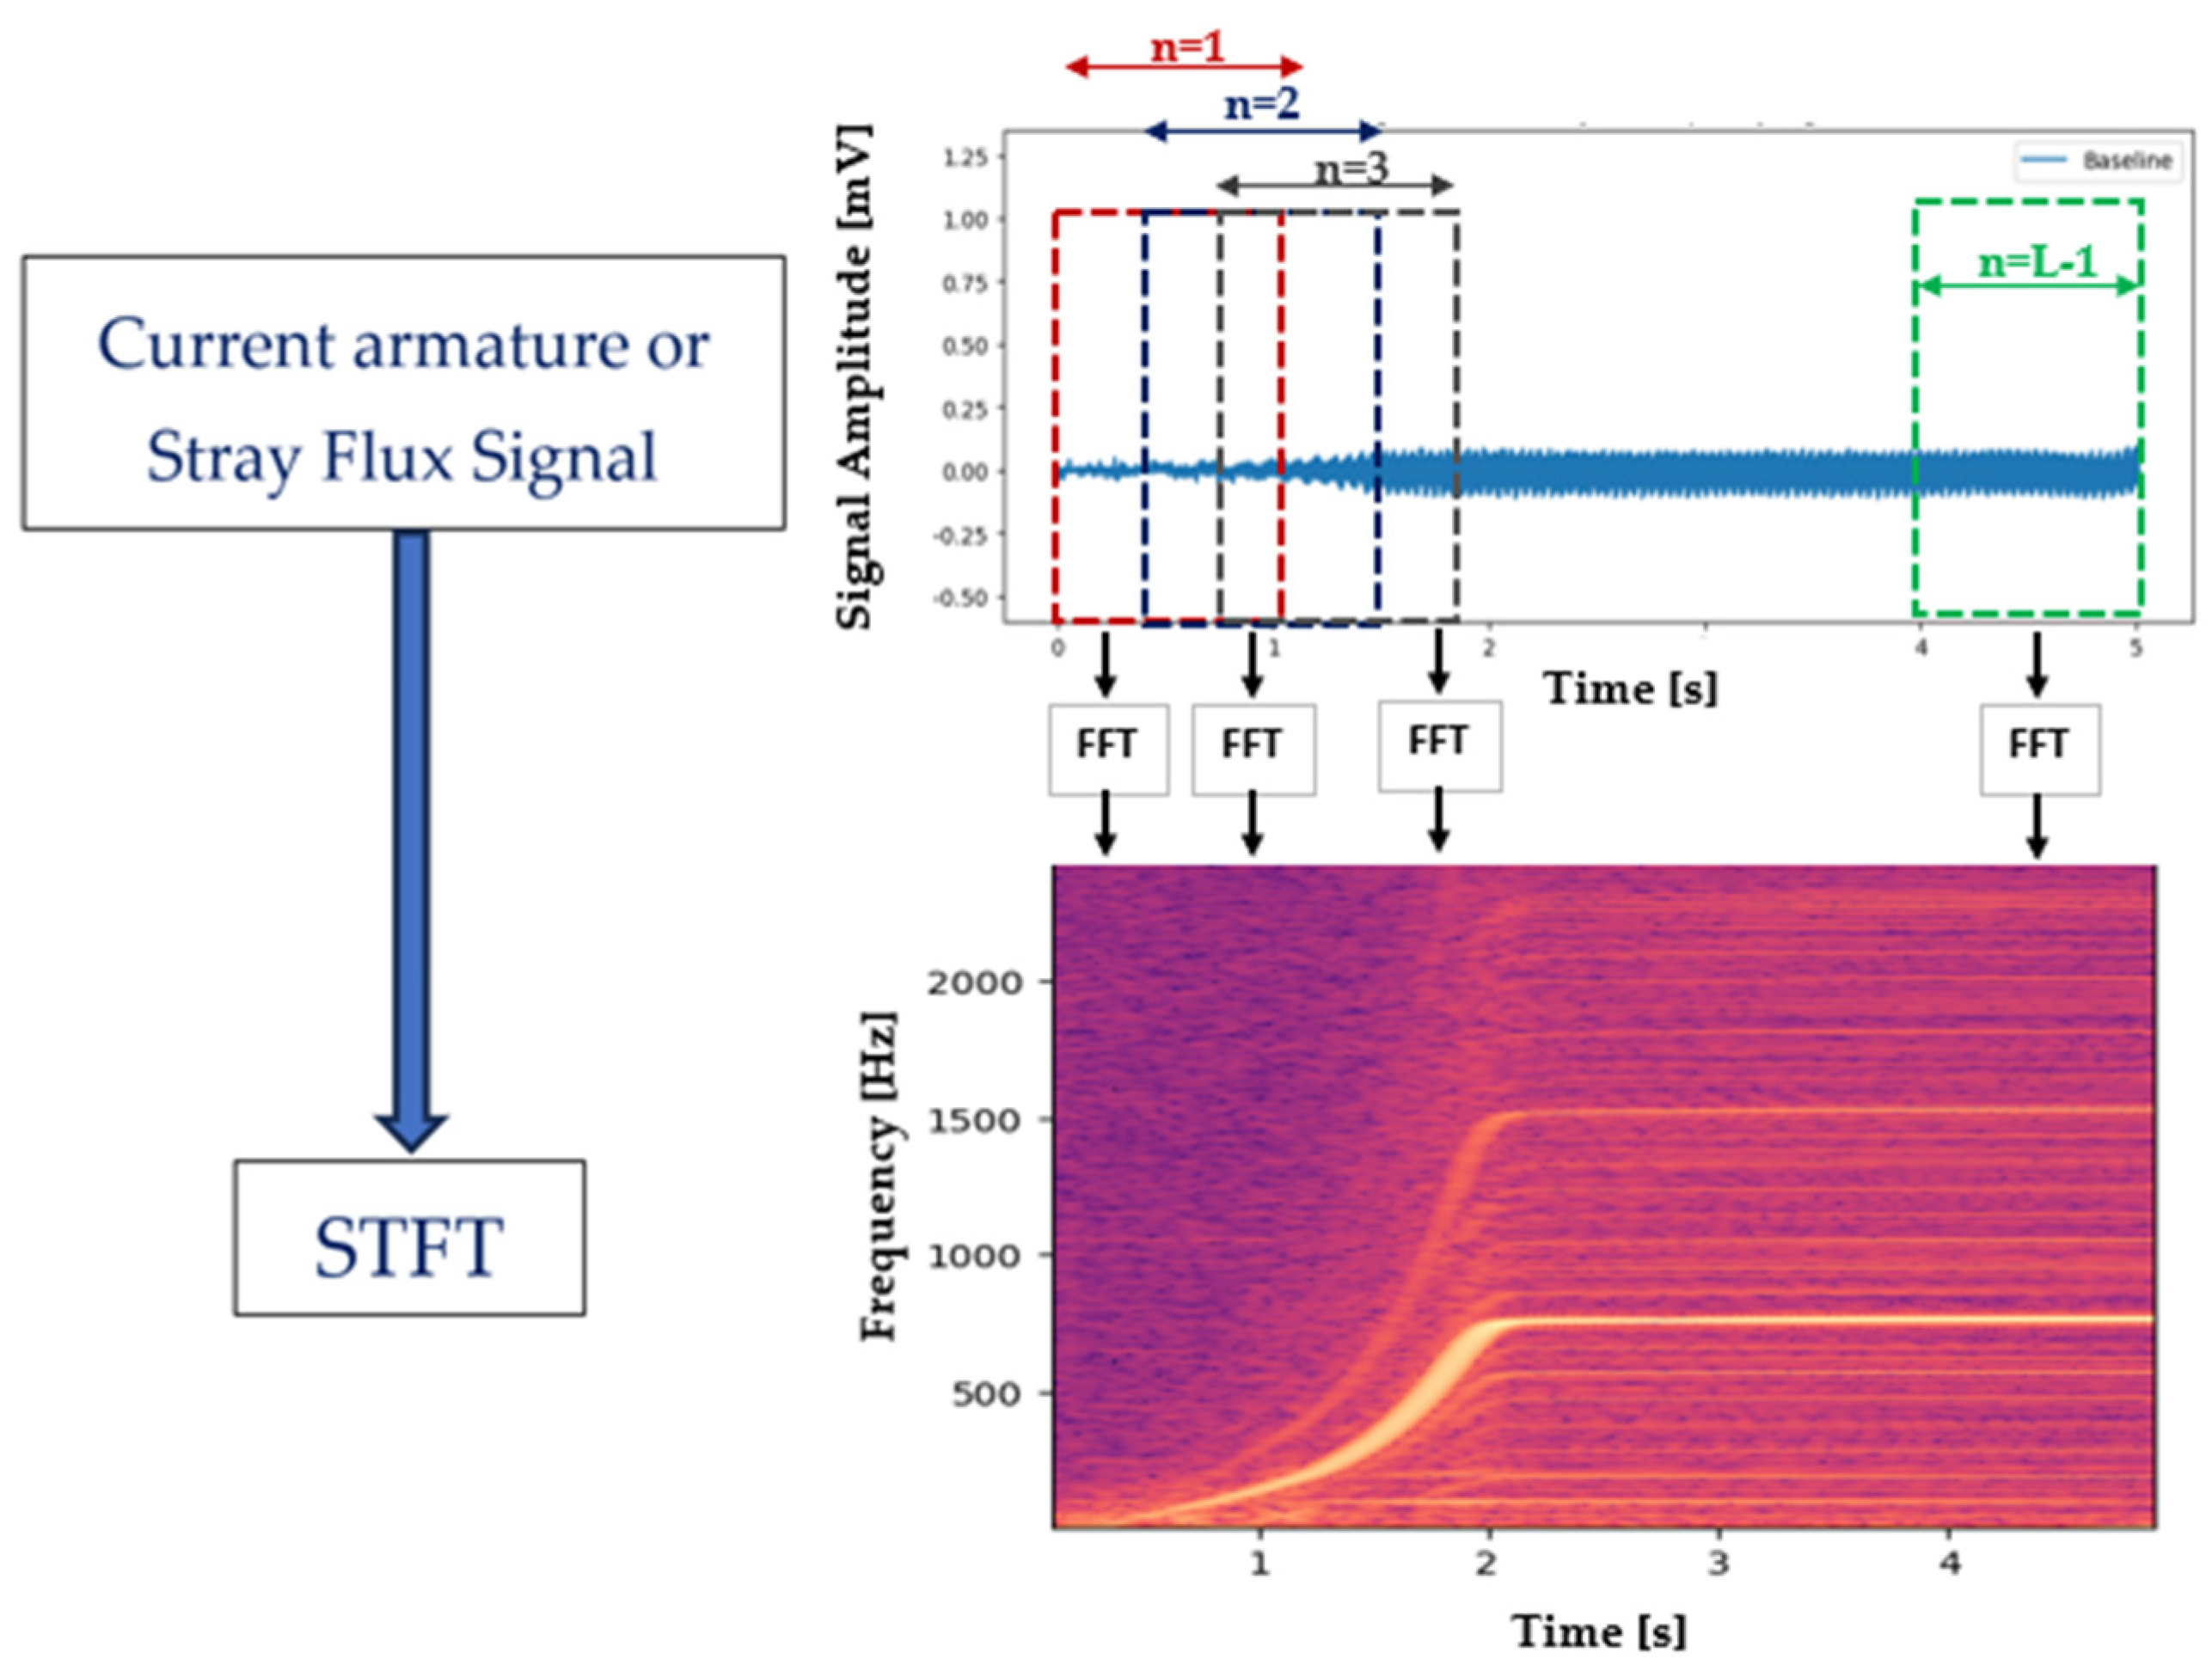
2.3. Short-Time Fourier Transform
2.4. S-Transform
- Spectrum Form
- Discrete-Time S-Transform of the signal at time and frequency can be expressed as follows [29]:
2.5. Shannon Entropy
3. Proposed Methodology
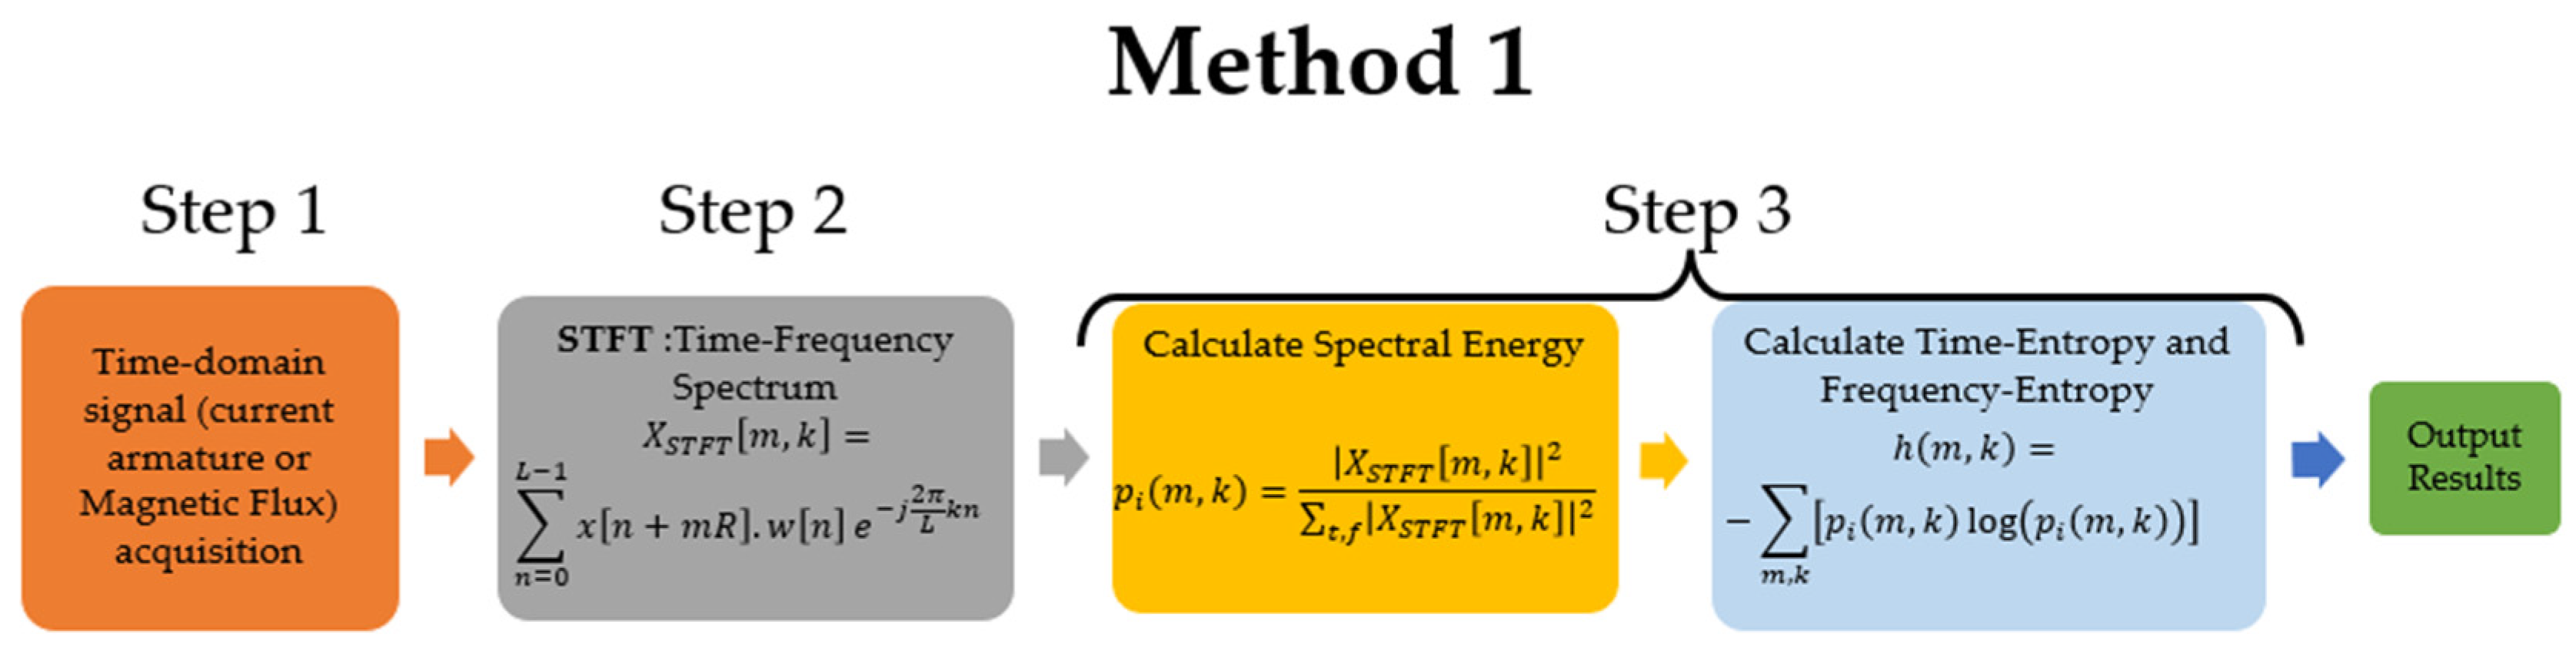
- Step 2. The STFT (2D or 3D) is applied by means of discrete analysis to obtain a time-frequency spectrogram of the current and stray flux signals.
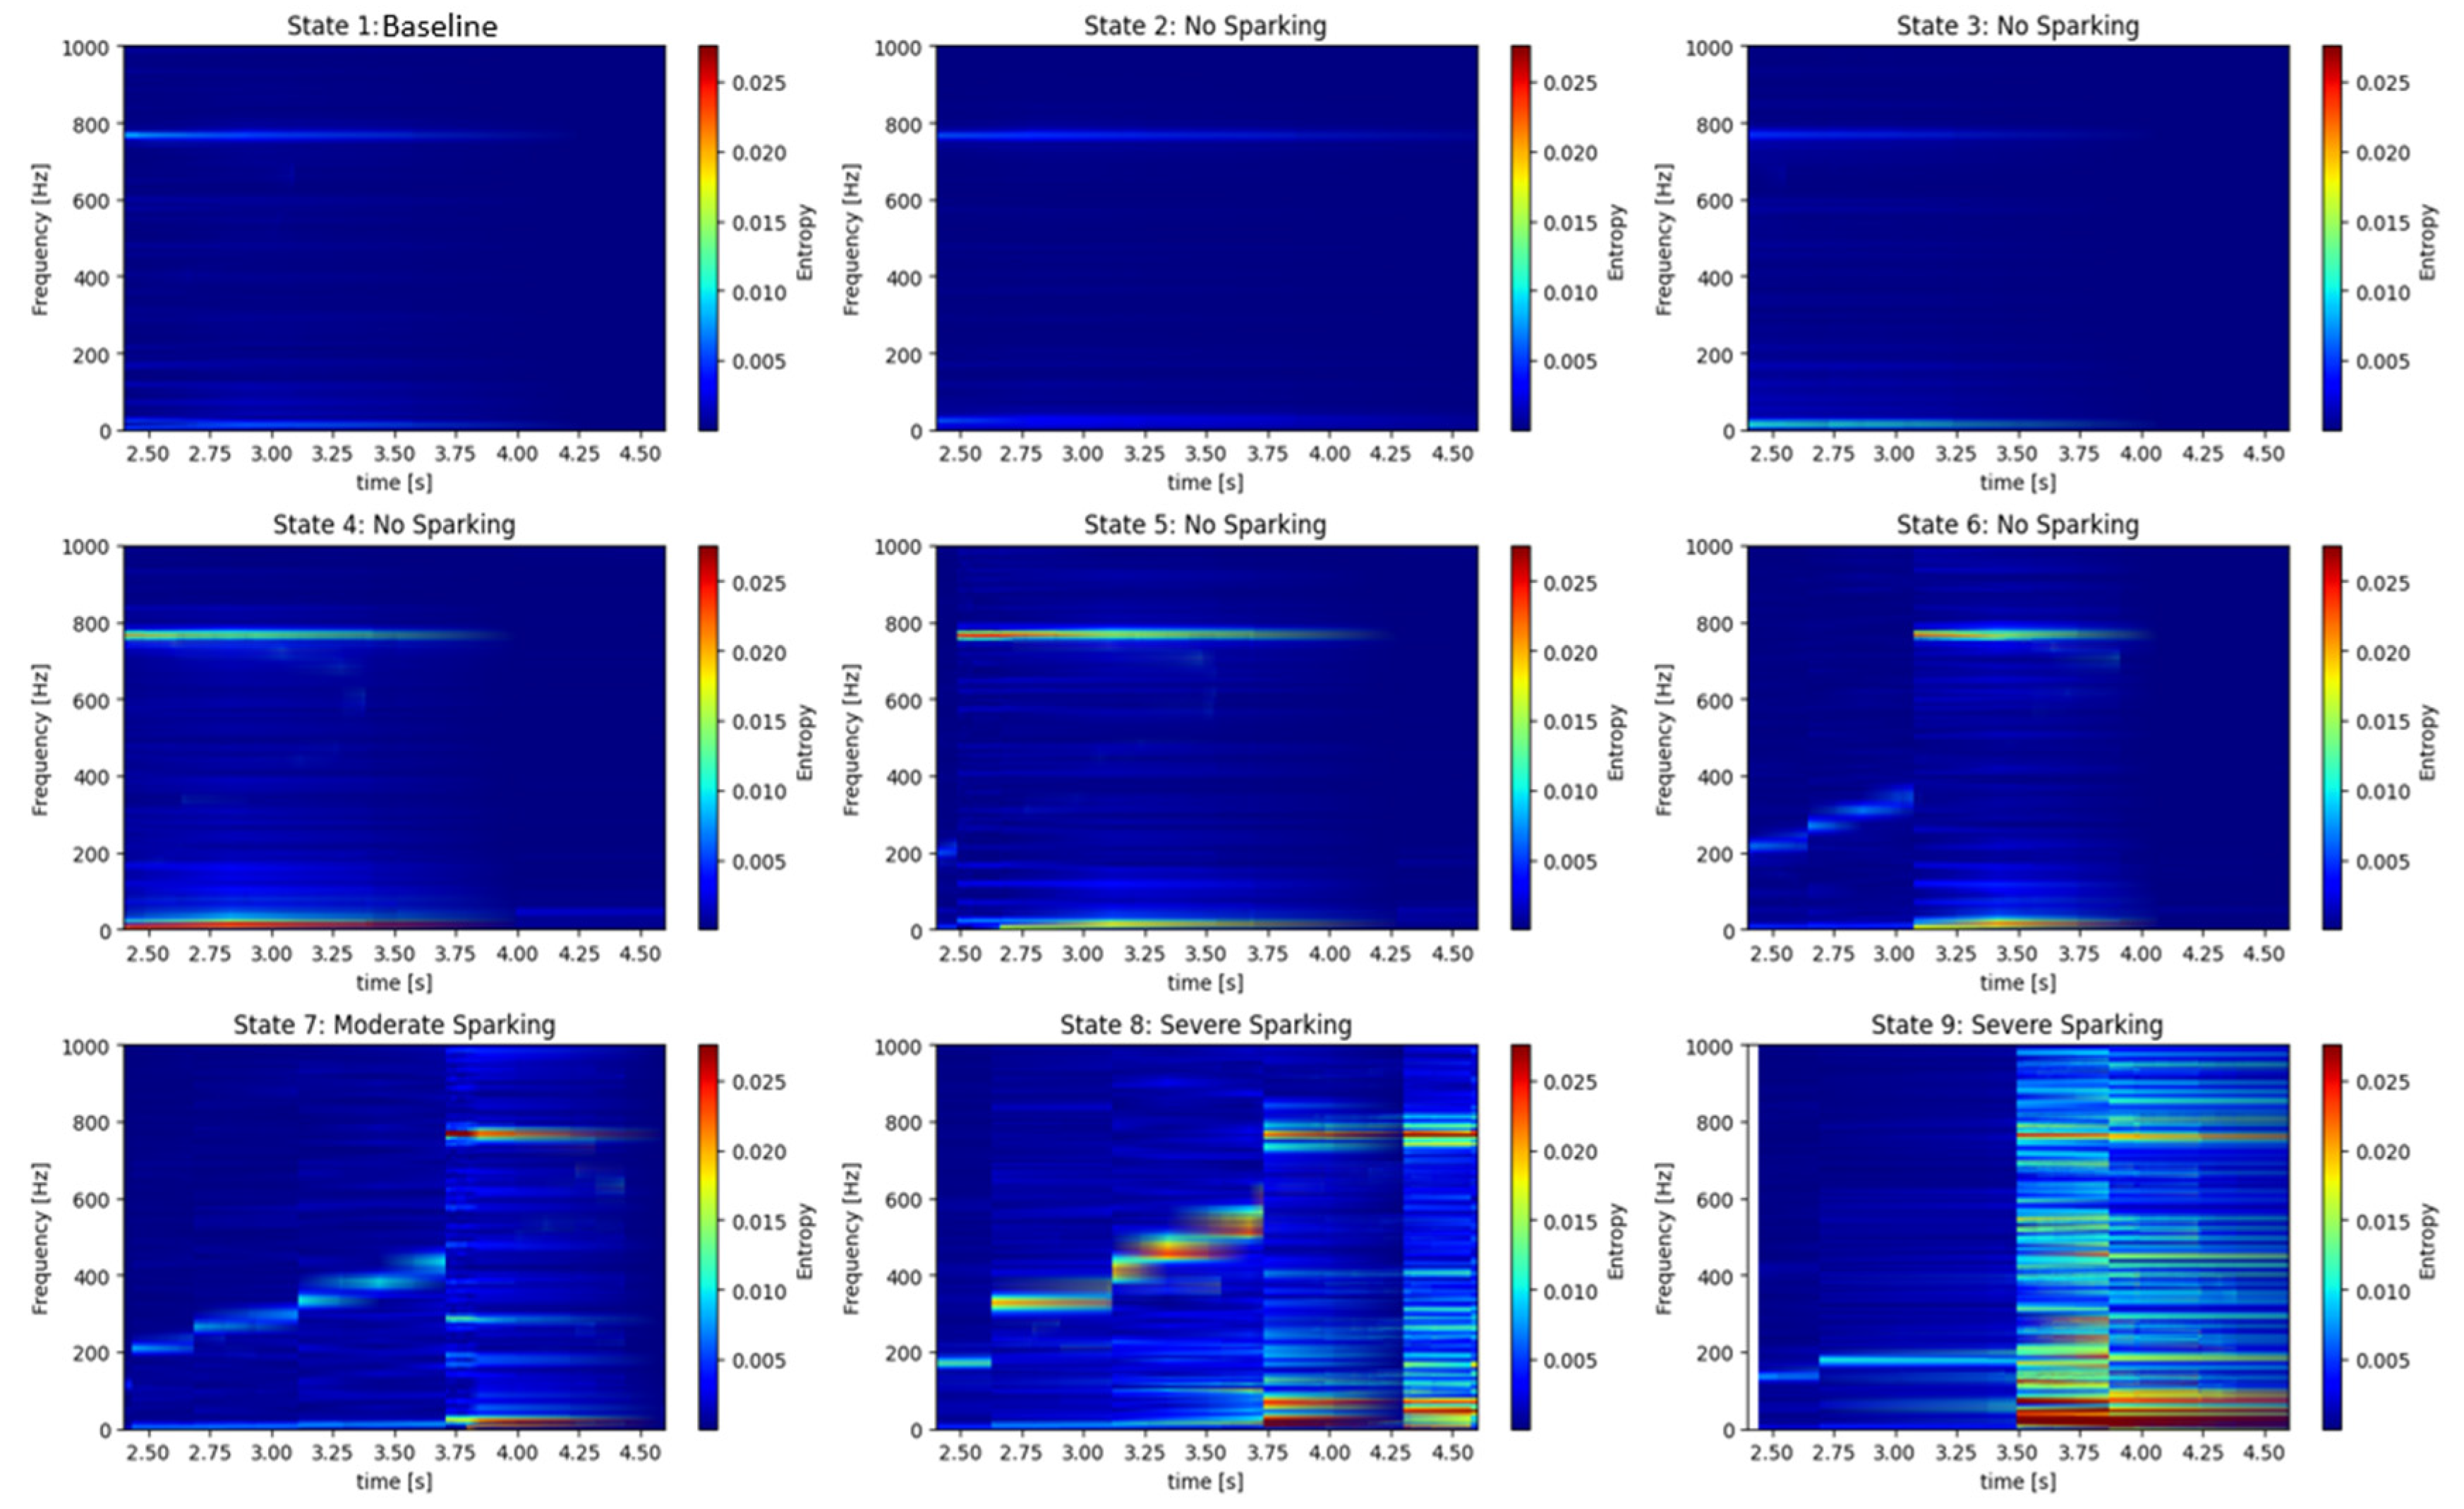
- Step 3. Calculate the probability distribution of the STFT , then calculate Shannon entropy applying Equation (5). Shannon entropy is plotted over time and frequency.
- Step 2. Apply Stockwell-T to obtain a time-frequency map (using Shannon entropy) of the recorded current and stray flux. Using this transformation, we can confirm the previous analyses and clearly visualize the evolution of the fault components and the higher energy frequency range.
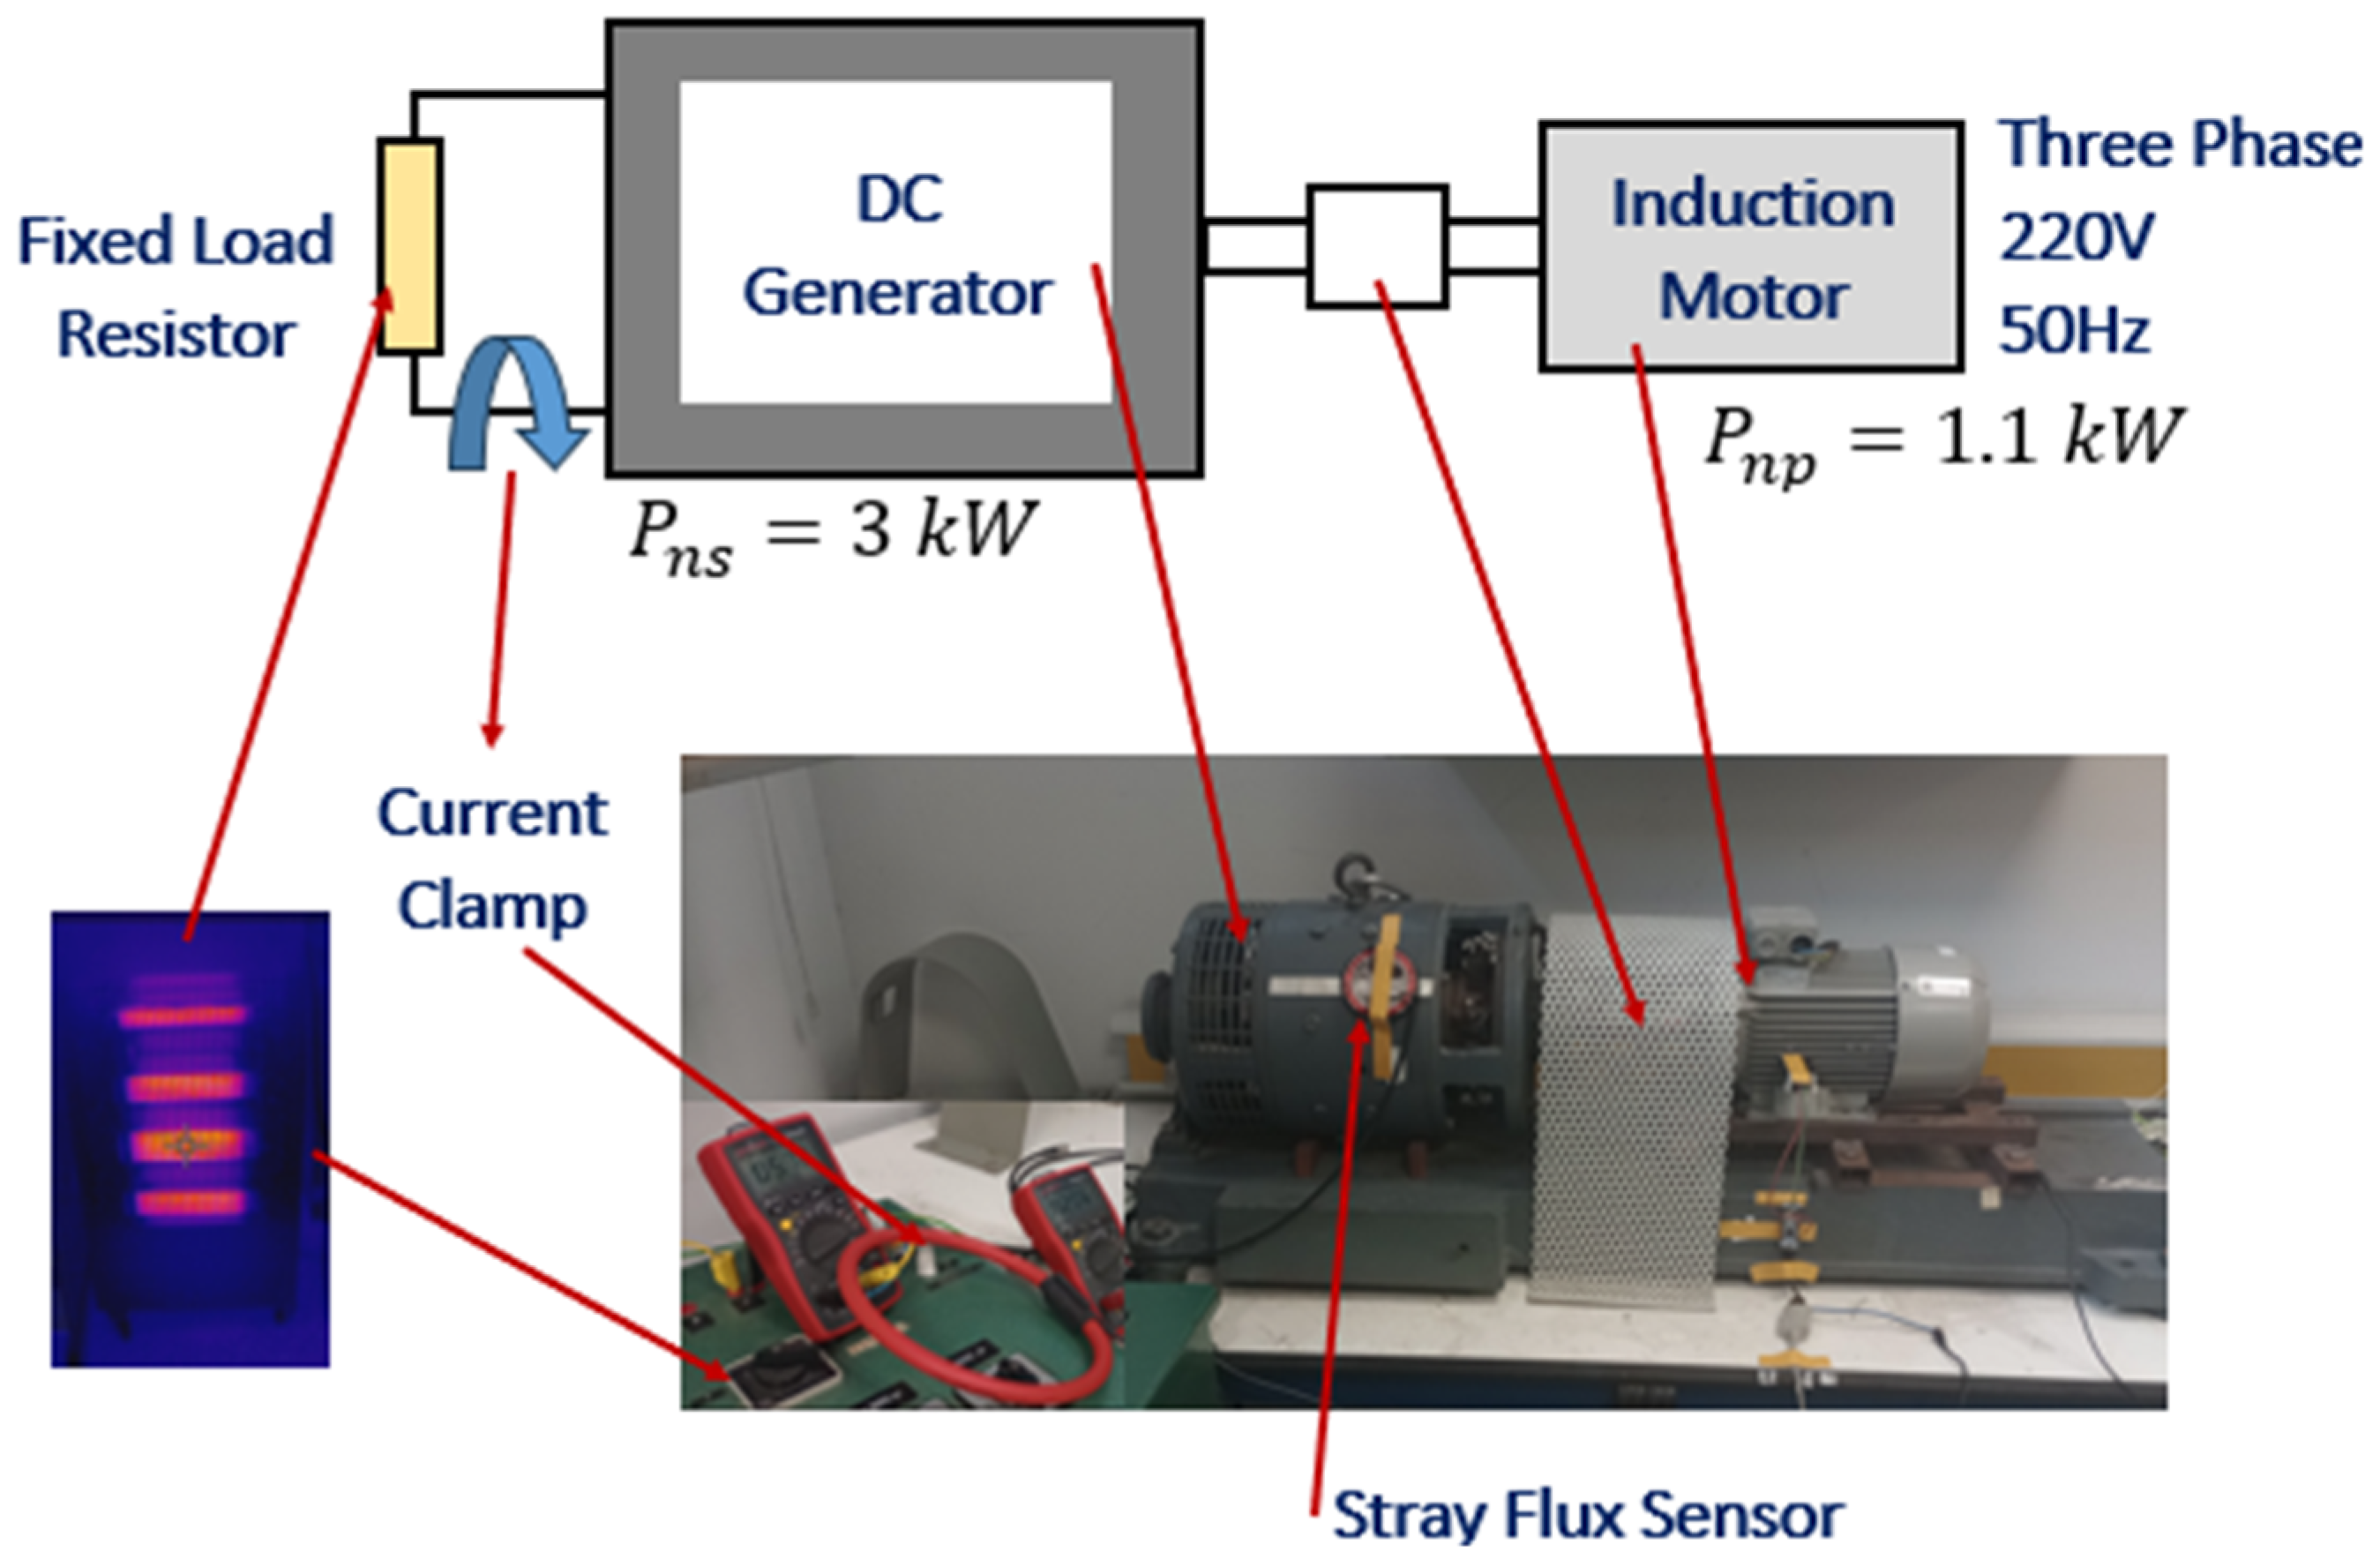
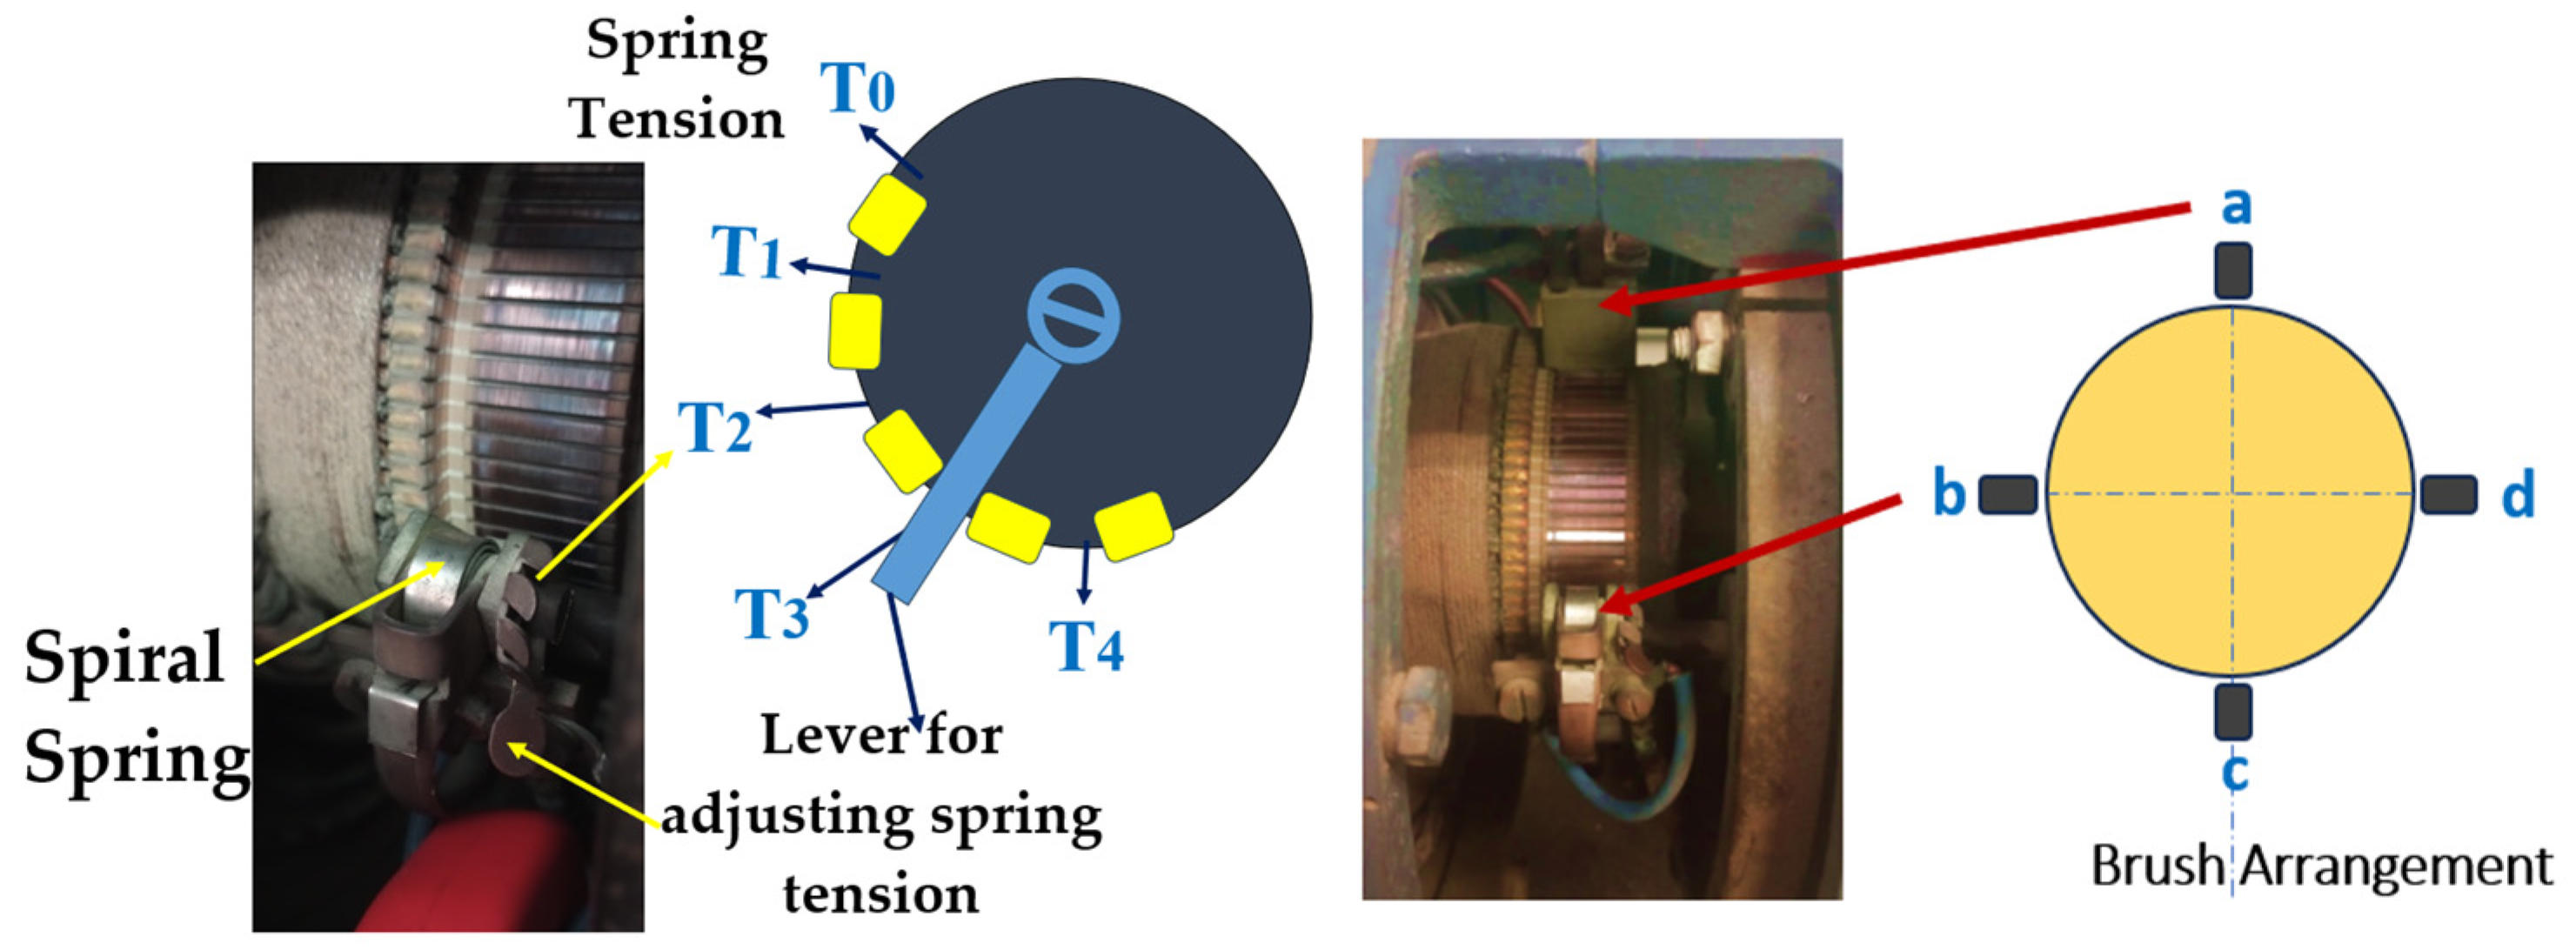
4. Experimental Setup
5. Analysis at Steady-State
6. Results and Discussion
6.1. Method 1
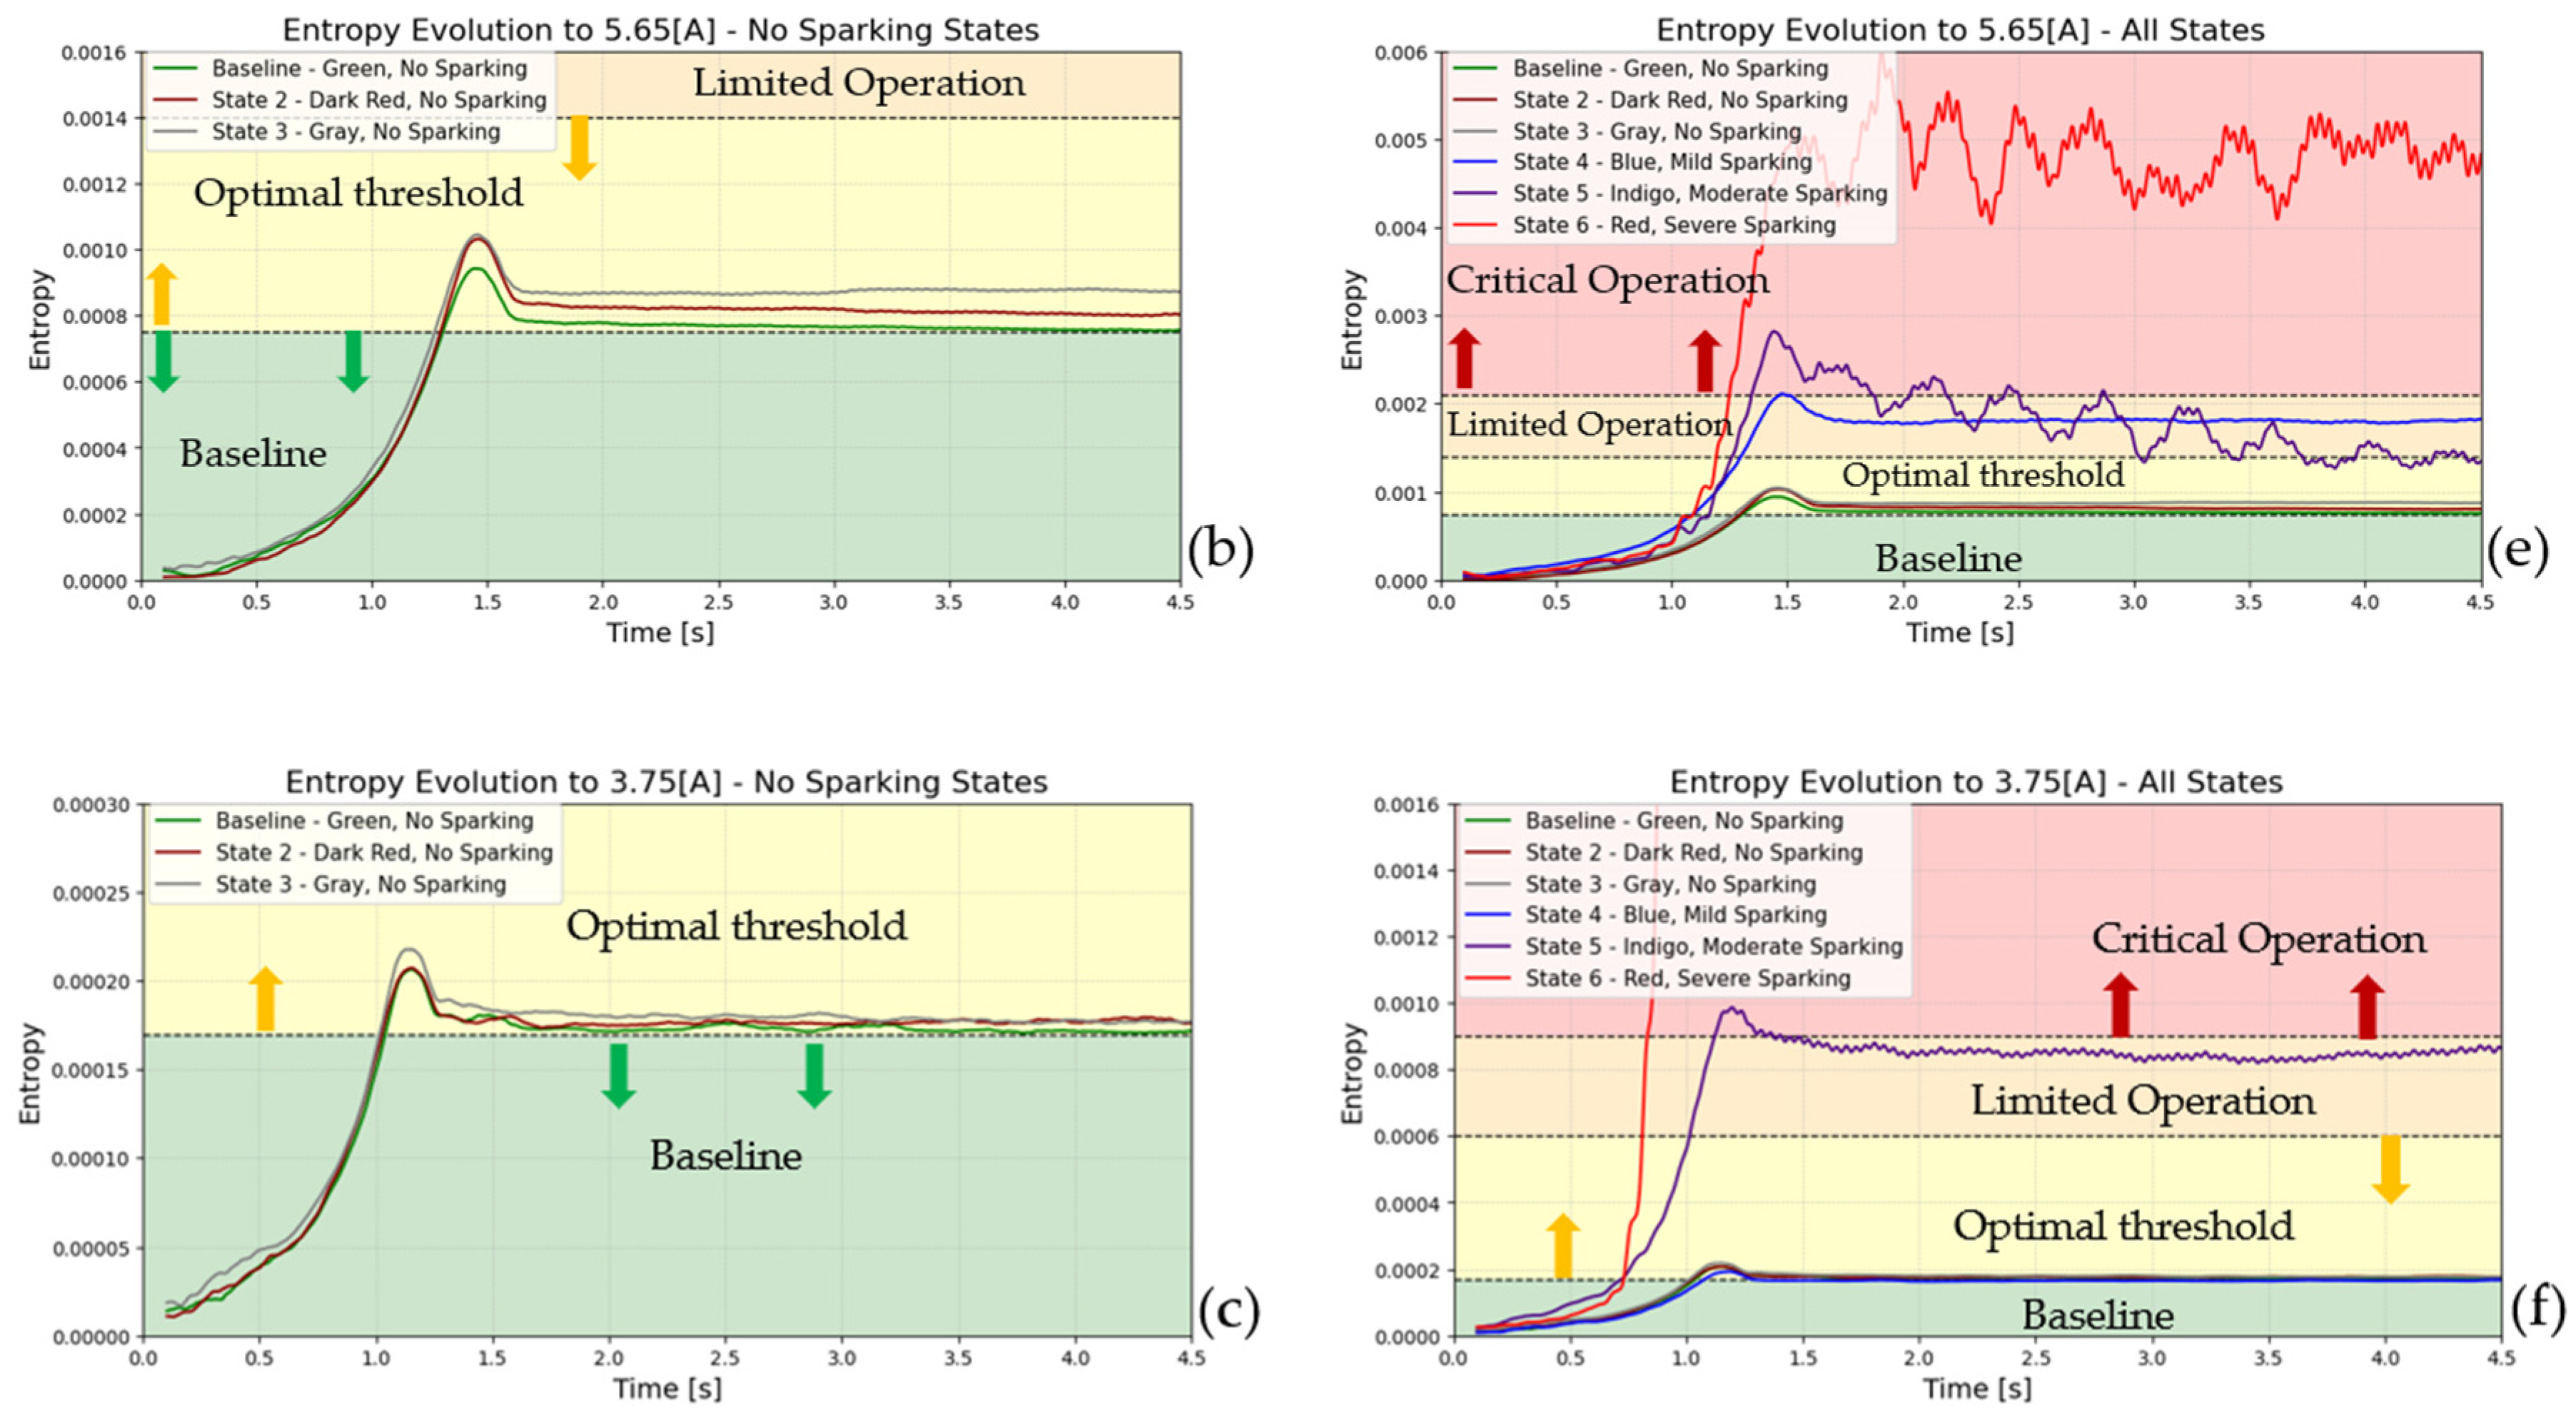
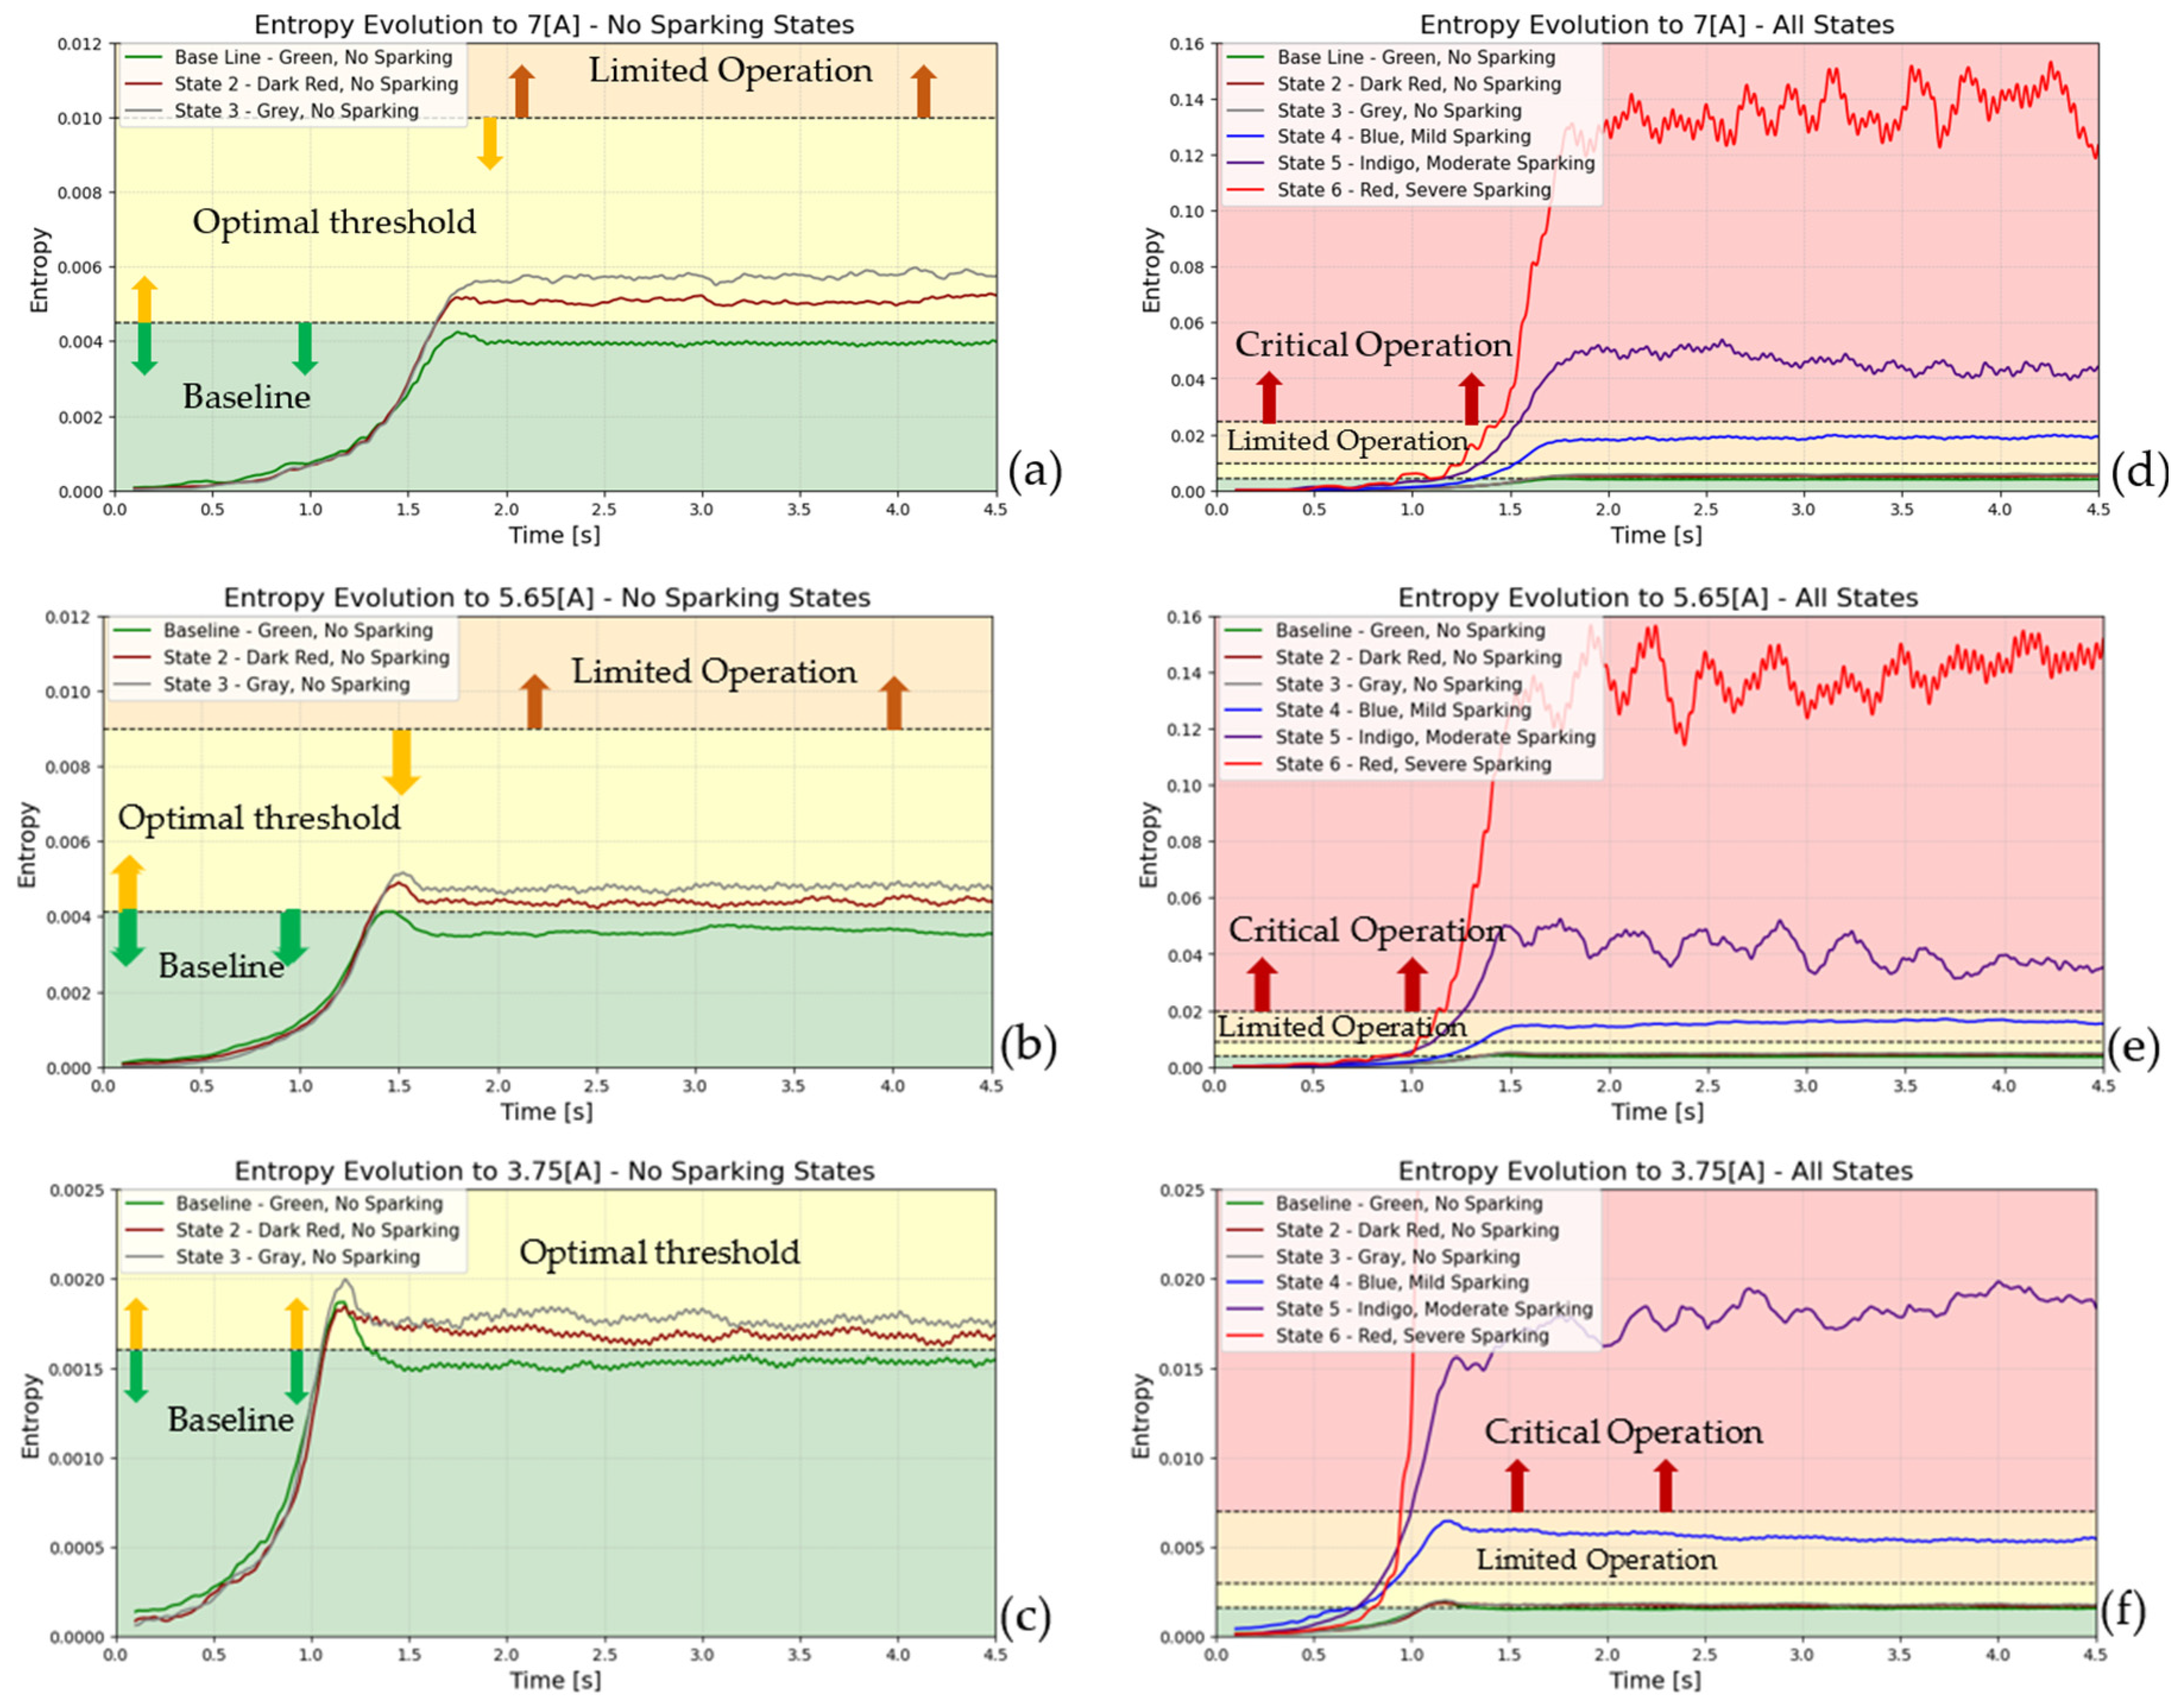
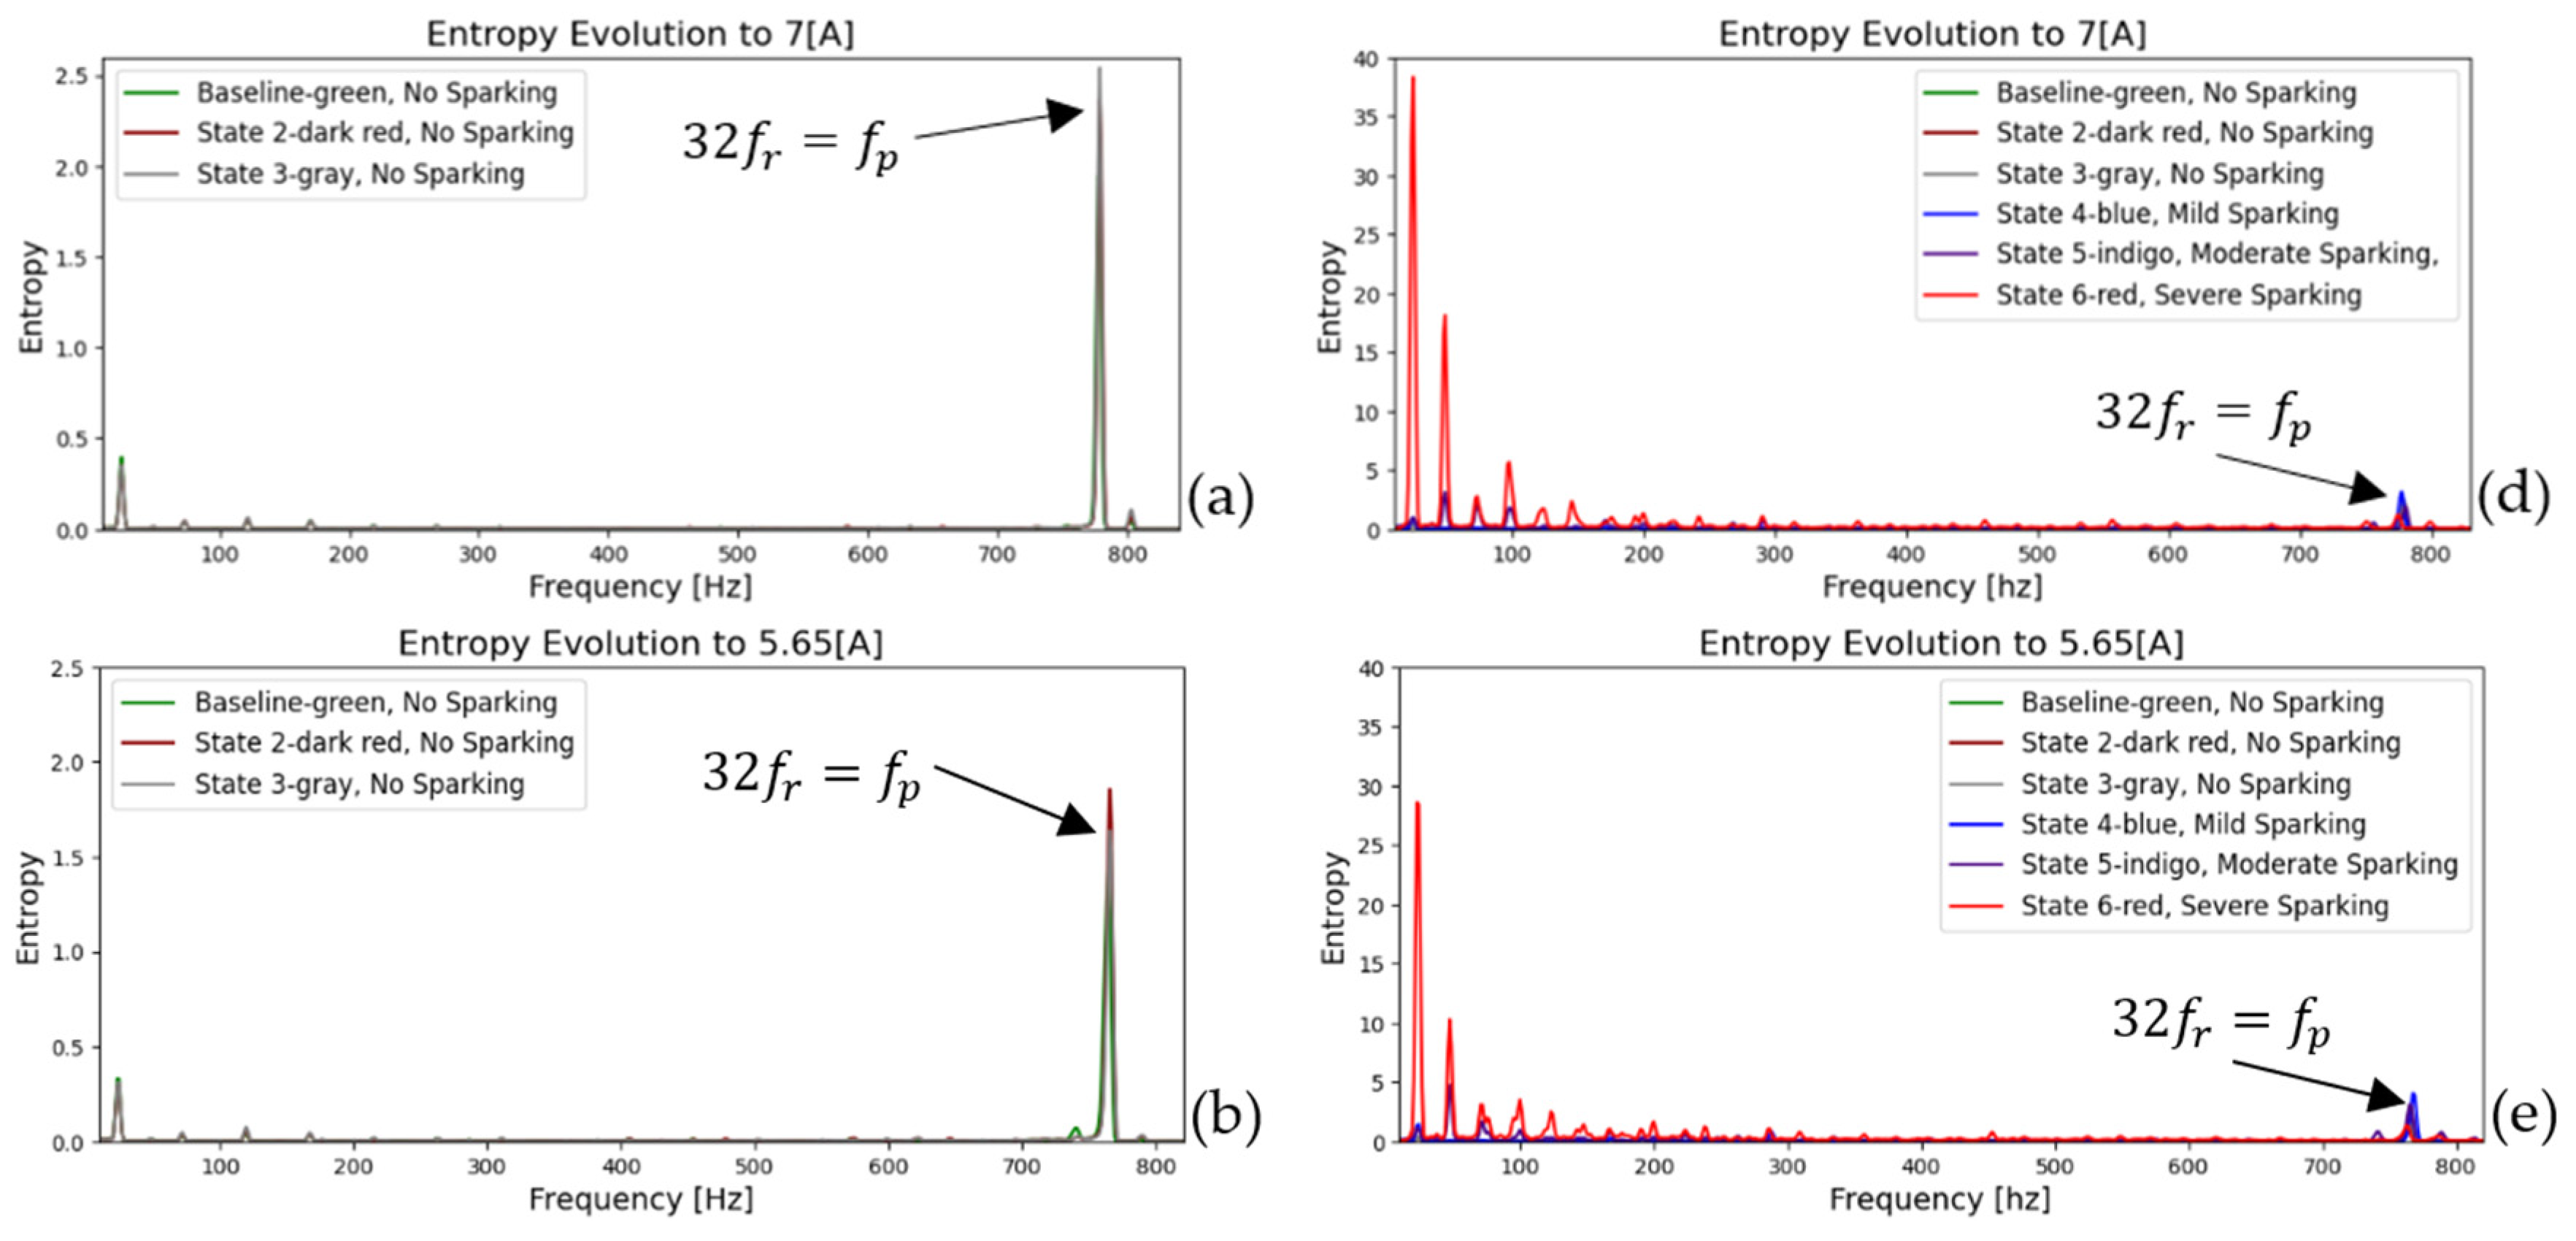
6.2. Method 2
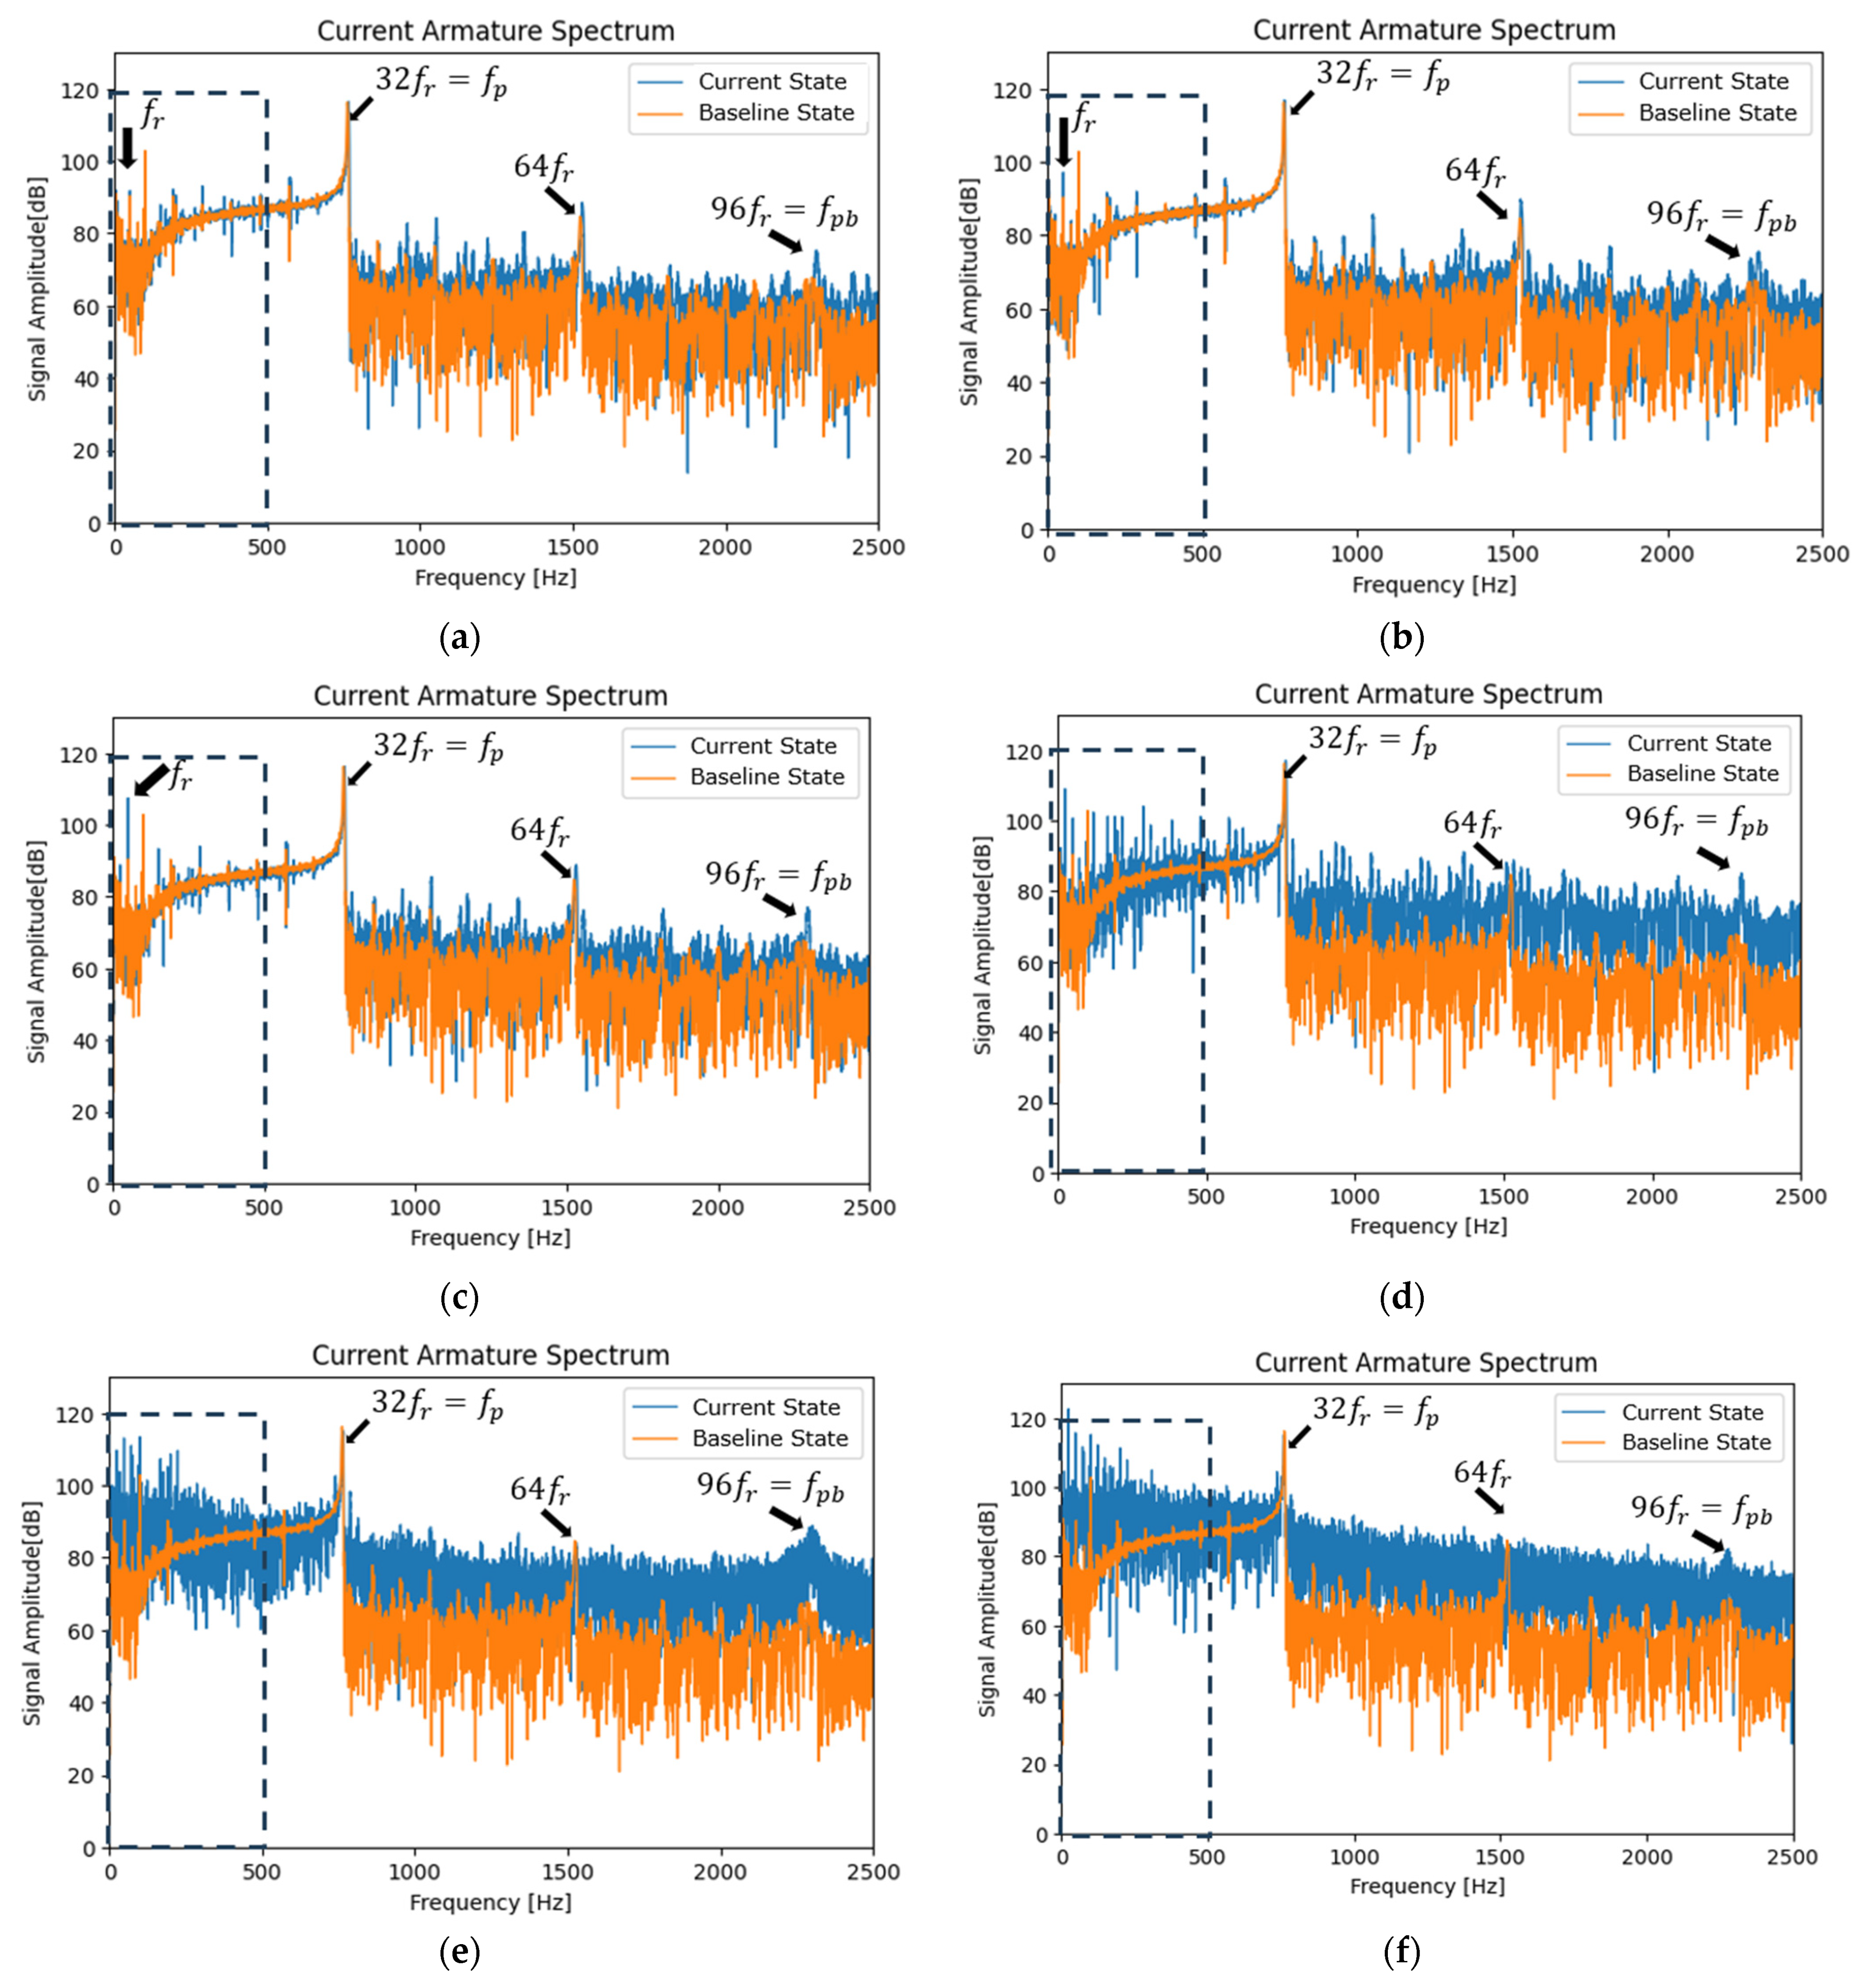
- Armature Current
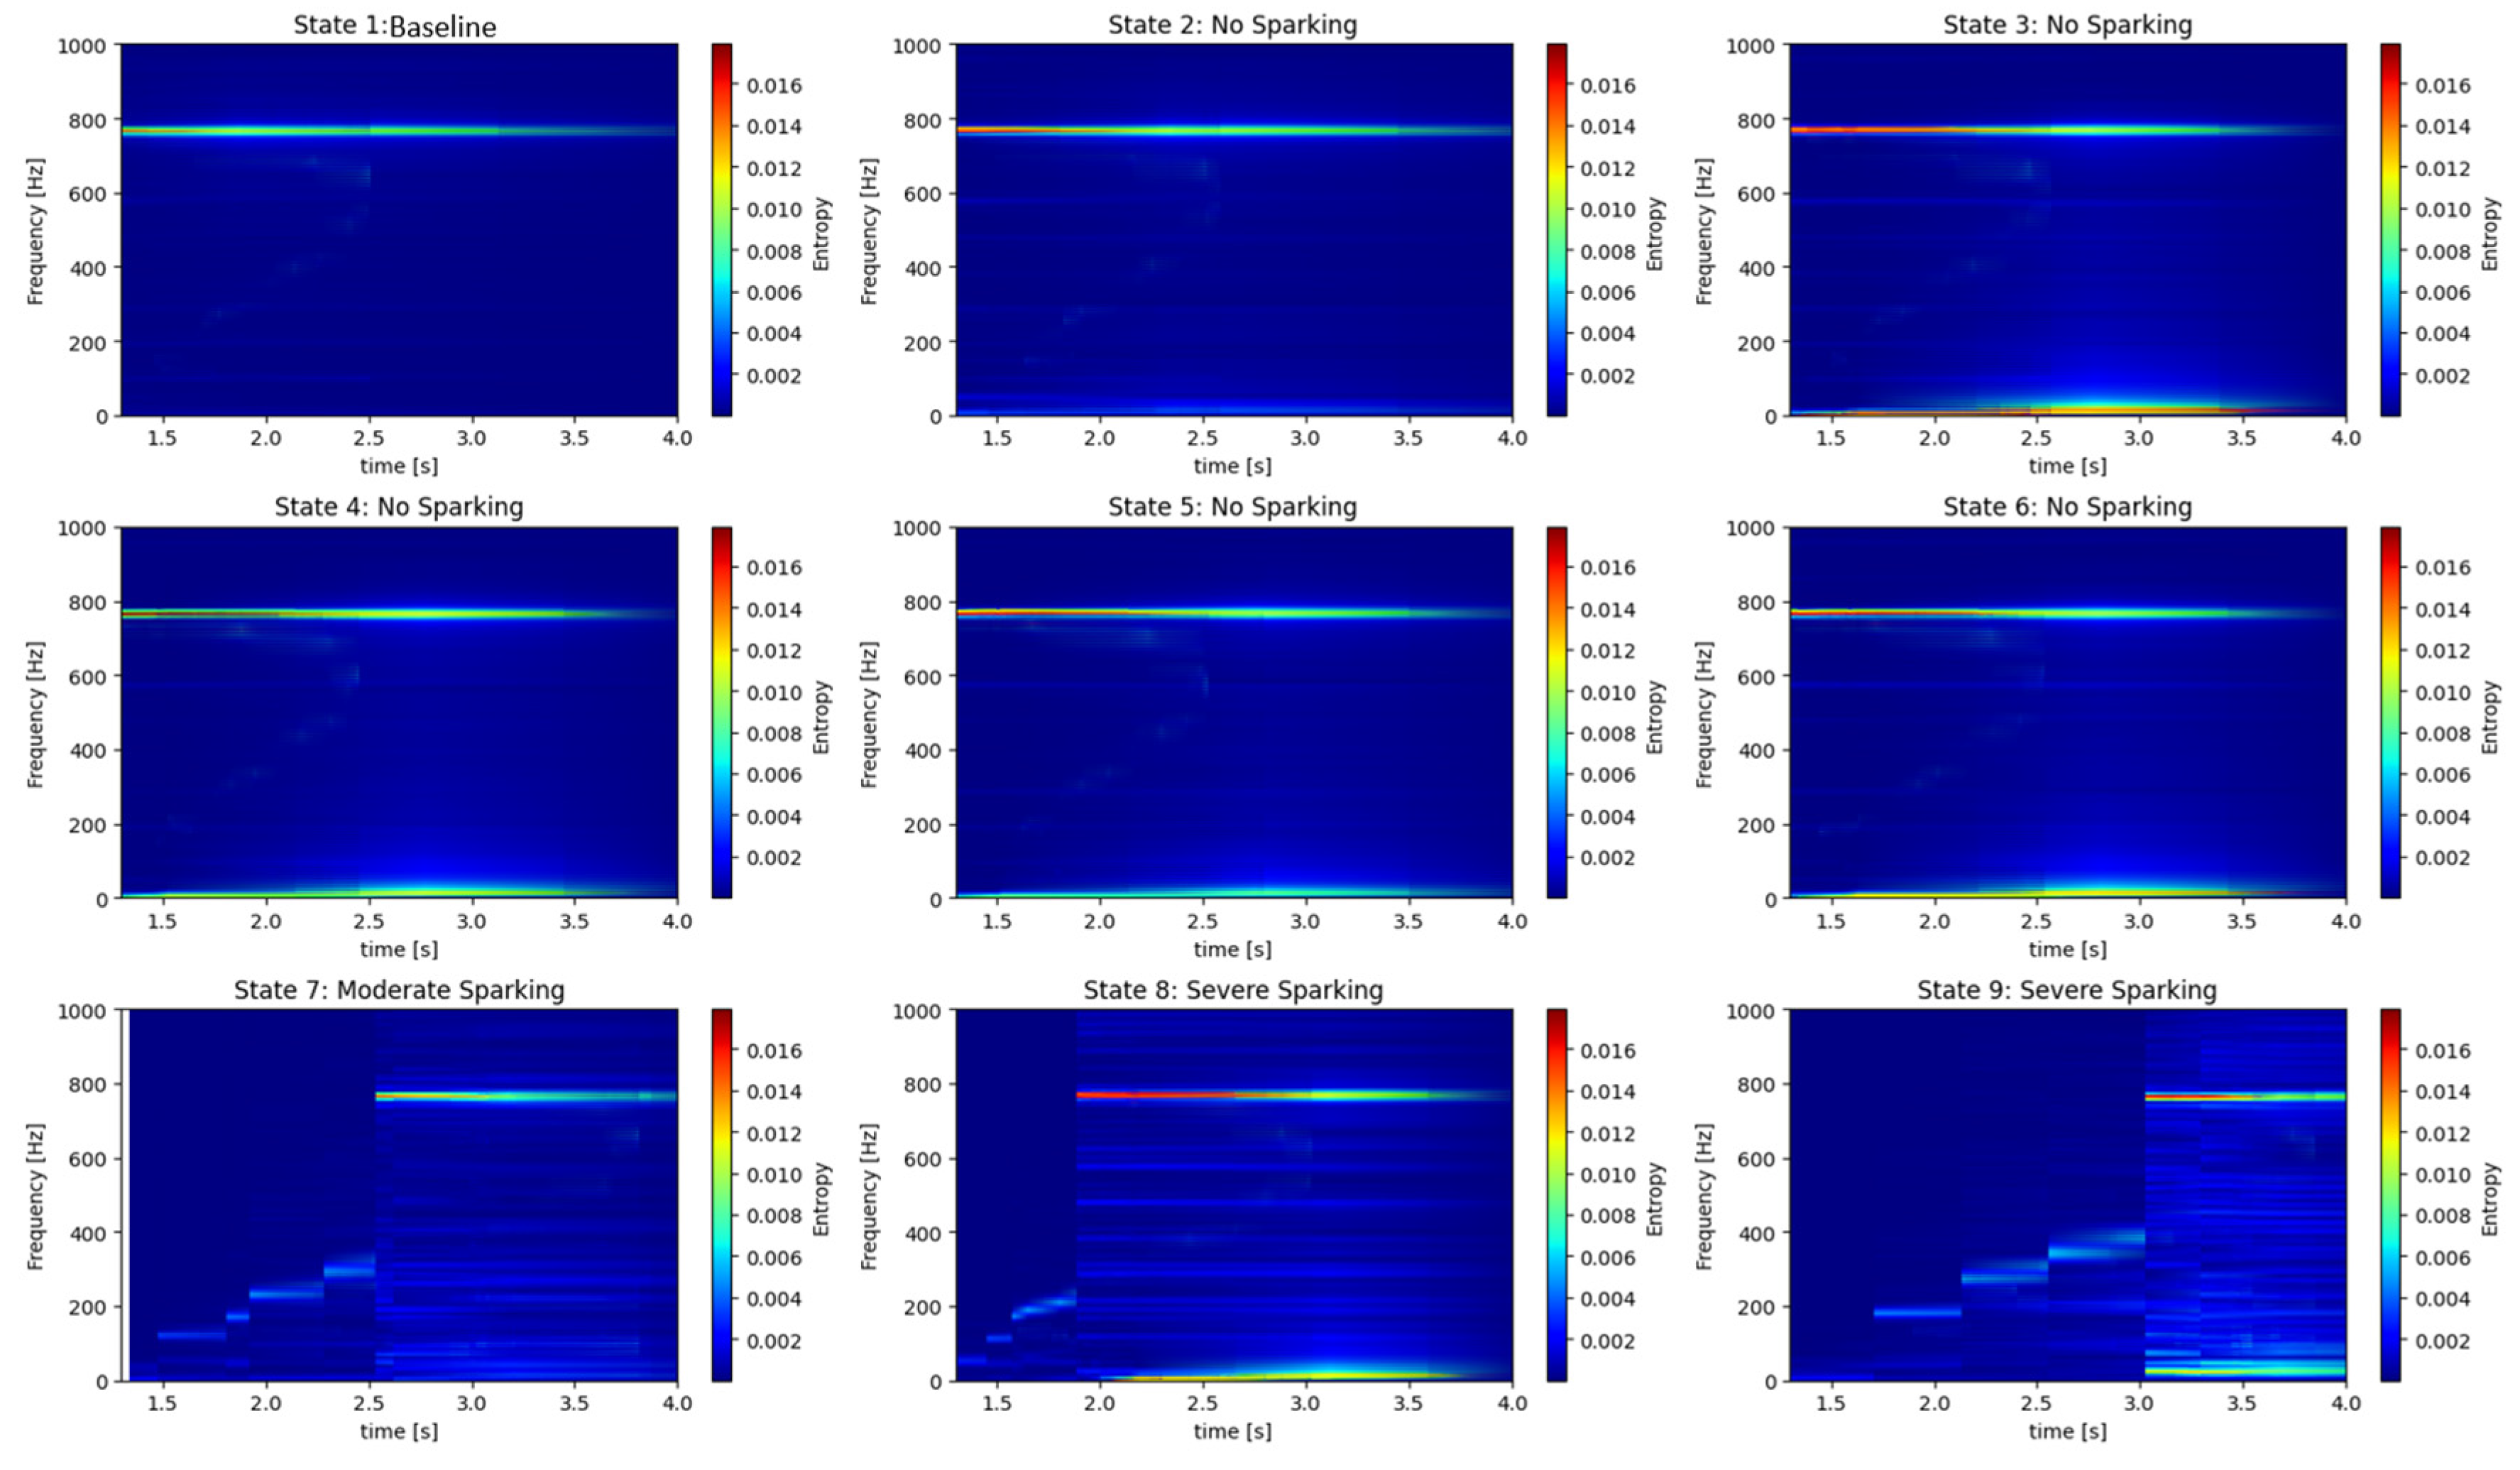
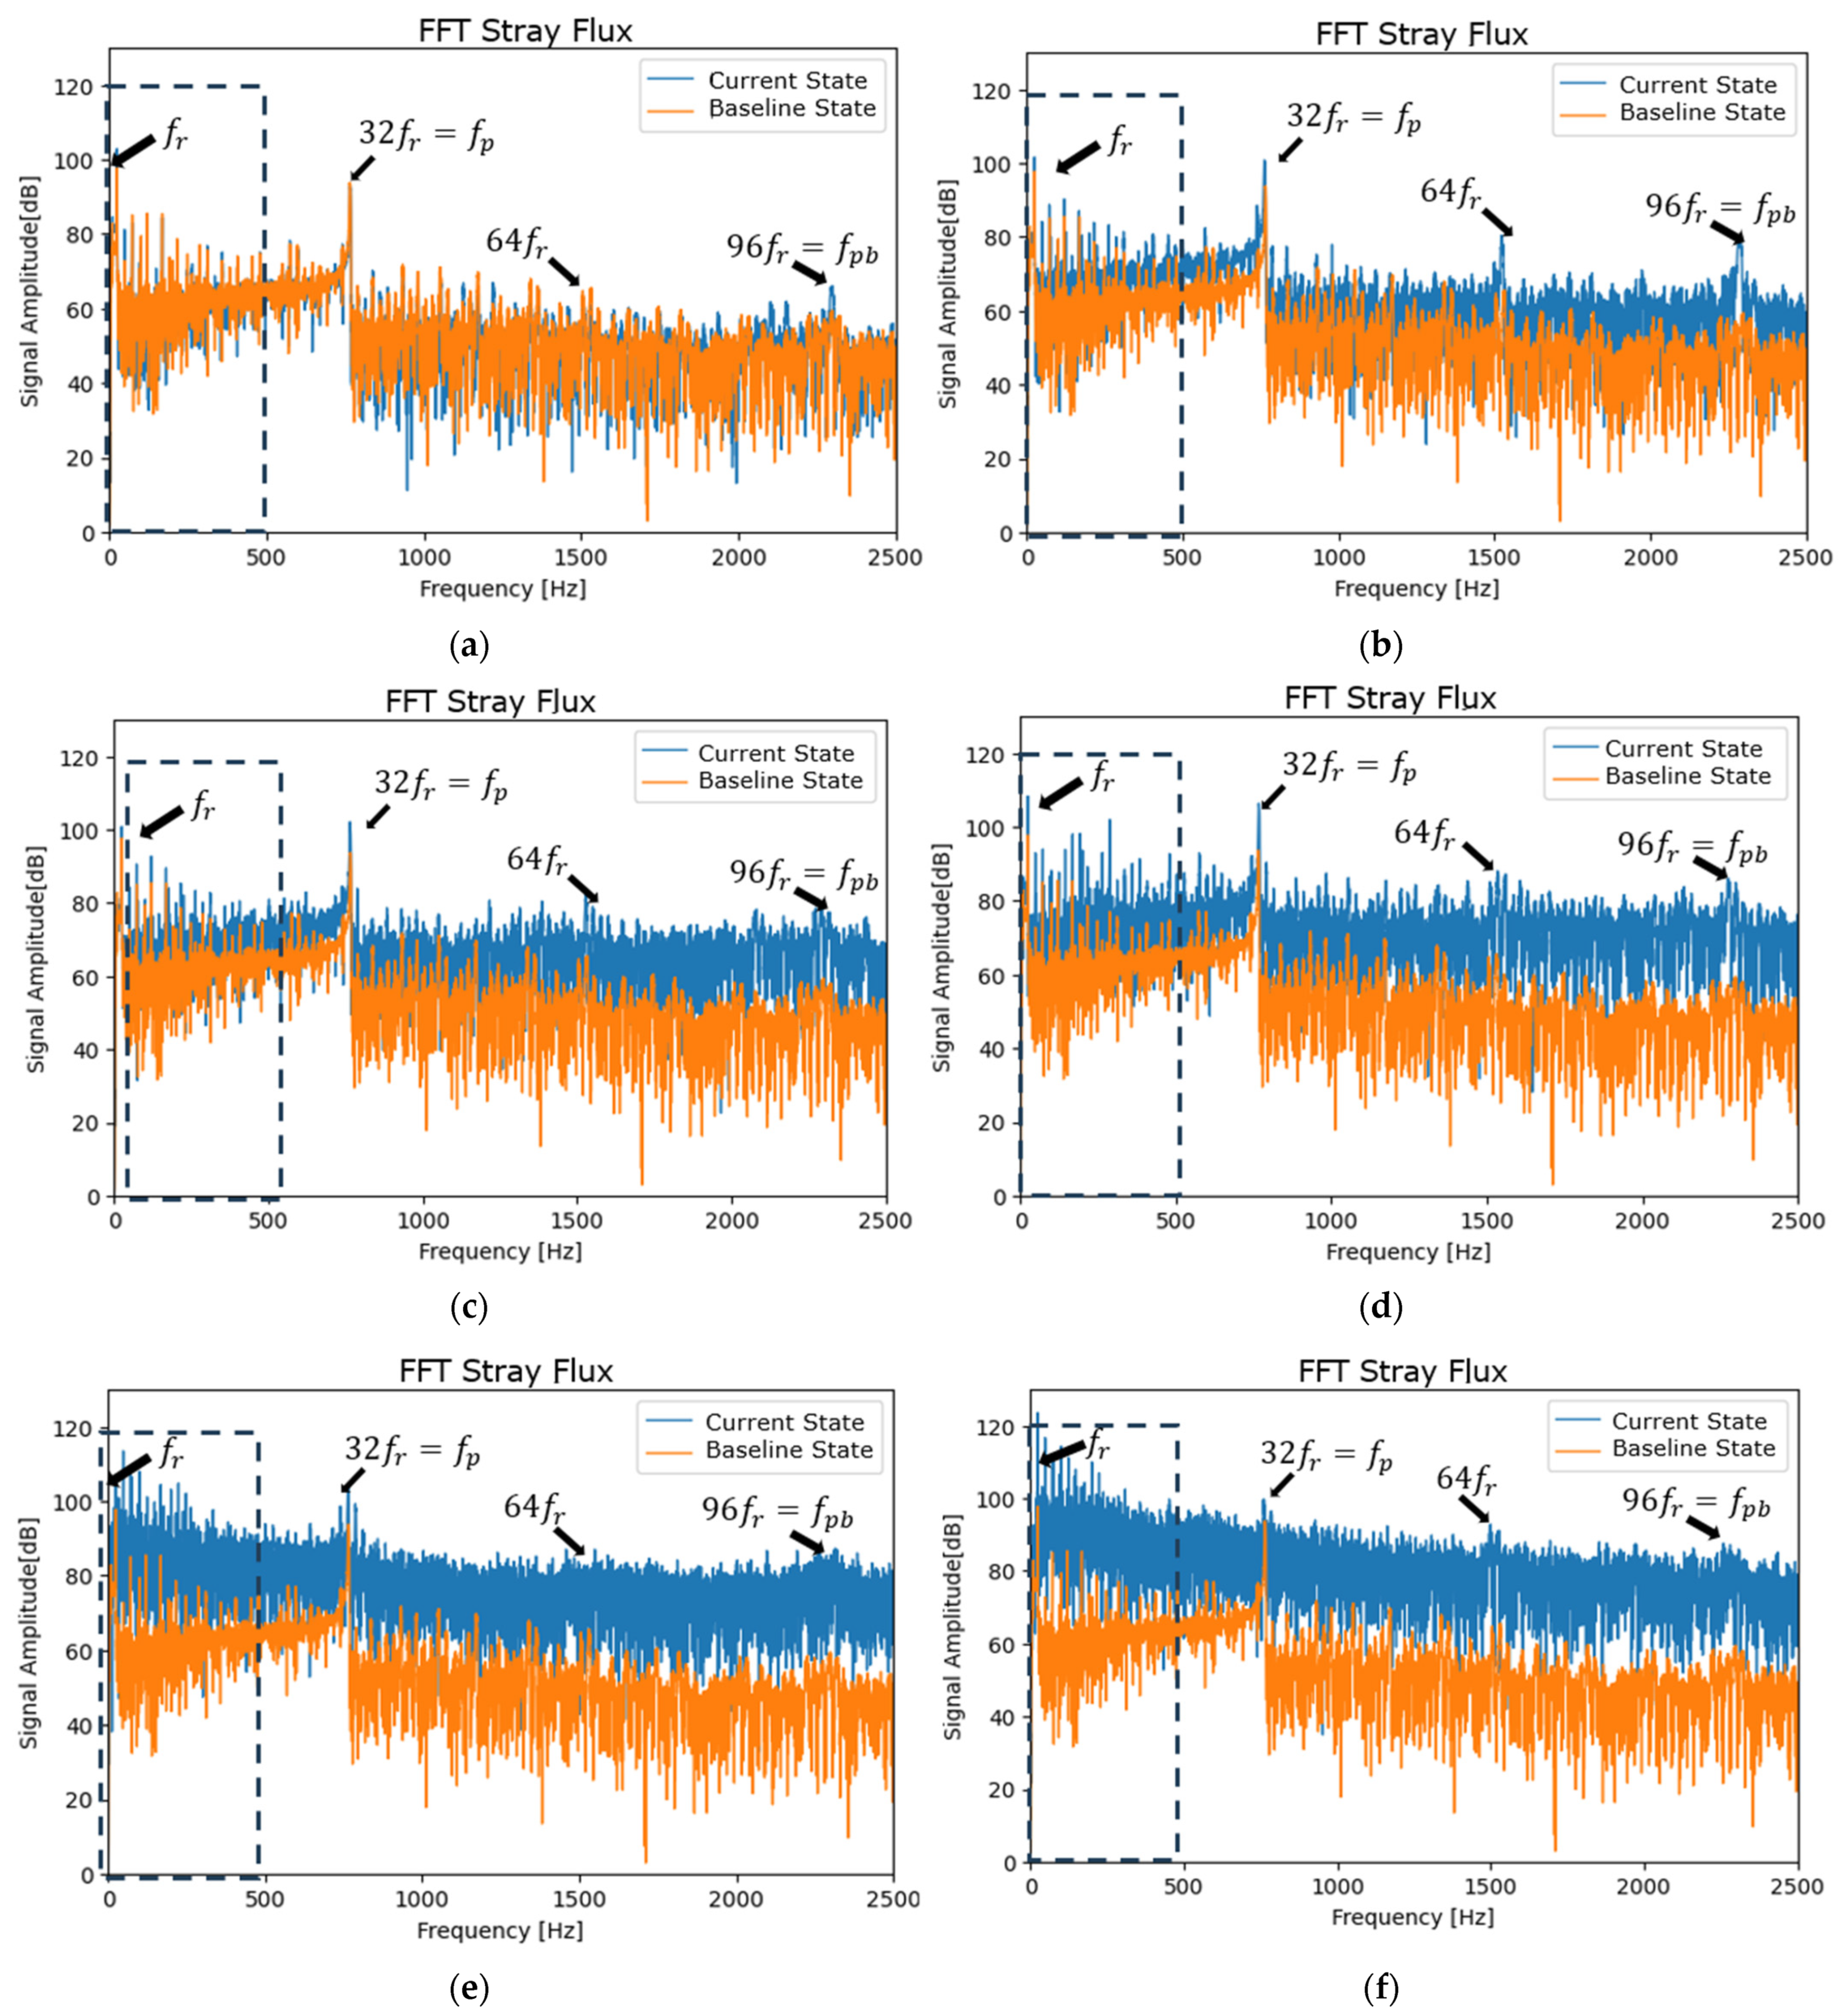
- Stray Flux
7. Conclusions
Author Contributions
Funding
Institutional Review Board Statement
Data Availability Statement
Conflicts of Interest
Abbreviations
| DC | Direct Current |
| GST | Generalized S-transform. |
| PE | Permutation entropy |
| S-T | Stockwell Transform |
| SSGST | Squeezing Generalized S-transform. |
| STFT | Short-Time Fourier Transform |
References
- Global Brushed DC Motor Market Size & Share Analysis—Growth Trends & Forecasts (2024–2029). Available online: https://www.mordorintelligence.com/industry-reports/global-brushed-dc-motor-market (accessed on 29 June 2024).
- Velasco-Pla, P.M.; Antonino-Daviu, J. Sparking Detection in Brushed dc Motors through the Analysis of the Armature Current under the Starting. In Proceedings of the 2022 International Conference on Electrical Machines (ICEM), Valencia, Spain, 5–8 September 2022; pp. 1537–1541. [Google Scholar] [CrossRef]
- Flinders, F.; Zhang, J.; Oghanna, W. Investigation on excessive commutator and brush wears in DC traction machines. In Proceedings of the IEEE 1999 International Conference on Power Electronics and Drive Systems. PEDS’99 (Cat. No.99TH8475), Hong Kong, China; 1999; Volume 1, pp. 200–205. [Google Scholar] [CrossRef]
- ABB—Asea Brown Boveri. Máquinas de CC, DMI. Instrucciones de Funcionamiento y Mantenimiento. 16464NOVA_3BSM003045-1_ed3.indd. Available online: https://library.e.abb.com/public/c8dd1f4fdfc45da2c1257440003e9aeb/3BSM003045-5_SPed3.pdf (accessed on 29 June 2024).
- Salas Robles, J.E. Diagnóstico de Averías Asociadas a la Detección de Chispas en Máquinas Rotativas de Corriente Continua Mediante el Análisis Avanzado de Corrientes. 2024. Available online: http://hdl.handle.net/10251/205172 (accessed on 29 June 2024).
- Kliman, G.B.; Song, D.; Koegl, R.A. Remote monitoring of DC motor sparking by wavelet analysis of the current. In Proceedings of the 4th IEEE International Symposium on Diagnostics for Electric Machines, Power Electronics and Drives, 2003—SDEMPED 2003, Atlanta, GA, USA, 24–26 August 2003; pp. 25–27. [Google Scholar] [CrossRef]
- Barwany, S.M.; Thomas, G. A non-intrusive system (SMS) to monitor sparking along the brush/commutator interface of a DC machine. In Proceedings of the 1991 Fifth International Conference on Electrical Machines and Drives, London, UK, 11–13 September 1991; Conf. Publ. No. 341. IET: Stevenage, UK, 1991; pp. 72–76. [Google Scholar]
- Nebolyubov, Y.E. Photo-Electric Method of Testing and Adjusting the Commutation of Electrical Machines. Elektrichestvo 1956, 11, 34–37. [Google Scholar]
- Michiguchi, Y.; Izumi, S.; Miyashita, I.; Tanisaka, S.; Watanabe, T. Development of a collector ring monitor for sparking detection on generators. IEEE Trans. Power Appar. Syst. 1983, 102, 928–933. [Google Scholar] [CrossRef]
- Benbouzid, M.E.H. A review of induction motors signature analysis as a medium for faults detection. In Proceedings of the IECON ‘98—Proceedings of the 24th Annual Conference of the IEEE Industrial Electronics Society (Cat. No.98CH36200), Aachen, Germany, 31 August–4 September 1998; Volume 4, pp. 1950–1955. [Google Scholar] [CrossRef]
- Troshin, I.A. Measurements of armature current in the brush collector unit of a direct current motor during the commutation period. Russ. Electr. Engin. 2016, 87, 116–118. [Google Scholar] [CrossRef]
- Petushkov, M.Y.; Shcherbina, D.V.; Sarvarov, A.S. Diagnostics of DC motors in the mining and processing production of OJSC “MMK”. In Proceedings of the 2019 International Conference on Electrotechnical Complexes and Systems (ICOECS), Ufa, Russia, 21–25 October 2019; pp. 1–4. [Google Scholar] [CrossRef]
- Hu, F.; He, Q.; Wang, J.; Liu, Z.; Kong, F. Commutation sparking image monitoring for DC motor. J. Manuf. Sci. Eng. 2012, 134, 024501. [Google Scholar] [CrossRef]
- Filina, O.A.; Martyushev, N.V.; Malozyomov, B.V.; Tynchenko, V.S.; Kukartsev, V.A.; Bashmur, K.A.; Pavlov, P.P.; Panfilova, T.A. Increasing the Efficiency of Diagnostics in the Brush-Commutator Assembly of a Direct Current Electric Motor. Energies 2024, 17, 17. [Google Scholar] [CrossRef]
- Filina, O.; Vakhitov, K.; Starodubets, A.; Salnikova, O. Vibration Diagnostics of the Brush-Collector Assembly, as Means of Assessing. In Proceedings of the 2022 4th International Youth Conference on Radio Electronics, Electrical and Power Engineering (REEPE), Moscow, Russia, 17–19 March 2022; pp. 1–5. [Google Scholar] [CrossRef]
- Steele, M.E.; Ashen, R.A.; Knight, L.G. An electrical method for condition monitoring of motors. In Proceedings of the 1982 IEE International Conference on Electrical Machines, Design and Application, London, UK, 13–15 July 1982; pp. 231–235. [Google Scholar]
- Treanor, M.P.; Kliman, G.B.; Marietta, M. Incipient fault detection in locomotive DC traction motors. In Proceedings of the 49th Meeting of the Society for Machinery Failure Prevention Technology, Virginia Beach, VA, USA, 18–20 April 1995; pp. 221–230. Available online: https://apps.dtic.mil/sti/tr/pdf/ADA295371.pdf (accessed on 29 June 2024).
- Belkacemi, B.; Saad, S.; Ghemari, Z.; Zaamouche, F.; Khazzane, A. Detection of induction motor improper bearing lubrication by discrete wavelet transforms (DWT) decomposition. Instrum. Mes. Metrol. 2020, 19, 347–354. [Google Scholar] [CrossRef]
- Antonino-Daviu, J. Electrical monitoring under transient conditions: A new paradigm in electric motors predictive maintenance. Appl. Sci. 2020, 10, 6137. [Google Scholar] [CrossRef]
- Bouzida, A.; Touhami, O.; Ibtiouen, R.; Belouchrani, A.; Fadel, M.; Rezzoug, A. Fault Diagnosis in Industrial Induction Machines Through Discrete Wavelet Transform. IEEE Trans. Ind. Electron. 2011, 58, 4385–4395. [Google Scholar] [CrossRef]
- Chen, H.; Chen, Y.; Sun, S.; Hu, Y.; Feng, J. A High-Precision Time-Frequency Entropy Based on Synchrosqueezing Generalized S-Transform Applied in Reservoir Detection. Entropy 2018, 20, 428. [Google Scholar] [CrossRef] [PubMed]
- An, Q.-T.; Sun, L.; Sun, L.-Z. Current Residual Vector-Based Open-Switch Fault Diagnosis of Inverters in PMSM Drive Systems. IEEE Trans. Power Electron. 2015, 30, 2814–2827. [Google Scholar] [CrossRef]
- Burriel-Valencia, J.; Puche-Panadero, R.; Martinez-Roman, J.; Sapena-Bano, A.; Pineda-Sanchez, M. Fault Diagnosis of Induction Machines in a Transient Regime Using Current Sensors with an Optimized Slepian Window. Sensors 2018, 18, 146. [Google Scholar] [CrossRef] [PubMed]
- Biot-Monterde, V.; Navarro-Navarro, Á.; Antonino-Daviu, J.A.; Razik, H. Stray Flux Analysis for the Detection and Severity Categorization of Rotor Failures in Induction Machines Driven by Soft-Starters. Energies 2021, 14, 5757. [Google Scholar] [CrossRef]
- Salem, S.B.; Salah, M.; Touti, W.; Bacha, K.; Chaari, A. Stray Flux analysis for monitoring eccentricity faults in induction motors: Experimental study. In Proceedings of the 2017 International Conference on Control, Automation and Diagnosis (ICCAD), Hammamet, Tunisia, 19–21 January 2017; pp. 292–297. [Google Scholar] [CrossRef]
- Romary, R.; Pusca, R.; Lecointe, J.P.; Brudny, J.F. Electrical machines fault diagnosis by stray flux analysis. In Proceedings of the 2013 IEEE Workshop on Electrical Machines Design, Control and Diagnosis (WEMDCD), Paris, France, 11–12 March 2013; pp. 247–256. [Google Scholar] [CrossRef]
- Zaman, S.M.K.; Marma, H.U.M.; Liang, X. Broken Rotor Bar Fault Diagnosis for Induction Motors Using Power Spectral Density and Complex Continuous Wavelet Transform Methods. In Proceedings of the 2019 IEEE Canadian Conference of Electrical and Computer Engineering (CCECE), Edmonton, AB, Canada, 5–8 May 2019; pp. 1–4. [Google Scholar] [CrossRef]
- Łuczak, D. Machine Fault Diagnosis through Vibration Analysis: Continuous Wavelet Transform with Complex Morlet Wavelet and Time–Frequency RGB Image Recognition via Convolutional Neural Network. Electronics 2024, 13, 452. [Google Scholar] [CrossRef]
- Stockwell, R.G.; Mansinha, L.; Lowe, R.P. Localization of the complex spectrum: The S transform. IEEE Trans. Signal Process. 1996, 44, 998–1001. [Google Scholar] [CrossRef]
- Irhoumah, M.; Pusca, R.; Lefevre, E.; Mercier, D.; Romary, R. Adapted coil sensors for measuring the external magnetic field of electrical machines. In Proceedings of the 6th International Conference on Engineering & MIS 2020, Almaty, Kazakhstan, 14–16 September 2020; pp. 1–7. [Google Scholar]
- Fraile Mora, J. Máquinas Eléctricas, 5th ed. 2003. Available online: https://frrq.cvg.utn.edu.ar/pluginfile.php/20763/mod_resource/content/1/Maquinas_Electricas_Fraile%20Mora_5Ed.pdf (accessed on 30 June 2024).
- Morita, N.; Ueno, T.; Otaka, T.; Arata, M. Comparison of brush dynamic operation characteristics for turbine generator steel collector ring. In Proceedings of the Electrical Contacts—2007 Proceedings of the 53rd IEEE Holm Conference on Electrical Contacts, Pittsburgh, PA, USA, 16–19 September 2007; IEEE: Piscataway, NJ, USA, 2007; pp. 205–210. [Google Scholar] [CrossRef]
- Aguayo-Tapia, S.; Avalos-Almazan, G.; Rangel-Magdaleno, J.d.J. Entropy-Based Methods for Motor Fault Detection: A Review. Entropy 2024, 26, 299. [Google Scholar] [CrossRef] [PubMed]


| Power (kW) | 1.1 |
| Main Frequency (Hz) | 50 |
| Voltage (V) | 400 |
| Current (A) | 2.4 |
| Speed (rpm) | 1440 |
| Connection | Star |
| Number of Pole Pairs | 2 |
| Power (kW) | 3 |
| Main Frequency (Hz) | 50 |
| Voltage (V) | 220 |
| Excitation Current (A) | 0.4 |
| Armature Current (A) | 13.6 |
| Speed (rpm) | 2000 |
| Commutator Segments () | 96 |
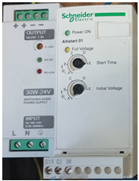 | Manufacturer | Schneider (Germany) |
| Model | ATS01N109FT | |
| Main Frequency (Hz) | 50 | |
| Voltage (V) | 400 | |
| Power(kW) | 4 | |
| Max. Current(A) | 9.0 | |
| Phases Control | 1 | |
| Voltage ramp (s) | 1–5 |
Disclaimer/Publisher’s Note: The statements, opinions and data contained in all publications are solely those of the individual author(s) and contributor(s) and not of MDPI and/or the editor(s). MDPI and/or the editor(s) disclaim responsibility for any injury to people or property resulting from any ideas, methods, instructions or products referred to in the content. |
© 2024 by the authors. Licensee MDPI, Basel, Switzerland. This article is an open access article distributed under the terms and conditions of the Creative Commons Attribution (CC BY) license (https://creativecommons.org/licenses/by/4.0/).
Share and Cite
Salas-Robles, J.E.; Biot-Monterde, V.; Antonino-Daviu, J.A. Current and Stray Flux Combined Analysis for Sparking Detection in DC Motors/Generators Using Shannon Entropy. Entropy 2024, 26, 744. https://doi.org/10.3390/e26090744
Salas-Robles JE, Biot-Monterde V, Antonino-Daviu JA. Current and Stray Flux Combined Analysis for Sparking Detection in DC Motors/Generators Using Shannon Entropy. Entropy. 2024; 26(9):744. https://doi.org/10.3390/e26090744
Chicago/Turabian StyleSalas-Robles, Jorge E., Vicente Biot-Monterde, and Jose A. Antonino-Daviu. 2024. "Current and Stray Flux Combined Analysis for Sparking Detection in DC Motors/Generators Using Shannon Entropy" Entropy 26, no. 9: 744. https://doi.org/10.3390/e26090744