
Systematic Configurator for Complexity Management in Manufacturing Systems

 , , , and
Abstract
:1. Introduction
- (1)
- To present a method for complexity management in manufacturing systems, which allows the identification of the effects, solution strategies and improvement methods from a Lean Production and Industry 4.0 approach.
- (2)
- To provide a systematic configurator that allows the measurement of complexity in the different administrative stages, consistent with modern methods.
- (3)
- To provide a new mechanism for measuring complexity in an entropic way for manufacturing systems, based on questionnaire-type instruments.
2. Literature Review
3. Materials and Methods
4. Configurator for Complexity Management
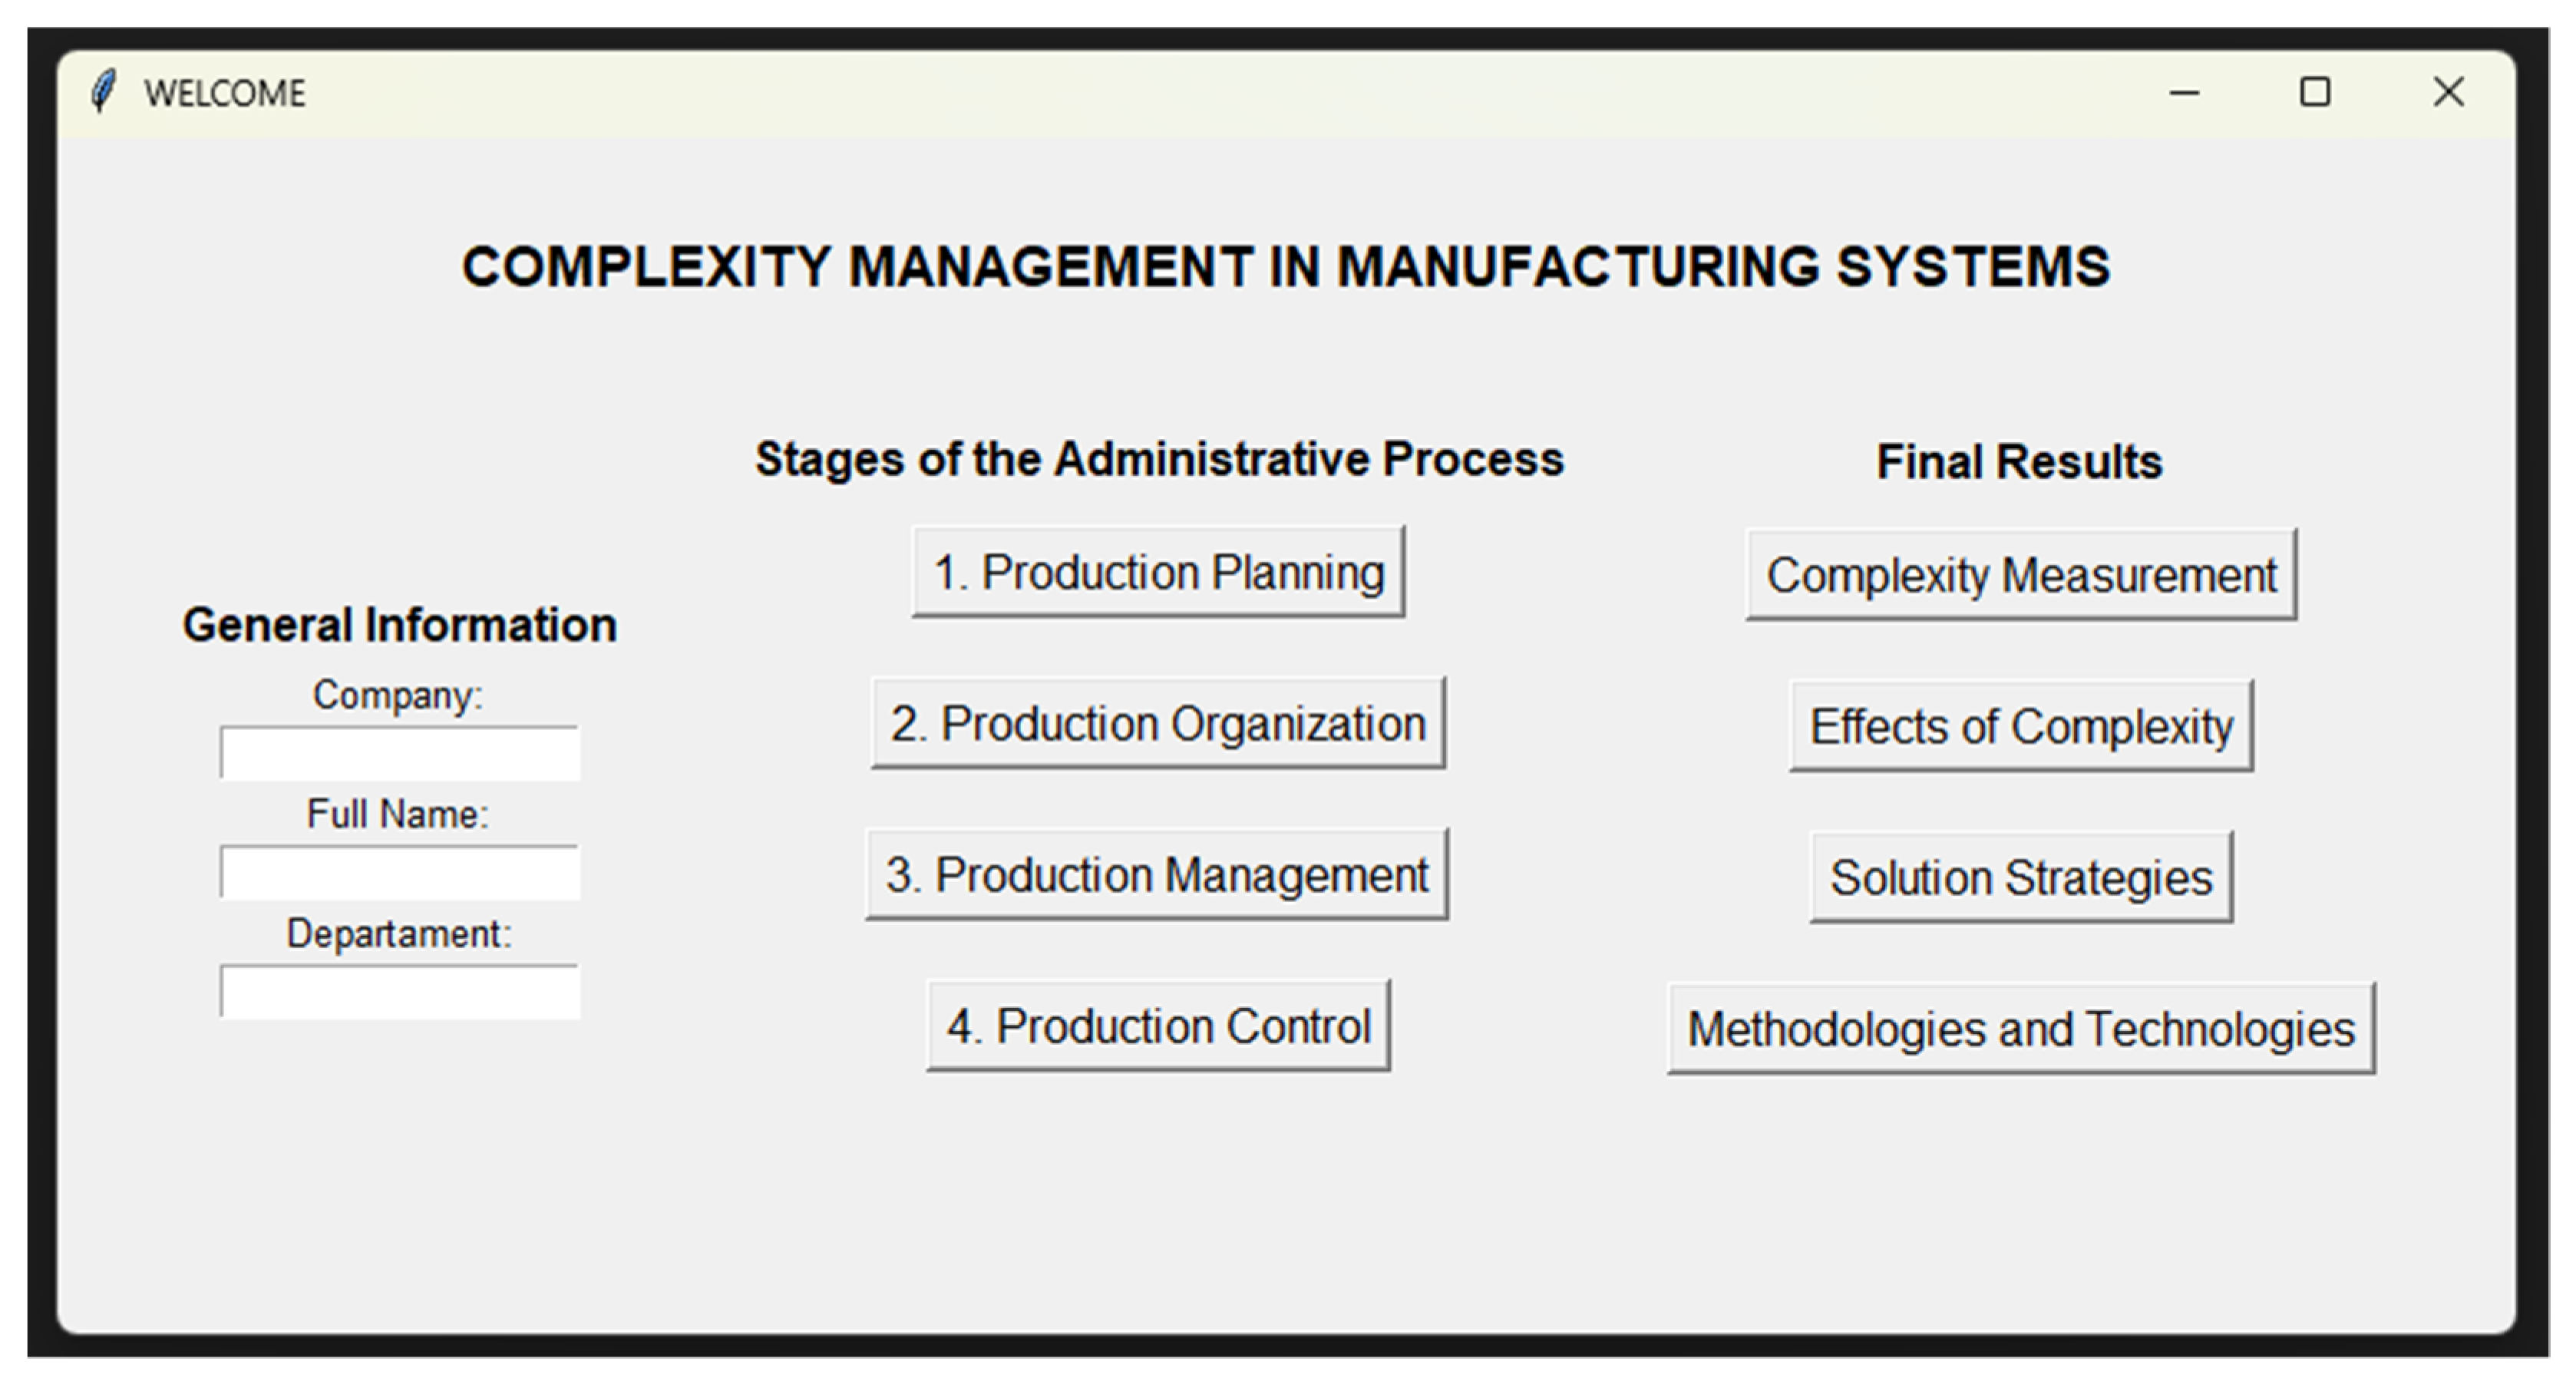
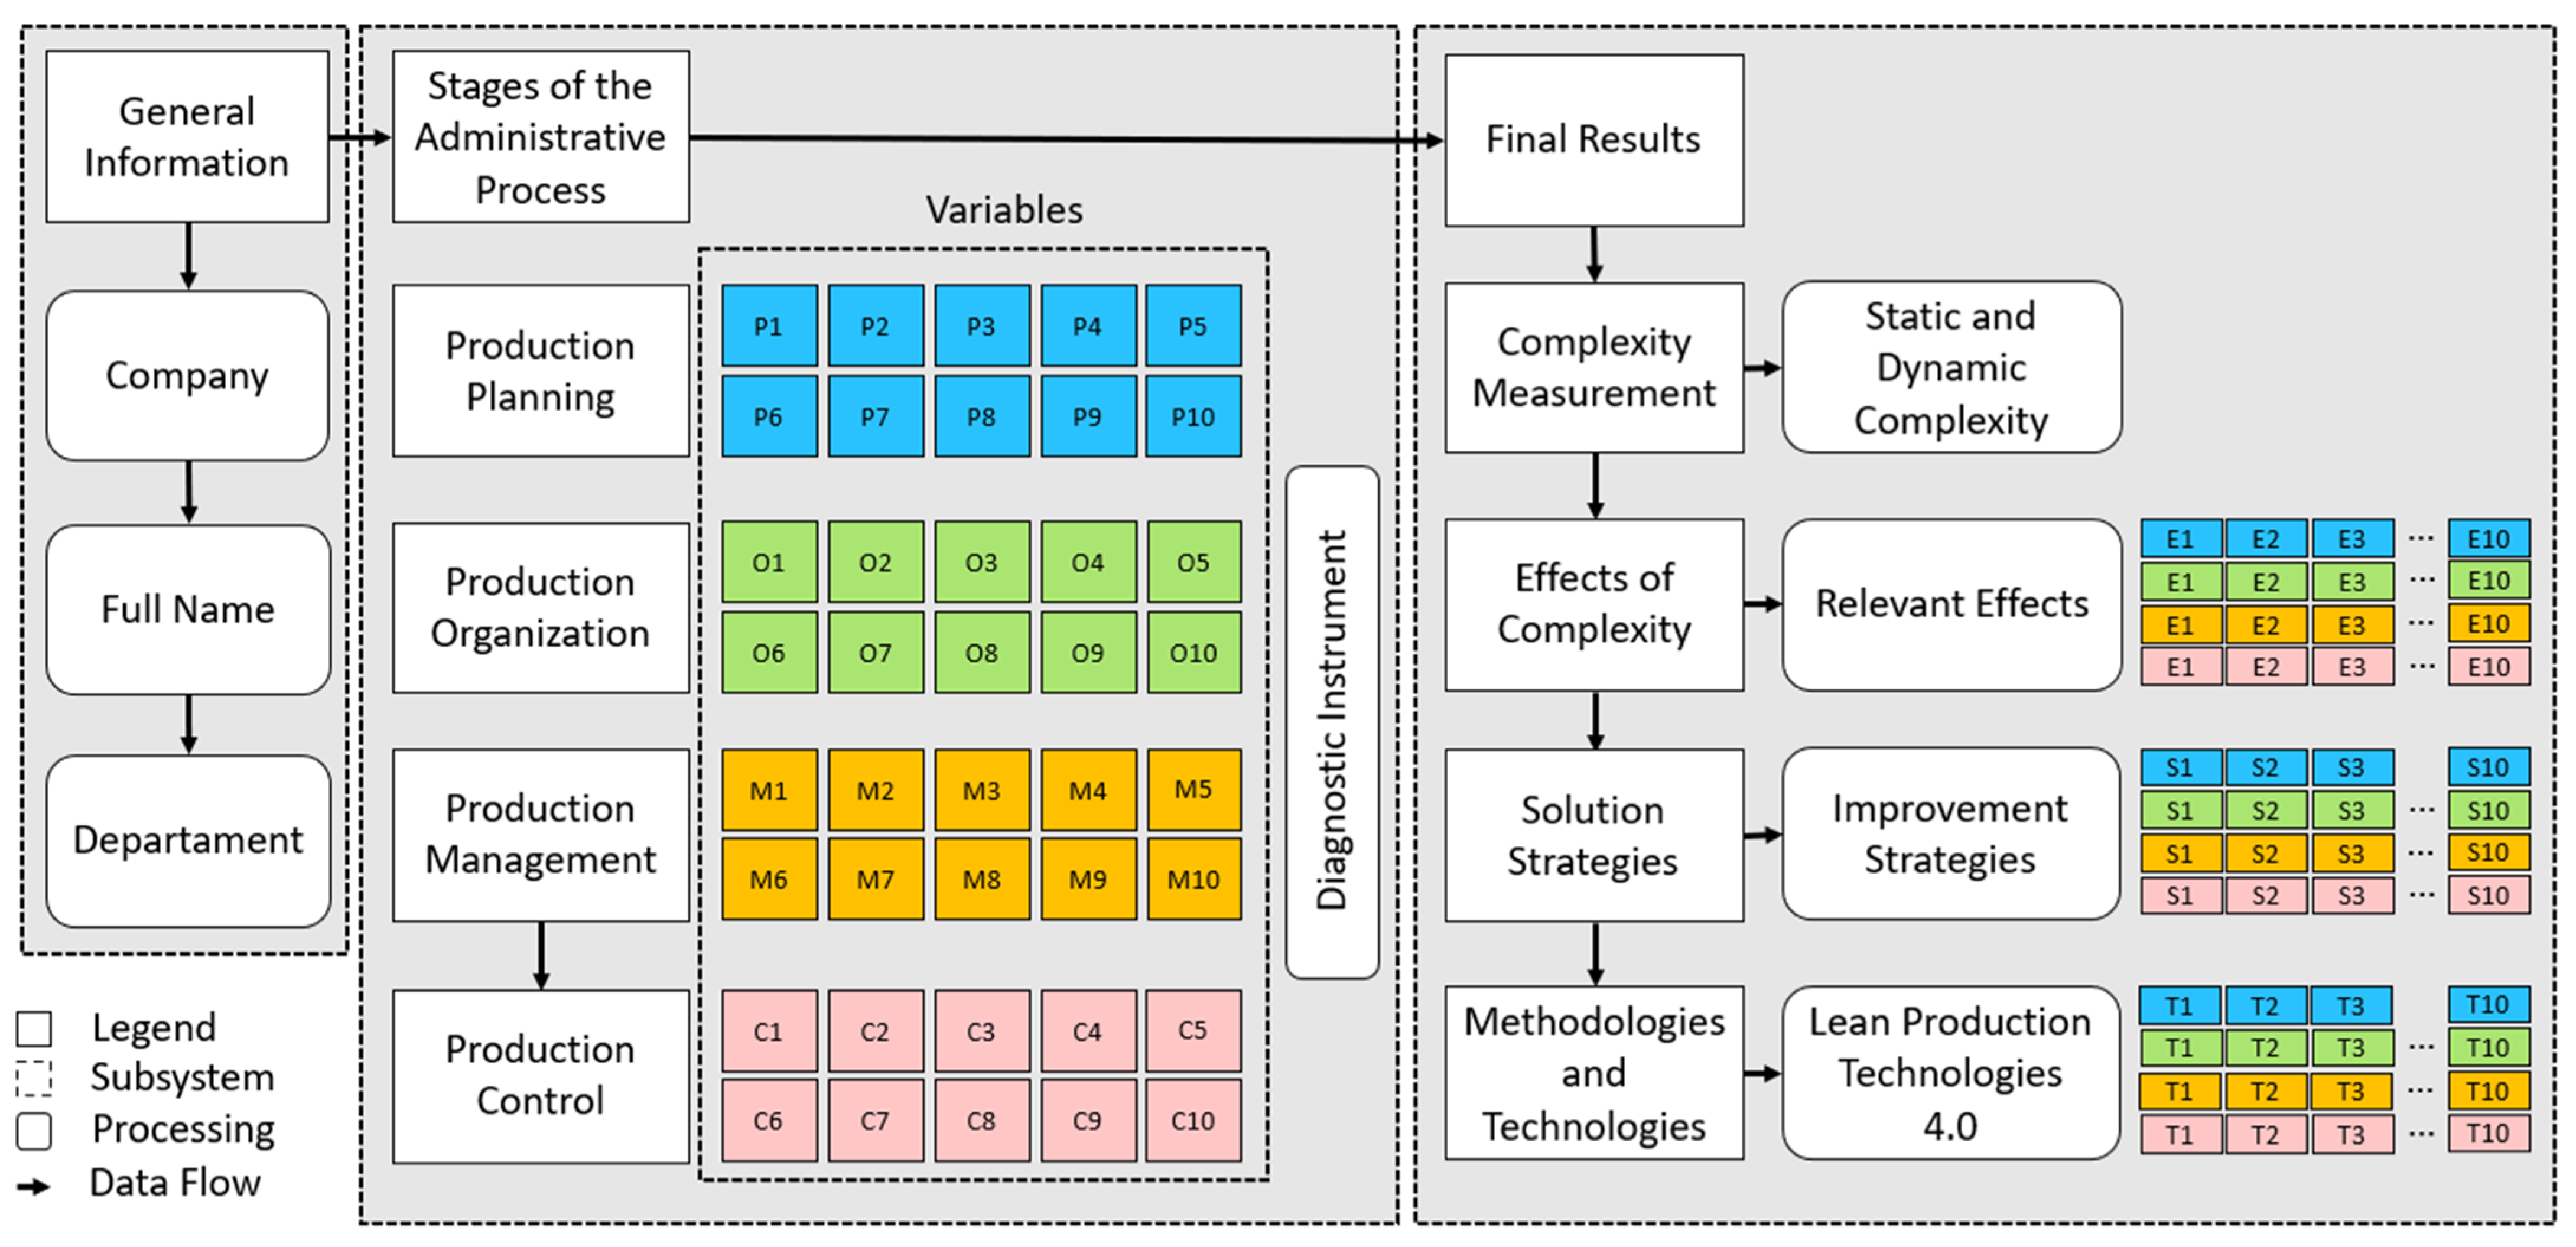
4.1. General Information
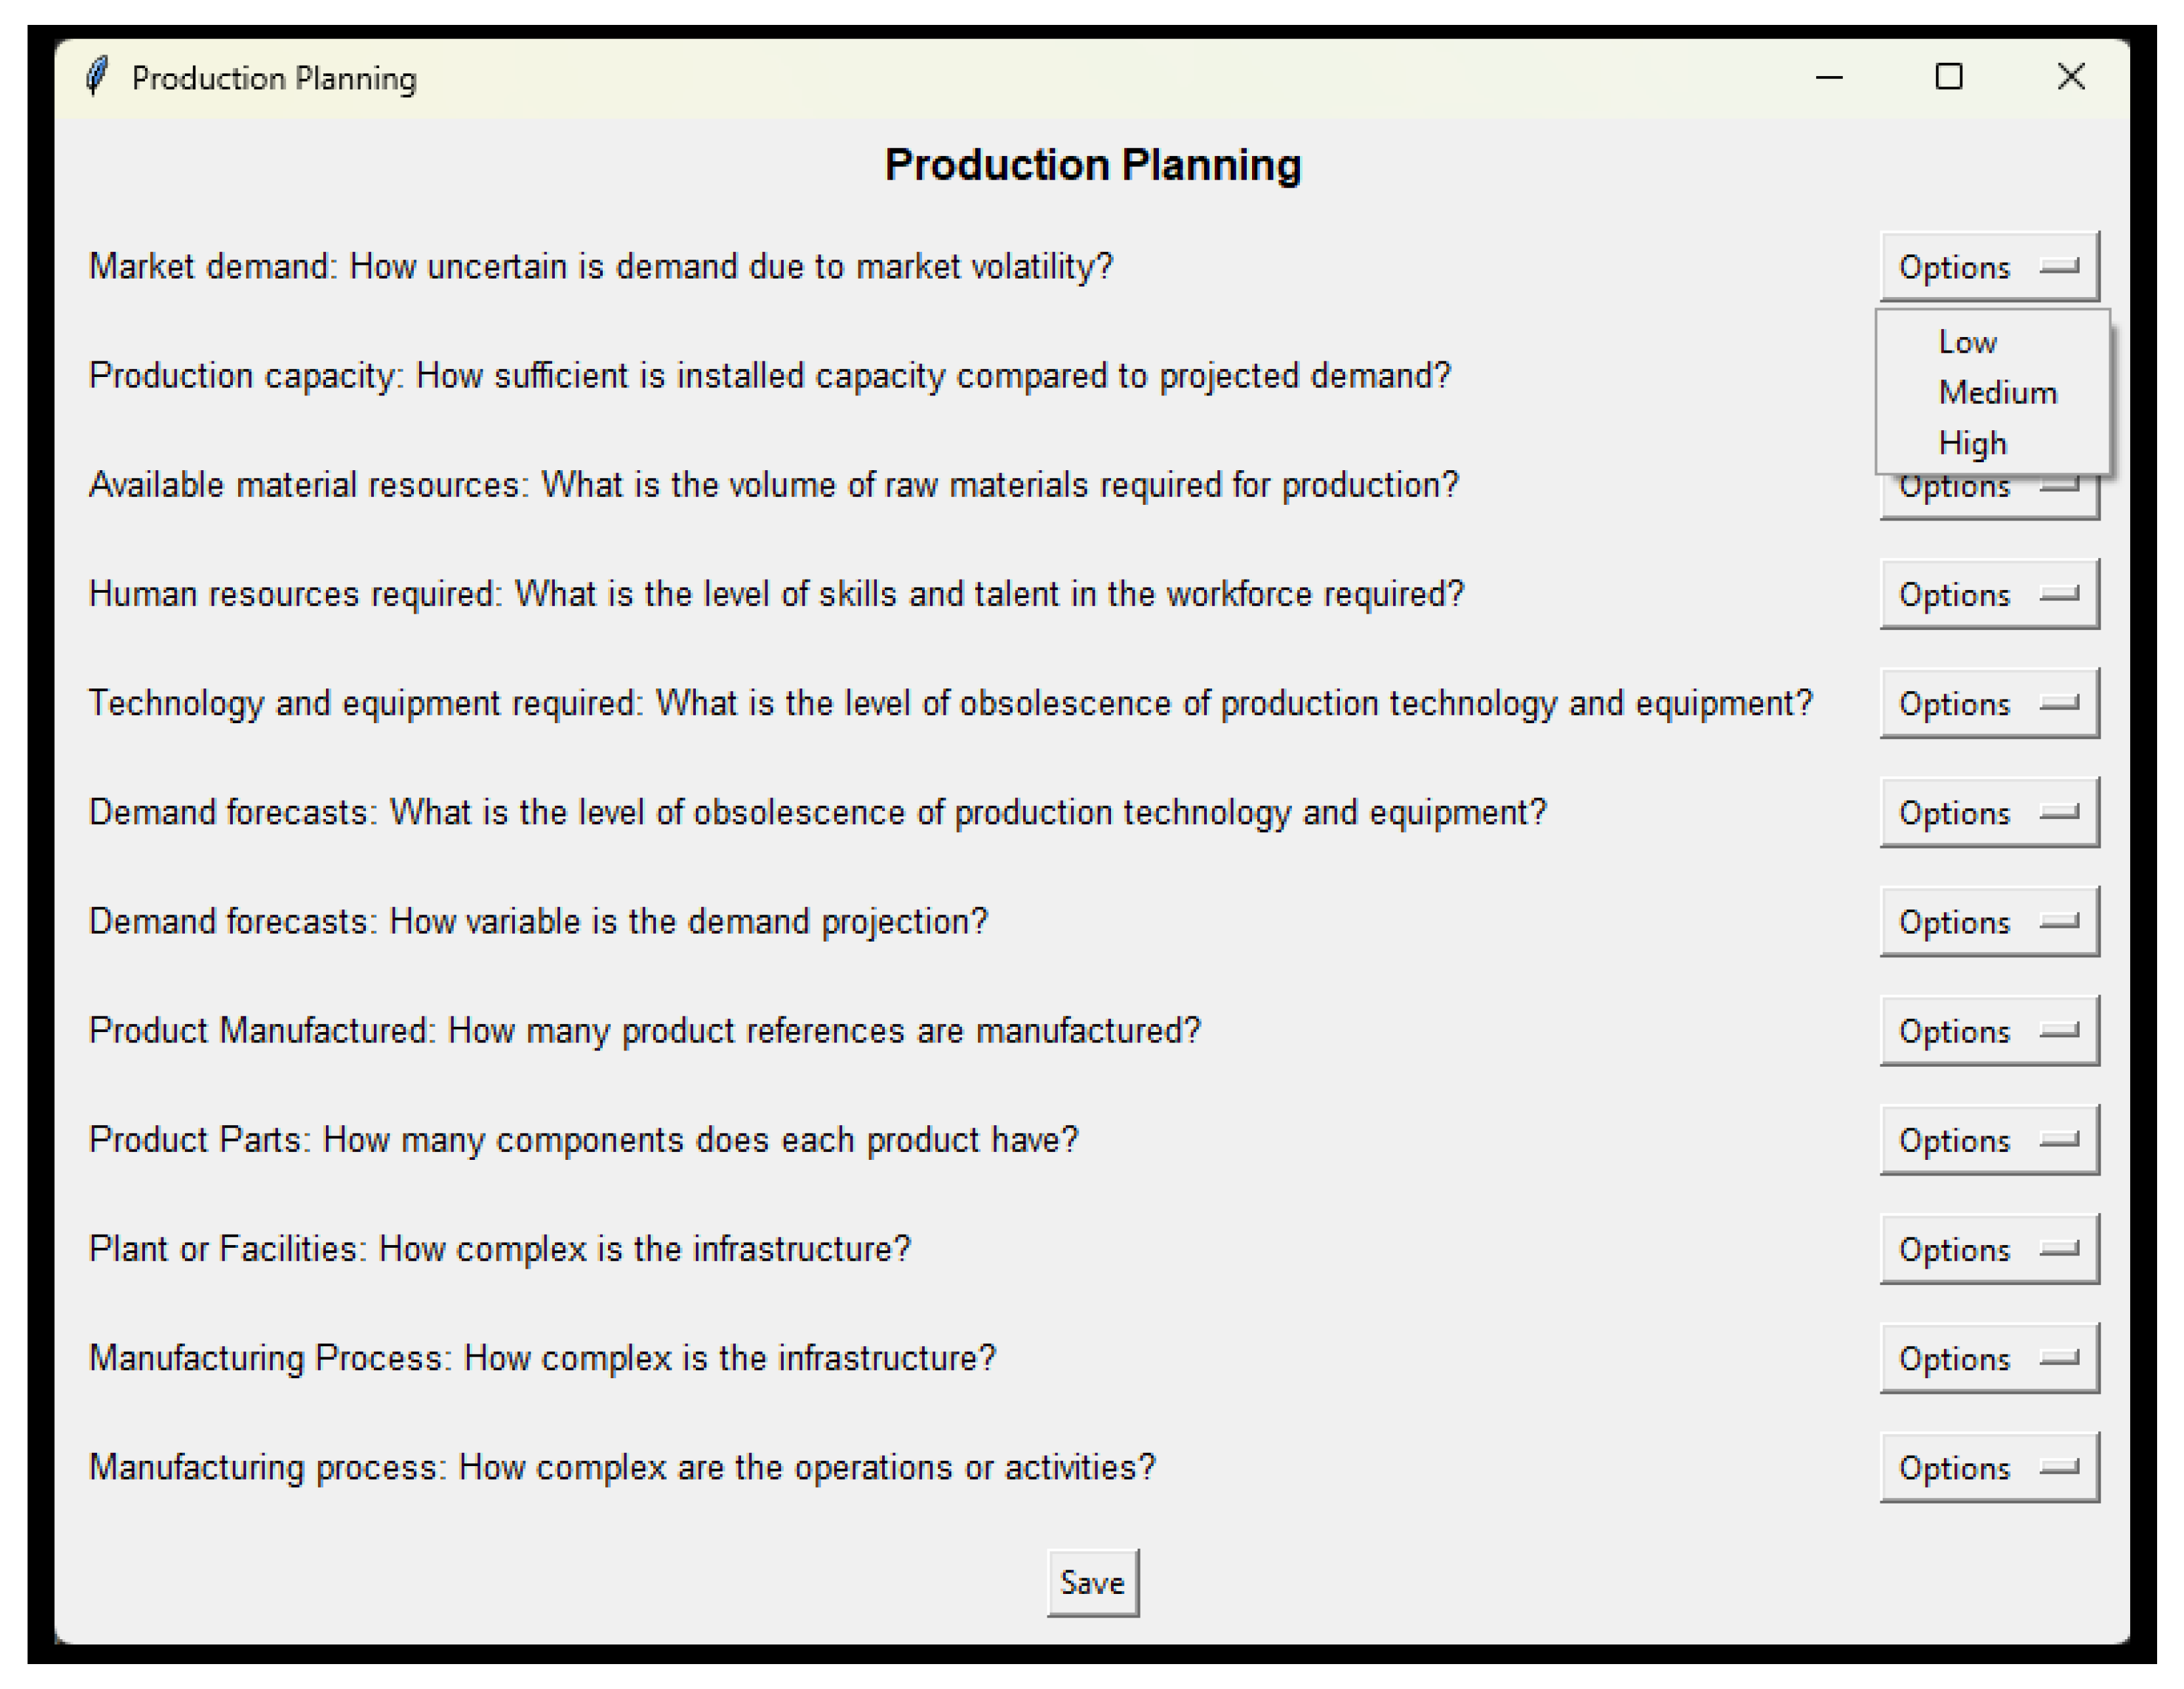
4.2. Stages in the Administrative Process
4.3. Final Results
4.3.1. Complexity Measurement
- P: Probability in the control state.
- (1 − P): Probability in out-of-control state.
- Pij: Probability of resource i, i = 1, … , M being in state j, j = 1, … , N.
- dij: Absolute deviation from the expected results for the condition.
- Wij: Weighting of each interval.
- M: Number of resources.
- N: Number of possible states.
4.3.2. Effects of Complexity
4.3.3. Solution Strategies
4.3.4. Improvement Methodologies and Technologies
4.4. Validation of the Configurator
4.5. Hypothesis
“Implementing a systematic configurator that optimizes resource and frequency allocation, balancing structural stability and operational adaptability, can reduce both static and dynamic complexity at critical production stages, improving overall system efficiency and mitigating risks associated with operational fluctuations and instabilities”.
5. Results
- Stage Production planning and control
- Number of intervals (K) = 3
- Ordinal sum of the intervals = (1 + 2 + 3) = 6
- Interval 1 = 1/6 = 0.17
- Interval 2 = 2/6 = 0.33
- Interval 3 = 3/6 = 0.50
- Stage Production organization and management
- Weighting for each of the intervals
- Number of intervals (K) = 2
- Ordinal sum of the intervals = (1 + 2) = 3
- Interval 1 = 1/3 = 0.33
- Range 2 = 2/3 = 0.67
- The measure of range (R) or range of the variable is calculated, taking into account the difference between the maximum value and the minimum value of the data and the amplitude of each interval by dividing the total range by the desired number of intervals. The results are presented below:
- Range or range of the variable
- Range (R) = Maximum value − Minimum value
- Range (R) = 4 − 0
- Range (R) = 4
- Amplitude of each interval
- Amplitude (C) = Range (R)/Intervals (K)
- Amplitude (C) = 4/3 = 1.333
- Amplitude (C) = 4/2 = 2.000
- Consequently, the absolute deviations data are classified within the intervals denoted as frequencies and the probabilities (Pij) are calculated. In turn, the average deviation of the expected value (dij) is calculated as shown below:
- Stage Production Planning
- Frequency (interval 1) = 5
- Frequency (interval 2) = 2
- Frequency (interval 3) = 3
- Total frequency = 10
- Pij (interval 1) = 5/10 = 0.5
- Pij (interval 2) = 2/10 = 0.2
- Pij (interval 3) = 3/10 = 0.3
- dij (interval 1) = (0 + 0 + 0 + 0 + 0 + 0 + 0)/5 = 0
- dij (interval 2) = (2 + 2)/2 = 2
- dij (interval 3) = (4 + 4 + 4)/3 = 4
- Static (interval 1) = −(0.500*0.17*0)*[Log2(0.500)] = 0.000
- Static (interval 2) = −(0.200*0.33*2)*[Log2(0.200)] = 0.310
- Static (interval 3) = −(0.300*0.50*4)*[Log2(0.300)] = 1.042
- Dynamic (interval 1) = −(1 – 0.500)*Log2(0.500)*(0.500*0.17*0) = 0.000
- Dynamic (interval 2) = −1 – 0.200)*Log2(0.200)*(0.200*0.33*2) = 0.155
- Dynamic (interval 3) = −(1 – 0.300)*Log2(0.300)*(0.300*0.50*4) = 0.521
6. Discussion
7. Conclusions
Author Contributions
Funding
Institutional Review Board Statement
Data Availability Statement
Acknowledgments
Conflicts of Interest
References
- Jawabreh, O.; Jahmani, A.; Maaiah, B.; Basel, A. Evaluation of the Contents of the Five Stars Hotel Website and Customer Orientation. Inf. Sci. Lett. 2022, 11, 1077–1085. [Google Scholar] [CrossRef]
- Shniekat, N.; Jawabreh, O.; Saleh, M.M.A. Efficiency and effect on the competitive advantage of management information systems (MIS) in classified hotels in the city of petra; type of management as moderator. Acad. Strateg. Manag. J. 2021, 20, 1–18. [Google Scholar]
- Wu, Y.; Frizelle, G.; Ayral, L.; Marsein, J.; Van de Merwe, E.; Zhou, D. A simulation study on supply chain complexity in manufacturing industry. In Proceedings of the Conference of the Manufacturing Complexity Network; University of Cambridge: Cambridge, UK, 2002. [Google Scholar]
- Efthymiou, K.; Mourtzis, D.; Pagoropoulos, A.; Papakostas, N.; Chryssolouris, G. Manufacturing systems complexity analysis methods review. Int. J. Comput. Integr. Manuf. 2016, 29, 1025–1044. [Google Scholar] [CrossRef]
- Vidal, G.H.; Hernández, J.R.C. Complexity in manufacturing systems: A literature review. Prod. Eng. 2021, 15, 321–333. [Google Scholar] [CrossRef]
- Schuh, G. Produktkomplexität Managen: Strategien-Methoden-Tools; Carl Hanser Verlag GmbH Co., KG: Munich, Germany, 2014. [Google Scholar]
- Tamaskar, S.; Neema, K.; DeLaurentis, D. Framework for measuring complexity of aerospace systems. Res. Eng. Des. 2014, 25, 125–137. [Google Scholar] [CrossRef]
- Chryssolouris, G.; Efthymiou, K.; Papakostas, N.; Mourtzis, D.; Pagoropoulos, A. Flexibility and complexity: Is it a trade-off? Int. J. Prod. Res. 2013, 51, 6788–6802. [Google Scholar] [CrossRef]
- Schuh, G.; Gartzen, T.; Wagner, J. Complexity-oriented ramp-up of assembly systems. CIRP J. Manuf. Sci. Technol. 2015, 10, 1–15. [Google Scholar] [CrossRef]
- ElMaraghy, W.; ElMaraghy, H.; Tomiyama, T.; Monostori, L. Complexity in engineering design and manufacturing. CIRP Ann. 2012, 61, 793–814. [Google Scholar] [CrossRef]
- Child, P.; Diederichs, R.; Sanders, F.H.; Wisniowski, S. SMR forum: The management of complexity. MIT Sloan Manag. Rev. 1991, 33, 73. [Google Scholar]
- Bick, W.; Drexl-Wittbecker, S. Komplexität Reduzieren: Konzept, Methoden, Praxis; LOG_X: Stuttgart, Germany, 2008. [Google Scholar]
- Hagström, M.H.; Bergsjö, D. A proposed framework using systems engineering to design human-centric manufacturing systems for novel products to reduce complexity and risk. Proc. Des. Soc. 2024, 4, 2595–2604. [Google Scholar] [CrossRef]
- Efthymiou, K.; Pagoropoulos, A.; Papakostas, N.; Mourtzis, D.; Chryssolouris, G. Manufacturing systems complexity: An assessment of manufacturing performance indicators unpredictability. CIRP J. Manuf. Sci.Technol. 2014, 7, 324–334. [Google Scholar]
- Sridhar, B.; Sheth, K.S.; Grabbe, S. Airspace complexity and its application in air traffic management. In 2nd USA/Europe Air Traffic Management R&D Seminar; Federal Aviation Administration: Washington, DC, USA, 1998; pp. 1–6. [Google Scholar]
- Felgen, L.; Deubzer, F.; Lindemann, U. Complexity management during the analysis of mechatronic systems. In Proceedings of the DS 35: Proceedings ICED 05, the 15th International Conference on Engineering Design, Melbourne, Australia, 15–18 August 2005; Engineers Australia: Barton, ACT, Australia, 2005. [Google Scholar]
- Ahmadinejad, A.; Afshar, A. Complexity management in mechatronic product development based on structural criteria. In Proceedings of the 2011 IEEE International Conference on Mechatronics, Istanbul, Turkey, 13–15 April 2011; IEEE: Piscataway, NJ, USA, 2011; pp. 7–12. [Google Scholar] [CrossRef]
- Dong, Y.; Momin, S. Complexity Management for Vehicle Electrical/Electronic Architecture Design. U.S. Patent No. 8,060,347, 15 November 2011. [Google Scholar]
- Botchkarev, A.; Finnigan, P. Complexity in the Context of Systems Approach to Project Management. arXiv 2014, arXiv:1412.1027. [Google Scholar] [CrossRef]
- Oehmen, J.; Thuesen, C.; Parraguez, P.; Geraldi, J. Complexity Management for Projects, Programmes, and Portfolios: An Engineering Systems Perspective; PMI: Pennsylvania, PA, USA, 2015. [Google Scholar]
- Cristóbal, J.S. Complexity in Project Management. Procedia Comput. Sci. 2017, 121, 762–766. [Google Scholar] [CrossRef]
- Hansen, Z.N.L.; Haug, A.; Afandi, S.; Hvam, L. Complexity management in project organisations. Prod. Eng. 2021, 15, 361–370. [Google Scholar] [CrossRef]
- Morcov, S.; Pintelon, L.; Kusters, R.J. A Framework for IT Project Complexity Management. In Proceedings of the IADIS International Conference Information Systems, virtually, 3–5 March 2021; IADIS Press: Lisbon, Portugal; pp. 61–68. [Google Scholar]
- Velte, C.J.; Steinhilper, R. Complexity in a circular economy: A need for rethinking complexity management strategies. In Proceedings of the World Congress on Engineering, London, UK, 29 June–1 July 2016. [Google Scholar]
- Salehi, A. Complexity Management in Large Construction Projects: Identifying Factors and Variables. Uluslararası Yönetim Akad. Derg. 2022, 5, 483–498. [Google Scholar] [CrossRef]
- Kermanshachi, S.; Nipa, T.J.; Dao, B. Development of complexity management strategies for construction projects. J. Eng. Des. Technol. 2023, 21, 1633–1657. [Google Scholar] [CrossRef]
- Arista, R.; Zheng, X.; Lu, J.; Mas, F. An Ontology-based Engineering system to support aircraft manufacturing system design. J. Manuf. Syst. 2023, 68, 270–288. [Google Scholar] [CrossRef]
- Alkan, B.; Vera, D.A.; Ahmad, M.; Ahmad, B.; Harrison, R. Complexity in manufacturing systems and its measures: A literature review. Eur. J. Ind. Eng. 2018, 12, 116–150. [Google Scholar] [CrossRef]
- Stark, R.; Kind, S.; Neumeyer, S. Innovations in digital modelling for next generation manufacturing system design. CIRP Ann. 2017, 66, 169–172. [Google Scholar] [CrossRef]
- Christ, Q.; Dauzère-Pérès, S.; Lepelletier, G. A three-step approach for decision support in operational production planning of complex manufacturing systems. Int. J. Prod. Res. 2023, 61, 5860–5885. [Google Scholar] [CrossRef]
- Magnanini, M.C.; Mastrangelo, M.; Tolio, T.A. Hybrid digital modelling of large manufacturing systems to support continuous evolution. CIRP Ann. 2022, 71, 389–392. [Google Scholar] [CrossRef]
- May, M.C.; Kiefer, L.; Frey, A.; Duffie, N.A.; Lanza, G. Solving sustainable aggregate production planning with model predictive control. CIRP Ann. 2023, 72, 421–424. [Google Scholar] [CrossRef]
- Magnanini, M.C.; Melnychuk, O.; Yemane, A.; Strandberg, H.; Ricondo, I.; Borzi, G.; Colledani, M. A Digital Twin-based approach for multi-objective optimization of short-term production planning. IFAC-PapersOnLine 2021, 54, 140–145. [Google Scholar] [CrossRef]
- Vidal, G.H.; Hernández, J.R.C. Study of the effects of complexity on the manufacturing sector. Prod. Eng. 2021, 15, 69–78. [Google Scholar] [CrossRef]
- Vidal, G.H.; Hernández, J.R.C.; Minnaard, C.; Gatica, G.; Schwarzenberg, P. Statistical analysis of manufacturing system complexity. Int. J. Adv. Manuf. Technol. 2022, 120, 3427–3436. [Google Scholar] [CrossRef]
- Vidal, G.H.; Coronado-Hernández, J.R.; Minnaard, C. Measuring manufacturing system complexity: A literature review. J. Intell. Manuf. 2023, 34, 2865–2888. [Google Scholar] [CrossRef]
- Vidal, G.H.; Hernández, J.R.C.; Minnaard, C. Modeling and statistical analysis of complexity in manufacturing systems under flow shop and hybrid environments. Int. J. Adv. Manuf. Technol. 2021, 118, 3049–3058. [Google Scholar] [CrossRef]
- Vidal, G.H.; Coronado-Hernández, J.R.; Niebles, A.C.P. Conceptual model for measuring complexity in manufacturing systems. In Proceedings of the Third International Conference on Sustainable Computing: SUSCOM 2021, Jaipur, India, 19–20 March 2021; Springer: Singapore, 2022; pp. 181–189. [Google Scholar] [CrossRef]
- Vidal, G.H.; Coronado-Hernández, J.R.; González, G.G. Evaluation and analysis of models for the measurement of complexity in manufacturing systems. In Proceedings of the Third International Conference on Sustainable Computing: SUSCOM 2021, Jaipur, India, 19–20 March 2021; Springer: Singapore, 2022; pp. 469–477. [Google Scholar] [CrossRef]
- Vidal, G.H.; Hernández, J.R.C.; Minnaard, C. A new perspective on measuring entropic complexity in manufacturing systems. Int. J. Interact. Des. Manuf. (IJIDeM) 2024, 18, 191–201. [Google Scholar] [CrossRef]
- Vidal, G.H.; Hernández, J.R.C.; Minnaard, C. Measuring complexity in manufacturing systems: A new metric in flow shop (Fs) and job shop (Js) environments. Prod. Eng. 2024, 18, 653–665. [Google Scholar] [CrossRef]
- Vidal, G.H.; Hernández, J.R.C.; Minnaard, C.; Hernández, O.E.C. Mejora De La Complejidad Estática En Sistemas De Fabricación: Bajo El Problema De Tamaño De Lote Económico (Elsp) Y Troquel De Intercambio De Un Solo Minuto (Smed) Acercarse. Investig. Oper. 2024, 45, 3. Available online: https://rev-inv-ope.pantheonsorbonne.fr/sites/default/files/inline-files/45324-07.pdf (accessed on 20 August 2024).
- Modrak, V.; Marton, D.; Bednar, S. The influence of mass customization strategy on configuration complexity of assembly systems. Procedia CIRP 2015, 33, 538–543. [Google Scholar] [CrossRef]
- Herrera Vidal, G.; Coronado Hernández, J.R. Un análisis bibliométrico de la complejidad en sistemas de manufactura y la industria 4.0. In Gestión del Conocimiento. Perspectiva Multidisciplinaria (Libro 65); Universidad Nacional Experimental Sur del Lago: Santa Bárbara del Zulia, Venezuela, 2023; Available online: https://unesur.edu.ve/libros-2/download/25-gestion-del-conocimiento-perspectiva-multidisciplinaria-libro-65/361-capitulo-7-un-analisis-bibliometrico-de-la-complejidad-en-sistemas-de-manufactura-y-la-industria-4-0 (accessed on 20 August 2024).
- Cortés, C.B.Y.; Landeta, J.M.I.; Chacón, J.G.B.; Pereyra, F.A.; Osorio, M.L. El entorno de la industria 4.0: Implicaciones y perspectivas futuras. Concienc. Tecnológica 2017. [Google Scholar] [CrossRef]
- Castillo, M. El Estado de la Manufactura Avanzada: Competencia Entre las Plataformas de la Internet Industrial. 2017. Available online: https://repositorio.cepal.org/entities/publication/fc9d6752-6613-409f-ab1b-f96f82d71241 (accessed on 20 August 2024).
- Cambridge Dictionary. Definition of Complex. 2024. Available online: https://dictionary.cambridge.org (accessed on 20 August 2024).
- Oxford Advanced Learner’s Dictionary. Complexity Noun—Definition, Pictures, Pronunciation and Usage Notes|Oxford Advanced Learner’s Dictionary at OxfordLearnersDictionaries.com. 2024. Available online: https://www.oxfordlearnersdictionaries.com/definition/english/complexity?q=complexity (accessed on 20 August 2024).
- Ladyman, J.; Lambert, J.; Wiesner, K. What is a complex system? Eur. J. Philos. Sci. 2013, 3, 33–67. [Google Scholar] [CrossRef]
- Ladyman, J.; Wiesner, K. What Is a Complex System? Yale University Press: New Haven, CT, USA, 2020. [Google Scholar]
- Simon, H. The architecture of complexity. Proc. Am. Philos. Soc. 1962, 106, 467–482. [Google Scholar]
- Ulrich, H.; Probst, G.J. Anleitung Zum Ganzheitlichen Denken und Handeln: Ein Brevier für Führungskräfte; Paul Haupt: Bern, Switzerland, 1988. [Google Scholar]
- Kiir, G.J. Complexity: Some general observations. Syst. Res. 1985, 2, 131–140. [Google Scholar]
- De Rosnay, J. Il Macroscopio: Verso una Visione Globale; Edizioni Dedalo: Bari, Italy, 1977. [Google Scholar]
- Hass, K.B. Managing Complex Projects, Prodevia Learning. 2016. Available online: http://www.prodevia.com (accessed on 20 August 2024).
- Mitchell, M. Complexity: A Guided Tour; Oxford University Press: Oxford, UK, 2009. [Google Scholar]
- Yates, F.E. Complexity and the limits to knowledge. Am. J. Physiol. Integr. Comp. Physiol. 1978, 235, R201–R204. [Google Scholar] [CrossRef] [PubMed]
- Edmonds, B. What is Complexity? The philosophy of complexity per se with application to some examples in evolution. In The Evolution of Complexity; Kluwer: Dordrecht, The Netherlands, 1995; Available online: https://web.mit.edu/16.459/www/Edmonds.pdf (accessed on 10 August 2024).
- Jones, R.E.; Deckro, R.F. The social psychology of project management conflict. Eur. J. Oper. Res. 1993, 64, 216–228. [Google Scholar] [CrossRef]
- ElMaraghy, W.; Urbanic, R. Modelling of Manufacturing Systems Complexity. CIRP Ann. 2003, 52, 363–366. [Google Scholar] [CrossRef]
- Aram, E.; Noble, D. Educating Prospective Managers in the Complexity of Organizational Life. Manag. Learn. 1999, 30, 321–342. [Google Scholar] [CrossRef]
- Isik, F. An entropy-based approach for measuring complexity in supply chains. Int. J. Prod. Res. 2010, 48, 3681–3696. [Google Scholar] [CrossRef]
- Bozarth, C.C.; Warsing, D.P.; Flynn, B.B.; Flynn, E.J. The impact of supply chain complexity on manufacturing plant performance. J. Oper. Manag. 2009, 27, 78–93. [Google Scholar] [CrossRef]
- Frizelle, G.; Woodcock, E. Measuring complexity as an aid to developing operational strategy. Int. J. Oper. Prod. Manag. 1995, 15, 26–39. [Google Scholar] [CrossRef]
- Frizelle, G.D.M. An Entropic Measurement of Complexity in Manufacturing Operations; Department of Engineering: Cambridge, UK, 1996. [Google Scholar]
- Deshmukh, A.V.; Talavage, J.J.; Barash, M.M. Complexity in manufacturing systems, Part 1: Analysis of static complexity. IIE Trans. 1998, 30, 645–655. [Google Scholar] [CrossRef]
- Frizelle, G.; Suhov, Y.M. An entropic measurement of queueing behaviour in a class of manufacturing operations. Proc. R. Soc. A Math. Phys. Eng. Sci. 2001, 457, 1579–1601. [Google Scholar] [CrossRef]
- Serdarasan, S. A review of supply chain complexity drivers. Comput. Ind. Eng. 2013, 66, 533–540. [Google Scholar] [CrossRef]
- Serdarasan, S.; Tanyas, M. Dealing with complexity in the supply chain: The effect of supply chain management initiatives. SSRN Electron. J. 2012, 2056331. [Google Scholar] [CrossRef]
- Surana, A.; Kumara, S.; Greaves, M.; Raghavan, U.N. Supply-chain networks: A complex adaptive systems perspective. Int. J. Prod. Res. 2005, 43, 4235–4265. [Google Scholar] [CrossRef]
- Rose-Anderssen, C.; Baldwin, J.; Ridgway, K. Manufacturing systematics and cladistics: State of the art and generic classification. J. Manuf. Technol. Manag. 2017, 28, 655–685. [Google Scholar] [CrossRef]
- Arredondo Soto, K.C.; Carrillo Gutiérrez, T.; Salazar Ruiz, E.; Solís Quinteros, M. Factores Relevantes De La Complejidad En El Proceso De Remanufactura: Caso De La Industria Metalmecánica. Análisis Simulación 88. Available online: https://libmast.utm.my/Record/doaj.art-f9c6d4e6aa004cceb23a696003802ae3 (accessed on 10 August 2024).
- Li, J.; Meerkov, S. Production Systems Engineering. Springer: Berlin/Heidelberg, Germany, 2009. [Google Scholar] [CrossRef]
- Krajewski, L.J.; Ritzman, L.P.; Malhotra, M.K. Operations Management: Processes and Supply Chains; Pearson: London, UK, 2022. [Google Scholar]
- Jacobs, F.R.; Chase, R.B. Operations and Supply Chain Management; McGraw-Hill: New York, NY, USA, 2018. Singhal, K.; Singhal, J. Imperatives of the science of operations and supply-chain management. J. Oper.Manag. 2012, 30, 237–244. [Google Scholar]
- Fayol, H. General and Industrial Management; Ravenio Books. 2016. Available online: https://www.amazon.com/General-Industrial-Management-Henri-Fayol/dp/1614274592 (accessed on 20 August 2024).
- Drucker, P.F. The Practice of Management; Routledge: London, UK, 2012. [Google Scholar]
- Koontz, H.; O’Donnell, C. Principles Of Management; McGraw-Hill/Irwin: New York, NY, USA, 2008. [Google Scholar]
- Ansoff, H.I. Corporate Strategy: An Analytic Approach to Business Policy for Growth and Expansion; McGraw-Hill: New York, NY, USA, 1965. [Google Scholar]
- Burns, T.; Stalker, G.M. The Management of Innovation; Oxford University Press: Oxford, UK, 1961. [Google Scholar] [CrossRef]
- Lawrence, P.R.; Lorsch, J.W. Differentiation and Integration in Complex Organizations. Adm. Sci. Q. 1967, 12, 1–47. [Google Scholar] [CrossRef]
- Galbraith, J.R. Organization Design: An Information Processing View. INFORMS J. Appl. Anal. 1974, 4, 28–36. [Google Scholar] [CrossRef]
- Hage, J.; Mintzberg, H. The Structuring of Organizations: A Synthesis of Research. Adm. Sci. Q. 1979, 25, 547. [Google Scholar] [CrossRef]
- House, R.J.; Mitchell, T.R. Path Goal Theory of Leadership; Faculty of Management Studies, University of Toronto: Toronto, ON, Canada, 1975. [Google Scholar]
- Bass, B.M. Leadership: Good, better, best. Organ. Dyn. 1985, 13, 26–40. [Google Scholar] [CrossRef]
- Kotter, J.P. What effective general managers really do. Harv. Bus. Rev. 1982, 60, 156–167. [Google Scholar] [PubMed]
- Yukl, G. Effective Leadership Behavior: What We Know and What Questions Need More Attention. Acad. Manag. Perspect. 2012, 26, 66–85. [Google Scholar] [CrossRef]
- Eisenhardt, K. Control in Business Organizations. Manag. Sci. 1985, 31, 134–149. Available online: http://www.jstor.org/stable/2631511 (accessed on 20 August 2024). [CrossRef]
- Simons, R. The role of management control systems in creating competitive advantage: New perspectives. In Management Control Theory; Routledge: London, UK, 2019; pp. 173–194. [Google Scholar]
- Abernethy, M.A.; Brownell, P. Management control systems in research and development organizations: The role of accounting, behavior and personnel controls. Accounting, Organ. Soc. 1997, 22, 233–248. [Google Scholar] [CrossRef]
- Lapide, L. Sales and operations planning part I: The process. J. Bus. Forecast. 2004, 23, 17–19. [Google Scholar]
- Karmarkar, U.S. Capacity loading and release planning with work-in-progress (WIP) and leadtimes. J. Manuf. Oper. Manag. 1989, 2, 37. [Google Scholar]
- Orlicky, J. Material Requirements Planning (MRP); McGraw-Hill: New York, NY, USA, 1975. [Google Scholar]
- Cappelli, P. Talent on Demand: Managing Talent in an Age of Uncertainty; Harvard Business Review Press: Cambridge, MA, USA, 2008. [Google Scholar]
- Schumpeter, J.A. The Theory of Economic Development; Harvard University Press: Cambridge, MA, USA, 1934. [Google Scholar]
- Makridakis, S.; Wheelwright, S.C.; Hyndman, R.J. Forecasting Methods and Applications; John Wiley& Sons Inc.: New York, NY, USA, 1998. [Google Scholar]
- Henderson, B. The Product Portfolio, Boston Consulting Group. 1970. Available online: https://www.bcg.com/de-de/publications/1970/strategy-the-product-portfolio.aspx (accessed on 20 August 2024).
- Fogarty, D.W.; Blackstone, J.H.; Hoffmann, T.R. Production & Inventory Management; South-Western Publishing: Cincinatti, OH, USA, 1991. [Google Scholar]
- Tompkins, J.A.; White, J.A.; Bozer, Y.A.; Tanchoco, J.M.A. Facilities Planning; John Wiley & Sons: Hoboken, NJ, USA, 2010. [Google Scholar]
- George, M.L. Lean Six Sigma: Combining Six Sigma Quality with Lean Production Speed; McGrow-Hill Co.: New York, NY, USA, 2002. [Google Scholar]
- Mintzberg, H. Structure in Fives: Designing Effective Organizations; Prentice-Hall, Inc.: Upper Saddle River, NJ, USA, 1993. [Google Scholar]
- Schmenner, R.W. How can service businesses survive and prosper. Sloan Manag. Rev. 1986, 27, 21–32. [Google Scholar]
- Henderson, J.C.; Venkatraman, H. Strategic alignment: Leveraging information technology for transforming organizations. IBM Syst. J. 1999, 38, 472–484. [Google Scholar] [CrossRef]
- Davenport, T.H. Process Innovation: Reengineering Work through Information Technology; Harvard Business Press: Boston, MA, USA, 1993. [Google Scholar]
- Gummesson, E. The new marketing—Developing long-term interactive relationships. Long Range Plan. 1987, 20, 10–20. [Google Scholar] [CrossRef]
- Reichheld, F.F.; Sasser, W.E., Jr. Zero defections: Quality comes to services. Harv. Bus. Rev. 1990, 68, 105–111. [Google Scholar] [PubMed]
- Heragu, S.S. Facility Layout and Location: An Analytical Approach; Pearson Prentice Hall: Upper Saddle River, NJ, USA, 2008. [Google Scholar]
- Gupta, A.; Maranas, C.D. Managing demand uncertainty in supply chain planning. Comput. Chem. Eng. 2003, 27, 1219–1227. [Google Scholar] [CrossRef]
- Pinedo, M. Scheduling: Theory, Algorithms, and Systems; Springer Science & Business Media LLC: Berlin, Germany, 2012. [Google Scholar] [CrossRef]
- Lawrence, P.R.; Lorsch, J.W.; Hall, R. Organization and Environment: Managing Differentiation and Integration. 1968. Available online: https://cir.nii.ac.jp/crid/1130000795641139968 (accessed on 20 August 2024).
- Bass, B.M. Leadership and Performance beyond Expectations; The Free Press: New York, NY, USA, 1985. [Google Scholar]
- Maslow, A.H. A theory of human motivation. Psychol. Rev. 1943, 50, 370–396. [Google Scholar] [CrossRef]
- Hackman, J.R.; Wageman, R. A Theory of Team Coaching. Acad. Manag. Rev. 2005, 30, 269–287. [Google Scholar] [CrossRef]
- Morgan, R.M.; Hunt, S.D. The Commitment-Trust Theory of Relationship Marketing. J. Mark. 1994, 58, 20–38. [Google Scholar] [CrossRef]
- Simon, H.A. The New Science of Management Decision; Prentice-Hall: Englewood Cliffs, NJ, USA, 1977. [Google Scholar] [CrossRef]
- Hillson, D.; Murray-Webster, R. Understanding and managing risk attitude. In Proceedings of the 7th Annual Risk Conference, London, UK, 26 November 2004; pp. 1–11. [Google Scholar]
- Juran, J.M.; Gryna, F.M. Juran’s Quality Handbook; McGraw-Hill: New York, NY, USA, 1999. [Google Scholar]
- Nonaka, I.; Takeuchi, H. The knowledge-creating company. Harv. Bus. Rev. 2007, 85, 162. [Google Scholar]
- Mintzberg, H.; Ahlstrand, B.; Lampel, J. Strategy Safari: A Guided Tour through the Wilds of Strategic Management; Simon and Schuster: New York, NY, USA, 2001. [Google Scholar]
- Damanpour, F. Organizational innovation: A meta-analysis of effects of determinants and moderators. In Organizational Innovation; Routledge: London, UK, 2018; pp. 127–162. [Google Scholar]
- Anthony, R.N.; Dearden, J. Management Control Systems; Harvard Business Review Press: Cambridge, MA, USA, 1980. [Google Scholar]
- Slack, N.; Brandon-Jones, A.; Johnston, R. Operations Management; Pearson Education Limited: Harlow, UK, 2013. [Google Scholar]
- DeNisi, A.S.; Murphy, K.R. Performance appraisal and performance management: 100 years of progress? J. Appl. Psychol. 2017, 102, 421–433. [Google Scholar] [CrossRef] [PubMed]
- Oakland, J.S. Total Quality Management and Operational Excellence: Text with Cases; Routledge: London, UK, 2014. [Google Scholar]
- Merchant, K.A.; Van der Stede, W.A. Management Control Systems: Performance Measurement, Evaluation and Incentives; Pearson Education: Harlow, UK, 2007. [Google Scholar]
- Schroeder, R. Operations Management in the Supply Chain: Decisions and Cases; McGraw-Hill: New York, NY, USA, 2018. [Google Scholar]
- Hansen, D.R.; Mowen, M.M. Cost Management: Accounting and Control; Cengage Learning: Belmont, CA, USA, 2007. [Google Scholar]
- Heizer, J.; Render, B. Operations Management: Sustainability and Supply Chain Management; Pearson: London, UK, 2020. [Google Scholar]
- Neely, A.; Adams, C.; Kennerley, M. The Performance Prism: The Scorecard for Measuring and Managing Stakeholder Relationship; Financial Times Prentice Hall: London, UK, 2002. [Google Scholar]
- Garvin, D.A. What Does―Product. Really mean. Sloan Manag. Rev. 1984, 25, 25–43. [Google Scholar]
- Guimaraes, T.; Martensson, N.; Stahre, J.; Igbaria, M. Empirically testing the impact of manufacturing system complexity on performance. Int. J. Oper. Prod. Manag. 1999, 19, 1254–1269. [Google Scholar] [CrossRef]
- Eckstein, D.; Goellner, M.; Blome, C.; Henke, M. The performance impact of supply chain agility and supply chain adaptability: The moderating effect of product complexity. Int. J. Prod. Res. 2015, 53, 3028–3046. [Google Scholar] [CrossRef]
- Saraph, J.V.; Benson, P.G.; Schroeder, R.G. An Instrument for Measuring the Critical Factors of Quality Management. Decis. Sci. 2019, 20, 810–829. [Google Scholar] [CrossRef]
- Lawshe, C.H. A quantitative approach to content validity. Pers. Psychol. 1975, 28, 563–575. Available online: https://caepnet.org/~/media/Files/caep/knowledge-center/lawshe-content-validity.pdf (accessed on 10 August 2024).
- Shannon, C.E. A mathematical theory of communication. Bell Syst. Tech. J. 1948, 27, 379–423. [Google Scholar] [CrossRef]
- Park, K.; Kremer, G. Assessment of static complexity in design and manufacturing of a product family and its impact on manufacturing performance. Int. J. Prod. Econ. 2015, 169, 215–232. [Google Scholar] [CrossRef]
- Calinescu, A. Complexity in manufacturing: An information theoretic approach. In Conference on Complexity and Complex Systems in Industry, 19–20 September 2000; University of Warwick: Warwich, UK, 2000; pp. 19–20. [Google Scholar]
- Frizelle, G. The Management of Complexity in Manufacturing: A Strategic Route Map to Competitive Advantage through the Control and Measurement of Complexity; Business Intelligence: London, UK, 1998. [Google Scholar]
- Isik, F. Complexity in supply chains: A new approach to quantitative measurement of the supply-chain-complexity. Supply Chain. Manag. 2011, 21, 417–432. [Google Scholar]
- Shannon, C.E. A mathematical theory of communication. ACM SIGMOBILE Mob. Comput. Commun. Rev. 2001, 5, 3–55. [Google Scholar] [CrossRef]
- Liker, J.K. The Toyota Way: 14 Management Principles from the World’s Greatest Manufacturer; McGraw-Hill: New York, NY, USA, 2004. [Google Scholar]
- Womack, J.P.; Jones, D.T. Lean Thinking—Banish Waste and Create Wealth in your Corporation. J. Oper. Res. Soc. 1997, 48, 1148. [Google Scholar] [CrossRef]
- Hermann, M.; Pentek, T.; Otto, B. Design principles for industrie 4.0 scenarios. In Proceedings of the 2016 49th Hawaii International Conference on System Sciences (HICSS), Koloa, HI, USA, 5–8 January 2016; IEEE: Piscataway, NJ, USA, 2016; pp. 3928–3937. [Google Scholar] [CrossRef]
- Bloem, J. The Fourth Industrial Revolution; Things Tighten, 2014, 8, 11–15. Available online: https://www.sogeti.com/globalassets/global/special/sogeti-things3en.pdf (accessed on 10 August 2024).
- Edwards, A. Statistical methods for research workers. In Landmark Writings in Western Mathematics 1640–1940; Elsevier Science: Amsterdam, The Netherlands, 2005; pp. 856–870. [Google Scholar]
- Bulmer, M. Principles of Statistics; Courier Corporation: Washington, DC, USA, 1979. [Google Scholar]
- McGill, W. Multivariate information transmission. Trans. IRE Prof. Group Inf. Theory 1954, 4, 93–111. [Google Scholar] [CrossRef]
- Williams, P.L.; Beer, R.D. Nonnegative decomposition of multivariate information. arXiv 2010, arXiv:1004.2515. [Google Scholar]
- Bertschinger, N.; Rauh, J.; Olbrich, E.; Jost, J.; Ay, N. Quantifying unique information. Entropy 2014, 16, 2161–2183. [Google Scholar] [CrossRef]
- Griffith, V.; Koch, C. Quantifying synergistic mutual information. In Guided Self-Organization: Inception; Springer: Berlin/Heidelberg, Germany, 2014; pp. 159–190. [Google Scholar]
- Stacey, R.D.; Griffin, D.; Shaw, P. Complexity and Management: Fad or Radical Challenge to Systems Thinking? Psychology Press: London, UK, 2000. [Google Scholar]
- Uhl-Bien, M.; Marion, R. Complexity leadership in bureaucratic forms of organizing: A meso model. Leadersh. Q. 2009, 20, 631–650. [Google Scholar] [CrossRef]
- Digiesi, S.; Cavallo, D.; Lucchese, A.; Mummolo, C. Human cognitive and motor abilities in the aging workforce: An information-based model. Appl. Sci. 2020, 10, 5958. [Google Scholar] [CrossRef]
- Verna, E.; Genta, G.; Galetto, M. A new approach for evaluating experienced assembly complexity based on Multi Expert-Multi Criteria Decision Making method. Res. Eng. Des. 2023, 34, 301–325. [Google Scholar] [CrossRef]


| Stage | Variables and Relevance |
|---|---|
| Planning | P1-Market demand [91]: defines production levels, impacting planning and operational efficiency. P2-Production capacity [92]: determines maximum volume, influencing investments and resources. P3-Available material resources [93]: critical factor in inventory and supply planning. P4-Human resources [94]: key to efficiency and quality in the production process. P5-Technology and equipment [95]: ensure efficiency and innovation. P6-Demand forecasts [96]: align production with expectations, avoiding overproduction or shortages. P7-Product manufactured [97]: influences processes, design and selection of technologies. P8-Parts of the product [98]: ensure available components, guaranteeing continuity in production. P9-Plant or facilities [99]: impact workflows and optimize production capacity. P10-Manufacturing process [100]: defines efficiency and quality, influencing times and flexibility. |
| Organization | O1-Organizational structure [101]: influences decisions, responsibilities and operational efficiency. O2-Design of production processes [102]: affects efficiency and response to market demand. O3-Distribution of human and material resources [103]: optimizes resources and reduces costs. O4-Definition of workflows and operating procedures [104]: establishes efficient operations. O5-Order of customer order [105]: impacts scheduling and fulfillment of timely requirements. O6-Customer relationship [106]: influences satisfaction, loyalty and company reputation. O7-Production sequencing [107]: affects efficiency, lead times and on-time delivery. O8-Production scheduling technologies [108]: optimizes scheduling, reducing downtime and errors. O9-Production scheduling model [109]: balances workload and improves operational efficiency. O10-Interdepartmental coordination [110]: improves communication, and collaboration. |
| Management | M1-Production team leadership and management [111]: influences motivation and performance. M2-Personnel motivation and development [112]: key to productivity and job satisfaction. M3-Internal communication [113]: coordinates teams and ensures timely delivery of information. M4-External communication [114]: maintains strong relationships. M5-Decision making [115]: improves agility and accuracy in addressing opportunities. M6-Risk identification and management [116]: mitigates risk by ensuring operational continuity. M7-Quality management [117]: ensures customer satisfaction and reputation through standards. M8-Knowledge management [118]: facilitates innovation and continuous improvement. M9-Strategic planning [119]: aligns daily operations with strategic objectives. M10-Innovation and continuous improvement [120]: ensures constant adaptation. |
| Control | C1-Tracking compliance with production plans [121]: aligns operations with objectives. C2-Monitoring resource utilization [122]: avoids waste and improves operational sustainability. C3-Evaluating personnel performance [123]: provides feedback, improving productivity and morale. C4-Quality control at all stages of the process [124]: ensures compliance with standards. C5-Analyzing deviations between plan and execution [125]: identifies and corrects deviations. C6-Inventory and stock management [126]: optimizes stock, reducing costs. C7-Production cost tracking [127]: control costs, ensuring profitability and informed decisions. C8-Estimated production time [128]: facilitates compliance with deadlines, improving delivery. C9-Key performance indicators [129]: evaluates performance, allowing quick adjustments. C10-Setting quality standards [130]: defines clear criteria, ensuring compliance and satisfaction. |
| Effects | Planning | Organization | Management | Control |
|---|---|---|---|---|
| E1 | High uncertainty of demand | High difficulty in decision making | Lack of effective leadership | Lack of follow up to established plans |
| E2 | Excess of installed capacity | Bottlenecks and inefficiencies | Lack of motivational initiatives | Lack of monitoring |
| E3 | High volume of raw materials | Imbalance in resource allocation | Insufficient supervision | Infrequent evaluations |
| E4 | High skills in the workforce | Lack of standardized procedures | Inefficiency in problem solving | Poor inspections |
| E5 | High obsolescence of technology and equipment | Changes in customer requirements | Poor communication | Lack of variance analysis |
| E6 | High variation in demand projection | High number of customers | Lack of resources and training opportunities | Excess inventory |
| E7 | High number of product SKUs | Difficulty in scheduling orders | Lack of attention to quality and safety standards | High financial pressure due to high operating costs |
| E8 | High number of product components and parts | Incompatible scheduling system | Inability to handle internal conflicts | Frequent delays in the execution of production processes |
| E9 | Complex infrastructure | Difficult order scheduling model | Lack of a collaborative culture | Lack of performance indicators |
| E10 | Different flows of operations or activities | Lack of coordination between departments leading to conflicts and delays | Resistance to change hindering the implementation of process improvements | Poorly defined quality standards affecting product consistency |
| Strategies | Planning | Organization | Management | Control |
|---|---|---|---|---|
| S1 | Implement advanced forecasting systems. Develop contingency plans. | Implement decision support tools. Develop a data-driven decision-making culture. | Develop leadership skills. Foster a positive work environment. | Implement monitoring systems. Develop an ongoing monitoring plan. |
| S2 | Optimize installed capacity. Improve demand management. | Identify and eliminate bottlenecks. Improve operational efficiency. | Implement motivational programs. Develop incentive plans. | Improve monitoring systems. Develop a plan for efficient resource utilization. |
| S3 | Secure long-term supply contracts. Develop a flexible supply chain. | Optimize resource allocation. Develop a contingency plan. | Improve supervision. Implement quality programs. | Implement periodic evaluations. Develop a feedback system. |
| S4 | Invest in training and development. Hire personnel with the required skills. | Establish standard operating procedures. Train staff on procedures. | Develop problem-solving skills. Implement a problem management system. | Improve inspections. Implement a quality management system. |
| S5 | Upgrade technologies and equipment on a regular basis. Implement preventive maintenance programs. | Develop a change management system. Maintain effective communication with customers. | Improve internal communication. Implement a communication management system. | Develop variance analysis skills. Implement a variance management system. |
| S6 | Improve monitoring and control systems. Develop rapid response plans. | Implement a customer management system. Improve customer segmentation. | Develop training programs. Secure resources for training. | Optimize inventory management. Develop an inventory reduction plan. |
| S7 | Reduce the number of product references. Optimize product catalog management. | Optimize order scheduling. Implement an efficient scheduling system. | Implement quality standards. Develop a quality management system. | Implement a financial management system. Develop a cost reduction plan. |
| S8 | Standardize components and parts. Improve inventory management. | Update and improve the scheduling system. Ensure system compatibility. | Develop conflict management skills. Implement a conflict management system. | Improve process management. Develop a delay reduction plan. |
| S9 | Simplify infrastructure. Improve coordination between departments. | Develop an efficient scheduling model. Train staff in order scheduling | Foster a collaborative culture. Develop collaborative programs. | Implement performance indicators. Develop a performance evaluation system. |
| S10 | Standardize operation flows. Implement process management systems. | Improve interdepartmental coordination. Implement conflict management systems | Implementing change management programs. Developing a culture of continuous improvement. | Define quality standards. Develop a quality management system. |
| Technologies | Planning | Organization | Management | Control |
|---|---|---|---|---|
| T1 | Heijunka (Production leveling): To balance production and reduce variability. Just-In-Time (JIT): To adjust production according to actual demand. | Hoshin Kanri (Policy Deployment): To align strategic and operational objectives. Kaizen: To foster data-driven and fact-based decision making. | Lean Leadership: To develop effective leaders in the organization. Kaizen: To involve leaders in continuous improvement and team motivation. | Visual Management: To follow up and continuously monitor the plans. Kaizen: To review and adjust plans regularly. |
| Agile supply chain management systems (IoT and integrated ERP systems). Real-time communication tools with customers and suppliers (Cloud computing). | Collaborative management tools (Project management platforms). Knowledge management systems to share information and make data-driven decisions. | Talent management platforms to identify skills and development needs. Data analytics to assess team performance and make informed decisions about leadership development. | Manufacturing Execution Systems (MES) to monitor in real time the progress of production orders. IoT sensors embedded in machines to collect performance and efficiency data. | |
| T2 | Kaizen: To identify and eliminate waste and improve efficiency. Just-In-Time (JIT): To adjust production and minimize overcapacity. | Theory of Constraints (TOC): To identify and eliminate bottlenecks. Kaizen: To continuously improve processes and eliminate inefficiencies. | Lean Culture: To create a culture of motivation and continuous improvement. Kaizen: To encourage active participation and recognition of personnel. | Andon: To monitor and alert on problems in real time. Just-In-Time (JIT): To adjust resource utilization as needed. |
| Capacity analysis (Simulation and Digital twins). Process optimization technologies (Machine learning). Collaborative systems and digital outsourcing (Cloud computing). | Digital twins to simulate and optimize production processes. Real-time production control systems (IoT—Industrial Internet of Things). | Performance management and continuous feedback systems. Online learning platforms to offer professional development courses. | Industrial Internet of Things (IoT) systems to monitor raw material and equipment usage in real time. Enterprise resource management (ERP) software (SAP S/4HANA) with specialized modules for inventory management and production planning. | |
| T3 | 5S: To organize and manage inventory efficiently. Kanban: To control and reduce inventory of raw materials. | Heijunka: To level the workload and balance resource allocation. Just-In-Time (JIT): To adjust resources according to demand. | Gemba Walks: For supervisors to observe and improve processes in the workplace. Kaizen: To continuously identify and eliminate waste. | Gemba Walks: To perform evaluations and provide continuous feedback. Kaizen: To encourage regular staff feedback and development. |
| Advanced inventory management systems (IoT, RFID). Predictive analytics tools to forecast material demand (Machine learning). | Integrated enterprise resource planning (ERP) systems. Project management and collaboration platforms to coordinate resources across teams. | Remote monitoring systems and IoT sensors to monitor machine and equipment performance. Predictive analytics systems to anticipate failures and improve efficiency. | Talent management platforms that enable continuous performance evaluation. Mobile applications to facilitate feedback and continuous staff development. | |
| T4 | Training Within Industry (TWI): To improve the skills and capabilities of personnel. Kaizen: To engage employees in continuous improvement. | Standardized Work: To document and standardize operating procedures. Kaizen: To continuously improve and update procedures. | A3 Problem Solving: For structured and effective problem solving. Kaizen: To continuously address and solve problems. | Jidoka (Autonomation): To detect and correct defects immediately. Total Quality Management (TQM): To improve inspections and ensure quality. |
| Machine learning and augmented reality systems for training (Machine learning). Repetitive task automation and collaborative robotics (Collaborative robots). | Business Process Management (BPM) software (IBM Business Process Manager) to design and automate workflows. Document management platforms to store and share manuals and guidelines. | Data analysis tools to identify patterns and trends that can help in problem solving. Online collaboration platforms to facilitate employee participation in problem-solving. | Machine vision systems and sensors to detect defects automatically. Data analysis technologies to identify quality trends and problems. | |
| T5 | Total Productive Maintenance (TPM): To maintain and improve the equipment. Kaizen: To identify opportunities for technological upgrades. | Jidoka (Autonomation): To detect and correct problems quickly. Customer Focus: To maintain a continuous focus on customer needs. | Visual Management: To improve communication and transparency in the workplace. Kaizen: To improve communication channels and methods. | A3 Problem Solving: For structured analysis and correction of deviations. Kaizen: To continuously address and correct problems. |
| Real-time monitoring (IoT and Sensors). Data-driven predictive maintenance. Digitization of manufacturing processes and use of digital twins (Big data and Digital twins). | Customer Relationship Management (CRM) systems to manage orders and customer communication. Data analysis tools to forecast changes in demand. | Customer Relationship Management (CRM) systems to improve external and internal communication. Video conferencing and instant messaging tools to facilitate real-time communication. | Business Intelligence (BI) tools to compare actual data with planned data. Early warning systems to notify significant deviations. | |
| T6 | Heijunka: To level production and adapt to fluctuations. Just-In-Time (JIT): To adjust production in real time according to demand. | Heijunka: To level production according to the demand of different customers. Kaizen: To improve efficiency in serving multiple customers. | Training Within Industry (TWI): To improve training and skills development. Kaizen: To identify and provide the necessary development opportunities. | Just-In-Time (JIT): To minimize inventory and reduce costs. Kanban: To manage and control inventory efficiently. |
| Real-time visibility and collaboration systems (Digital supply chain platforms). Predictive analytics and advanced modeling tools. Agile methodologies for planning and production. | Marketing automation and CRM platforms to manage customer relationships. Chatbots and automated customer service systems. | E-learning and e-learning platforms to deliver training programs. Talent management systems to identify individualized training and development needs. | RFID and barcode technologies for accurate inventory tracking. Warehouse automation solutions to streamline inventory management. | |
| T7 | Single Minute Exchange of Die (SMED): To reduce changeover times and handle multiple products. Heijunka: To level production of multiple product references. | Kanban: To manage order flow efficiently. Just-In-Time (JIT): To adjust order scheduling in real time. | Total Quality Management (TQM): To ensure quality and safety in all processes. Kaizen: To continuously improve quality and safety standards. | Cost Deployment: To identify and reduce operating costs. Kaizen: To continuously improve efficiency and reduce costs. |
| Flexible manufacturing technologies (Adaptive CNC, 3D printing). Automation of configuration and assembly processes. Computer-aided design (CAD) tools for standardization. | Advanced production scheduling optimization algorithms. Manufacturing resource planning (MRP) systems connected in real time. | Quality management systems (QMS) to ensure regulatory compliance. Sensors and IoT technologies to monitor safety and quality conditions in real time. | Advanced cost accounting systems integrated with ERP systems. Data analysis tools to identify cost reduction opportunities. | |
| T8 | Kanban: To manage and control component inventory. Standardized Work: To standardize assembly and component handling processes. | Kanban: To simplify and improve scheduling. Value Stream Mapping (VSM): To identify and eliminate inefficiencies in the scheduling system. | Lean Culture: To foster a collaborative work environment and resolve conflicts. Kaizen: To effectively address and resolve conflicts. | Value Stream Mapping (VSM): To identify and eliminate bottlenecks. Kaizen: To improve processes and reduce delays. |
| Design for additive manufacturing (3D printing). Component visibility and traceability technologies (QR codes, RFID). | Enterprise Resource Planning (ERP) systems integrated with production scheduling modules. Real-time collaboration tools to coordinate scheduling across departments. | Online conflict management tools to facilitate dispute resolution. Training in emotional intelligence and effective communication skills. | Advanced Planning and Scheduling (APS) software (SAP IBP 2105) to optimize scheduling and reduce cycle times. Digital twins to simulate and optimize production processes prior to implementation. | |
| T9 | Value Stream Mapping (VSM): To analyze and improve the value stream. 5S: To organize and simplify the infrastructure. | Heijunka: To level production and simplify order scheduling. Kanban: To manage and improve order flow. | Lean culture: To develop a culture of collaboration and innovation. Kaizen: To encourage the participation and creativity of all employees. | Key Performance Indicators (KPIs): To define and monitor performance indicators. Visual Management: To track and continuously evaluate performance. |
| Industrial automation (Collaborative robots, AGVs). Remote monitoring and control systems (IoT applied to plant management). Modular and flexible plant design (Adaptable production lines). | Simulation and modeling to optimize and simplify the scheduling model. Machine learning algorithms to improve production scheduling accuracy. | Enterprise social networking platforms to promote interaction and collaboration among employees. Agile project management tools to facilitate teamwork. | Data analysis and visualization platforms to create interactive control panels. Business Intelligence technologies to monitor KPIs in real time and generate automated reports. | |
| T10 | Value Stream Mapping (VSM): To identify and optimize different operation flows. Standardized Work: To standardize processes and improve efficiency. | Kaizen: To foster collaboration and improve interdepartmental communication. Hoshin Kanri (Policy Deployment): To align objectives and improve coordination. | Lean culture: To create a culture open to change and continuous improvement. Kaizen: To involve employees in the change process and reduce resistance. | Standardized Work: To define and document quality standards. Total Quality Management (TQM): To ensure consistency in product quality. |
| Real-time quality management systems (Integrated quality sensors). Simulation and modeling tools for workflow optimization. | Collaborative project management platforms. Integrated business communication systems. | Innovation management systems to capture and manage improvement ideas.” Simulation and modeling to test and validate improvements before implementing them. | Quality Management Systems (QMS) integrated with production systems. IoT sensors to capture quality data in real time and take quick corrective actions. |
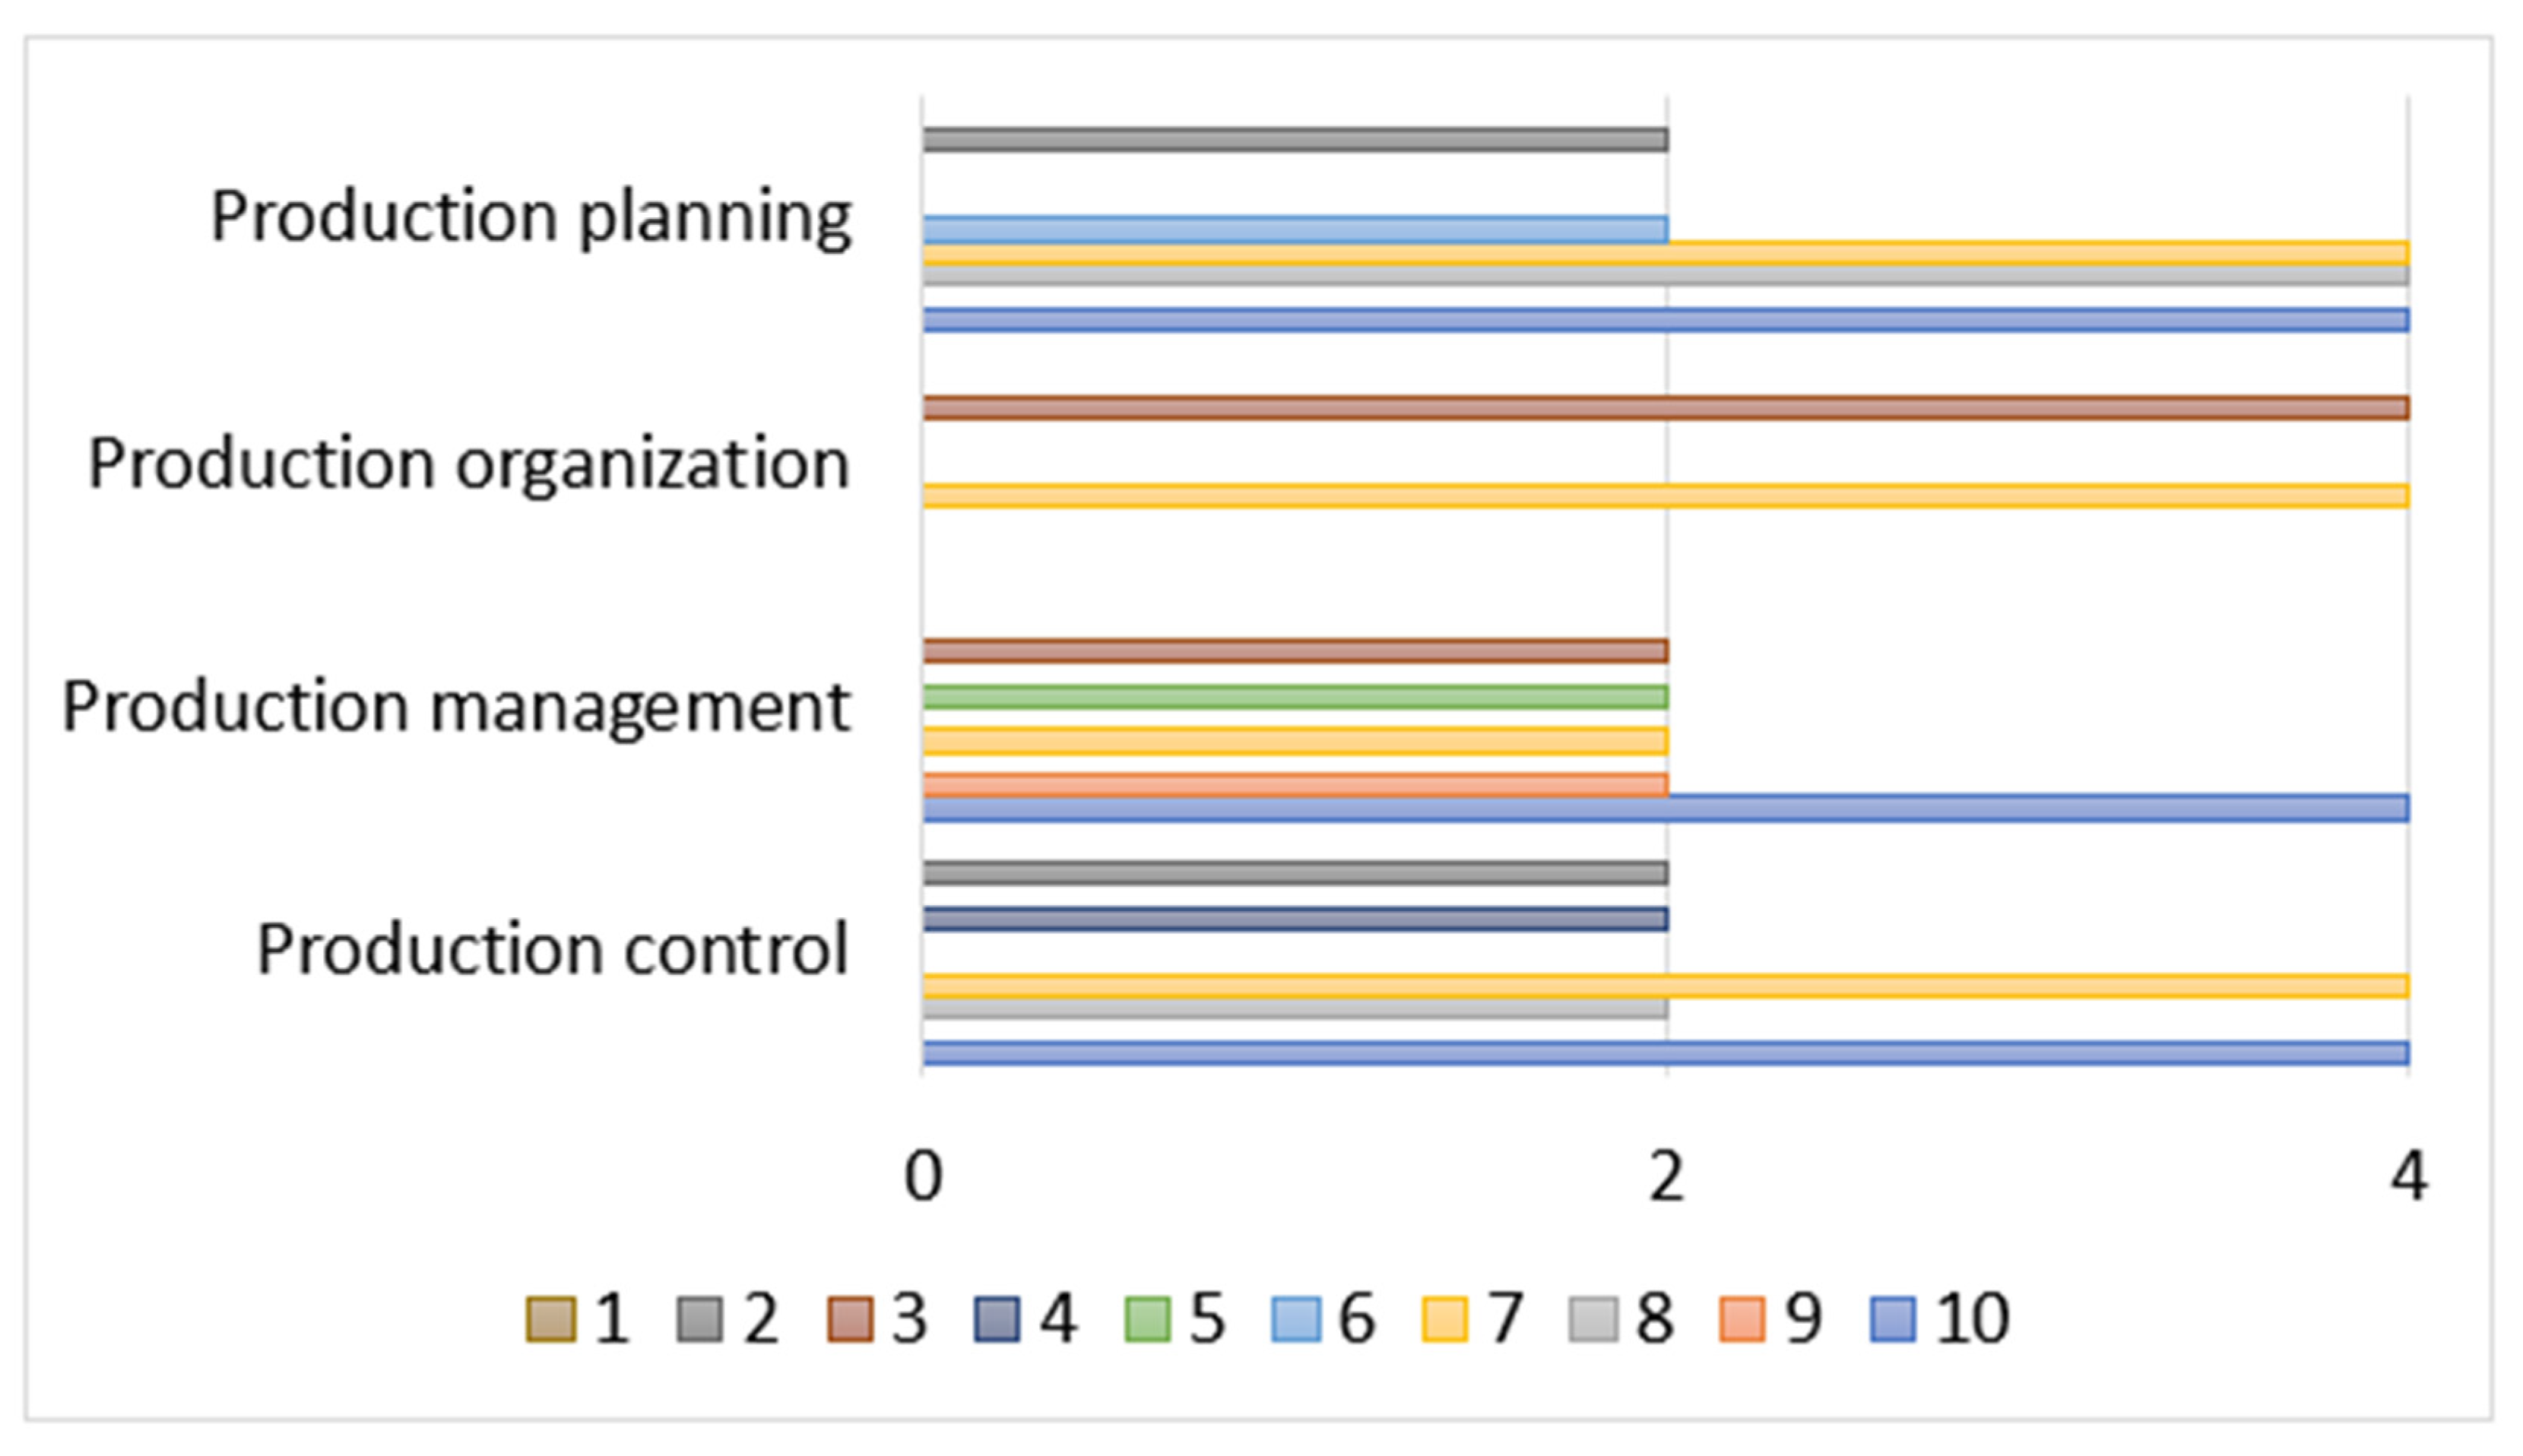
| Production planning | Variable | 1 | 2 | 3 | 4 | 5 | 6 | 7 | 8 | 9 | 10 |
| Normal | 1 | 1 | 1 | 1 | 1 | 1 | 1 | 1 | 1 | 1 | |
| Real | 1 | 3 | 1 | 1 | 1 | 3 | 5 | 5 | 1 | 5 | |
| Absolute | 0 | 2 | 0 | 0 | 0 | 2 | 4 | 4 | 0 | 4 | |
| Production organization | Variable | 1 | 2 | 3 | 4 | 5 | 6 | 7 | 8 | 9 | 10 |
| Normal | 1 | 1 | 1 | 1 | 1 | 1 | 1 | 1 | 1 | 1 | |
| Real | 1 | 1 | 5 | 1 | 1 | 1 | 5 | 1 | 1 | 1 | |
| Absolute | 0 | 0 | 4 | 0 | 0 | 0 | 4 | 0 | 0 | 0 | |
| Production management | Variable | 1 | 2 | 3 | 4 | 5 | 6 | 7 | 8 | 9 | 10 |
| Normal | 1 | 1 | 1 | 1 | 1 | 1 | 1 | 1 | 1 | 1 | |
| Real | 1 | 3 | 3 | 1 | 3 | 1 | 3 | 1 | 1 | 1 | |
| Absolute | 0 | 0 | 2 | 0 | 2 | 0 | 2 | 0 | 2 | 4 | |
| Production control | Variable | 1 | 2 | 3 | 4 | 5 | 6 | 7 | 8 | 9 | 10 |
| Normal | 1 | 1 | 1 | 1 | 1 | 1 | 1 | 1 | 1 | 1 | |
| Real | 1 | 3 | 1 | 3 | 1 | 1 | 5 | 3 | 1 | 5 | |
| Absolute | 0 | 2 | 0 | 2 | 0 | 0 | 4 | 2 | 0 | 4 |
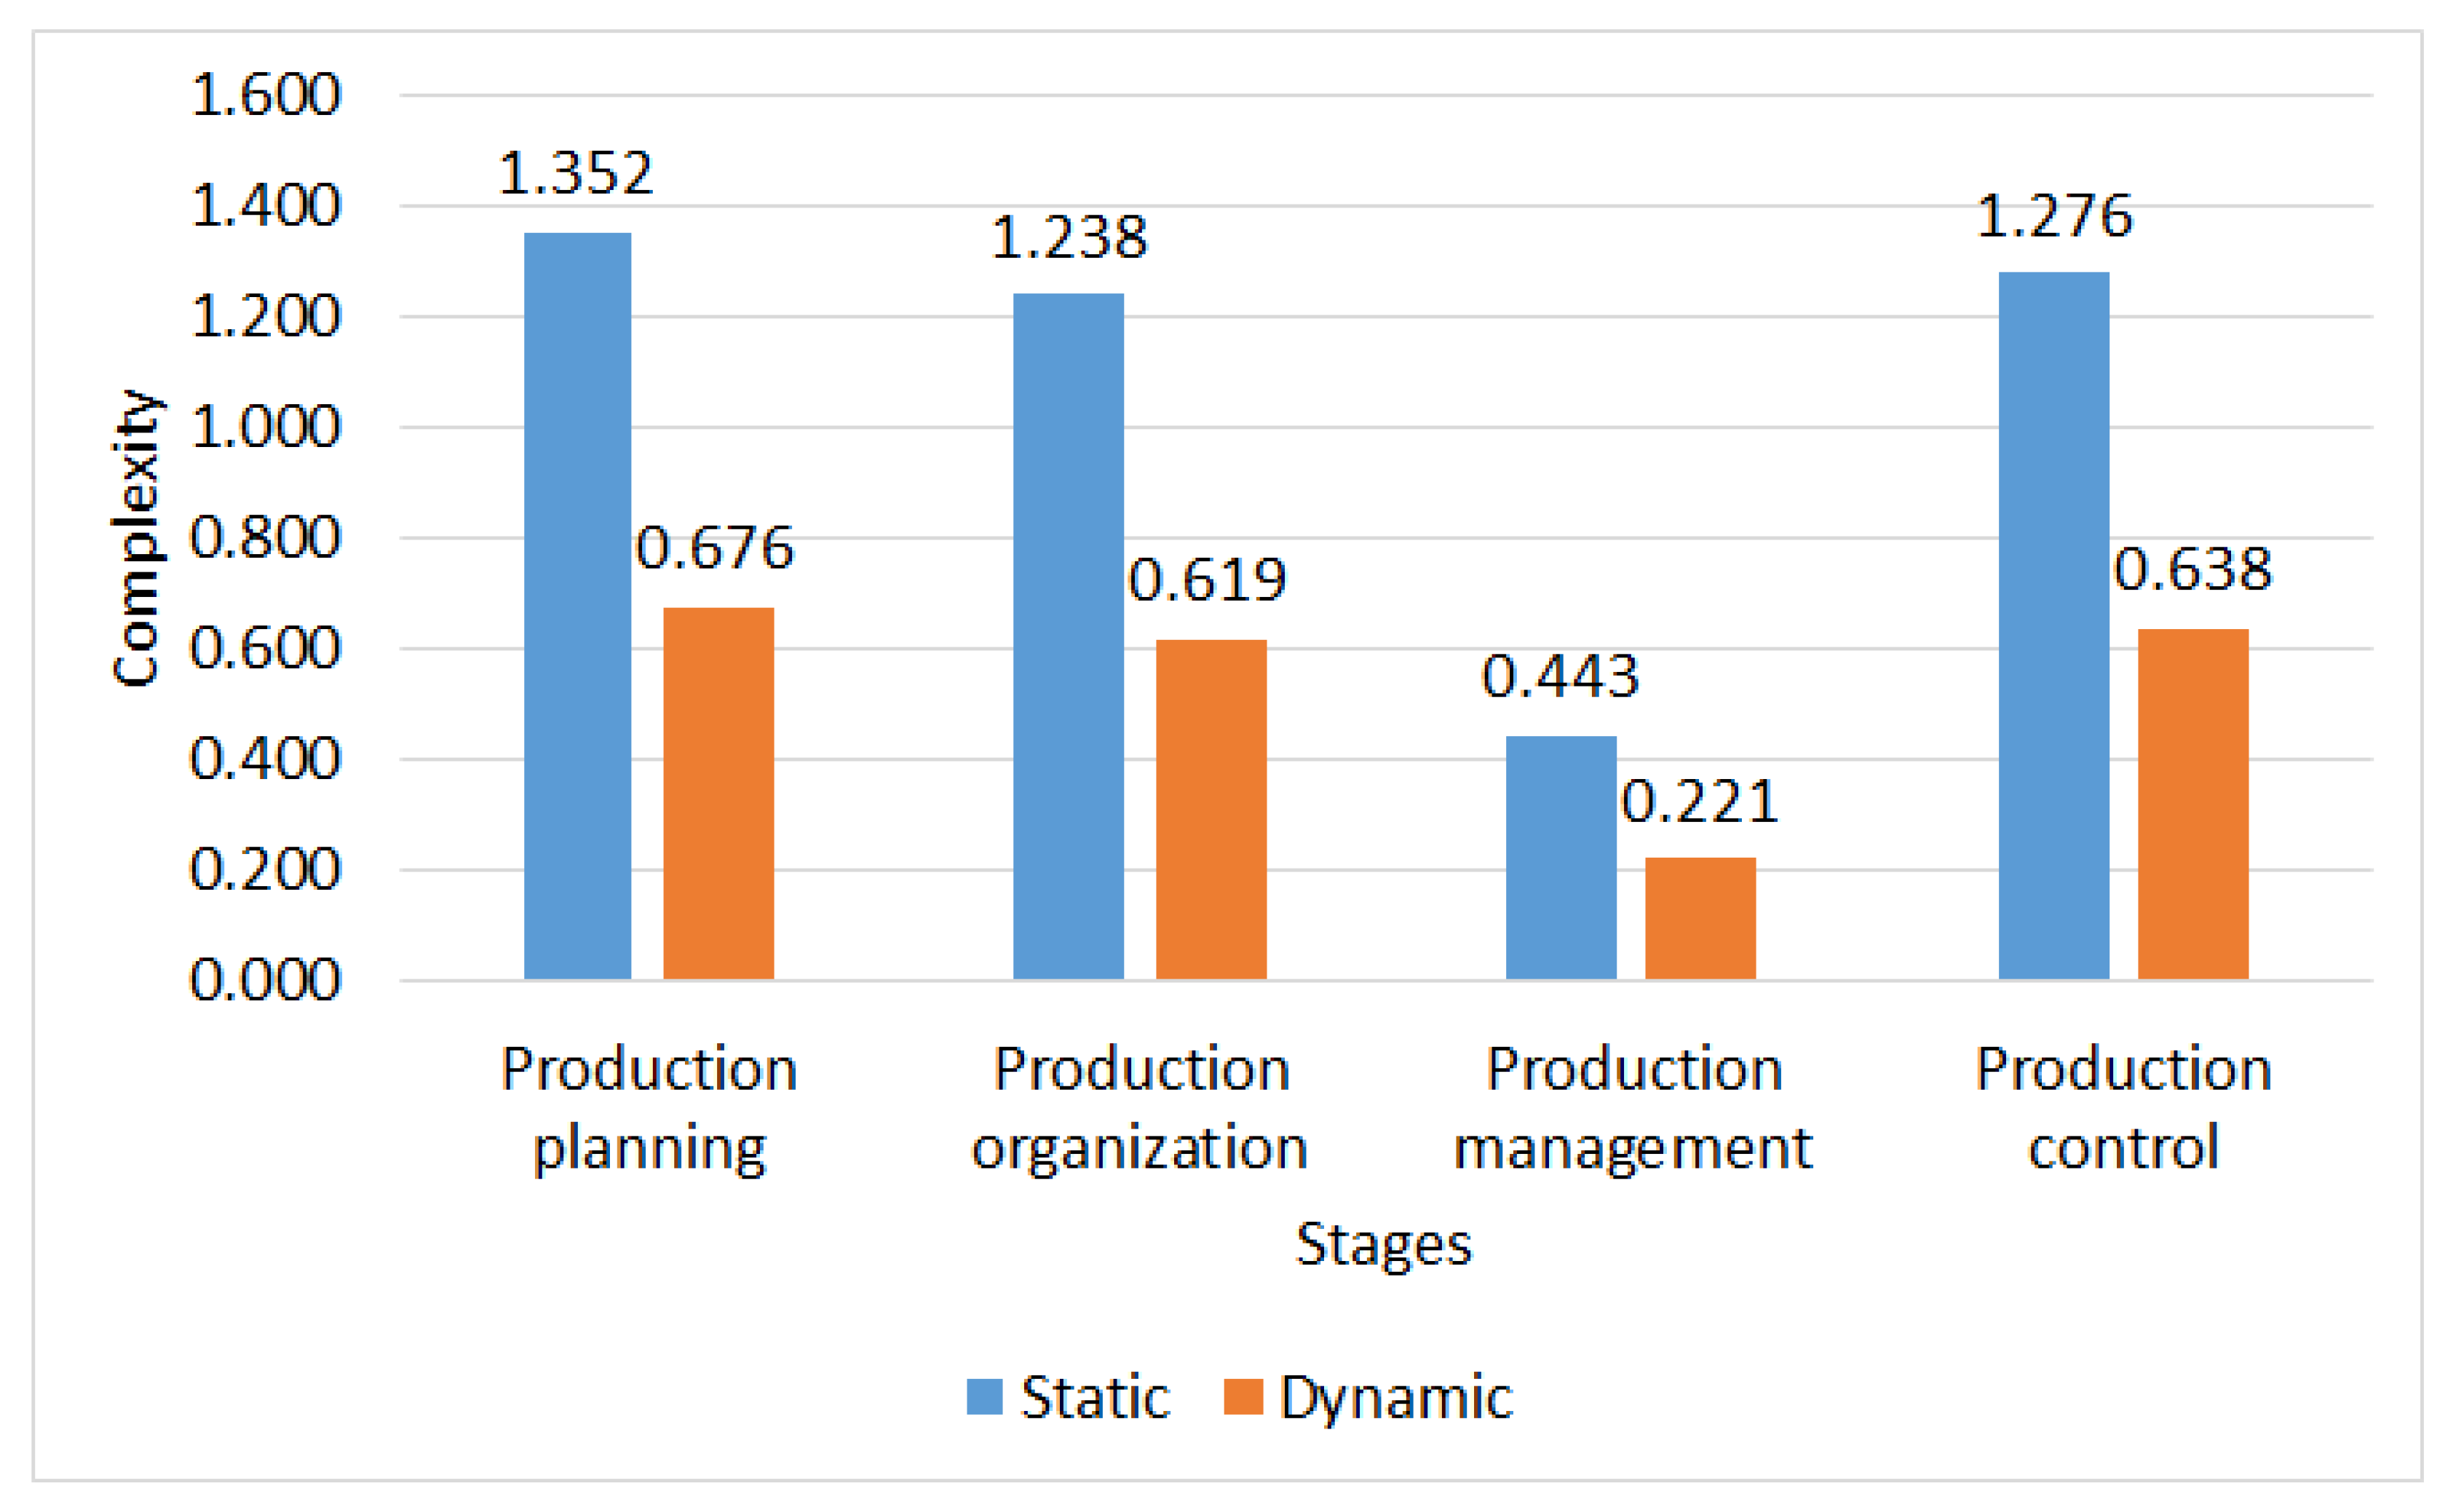
| Production Planning | Wj | dij | Interval | Frequency | Pij | Static | Dynamic | |
|---|---|---|---|---|---|---|---|---|
| 1 | 0.17 | 0 | 0.000 | 1.333 | 5 | 0.500 | 0.000 | 0.000 |
| 2 | 0.33 | 2 | 1.334 | 2.668 | 2 | 0.200 | 0.310 | 0.155 |
| 3 | 0.50 | 4 | 2.668 | 4.001 | 3 | 0.300 | 1.042 | 0.521 |
| 6 | 1.00 | 10 | 1.000 | 1.352 | 0.676 | |||
| Production organization | ||||||||
| 1 | 0.33 | 0 | 0.000 | 2.000 | 8 | 0.800 | 0.000 | 0.000 |
| 2 | 0.67 | 4 | 2.001 | 4.001 | 2 | 0.200 | 1.238 | 0.619 |
| 3 | 1.00 | 10 | 1.000 | 1.238 | 0.619 | |||
| Production management | ||||||||
| 1 | 0.33 | 0 | 0.000 | 2.000 | 9 | 0.900 | 0.000 | 0.000 |
| 2 | 0.67 | 2 | 2.001 | 4.001 | 1 | 0.100 | 0.443 | 0.221 |
| 3 | 1.00 | 10 | 1.000 | 0.443 | 0.221 | |||
| Production control | ||||||||
| 1 | 0.17 | 0 | 0.000 | 1.333 | 5 | 0.500 | 0.000 | 0.000 |
| 2 | 0.33 | 2 | 1.334 | 2.668 | 3 | 0.300 | 0.347 | 0.174 |
| 3 | 0.50 | 4 | 2.668 | 4.001 | 2 | 0.200 | 0.929 | 0.464 |
| 6 | 1.00 | 10 | 1.000 | 1.276 | 0.638 | |||
| Variable | Effects | Solution Strategies | Methodologies | Technologies |
| 7. Product Manufactured | High number of product references | Reduce the number of product references. Optimize product catalog management. | Single Minute Exchange of Die (SMED): To reduce changeover times and handle multiple products. Heijunka: To level production of multiple product references. | Flexible manufacturing technologies (adaptive CNC, 3D printing). Automation of set-up and assembly processes. Computer-aided design (CAD) tools for standardization. |
| 8. Parts of the Product | High number of product components and parts | Standardize components and parts. Improve inventory management. | Kanban: To manage and control component inventory. Standardized Work: To standardize assembly and component handling processes. | Design for additive manufacturing (3D printing). Component visibility and traceability technologies (QR codes, RFID). |
| 10. Manufacturing process | Different flows of operations or activities | Standardize operation flows. Implement process management systems. | Value Stream Mapping (VSM): To identify and optimize different operation flows. Standardized Work: To standardize processes and improve efficiency. | Real-time quality management systems (integrated quality sensors). Simulation and modeling tools for workflow optimization. |
Disclaimer/Publisher’s Note: The statements, opinions and data contained in all publications are solely those of the individual author(s) and contributor(s) and not of MDPI and/or the editor(s). MDPI and/or the editor(s) disclaim responsibility for any injury to people or property resulting from any ideas, methods, instructions or products referred to in the content. |
© 2024 by the authors. Licensee MDPI, Basel, Switzerland. This article is an open access article distributed under the terms and conditions of the Creative Commons Attribution (CC BY) license (https://creativecommons.org/licenses/by/4.0/).
Share and Cite
Herrera-Vidal, G.; Coronado-Hernández, J.R.; Martínez Paredes, B.P.; Sánchez Ramos, B.O.; Sierra, D.M. Systematic Configurator for Complexity Management in Manufacturing Systems. Entropy 2024, 26, 747. https://doi.org/10.3390/e26090747
Herrera-Vidal G, Coronado-Hernández JR, Martínez Paredes BP, Sánchez Ramos BO, Sierra DM. Systematic Configurator for Complexity Management in Manufacturing Systems. Entropy. 2024; 26(9):747. https://doi.org/10.3390/e26090747
Chicago/Turabian StyleHerrera-Vidal, Germán, Jairo R. Coronado-Hernández, Breezy P. Martínez Paredes, Blas Oscar Sánchez Ramos, and David Martinez Sierra. 2024. "Systematic Configurator for Complexity Management in Manufacturing Systems" Entropy 26, no. 9: 747. https://doi.org/10.3390/e26090747
APA StyleHerrera-Vidal, G., Coronado-Hernández, J. R., Martínez Paredes, B. P., Sánchez Ramos, B. O., & Sierra, D. M. (2024). Systematic Configurator for Complexity Management in Manufacturing Systems. Entropy, 26(9), 747. https://doi.org/10.3390/e26090747