Nonparametric Expectile Shortfall Regression for Complex Functional Structure
Abstract
:1. Introduction
2. Model and Estimator
3. Main Asymptotic Result
- (P1)
- where .
- (P2)
- , ,
- (P3)
- The sequence is a strong mixing process that has a coefficient and satisfies and
- (P4)
- is a function with support such that
- (P5)
- There exists a sequence of positive real numbers and such thatwhere
- Comments on the hypotheses.
4. Empirical Analysis
4.1. Smoothing Parameter Selection: Cross-Validation
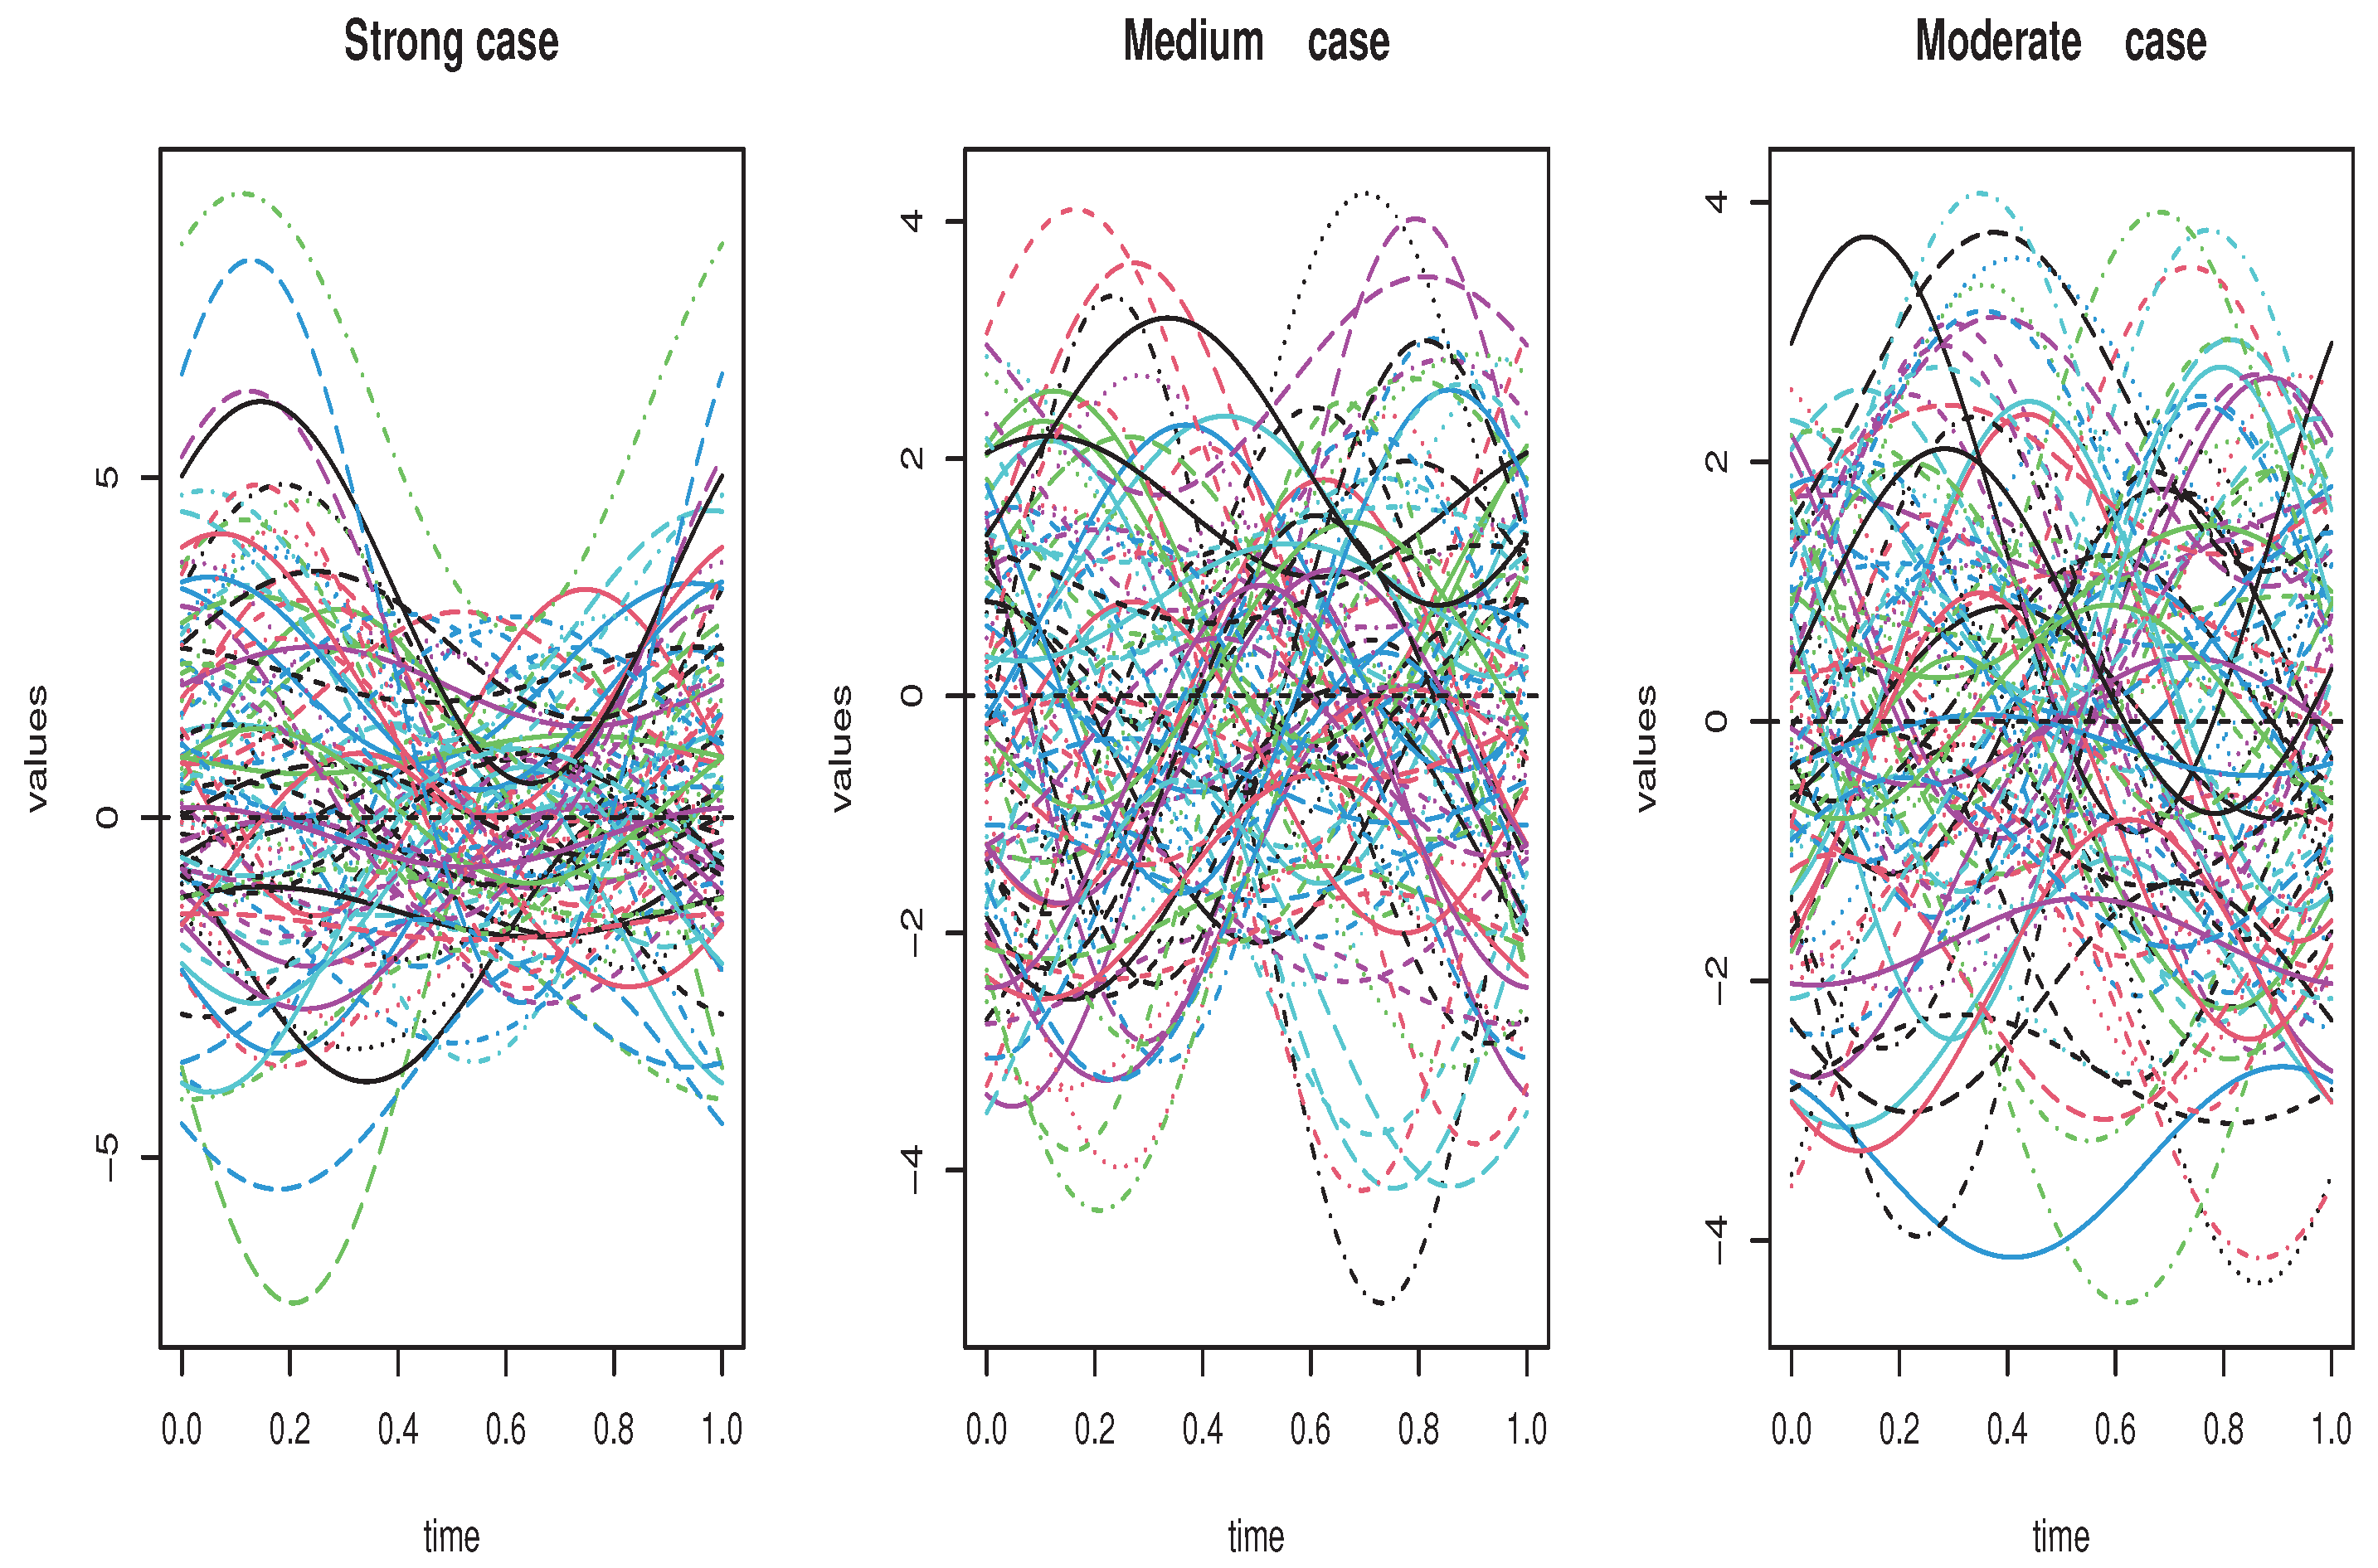
4.2. Artificial Data
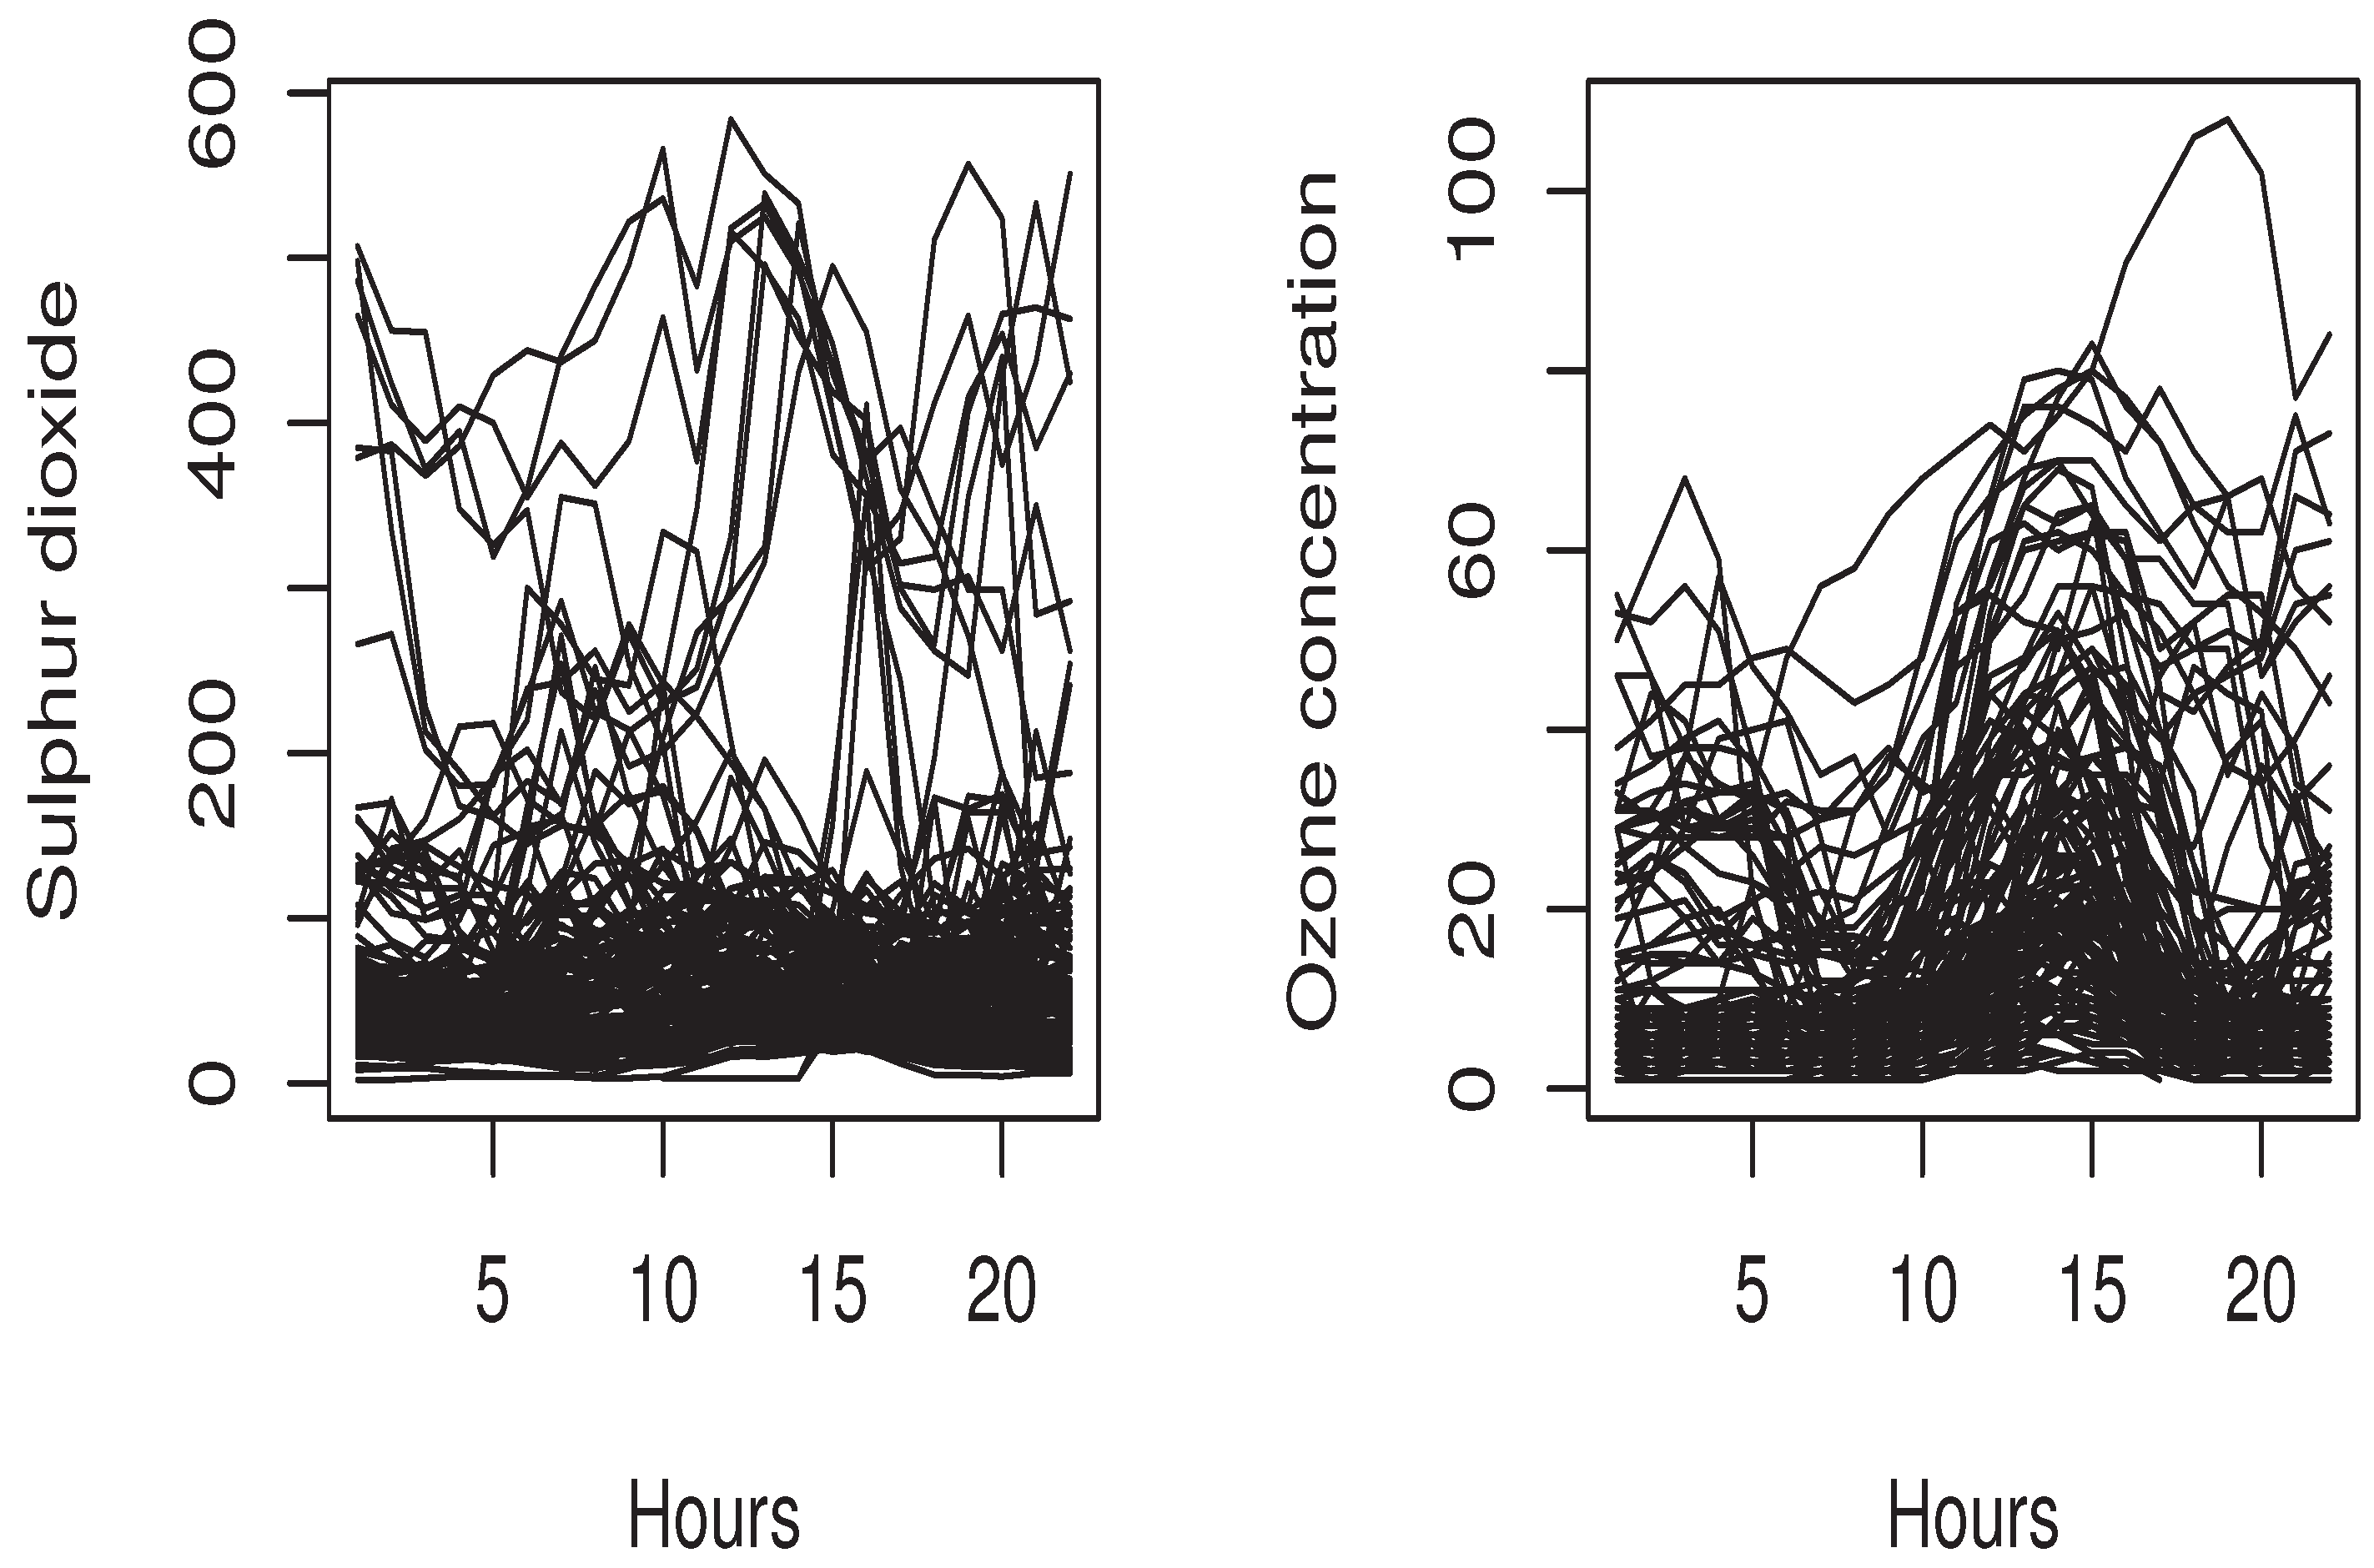
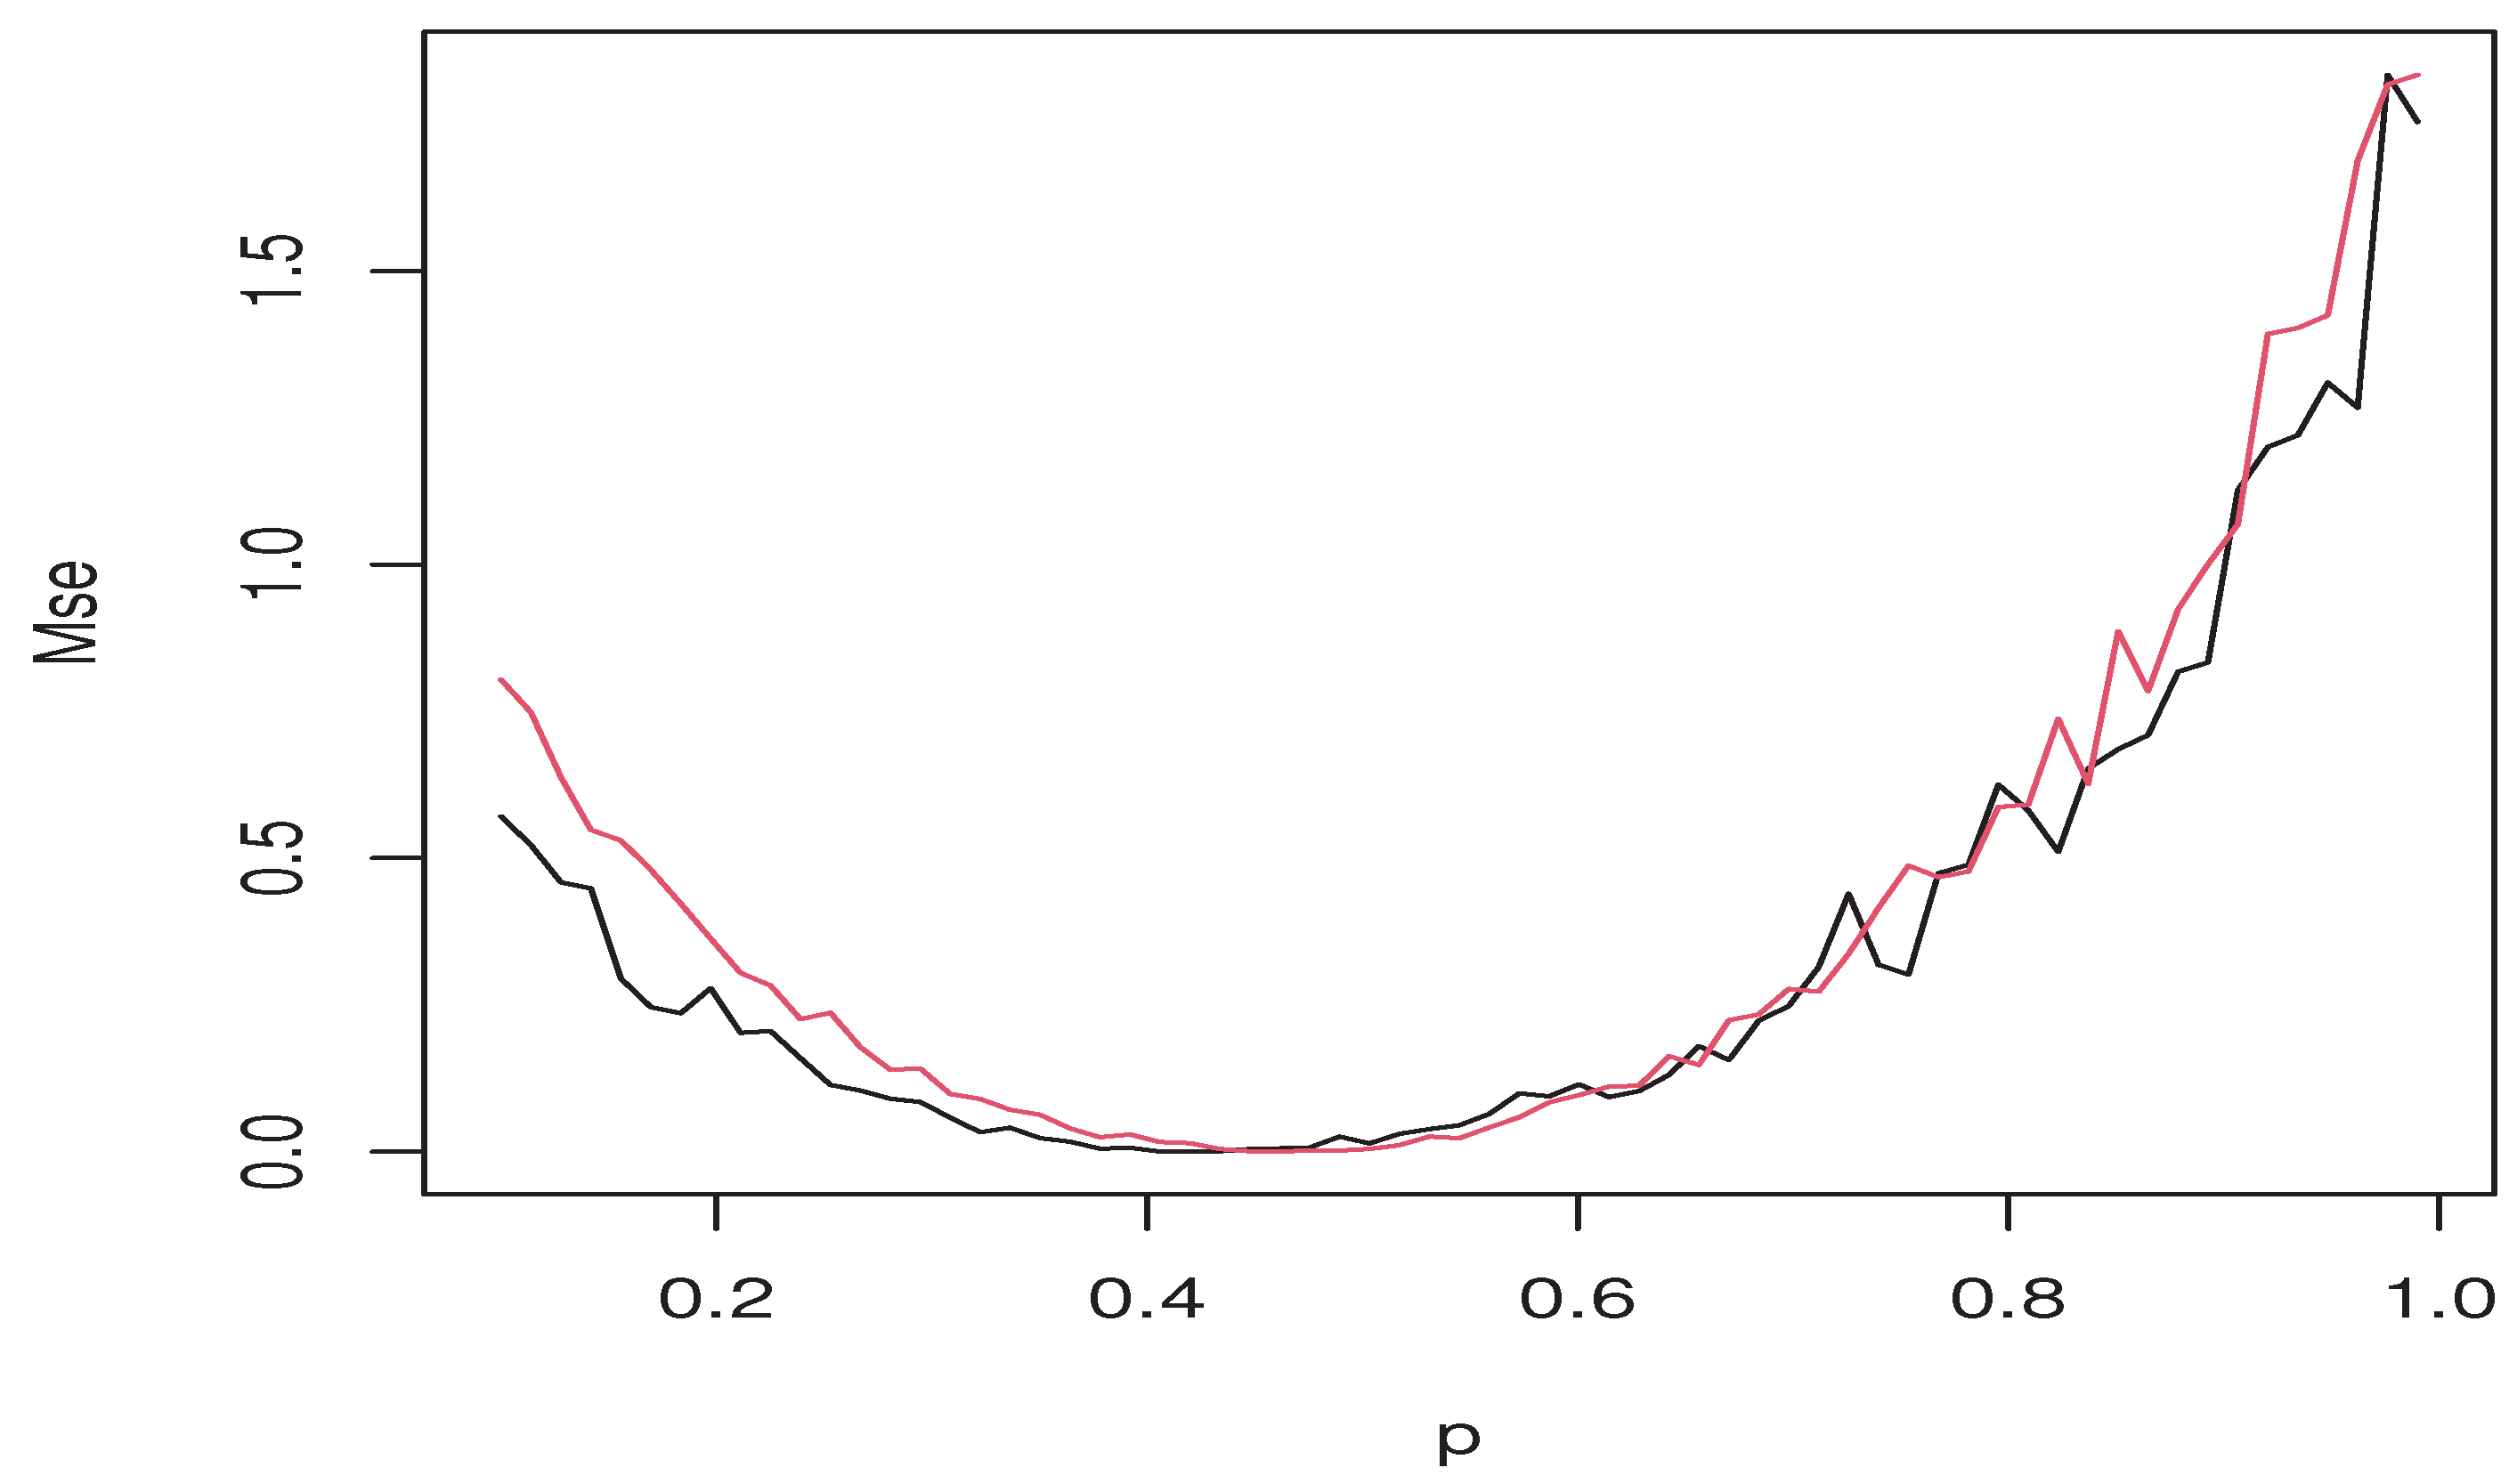
4.3. Real Data Application
5. Conclusions and Prospects
6. The Demonstration of Asymptotic Results
- (1)
- If and are bounded, then
- (2)
- If there exist three positive integers p, q and r, such that and and , then
- (1)
- If there exist and such that for all , then for all , and
- (2)
- If there exist such that , then for all and :where .
Author Contributions
Funding
Institutional Review Board Statement
Data Availability Statement
Acknowledgments
Conflicts of Interest
References
- Newey, W.K.; Powell, J.L. Asymmetric least squares estimation and testing. Econom. J. Econom. Soc. 1987, 55, 819–847. [Google Scholar] [CrossRef]
- Waltrup, L.S.; Sobotka, F.; Kneib, T.; Kauermann, G. Expectile and quantile regression—David and Goliath. Stat. Model. 2015, 15, 433–456. [Google Scholar] [CrossRef]
- Bellini, F.; Di Bernardino, E. Risk management with expectiles. Eur. J. Financ. 2017, 23, 487–506. [Google Scholar] [CrossRef]
- Bellini, F.; Negri, I.; Pyatkova, M. Backtesting VaR and expectiles with realized scores. Stat. Methods Appl. 2019, 28, 119–142. [Google Scholar] [CrossRef]
- Farooq, M.; Steinwart, I. Learning rates for kernel-based expectile regression. Mach. Learn. 2019, 108, 203–227. [Google Scholar] [CrossRef]
- Chakroborty, S.; Iyer, R.; Trindade, A.A. On the use of the M-quantiles for outlier detection in multivariate data. arXiv 2024, arXiv:2401.01628. [Google Scholar]
- Gu, Y.; Zou, H. High-dimensional generalizations of asymmetric least squares regression and their applications. Ann. Stat. 2016, 44, 2661–2694. [Google Scholar] [CrossRef]
- Zhao, J.; Chen, Y.; Zhang, Y. Expectile regression for analyzing heteroscedasticity in high dimension. Stat. Probab. Lett. 2018, 137, 304–311. [Google Scholar] [CrossRef]
- Kneib, T. Beyond mean regression. Stat. Model. 2013, 13, 275–303. [Google Scholar] [CrossRef]
- Mohammedi, M.; Bouzebda, S.; Laksaci, A. The consistency and asymptotic normality of the kernel type expectile regression estimator for functional data. J. Multivar. Anal. 2021, 181, 104673. [Google Scholar] [CrossRef]
- Girard, S.; Stupfler, G.; Usseglio-Carleve, A. Functional estimation of extreme conditional expectiles. Econom. Stat. 2022, 21, 131–158. [Google Scholar] [CrossRef]
- Artzner, P.; Delbaen, F.; Eber, J.M.; Heath, D. Coherent measures of risk. Math. Financ. 1999, 9, 203–228. [Google Scholar] [CrossRef]
- Righi, M.B.; Ceretta, P.S. A comparison of expected shortfall estimation models. J. Econ. Bus. 2015, 78, 14–47. [Google Scholar] [CrossRef]
- Lazar, E.; Pan, J.; Wang, S. On the estimation of Value-at-Risk and Expected Shortfall at extreme levels. J. Commod. Mark. 2024, 34, 100391. [Google Scholar] [CrossRef]
- Moutanabbir, K.; Bouaddi, M. A new non-parametric estimation of the expected shortfall for dependent financial losses. J. Stat. Plan. Inference 2024, 232, 106151. [Google Scholar] [CrossRef]
- Scaillet, O. Nonparametric estimation and sensitivity analysis of expected shortfall. Math. Financ. Int. J. Math. Stat. Financ. Econ. 2004, 14, 115–129. [Google Scholar] [CrossRef]
- Cai, Z.; Wang, X. Nonparametric estimation of conditional VaR and expected shortfall. J. Econom. 2008, 147, 120–130. [Google Scholar] [CrossRef]
- Wu, Y.; Yu, W.; Balakrishnan, N.; Wang, X. Nonparametric estimation of expected shortfall via Bahadur-type representation and Berry–Esséen bounds. J. Stat. Comput. Simul. 2022, 92, 544–566. [Google Scholar] [CrossRef]
- Ferraty, F.; Quintela-Del-Río, A. Conditional VAR and expected shortfall: A new functional approach. Econom. Rev. 2016, 35, 263–292. [Google Scholar] [CrossRef]
- Ait-Hennani, L.; Kaid, Z.; Laksaci, A.; Rachdi, M. Nonparametric estimation of the expected shortfall regression for quasi-associated functional data. Mathematics 2022, 10, 4508. [Google Scholar] [CrossRef]
- Fuchs, S.; Schlotter, R.; Schmidt, K.D. A review and some complements on quantile risk measures and their domain. Risks 2017, 5, 59. [Google Scholar] [CrossRef]
- Almanjahie, I.M.; Bouzebda, S.; Kaid, Z.; Laksaci, A. The local linear functional kNN estimator of the conditional expectile: Uniform consistency in number of neighbors. In Metrika; Springer: Berlin/Heidelberg, Germany, 2024; pp. 1–29. [Google Scholar]
- Litimein, O.; Laksaci, A.; Ait-Hennani, L.; Mechab, B.; Rachdi, M. Asymptotic normality of the local linear estimator of the functional expectile regression. J. Multivar. Anal. 2024, 202, 105281. [Google Scholar] [CrossRef]
- Aneiros, G.; Cao, R.; Fraiman, R.; Genest, C.; Vieu, P. Recent advances in functional data analysis and high-dimensional statistics. J. Multivar. Anal. 2019, 170, 3–9. [Google Scholar] [CrossRef]
- Goia, A.; Vieu, P. An introduction to recent advances in high/infinite dimensional statistics [Editorial]. J. Multivar. Anal. 2016, 170, 1–6. [Google Scholar]
- Yu, D.; Pietrosanu, M.; Mizera, I.; Jiang, B.; Kong, L.; Tu, W. Functional Linear Partial Quantile Regression with Guaranteed Convergence for Neuroimaging Data Analysis. In Statistics in Biosciences; Springer: Berlin/Heidelberg, Germany, 2024; pp. 1–17. [Google Scholar]
- Di Bernardino, E.; Laloe, T.; Pakzad, C. Estimation of extreme multivariate expectiles with functional covariates. J. Multivar. Anal. 2024, 202, 105292. [Google Scholar] [CrossRef]
- Jones, D.A.; Cox, D.R. Nonlinear autoregressive pro cesses. Proc. R. Soc. Lond. A Math. Phys. Sci. 1978, 360, 71–95. [Google Scholar]
- Ozaki, T. Non-linear time series models for non-linear random vibrations. J. Appl. Prob. 1980, 17, 84–93. [Google Scholar] [CrossRef]
- Engle, R.F. Autoregressive conditional heteroskedasticity with estimates of the variance of U.K. inflation. Econometrica 1982, 50, 987–1007. [Google Scholar] [CrossRef]
- Bollerslev, T. Generalized autoregressive conditional heteroskedasticity. J. Econom. 1986, 31, 307–327. [Google Scholar] [CrossRef]
- Li, W.V.; Shao, Q.M. Gaussian processes: Inequalities, small ball probabilities and applications. Handb. Stat. 2001, 19, 533–597. [Google Scholar]
- Hörmann, S.; Kidziński, Ł.; Hallin, M. Dynamic functional principal components. J. R. Stat. Soc. Ser. Stat. Methodol. 2015, 77, 319–348. [Google Scholar] [CrossRef]
- Kanellopoulou, S.; Panas, E. Empirical distributions of stock returns: Paris stock market, 1980–2003. Appl. Financ. Econ. 2008, 16, 1289–1302. [Google Scholar] [CrossRef]
- Bersimis, S.; Degiannakis, S.; Georgakellos, D. Real-time monitoring of carbon monoxide using value-at-risk measure and control charting. J. Appl. Stat. 2017, 44, 89–108. [Google Scholar] [CrossRef]
- Ferraty, F.; Vieu, P. Nonparametric Functional Data Analysis: Theory and Practice; Springer Series in Statistics; Springer: New York, NY, USA, 2006. [Google Scholar]
- Masry, E. Recursive probability density estimation for weakly dependent stationary processes. IEEE Trans. Inf. Theory 1986, 32, 254–267. [Google Scholar] [CrossRef]


| Conditional Distribution | Level of Dependency | p | |||
|---|---|---|---|---|---|
| Normal distribution | Strong dependency | ||||
| 0.01 | 0.138 | 0.554 | 0.446 | ||
| 0.05 | 0.125 | 0.447 | 0.436 | ||
| 0.90 | 0.102 | 0.428 | 0.414 | ||
| 0.95 | 0.162 | 0.374 | 0.367 | ||
| Normal distribution | Medium dependency | ||||
| 0.01 | 0.098 | 0.311 | 0.308 | ||
| 0.05 | 0.081 | 0.302 | 0.293 | ||
| 0.90 | 0.075 | 0.282 | 0.176 | ||
| 0.95 | 0.093 | 0.203 | 0.199 | ||
| Normal distribution | Moderate dependency | ||||
| 0.01 | 0.049 | 0.161 | 0.154 | ||
| 0.05 | 0.062 | 0.181 | 0.171 | ||
| 0.90 | 0.051 | 0.168 | 0.160 | ||
| 0.95 | 0.073 | 0.192 | 0.182 | ||
| Lévy distribution | Strong dependency | ||||
| 0.01 | 0.610 | 0.581 | 0.472 | ||
| 0.05 | 0.630 | 0.532 | 0.423 | ||
| 0.90 | 0.310 | 0.442 | 0.309 | ||
| 0.95 | 0.280 | 0.364 | 0.251 | ||
| Lévy distribution | Medium dependency | ||||
| 0.01 | 0.290 | 0.271 | 0.235 | ||
| 0.05 | 0.090 | 0.182 | 0.111 | ||
| 0.90 | 0.051 | 0.113 | 0.102 | ||
| 0.95 | 0.154 | 0.117 | 0.106 | ||
| Lévy distribution | Moderate dependency | ||||
| 0.01 | 0.151 | 0.241 | 0.192 | ||
| 0.05 | 0.128 | 0.214 | 0.189 | ||
| 0.90 | 0.033 | 0.217 | 0.195 | ||
| 0.95 | 0.038 | 0.143 | 0.117 |
| Cases | p = 0.99 | p = 0.5 | p = 0.1 | p = 0.05 | p = 0.01 |
|---|---|---|---|---|---|
| ES expectile | 1.76 | 0.14 | 0.53 | 0.48 | 0.56 |
| ES quantile | 1.79 | 0.18 | 0.38 | 0.68 | 0.88 |
Disclaimer/Publisher’s Note: The statements, opinions and data contained in all publications are solely those of the individual author(s) and contributor(s) and not of MDPI and/or the editor(s). MDPI and/or the editor(s) disclaim responsibility for any injury to people or property resulting from any ideas, methods, instructions or products referred to in the content. |
© 2024 by the authors. Licensee MDPI, Basel, Switzerland. This article is an open access article distributed under the terms and conditions of the Creative Commons Attribution (CC BY) license (https://creativecommons.org/licenses/by/4.0/).
Share and Cite
Alamari, M.B.; Almulhim, F.A.; Kaid, Z.; Laksaci, A. Nonparametric Expectile Shortfall Regression for Complex Functional Structure. Entropy 2024, 26, 798. https://doi.org/10.3390/e26090798
Alamari MB, Almulhim FA, Kaid Z, Laksaci A. Nonparametric Expectile Shortfall Regression for Complex Functional Structure. Entropy. 2024; 26(9):798. https://doi.org/10.3390/e26090798
Chicago/Turabian StyleAlamari, Mohammed B., Fatimah A. Almulhim, Zoulikha Kaid, and Ali Laksaci. 2024. "Nonparametric Expectile Shortfall Regression for Complex Functional Structure" Entropy 26, no. 9: 798. https://doi.org/10.3390/e26090798
APA StyleAlamari, M. B., Almulhim, F. A., Kaid, Z., & Laksaci, A. (2024). Nonparametric Expectile Shortfall Regression for Complex Functional Structure. Entropy, 26(9), 798. https://doi.org/10.3390/e26090798


