Article

The Application of Pinch Technology to a Novel Closed-Loop Spray Drying System with a Condenser and Reheater

Drying and Process Technology Group, School of Chemical and Biomolecular Engineering, Building J01, The University of Sydney, Darlington, NSW 2006, Australia
*
Author to whom correspondence should be addressed.
Entropy 2024, 26(9), 809; https://doi.org/10.3390/e26090809
Submission received: 19 August 2024 / Revised: 15 September 2024 / Accepted: 19 September 2024 / Published: 23 September 2024
(This article belongs to the Special Issue Thermal Science and Engineering Applications)

Abstract

:
Spray drying is an energy-intensive process in industrial use, making energy recovery a critical focus for improving overall efficiency. This study investigates the potential of integrating heat-recovery systems, including an innovative air reheater, into a closed-loop spray-drying unit to maximise energy savings. Through detailed pinch analysis, the system achieved a very low approach temperature, averaging 3.48 K, which is significantly lower than that of conventional open-loop systems. The study quantifies the energy-recovery potential by demonstrating that the integration of heat-recovery components can reduce the external heating demand by up to 30%. This not only enhances heat-transfer efficiency but also lowers operational costs and reduces the system’s environmental impact. The results suggest that closed-loop systems with air reheaters offer a scalable solution for improving energy efficiency across different industrial applications. The research highlights a new paradigm: focusing on latent energy within the system rather than adjusting individual operational variables.

1. Introduction

A drying system separates liquid or moisture from a substance through controlled heat, mass, and momentum transfer [1]. Drying preserves the dried materials and reduces product volume and weight, facilitating storage and handling. It is a traditional preservation method, extending back thousands of years [2], now utilized across various industries, such as industries producing timber, polymers, ceramics, minerals, and pharmaceuticals [3]. Spray dryers are examples of dryers that are used to produce powders from solutions or slurries. A basic open-loop spray-drying system involves discharging the drying gas into the wider environment at the end of the dryer. However, this drying gas contains a large amount of thermal energy which is removed from the system when the gas is discharged, decreasing the overall energy utilisation of the equipment. Energy conservation and process optimisation are important in industries where large-scale drying processes, such as spray drying, dominate operations [4]. Traditionally, the focus has been on open-loop systems, where significant energy losses occur due to the exhaust of hot drying gases. This study improves on open-loop approaches by focusing on closed-loop systems, a design that inherently recycles energy, making it an ideal candidate for advanced heat- recovery technologies. Closed-loop spray-drying systems present a unique opportunity to significantly improve thermal efficiency by capturing and reusing waste heat through a carefully designed heat-recovery network [5].
Closed loops have been used within superheated steam-drying systems for some time and there is considerable research into them [6]. This is because condensation of the outlet steam is relatively straightforward and recovers the latent heat of vaporisation for water. Superheated steam is also faster during the falling-rate drying period above the inversion temperature [7], where the drying rate decreases as water activity within the material decreases. The higher thermal conductivity and heat capacity of superheated steam leads to higher drying rates for surface moisture above the inversion temperature [8]. To analyse energy consumption more comprehensively in different drying scenarios, the concepts of pinch analysis were developed [9].
Pinch analysis involves identifying the location and magnitude of energy losses in the process, and then using this information to develop a strategy to reduce these losses [10]. It is based on the concept of a “pinch point”, the location in the process where the temperature difference between hot and cold streams is at a minimum. Once this pinch point is calculated, the process conditions are then adjusted to minimise energy losses and to minimise the total hot and cold utilities [11]. It is a key part of process integration, where interactions between unit operations are considered, rather than analysing each unit separately.
Pinch analysis is often used in situations where the hot and cold streams have a large temperature difference, and where heating and cooling are both required in the operation. It has been commonplace in distillation columns due to this feature, but it is suitable for any operation which contains both a heating element and a cooling element [12]. In the case of a closed-loop dryer, the heating element is the hot feed gas, and the cooling element is the condenser loop. By connecting the hot outlet stream to the cold inlet stream with a heat exchanger, overall energy use can be significantly lowered. The hot air leaving the spray dryer can be reused. The recycled heat can also be used to heat the liquid solution before atomisation, reducing the energy requirement for evaporation. Pinch analysis can also help identify opportunities for process optimisation and design changes to be implemented to reduce energy consumption in spray drying [13]. The spray dryer’s design can be altered to improve heat-transfer efficiency between the liquid solution and hot air. For example, it can be used to determine the optimal location and heat of the atomisation nozzle, which can improve the efficiency of the drying process and reduce energy consumption.
For the pinch analysis of the open-loop system, the external temperature often has a significant impact on the pinch analysis of the entire system [14]. In the closed-loop system, any unused thermal energy is returned to the dryer [15]. The closed-loop system is more complex than an open-loop system, so it provides more parameters for adjustment, increasing the optimisation opportunities of the system. For the closed-loop spray-drying system used in this study, cooling the dryer walls by heating recirculating water for the air reheater is beneficial for reducing the deposition of particles on the walls.
The objective of this work was to use pinch analysis to analyse and assess the energy efficiency of a novel closed-loop spray-drying system containing a condenser and reheater. The novelty of the pinch analysis is that it was applied to the analysis of this closed-loop spray-drying system. This system has the advanced aspect of having two interconnected countercurrent loops, one of which is the drying air stream, with the other being the water stream which carries energy back to an air reheater. The air reheater is a new aspect of this closed-loop system that has not been previously reported. Technically, this work assesses the performance of a novel closed-loop spray-drying system containing a condenser and reheater using pinch analysis, providing an accessible and easily used analytical approach to a novel drying system, which is a technically useful advance.

2. Materials and Methods

2.1. Modelling of Spray Dryer

Following the finer-scale parallel flow/plug flow approach outlined in Langrish (2009) [15], the modelling approach divides the spray dryer into a sequence of control volumes, over which mass and energy balances are performed, and also over which calculations are carried out to estimate heat and mass-transfer rates between the particles or droplets and the gas. The calculation of heat-transfer rates includes estimates of heat losses from the dryer, and the concept of a Characteristic Drying Curve has been used to model the drying kinetics, which are an important part of the mass-transfer calculations.

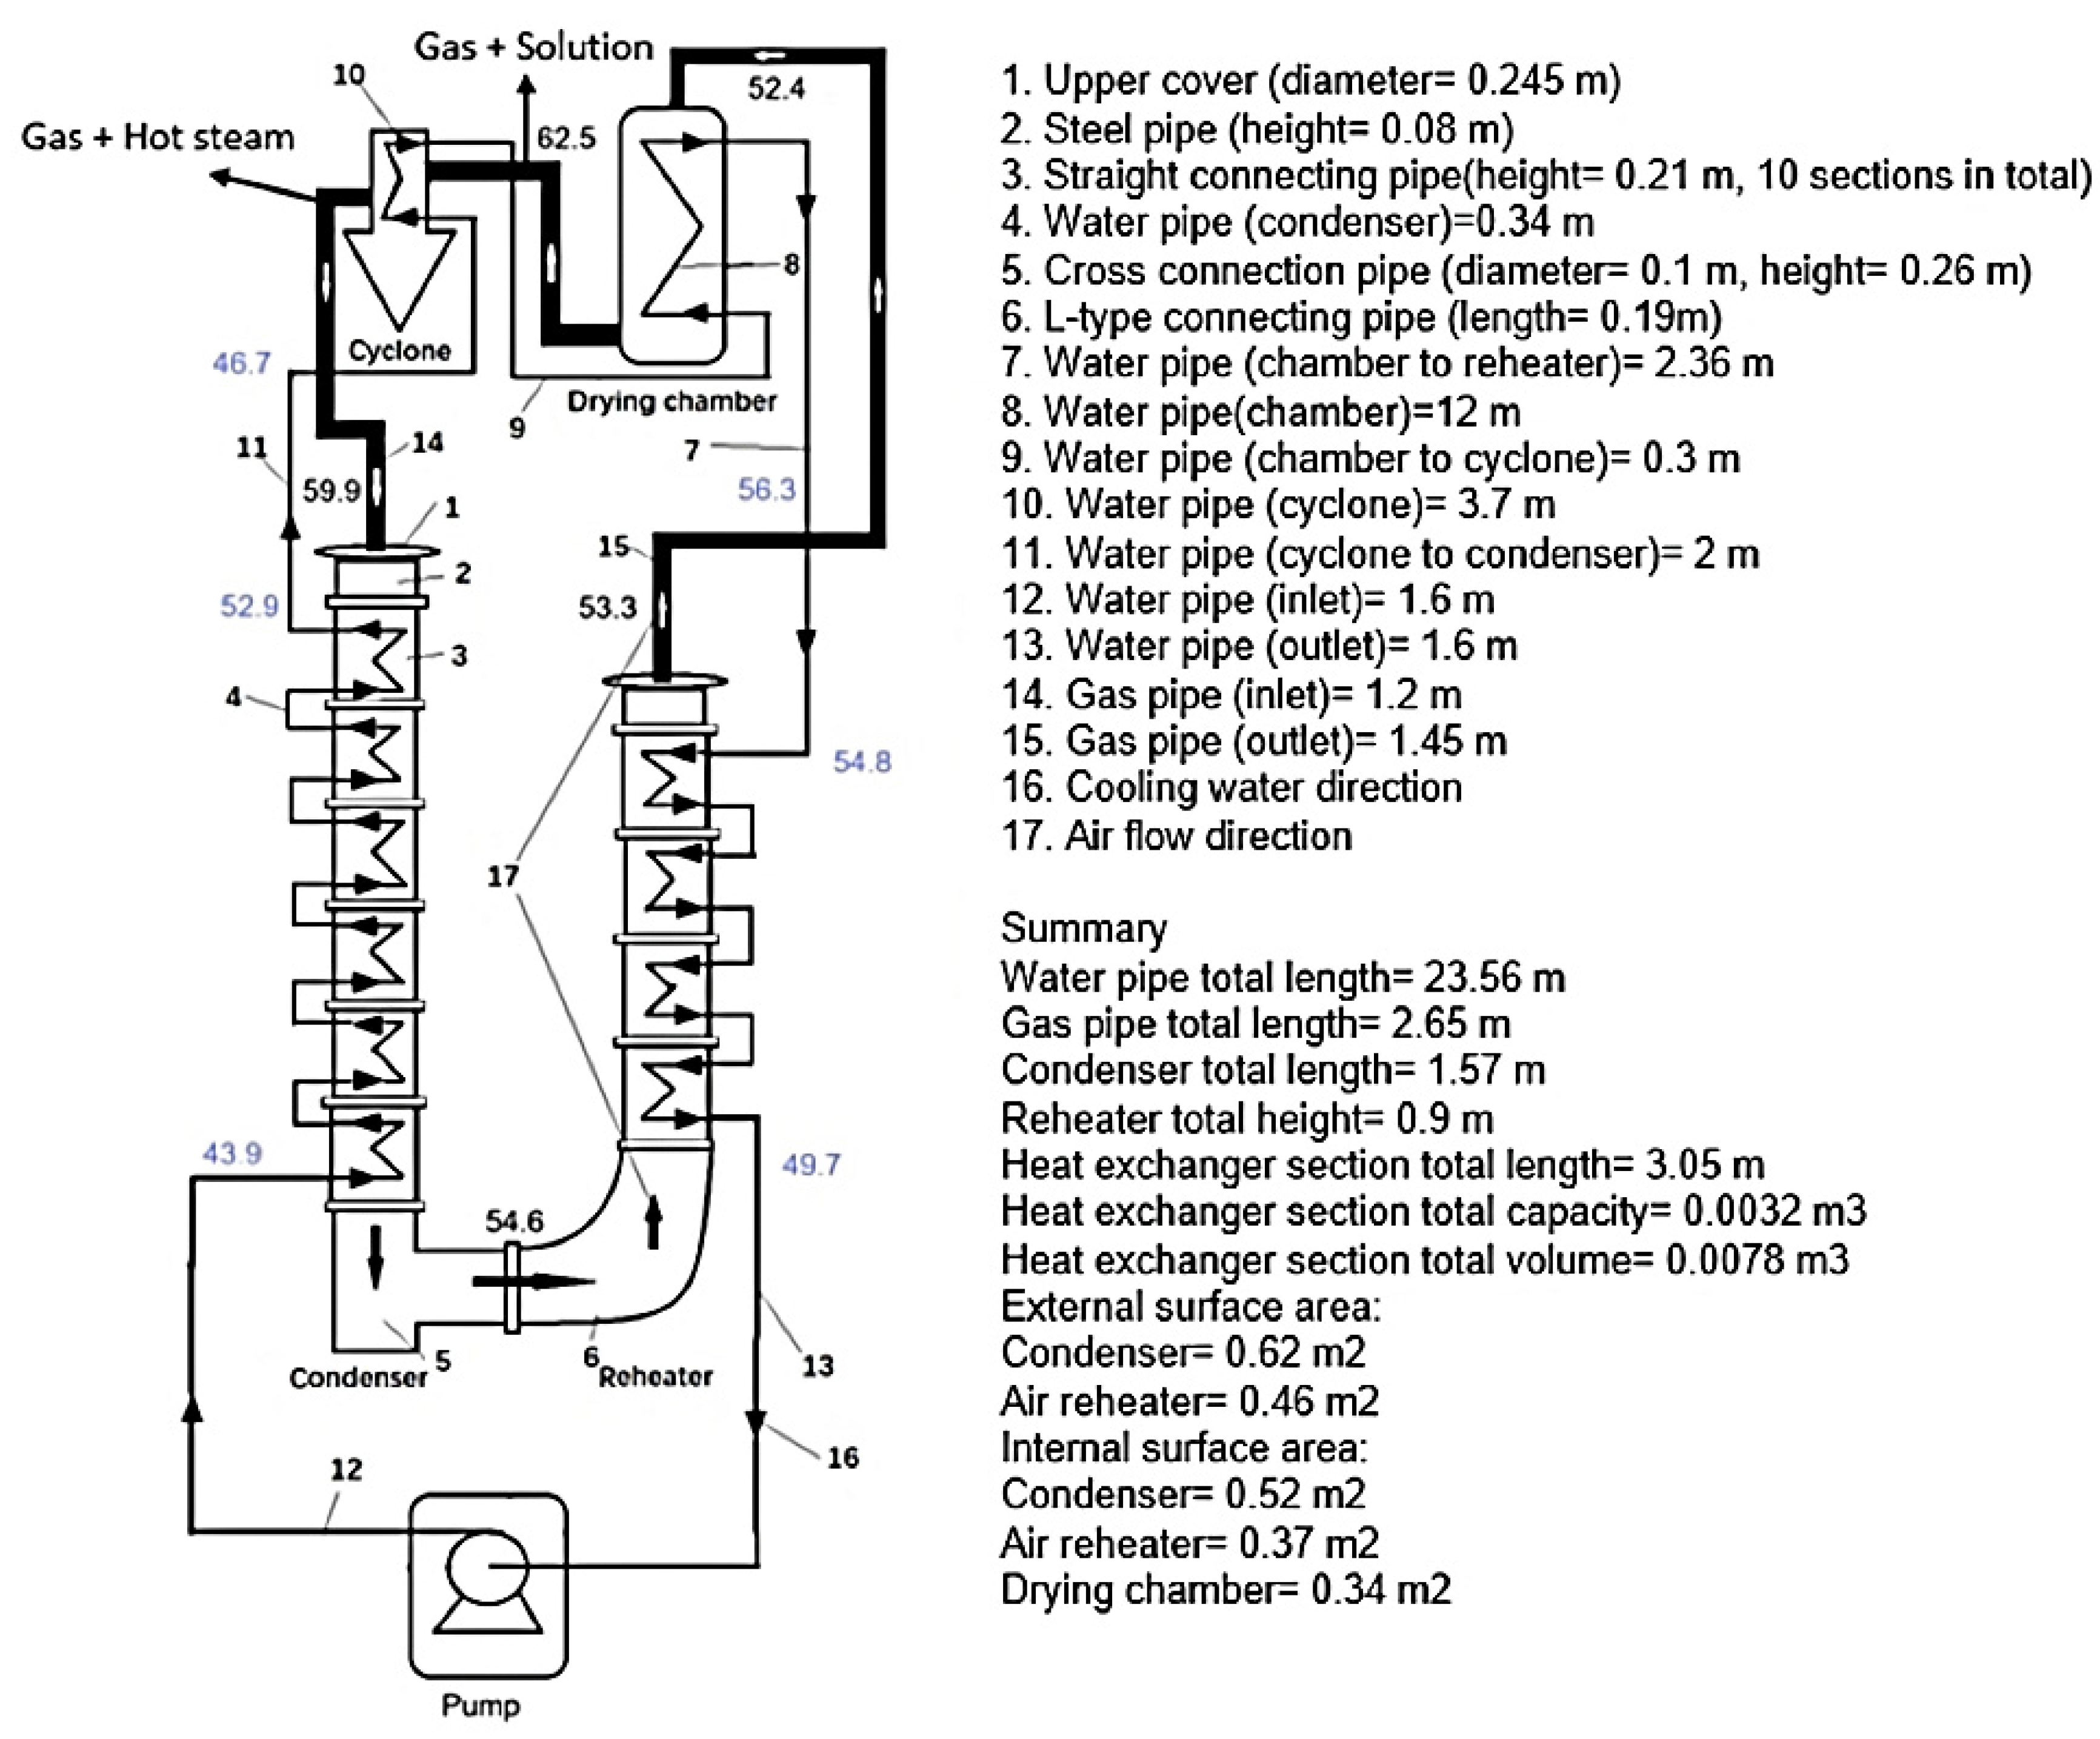
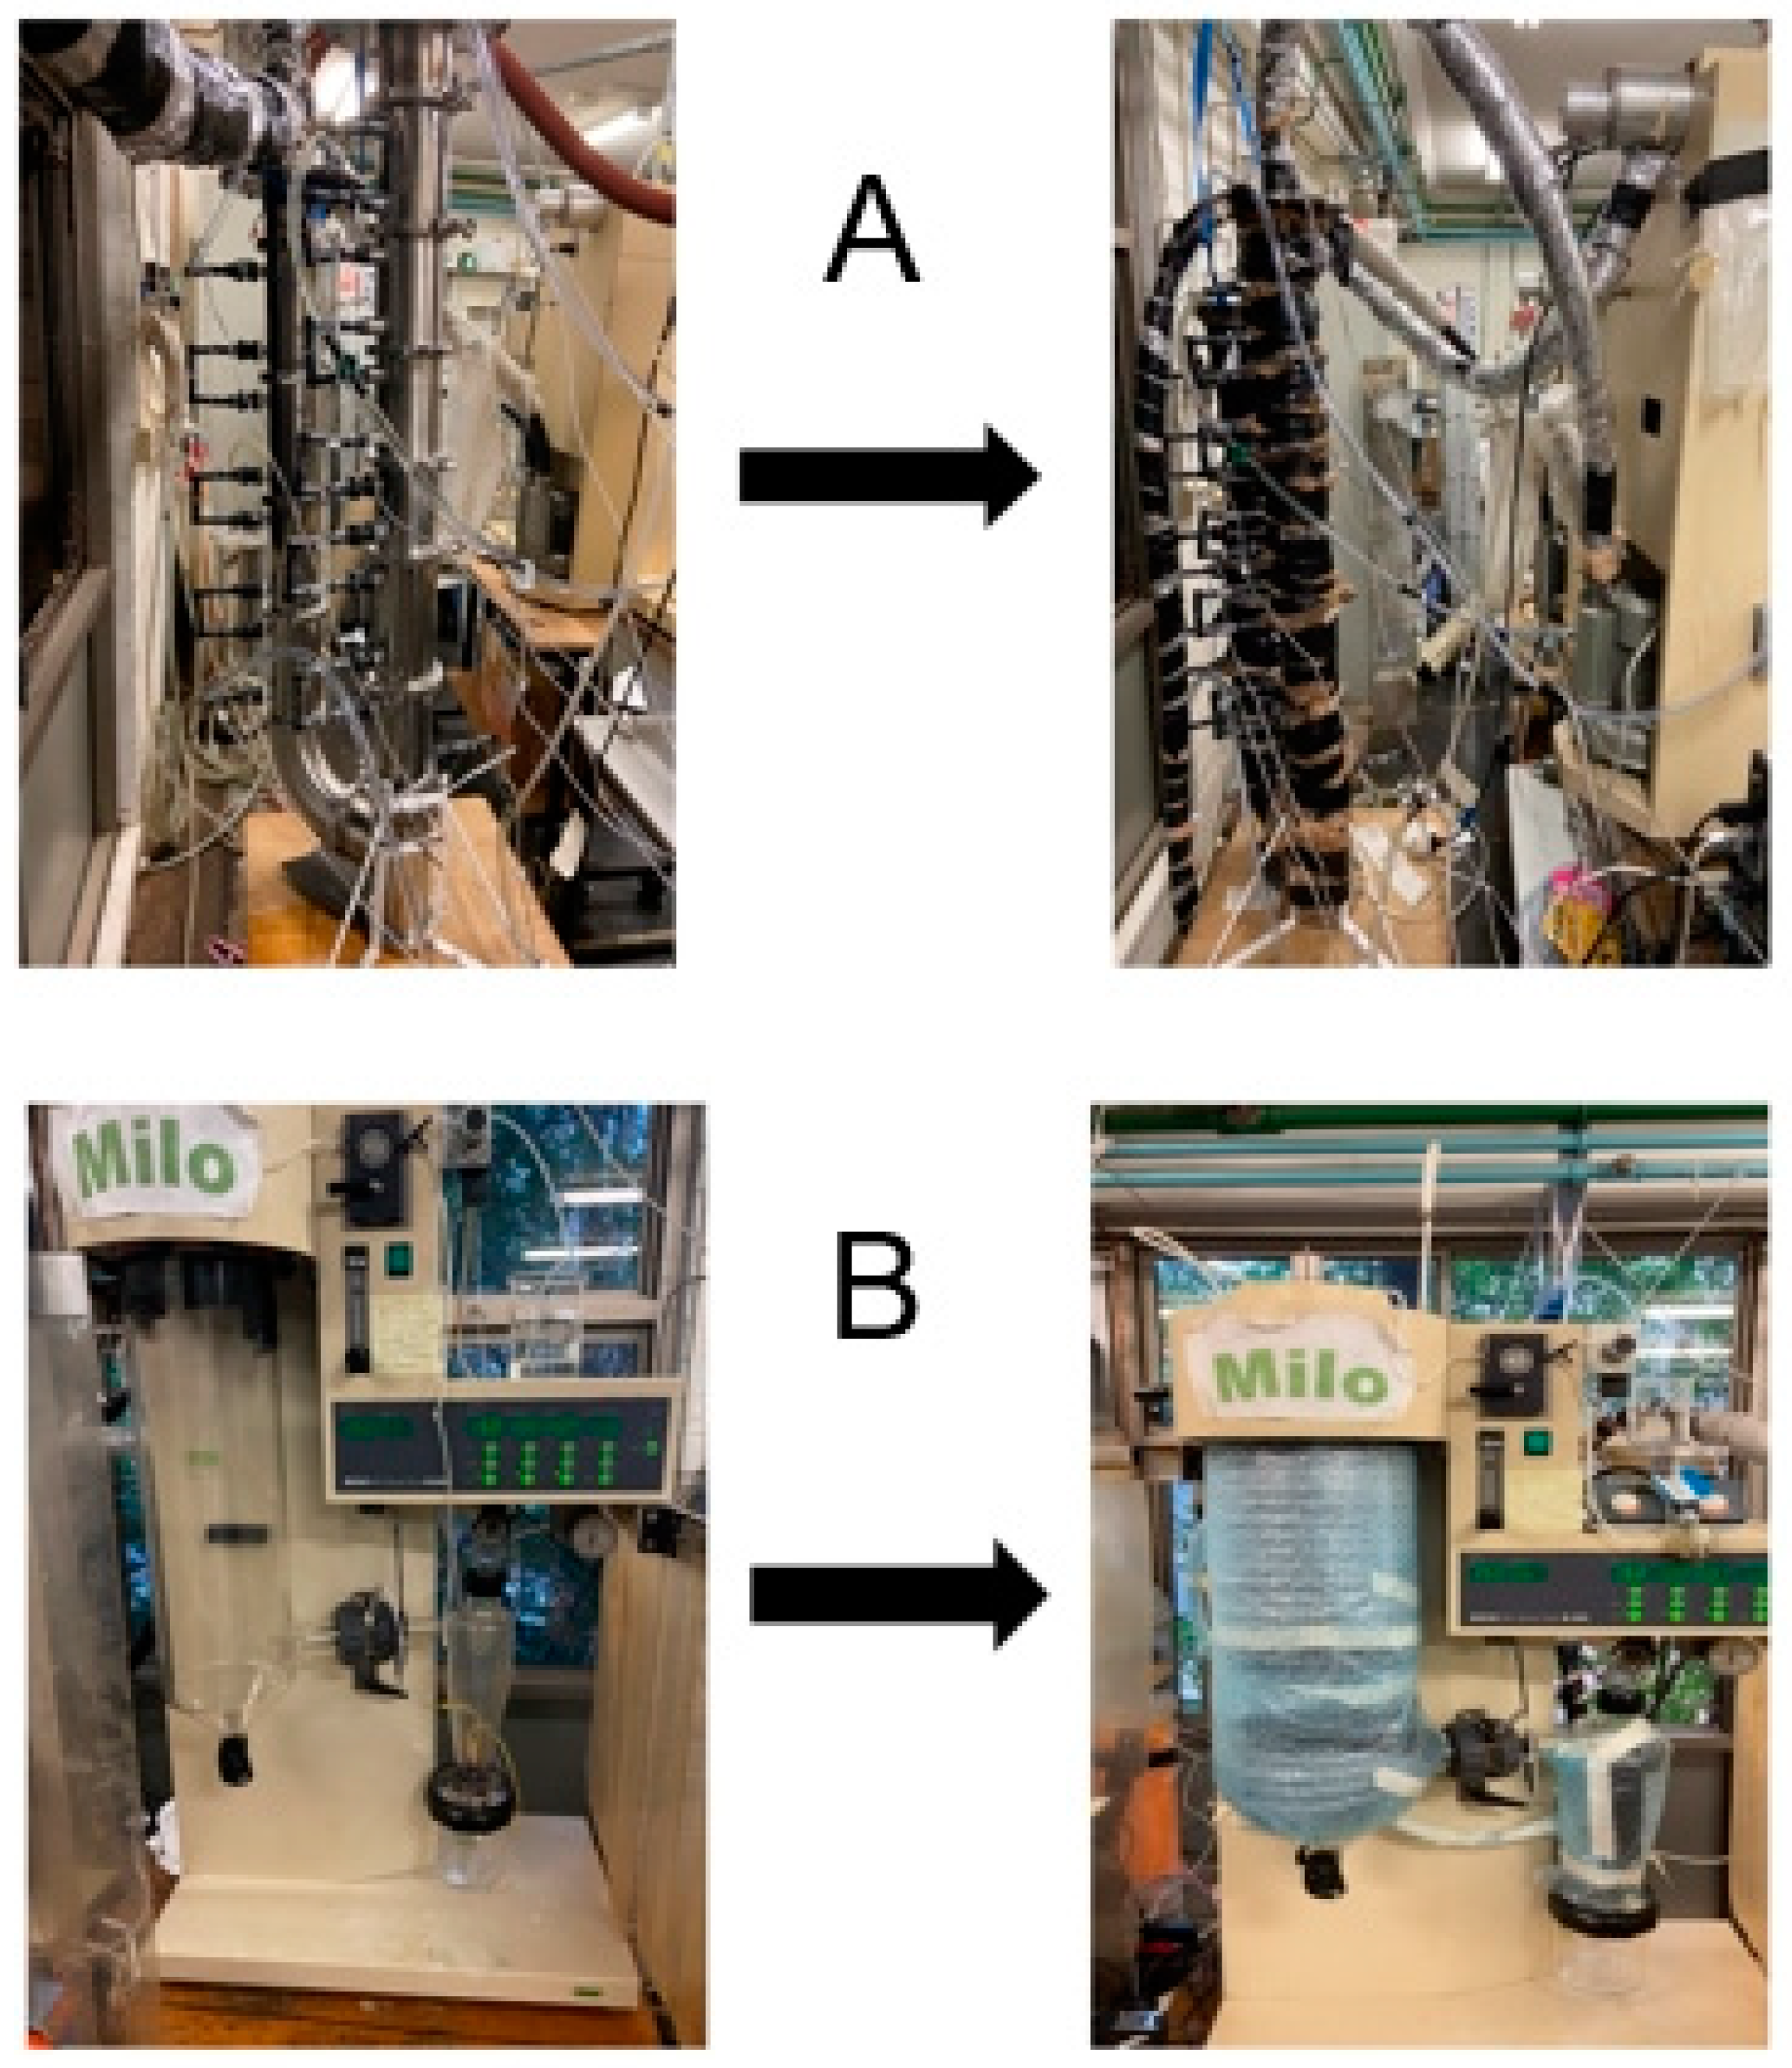
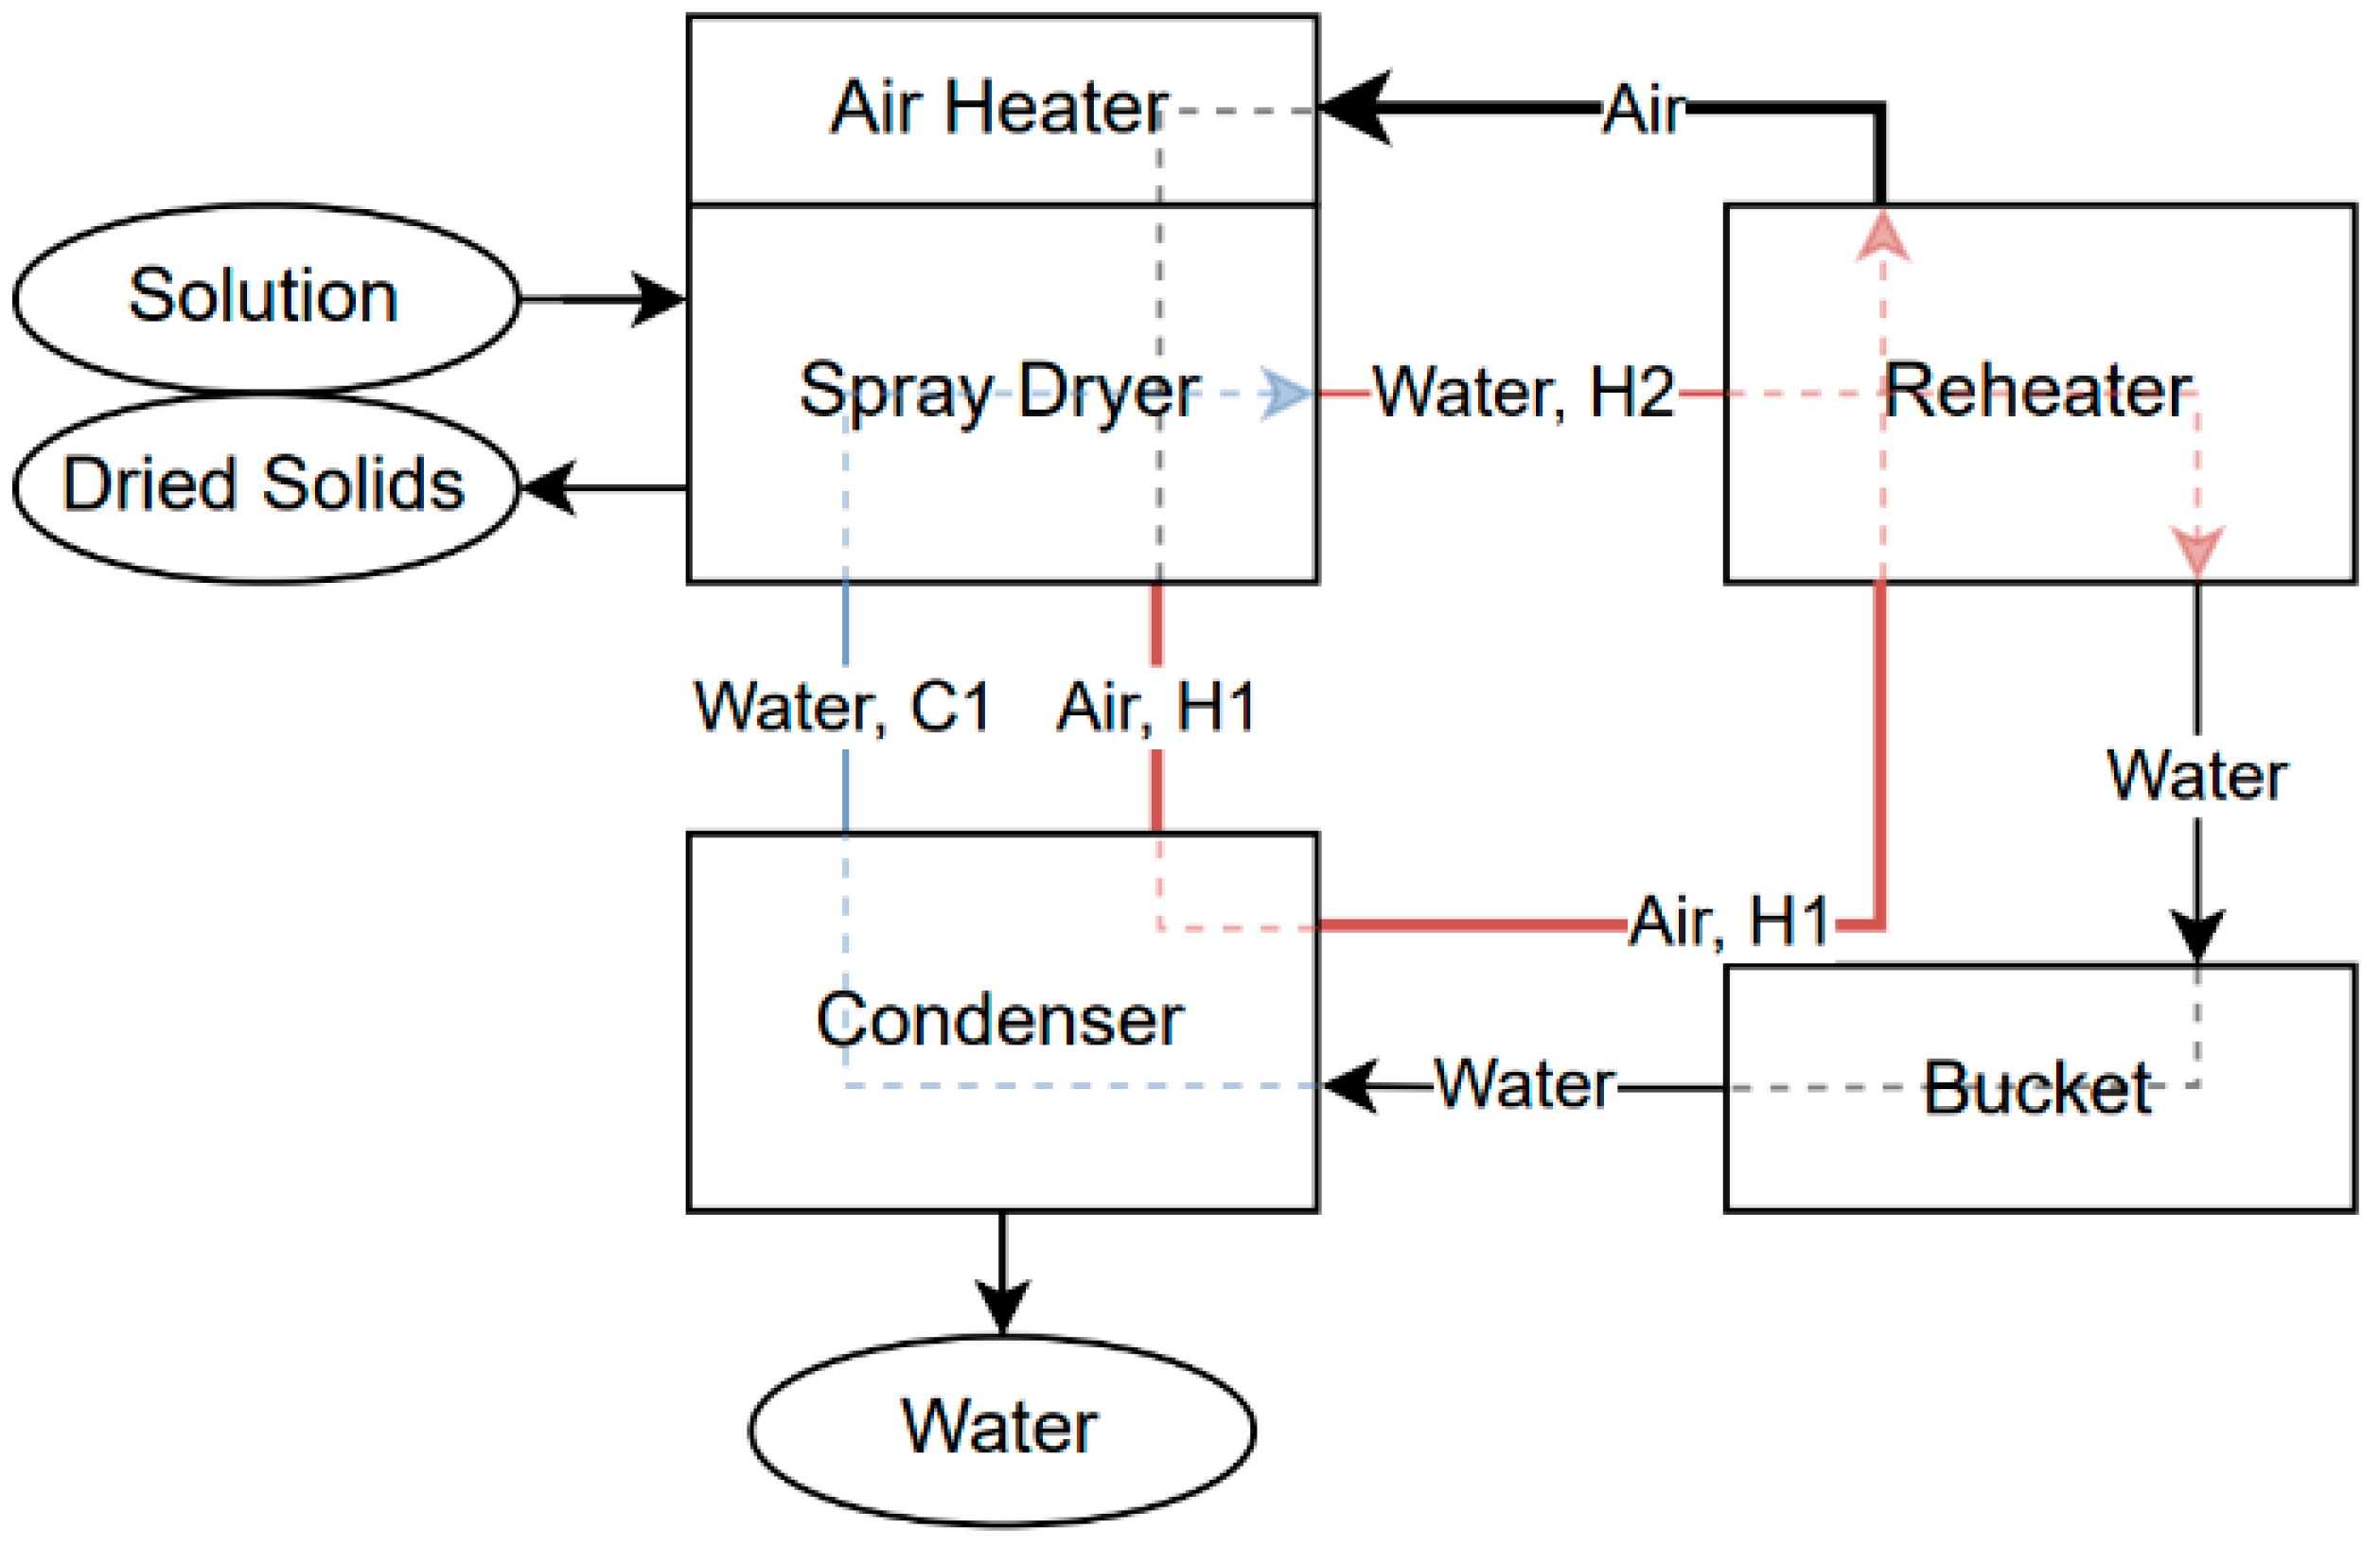
2.2. Experimental Setup

The closed-loop spray-drying system with condenser and air reheater is shown in Figure 1. The air pipes are specially marked, and the remaining connections are condensate pipes. The equipment used is a Buchi B-290 Mini Spray Dryer (Büchi, Switzerland), connected to a condenser and reheater loop. A photograph of the condenser setup is shown in Figure 2A. The solution being sprayed enters at the spray nozzle of the dryer, where it is then sprayed through the spray chamber into the cyclone and separated into its liquid and solid components. The warm, humid air enters the condenser, where the water is condensed and cooled down by a cooling water stream. The condensate liquid is removed after the condenser stage. The cool, drier gas is then sent to an air heater and heated up to the required dryer fluid temperature and used to dry more solution.
Temperature probes were placed at points around the spray dryer, where it was then used until it was found to be at steady state. This was repeated multiple times with different flow rates and system configurations. This was covered in insulation in some later tests. Water was also pumped in vinyl tubing around the dryer and cyclone to recycle heat lost to the environment. This arrangement is displayed photographically in Figure 2B.

2.3. Operating Conditions and Parameters

Different flow rates of water were tested by altering the speed of the feed pump located within the bucket water reservoir. Similarly, by adjusting the aspirator and pump rate, the flow of sprayed solution was changed [17]. To determine the ability of the system to run with other solutions, reconstituted powdered milk was also examined. Each set of experiments first pumped water for 30 min to allow the equipment to reach steady state. Parameters which were tested are listed in Table A1.

2.4. Preliminary Pinch Analysis Information

The gathered data was further analysed using heat integration and pinch analysis. MATLAB (R2023b) was used to aid in computation, combined with Microsoft Excel, which was also used for the initial data management and temporary graphing. The setup at the time of experimentation is demonstrated diagrammatically in Figure 3, along with the heat flows and hot and cold streams. As can be seen, three streams were located for pinch analysis: two hot and one cold.

3. Results

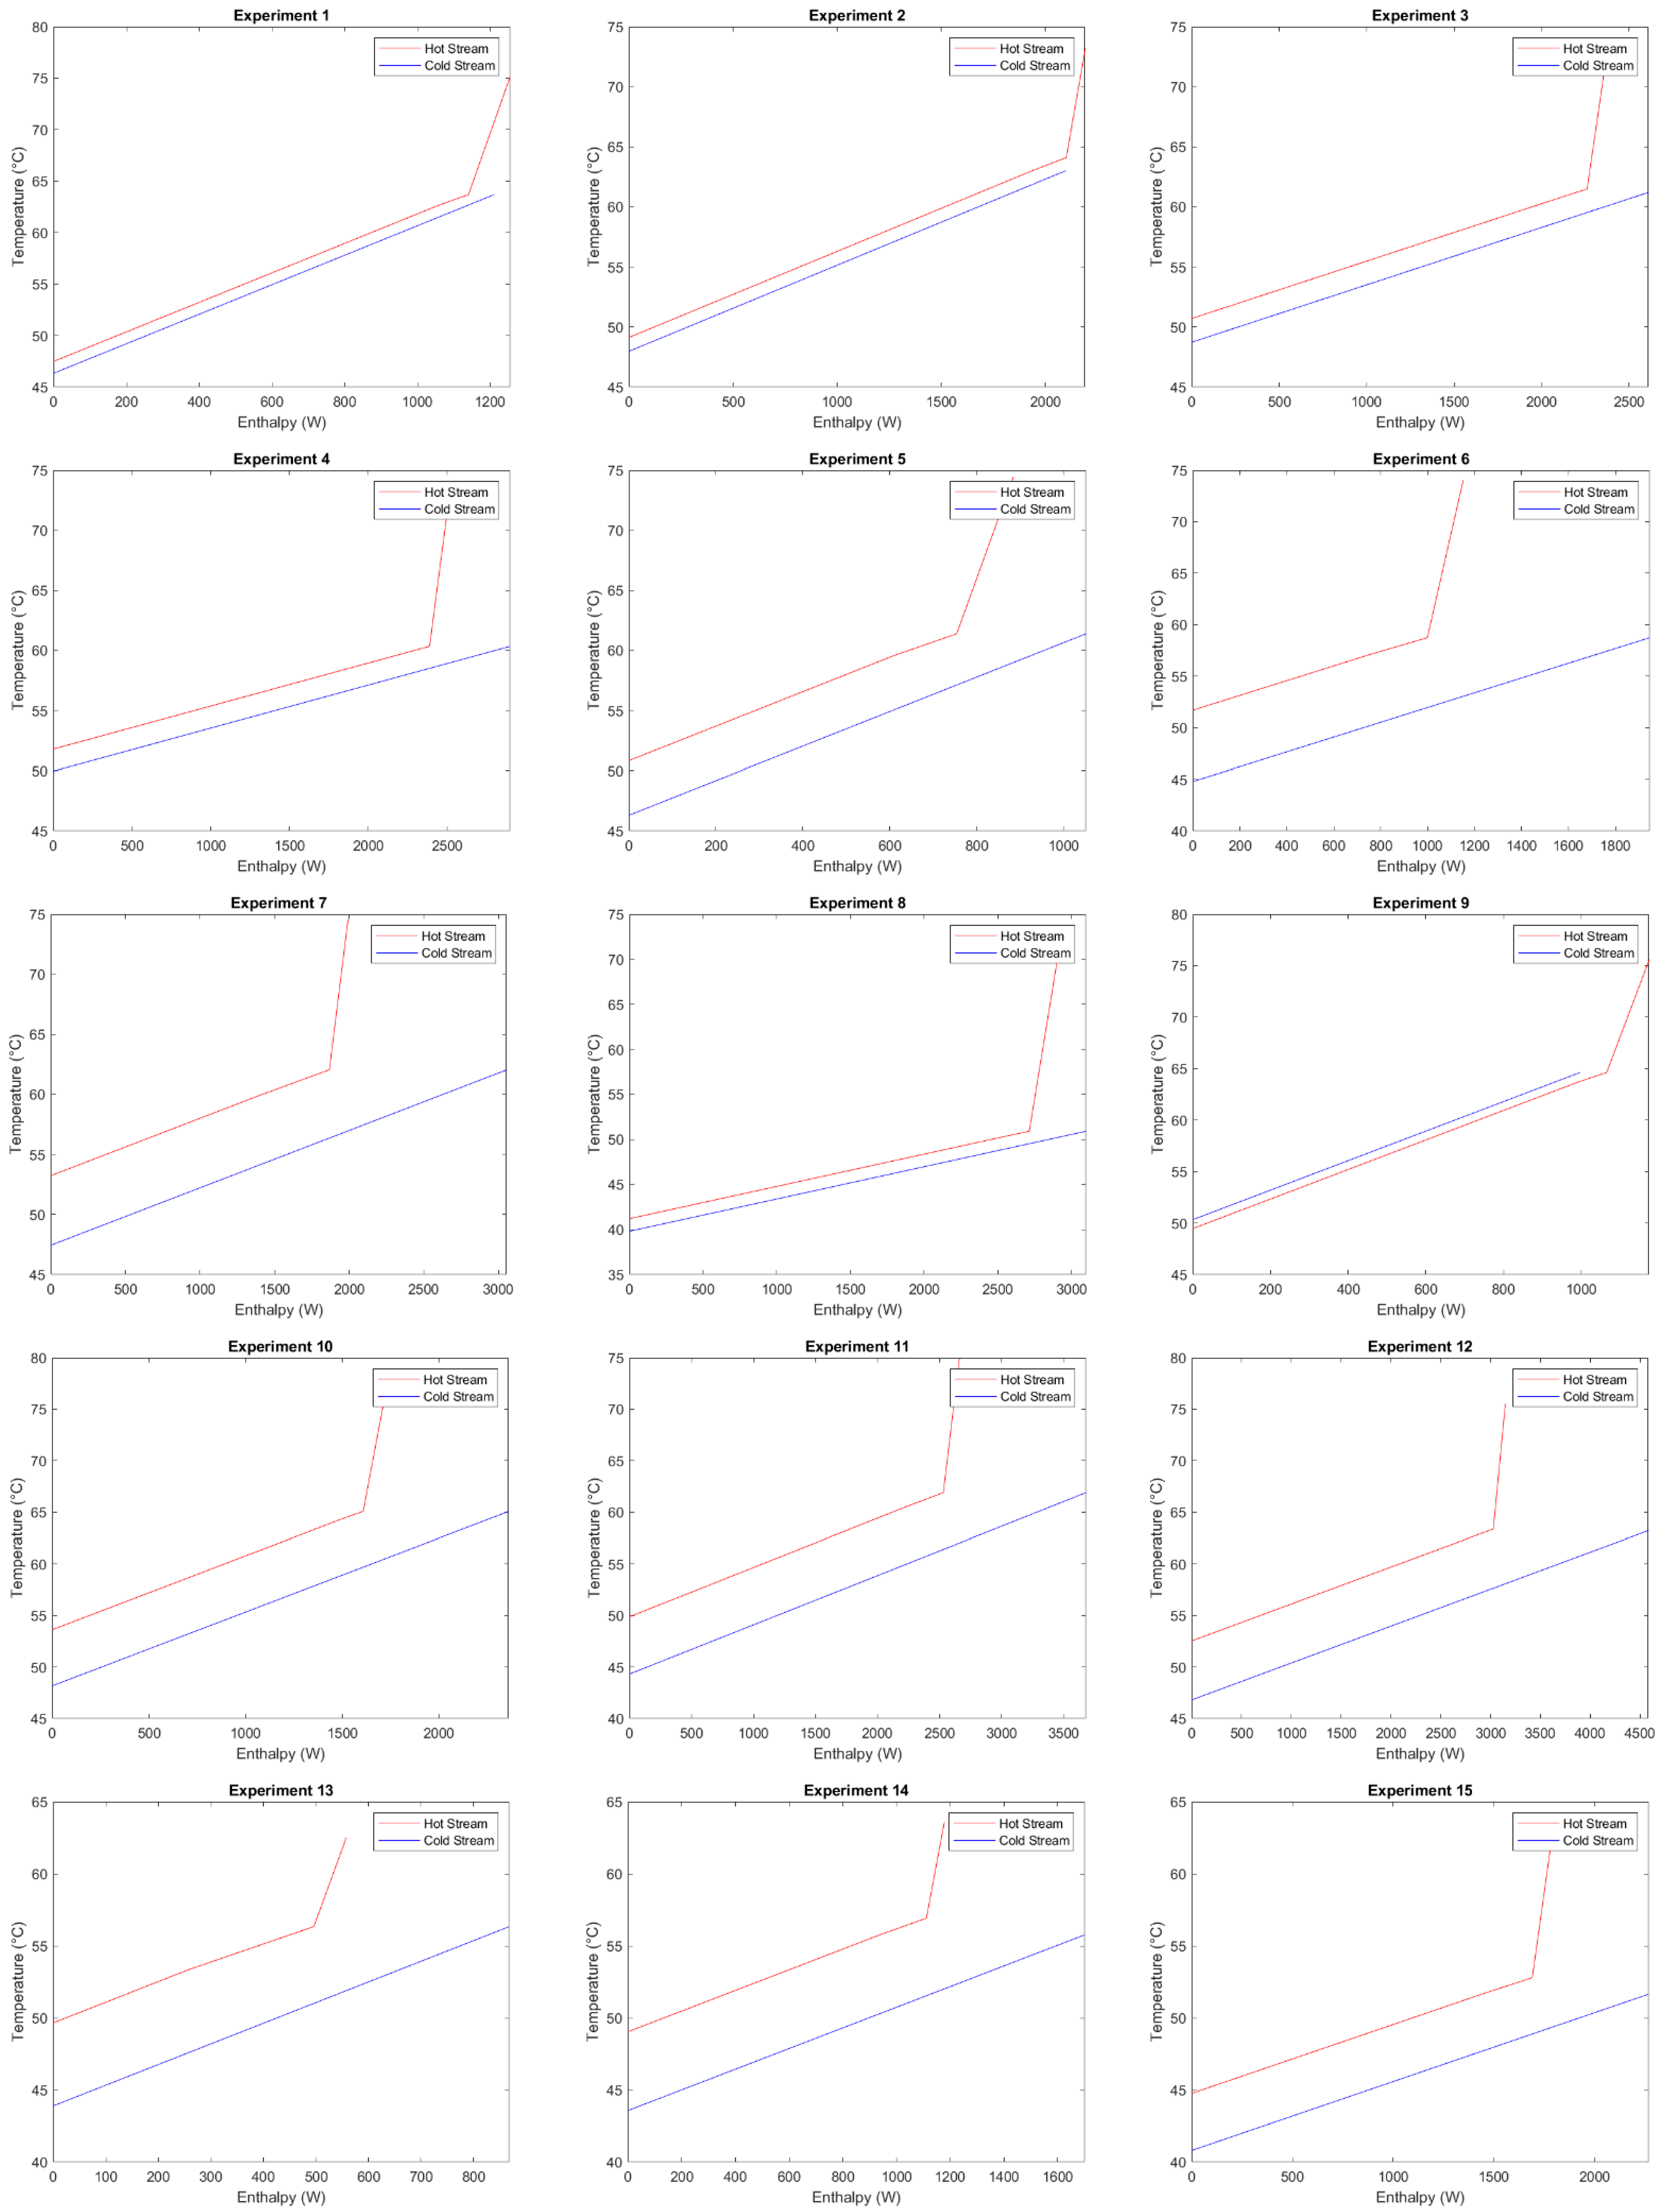
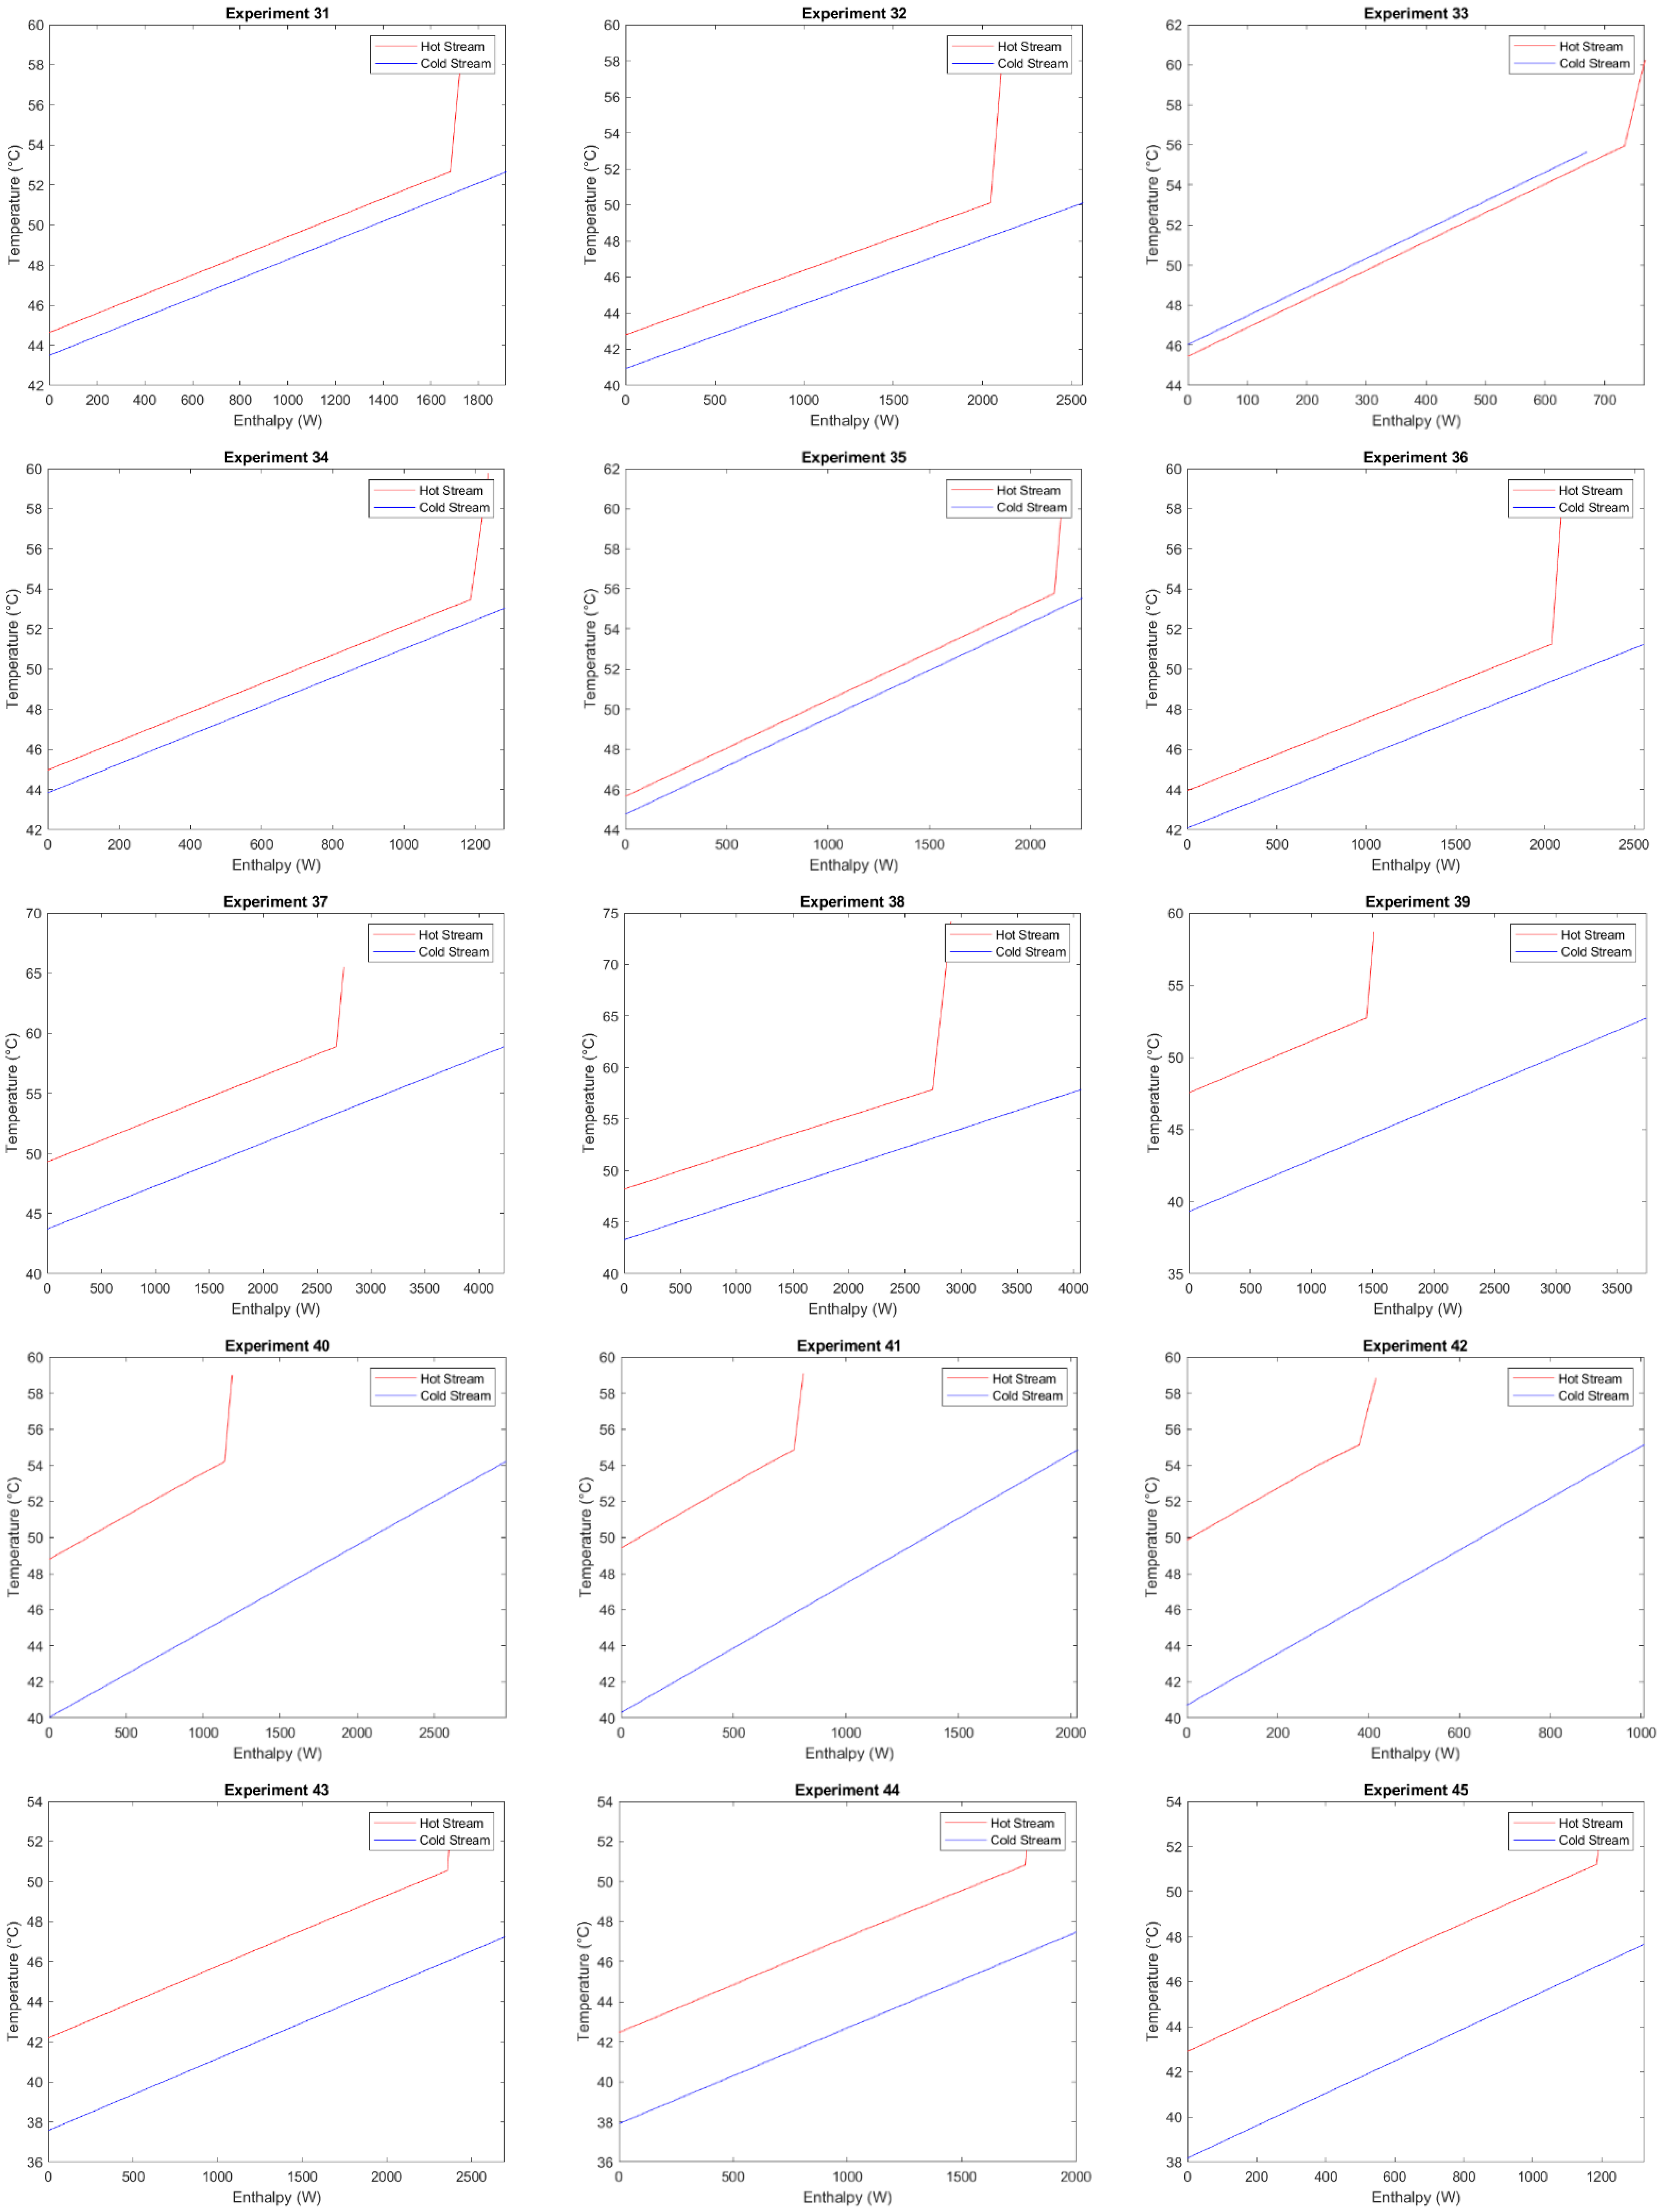
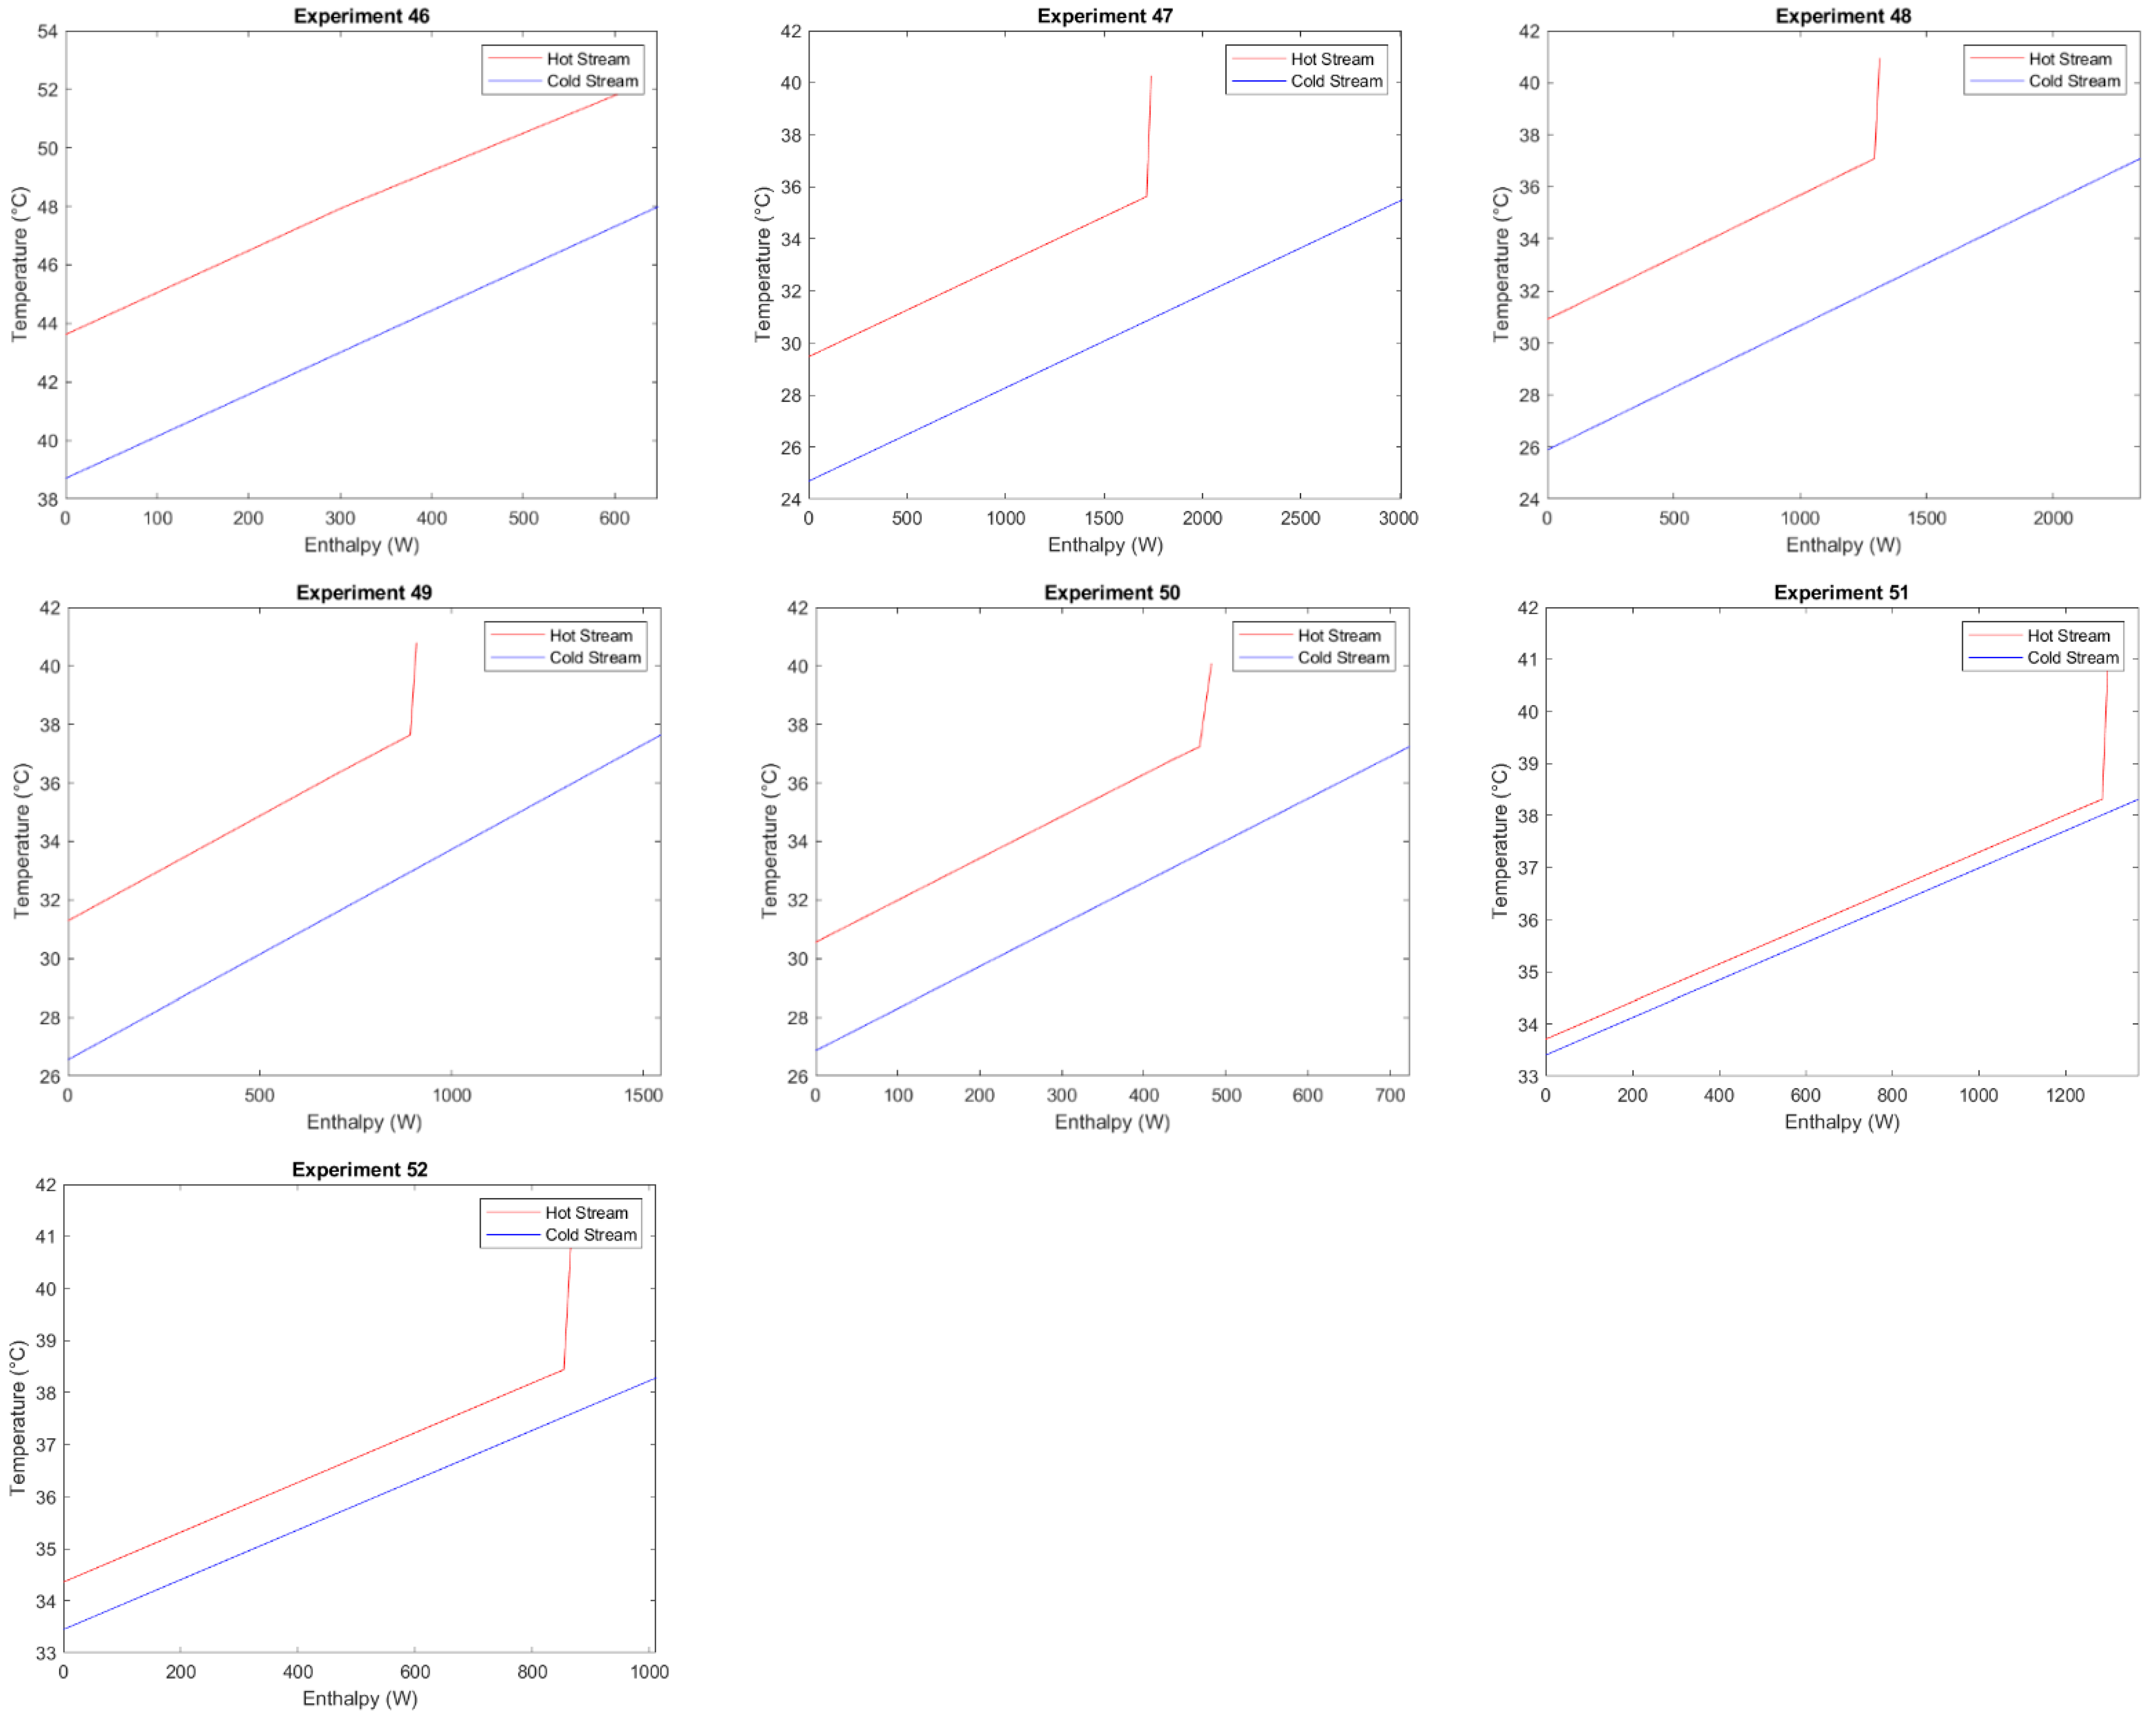
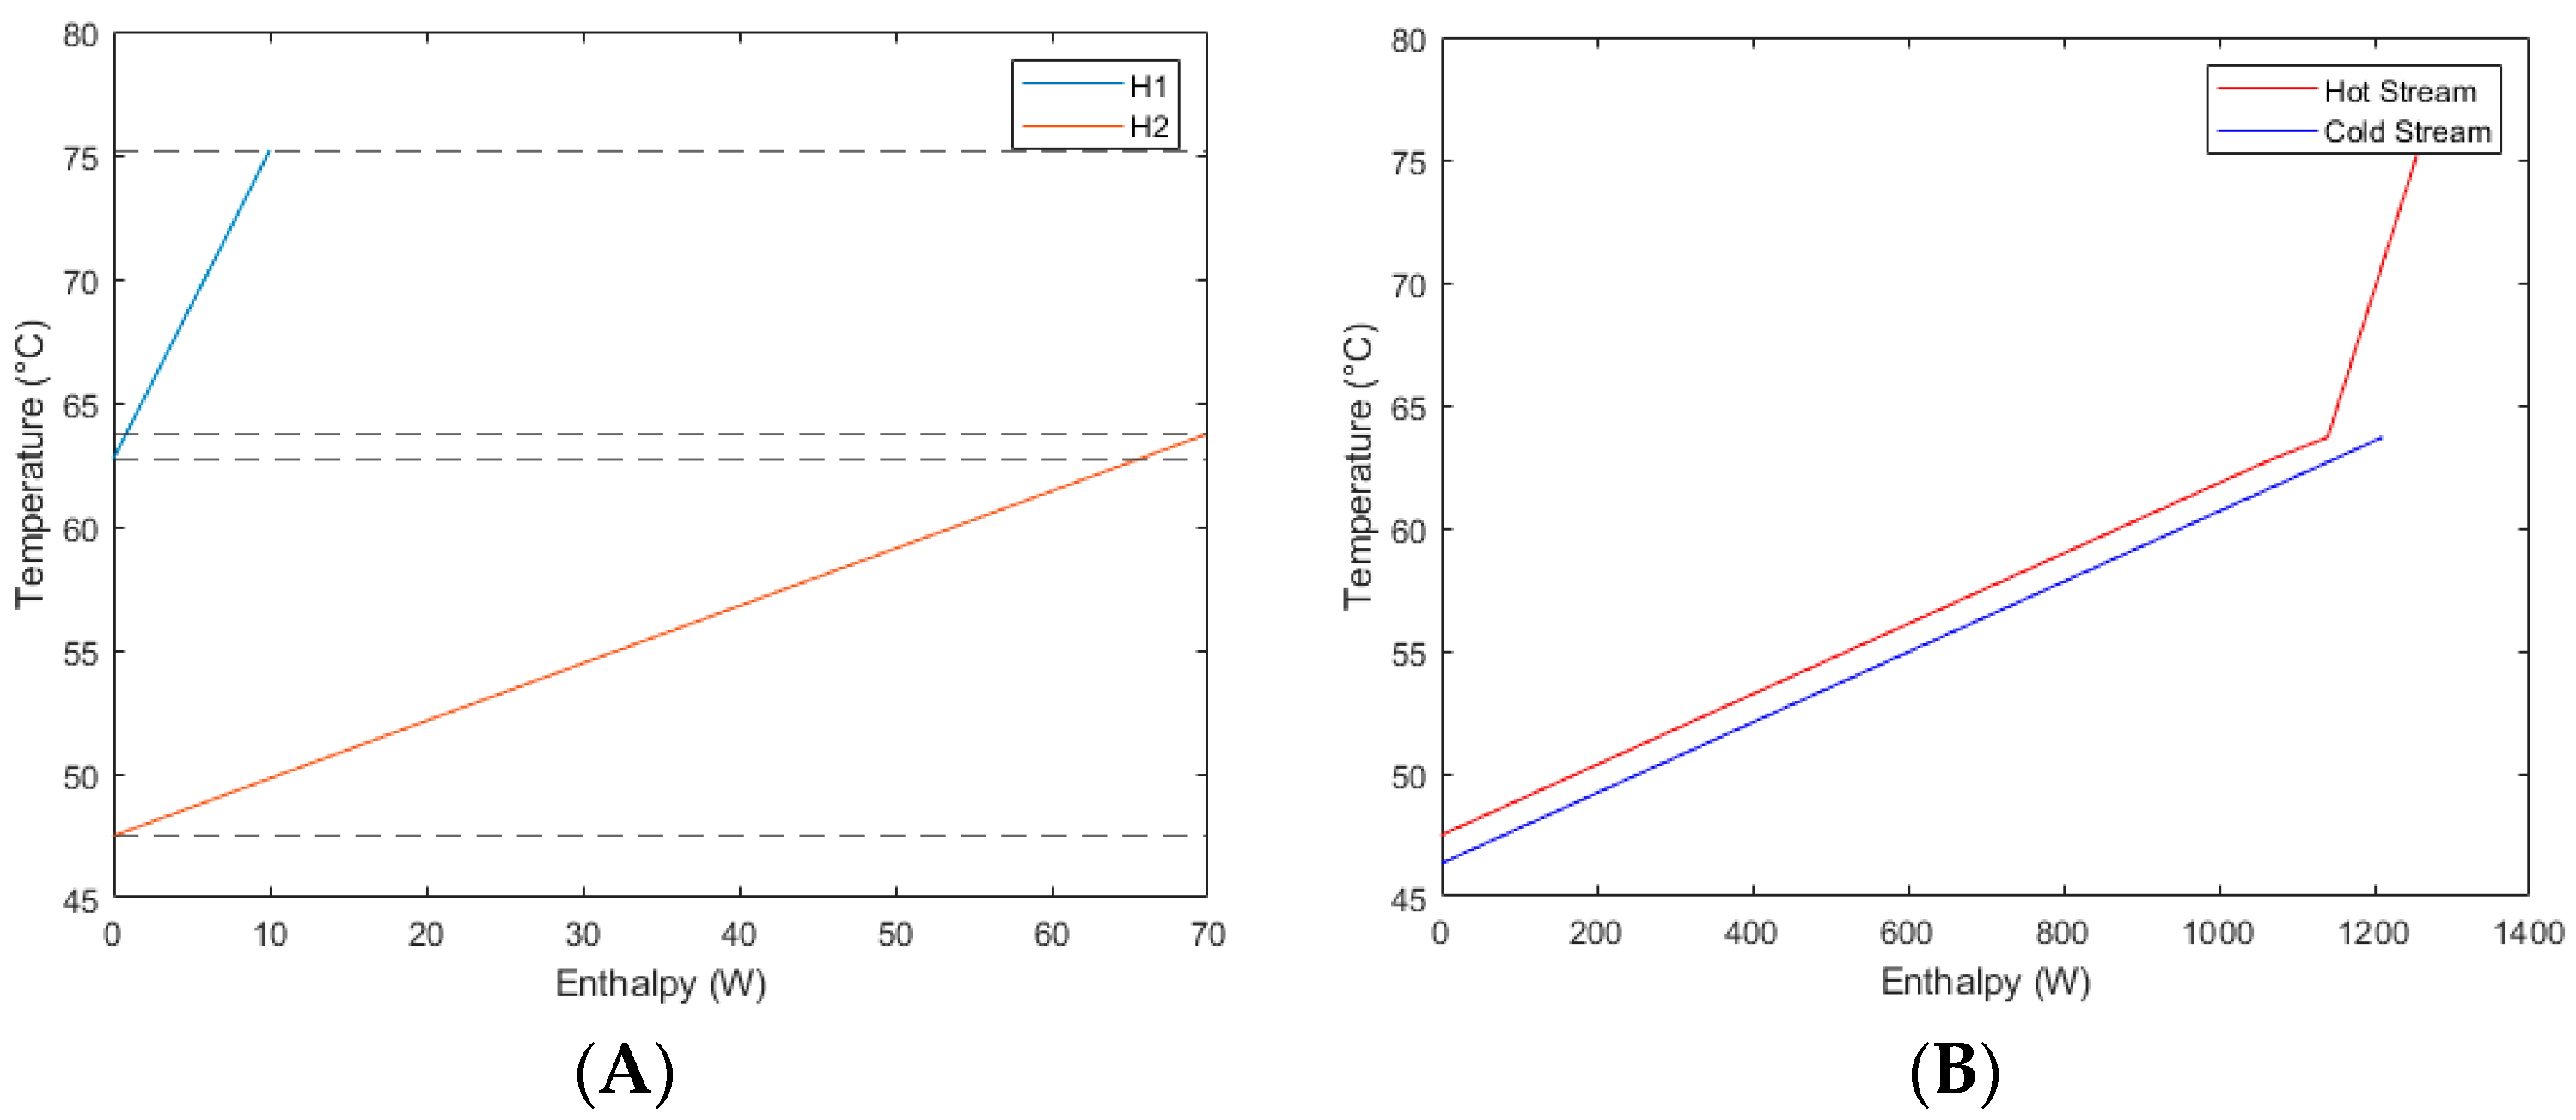
3.1. Sample Data and Typical Pinch Analysis

Air and water temperatures were recorded as functions of time with thermocouples placed systematically around the spray-dryer setup. After 30 min of continuous running, the system was found to be at steady state, and the temperatures at designated points were collected. Once enough data were gathered, the system was gradually allowed to relax to ambient temperature. The temperatures during the steady-state period were then averaged to give values for further calculations. An example experiment (Run 1, Table A1) was used to demonstrate the calculation process.
The heat capacity rates were calculated from the mass flow rates of the streams and the known heat capacities of water and of air. This is demonstrated in Equation (1) [18] .
Heat Capacity Rate = specific heat capacity × mass flow rate
CP = cp × m
To determine the total heat duty for each unit operation in a stream, the heat capacity rate was multiplied by the temperature change in the stream. This is explained mathematically in Equation (3) below.
Q = CP × (Tsource − Ttarget)
The inlet and outlet, or source and target temperatures of previously designated hot and cold streams, are also shown below in Table 1, along with the heat capacity rates.
To determine the pinch point, the streams were graphed on a temperature–enthalpy diagram or by using the problem table method [19]. In this instance, the graphical method was used first to visualise the minimum approach temperature, or ΔTmin, clearly.
By graphing the known heat loads and temperatures of the hot streams, a hot T/H graph was made. Since there are two streams, a composite curve was created. The initial chart of both hot streams is shown in Figure 4A. The composite curve graph of heat flow can be divided into three parts, and the “dashed lines” are used to mark where the temperature of two heat flows overlaps. The heat load between 75.17 °C and 63.70 °C is represented solely by H1, whilst the heat load between 63.70 °C and 62.72 °C is a combination of both H1 and H2, and the heat load between 62.72 °C and 47.50 °C is solely represented by H2. The heat load was calculated by summing the heat-capacity rates of all streams within the temperature section and is tabulated in Table 2. The heat loads of each section were then determined by multiplying the temperature difference by the total heat capacity rate by again using Equation (3). These values have been added to Table 2. Please refer to the attached Figure-A1 for the temperature–enthalpy graph of all experimental data.
The pinch point and corresponding approach temperature were determined using Figure 4B. The closest approach between the hot and cold stream, the pinch temperature, occurred when the hot stream was at a temperature of 63.7 °C. By calculating the vertical distance from this point and the cold stream, the minimum approach temperature was calculated. In this instance, the ΔTmin was determined to be 1.0075 °C. As can be seen, the minimum approach temperature was very low, which indicates efficient heat exchange between the hot and cold streams. In this situation, there was no need for additional heat exchangers, as the system was already very efficient. The heat exchangers, which are already present in the form of the condenser and the reheater, could be decreased in size if required for cost savings, but this is not necessary.
As previously mentioned, the minimum approach temperature works as a good metric for the efficiency of heat transfer between the hot and cold streams and therefore the effectivity of the heat-exchange networks within the system. By calculating and comparing the values of ΔTmin for many runs, assessments to find the most sensitive parameters can be performed. A series of experiments testing the values noted in Table 2 were completed and the data collated. These data were analysed with the same methods as the sample calculation previously, and the results are shown in the figures below. The range of calculated ΔTmin values is shown graphically in Figure 5. There are a few values of ΔTmin that are negative, indicating a ‘cold’ stream with a higher temperature than that of the corresponding ‘hot’ stream (Run 9, 29, 33 in Table A1).
The only commonality between these runs is that the cooling water flow rate was at the lowest tested value. A possible reason is that, when the humid air in the system undergoes phase change (condensation or evaporation), additional energy is released, raising the temperature of the “cold” stream above that of the “hot” stream, particularly when the approach temperatures are low [20]. An average approach temperature, ΔTmin, of 3.48 K, was calculated. This is very low, indicating a heat-transfer rate which is near the maximum physical limit.

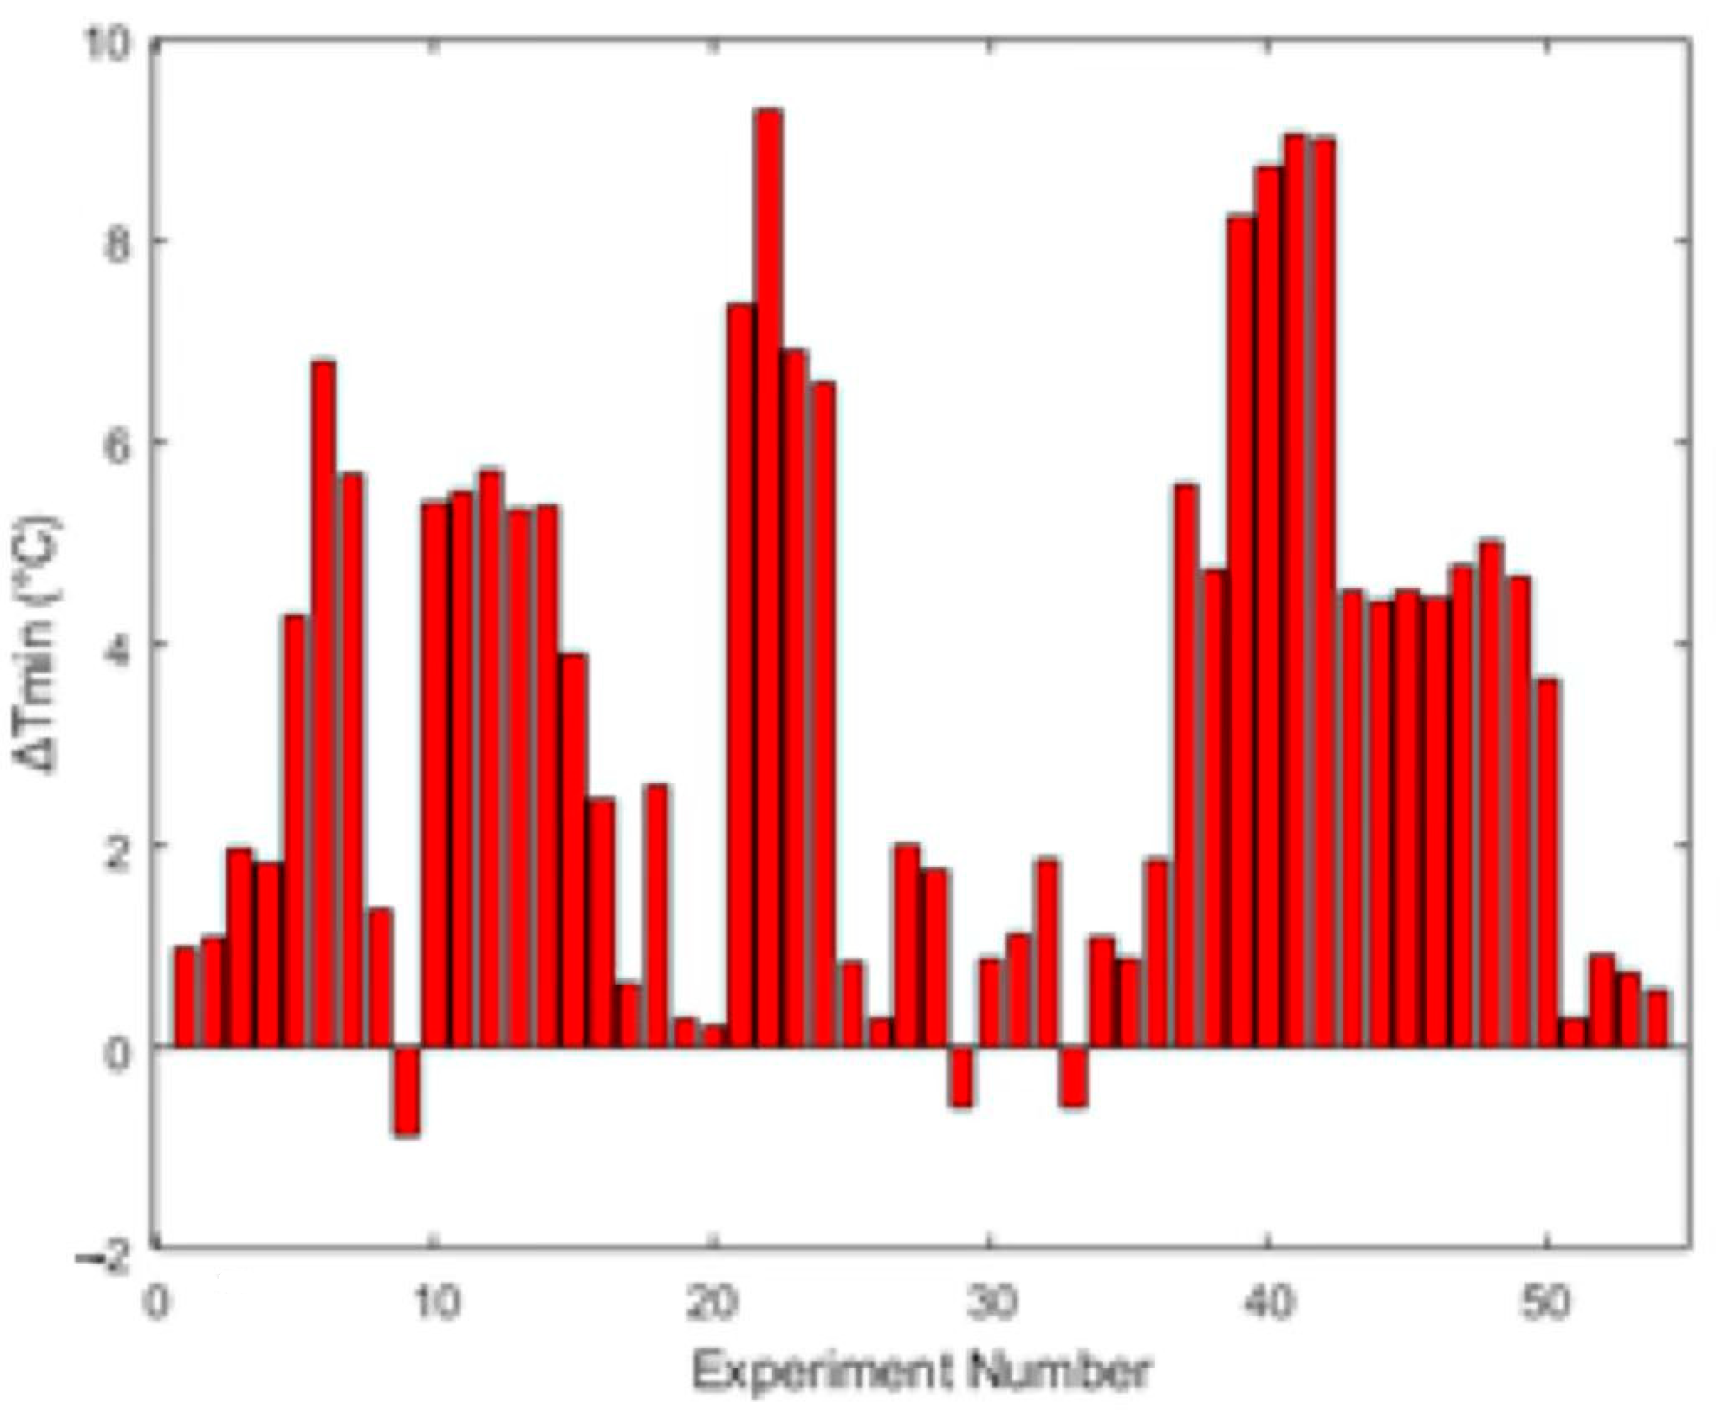
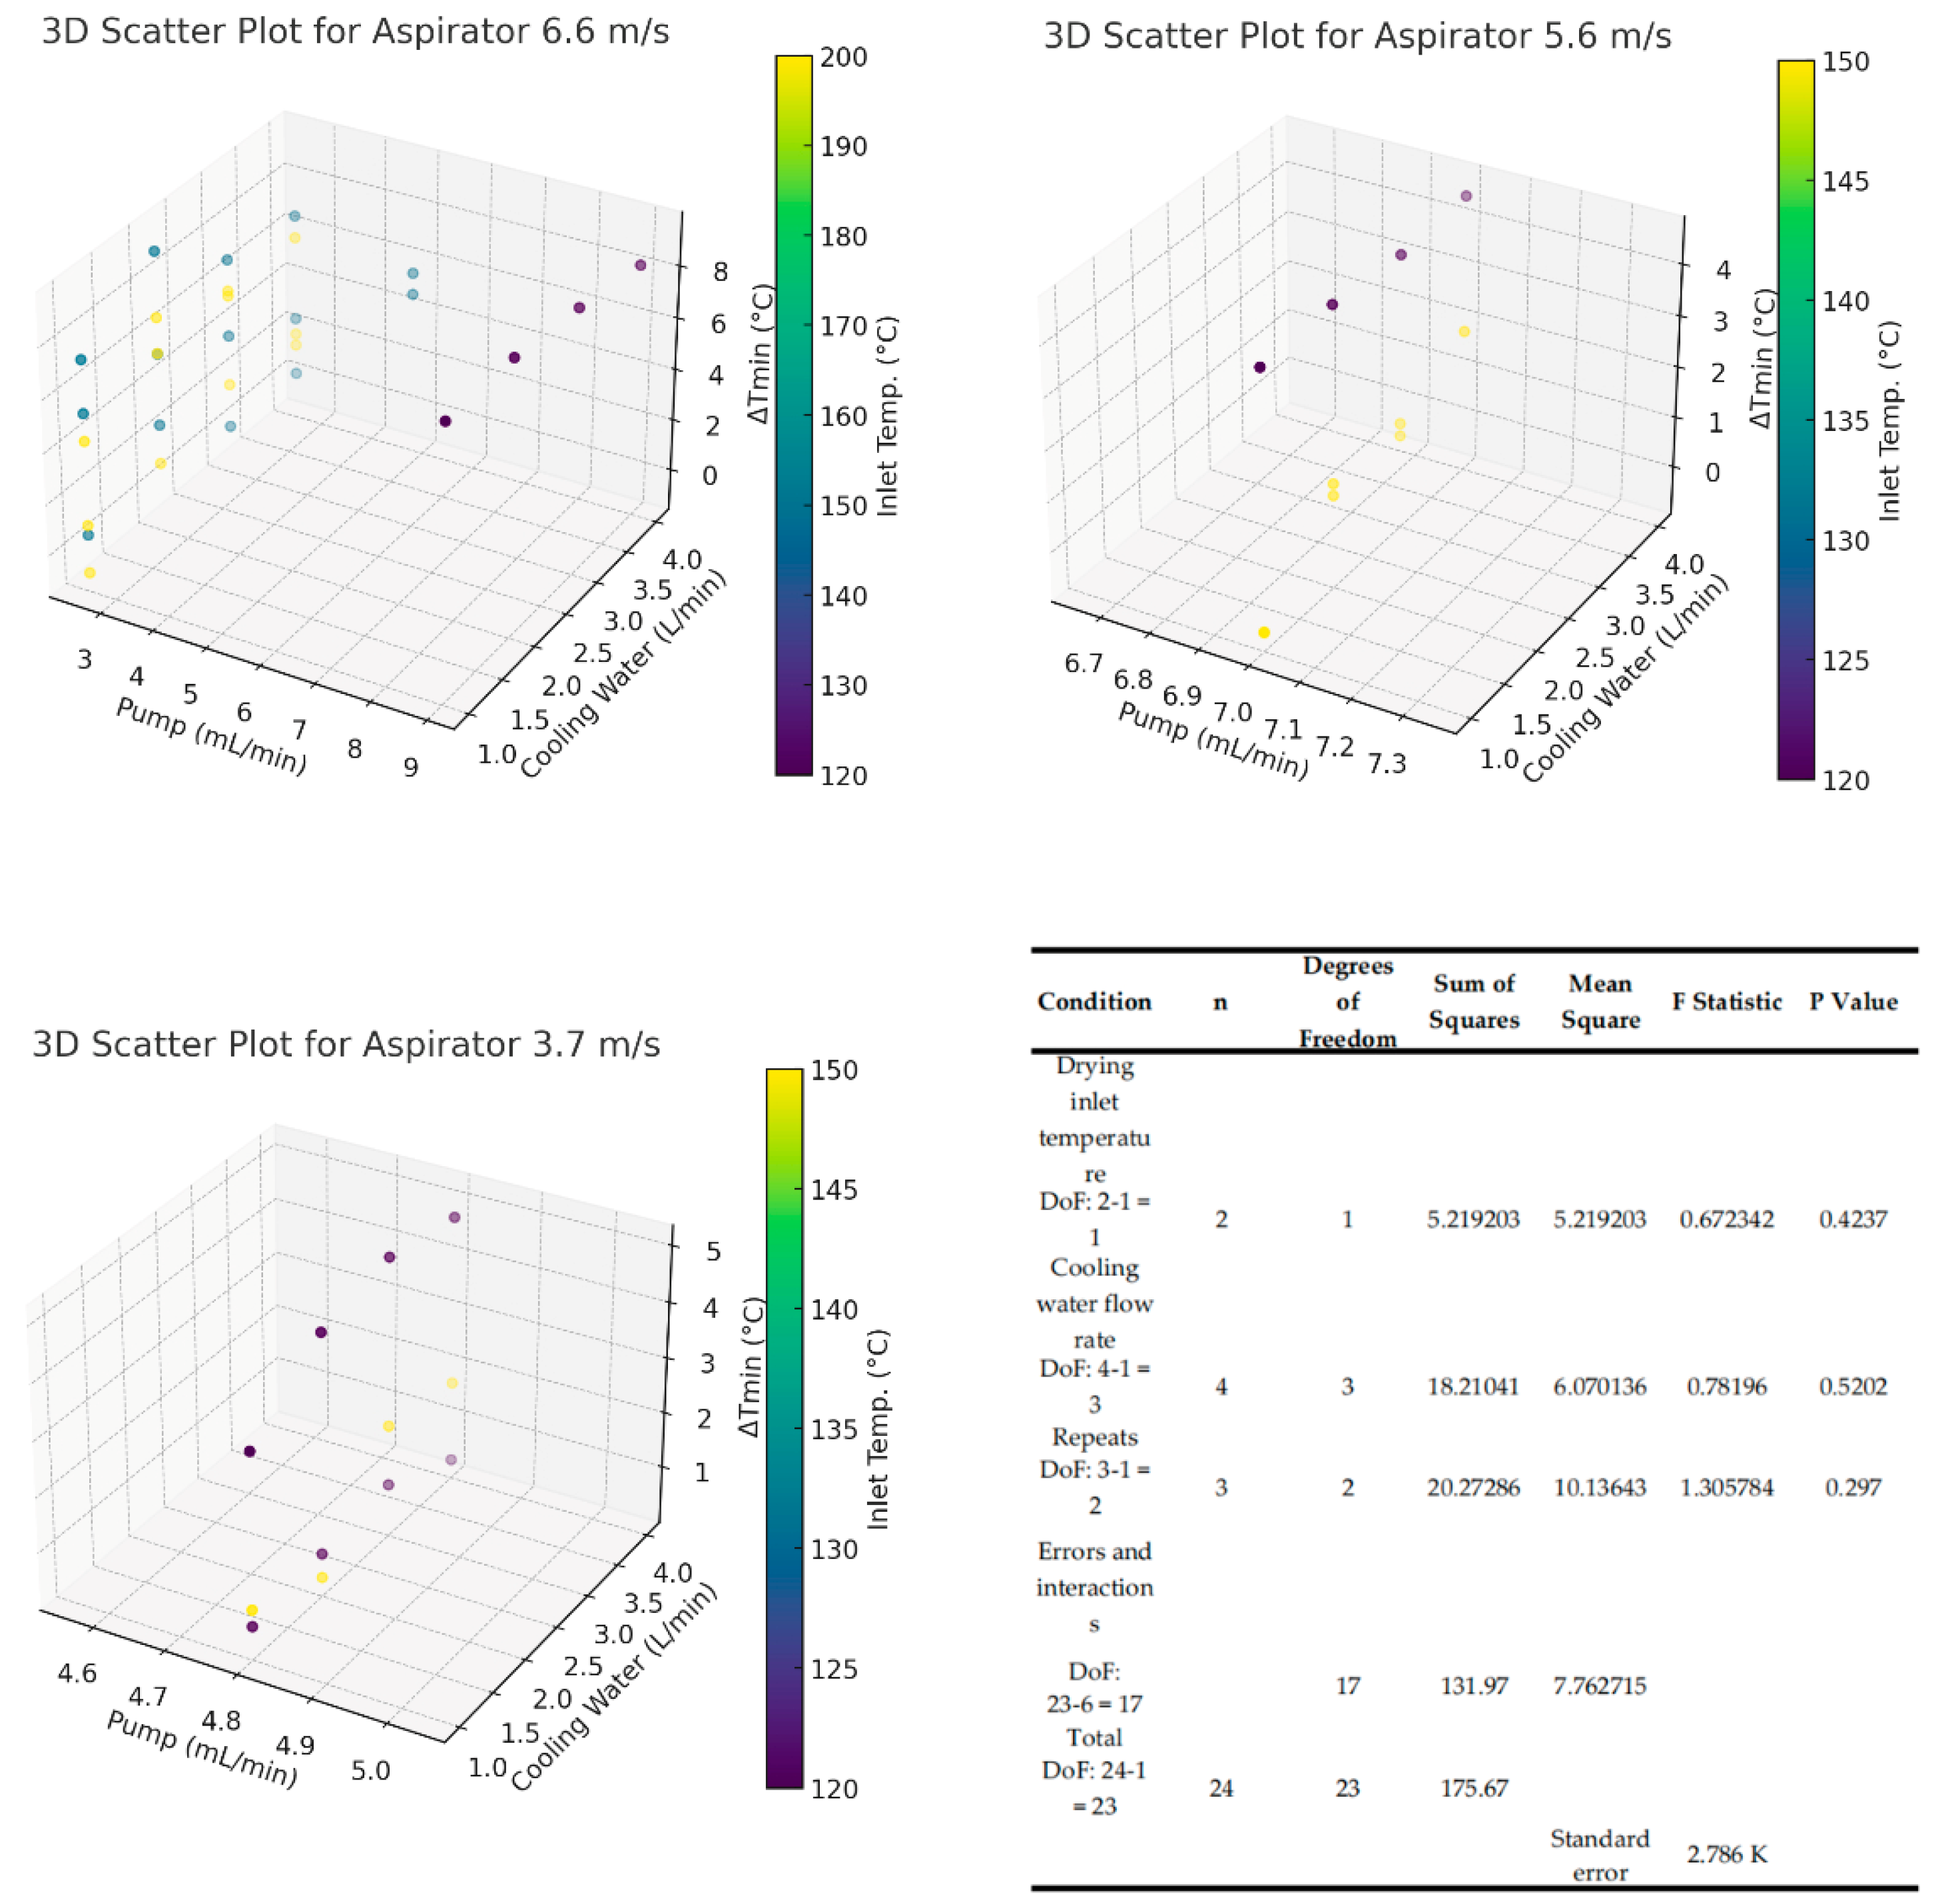
3.2. Pinch Analysis for All Data and Approach Temperatures

The initial analysis, based on a visual inspection of the 3D scatter plots (Figure 6), suggested that there may be interactions between variables such as pump rate, cooling water flow rate, and the inlet temperature on ΔTmin. For example, the pump rate and cooling-water flow rate significantly influence ΔTmin. As the pump rate increases, ΔTmin shows a general increasing trend. The inlet temperature (°C), represented by the colour gradient, also plays an important role in influencing ΔTmin. Higher inlet temperatures tend to correlate with higher ΔTmin values, suggesting that the inlet temperature strongly affects the heat-transfer efficiency within the system. At different aspirator values, which are the main air flow rates through the dryer, the interactions between these variables differ. At the higher aspirator rate of 6.6 m/s, the effects of pump rate and cooling water flow on ΔTmin become more complex, indicating that the increased airflow may introduce non-linear effects on the overall heat-transfer processes.
However, after conducting the ANOVA analysis, there was no statistically significant effect of any individual variable on ΔTmin, which aligns with the subjective review of the approach temperatures. It should also be noted that all approach temperatures are very low, with all values below 10 K, indicating very good heat recovery [21]. The standard error for the temperature data is also shown to be approximately 2.7 K, which further reinforces the suggestion that the approach temperatures are near zero, as many values are smaller than the calculated standard error. In these cases, the approach temperatures are likely to be very close to zero, indicating that the heat-transfer efficiencies were close to the physical limits for heat recovery. This situation may also partially explain the negative approach temperature values seen in some of the runs, as their actual approach temperature might just have been very low, and the uncertainty in the temperature measurements might have resulted in an apparently negative approach temperature. Heat transfer could be increased further but only with the input of additional mechanical energy, such as vapour recompression [22], although research into the feasibility of such a system is outside of the scope of this analysis.
These results again indicate that the improvement potential of the heat-recovery system created around the spray-dryer system is very small, as the heat recovery is near or at the limit, as shown by the low approach temperatures. As mentioned previously, it may be possible to decrease the number of stages within the condenser and reheater while keeping a similar rate of heat recovery. This is due to the ratio between the surface area, the temperature differences, and the heat-transfer rates within a heat exchanger not being linear, especially when close to the maximum transfer rates [5]. Further research into the economic feasibility will be required, as the removal of stages will result in a lower capital cost and a decrease in the required space for the equipment. This is a future extension of this research.
It can also be seen that as the p-values for all results are much higher than 0.05, the null hypothesis of no significant effects of operating conditions on the approach temperatures should be accepted statistically. The 3D plots served as an initial exploration tool, offering visual insight into potential trends, but the statistical evidence from ANOVA confirms that these interactions were not significant. This suggests that the system’s performance is not significantly reliant on the variations in drying parameters, and that the heat-recovery system is operating near its physical limit, requiring additional mechanical energy (such as vapour recompression) to achieve further improvements. As a result, the lack of a significant relationship between input parameters and ΔTmin points to a broader applicability of the heat-recovery network, which could function across different systems and scales without being sensitive to specific operating conditions.

4. Discussion

4.1. Approach Temperature and Heat-Transfer Performance

The minimum approach temperature found here of 3.48 K (under 4 K) may be compared with the literature on pinch analysis as applied to other drying systems. Kemp [20] suggests using a minimum approach temperature difference of 20 K for the pinch analysis of drying systems in general. Studying an alcohol distillery with pulp drying, Ficarella and Laforgia [23] used a minimum approach temperature difference of 10 K. Our values of under 4 K for the minimum approach temperature are comparable with those of Harkin et al. [24], who studied a power plant involving the pre-drying of coal. They suggested a minimum approach temperature difference of 20 K, and they stated that a difference of 3 K was optimistic. The closest analysis in the literature to this study is that by Patel and Bade [5], who studied a spray dryer and heat-recovery system with a minimum approach temperature of 10 K. Kaviani et al. [25] studied a dairy factory involving milk powder production and a spray dryer, using a minimum approach temperature of 50 K. The minimum approach temperature found in this study is therefore low by the standards of the literature.
Several cases of negative approach temperatures were also observed, which might have resulted from the phase changes within the system, such as condensation, where latent heat is released, increasing the temperature of the cold stream beyond that of the hot stream. These anomalies emphasise the complexity of accurately predicting heat-transfer behaviour in highly efficient systems. The data collected consistently highlight the stability of the heat-recovery system in this spray-drying setup. The low approach temperatures achieved suggest that the heat exchangers, including the condenser and reheater, were operating at high efficiency. More importantly, the stability of ΔTmin across various experimental conditions demonstrates that the system can maintain effective heat recovery despite fluctuations in operational parameters. This indicates that the system can be applied across different scales without the need for significant changes to its configuration.

4.2. Comparison with Existing Studies

Pinch technology has already been applied to open-loop drying systems by Kemp [20], but this open-loop system effectively recaptures and reuses energy in a way that is novel and has not been reported before, particularly by using the air reheater to recover energy from the condenser. The approach temperatures used in these open-loop studies are considerably greater (20 K) than those found in this experimental study for the integrated closed-loop system (under 4 K), indicating significantly better thermal integration in this closed-loop system compared with many open-loop systems. Other studies of energy efficiency on open-loop systems (Sarker et al. [26]; Surendhhar et al. [27]) have confirmed their low thermal efficiencies.
This closed-loop drying system has novelty in that it includes an air reheater to recover energy from the condenser. Drying with superheated steam is another way to recover energy from drying systems (for example, Guo et al. [28]), but the need to address the pressurisation requirements of superheated steam drying is a disincentive to use these systems. The system described in this paper is a normal air-water vapour system, with the unique features of including a closed loop with both a condenser and reheater.
Another approach to the analysis of this drying system is a full energy and exergy analysis (for example, Aghbashlo et al. [29]; Amjad et al. [30]; Dincer and Rosen [31]; Erbay and Hepbashli [32]; Johnson and Langrish [33]; Lei and Langrish [16]), which is a more comprehensive, complex, and more difficult analytical technique. This approach has the advantage of including non-thermal components of energy availability, such as pressure. However, the data collection and analysis requirements are more challenging, and pinch analysis, as used in this work, offers potential advantages in ease-of-use for operational engineering purposes.
Another advantage of a closed system is a higher recirculation rate. Golman and Julklang [34] found, in their study of open-loop systems, that increasing the recirculation ratio of exhaust gas can improve the energy efficiency of spray-drying equipment. A closed system can be considered as an infinite loop system. In addition to improving the recirculation ratio, our closed-loop system goes a step further by integrating air reheaters. This approach results in even lower approach temperatures (ΔTmin), suggesting superior heat-recovery performance.

4.3. Future Research Suggestions and Prospects for Practical Applications

However, this study also encountered limitations, such as phase changes and extreme temperature conditions that were not fully accounted for in the experimental design. These factors could introduce complexities that influence heat-transfer behaviour. For the purposes of this analysis, however, the primary focus was on evaluating the overall heat-recovery potential, which remains consistent across various operational configurations. As future research expands to larger-scale systems, these complexities will need to be considered in greater detail, particularly in industrial-scale applications where heat- transfer dynamics may differ.
Some valuable future work could include testing different configurations of condensers and reheaters, as well as exploring the use of steam recompression to enhance heat-transfer rates [35]. Furthermore, the scalability of this system should be explored through larger-scale tests to verify that the energy-recovery performance remains consistent when applied to industrial-scale equipment.

5. Conclusions

It can be seen from the results of ANOVA tests that there is no significant effect of any variable on the approach temperature. The consistently small approach temperatures (all below 10 K, with an average of 3.48 K) suggest excellent heat recovery. In several instances these approach temperatures are very close to zero, demonstrating the attainment of the physical limit for heat transfer and recovery. This is further supported by the standard error of 2.7 K, indicating that the minimum approach temperatures may be lower than are calculated, indicating possibly an even better heat-transfer rate. The presence of negative approach temperature values in some runs is most likely a result of very low approach temperatures combined with unaccounted-for phase transitions in the system.
The results collected unequivocally indicate the value of integrating a heat-recovery system into spray-drying equipment. The low approach temperature denotes a high rate of heat transfer, which stayed relatively constant over different testing parameters. There is clearly more room for experimentation and research in this area, such as testing the sizing of and number of stages of the condenser and reheater and the addition of vapour recompression to further increase the heat-transfer rate. The lack of relationship between any input parameters and result denotes that the heat-recovery network is not dependent on one particular variable and can most likely be transferred to other spray-drying systems at different scales. Scale-up tests on larger pieces of equipment with a greater powder production capability must be performed to confirm these hypotheses.

Author Contributions

Z.L.: Conceptualization; Methodology; Formal analysis; Writing—original draft; Data curation; T.O.: Conceptualization; Methodology; Formal analysis; Writing—original draft; Data curation; T.L.: Conceptualization; Methodology; Funding acquisition; Project administration; Writing—review and editing; Supervision; Resources. All authors have read and agreed to the published version of the manuscript.

Funding

This research received no external funding.

Institutional Review Board Statement

Not applicable.

Data Availability Statement

The original contributions presented in the study are included in the article. Further inquiries can be directed to the corresponding author.

Conflicts of Interest

The authors declare no conflicts of interest.

Appendix A

Table A1. Full dataset used for pinch analysis.
RunAspirator m/sPump Flow mL/minWater Flow L/minSpray Dryer °CDryer Out °CCondenser in (Dry) °CCondenser In (Wet) °CCondenser Out (Dry) °CCondenser Out (Wet) °CReheater out (Dry) °CReheater out (Wet) °CDryer Return °CWater Condenser in °CWater Condenser Out °CWater Cyclone in °CWater Cyclone Out °CReheater in °CReheater Out °CAmbient °CSolid Conc.
16.62.5120075.171671.565069.596963.249260.707762.721259.899759.738546.341948.732246.853663.696061.380447.4942230
26.62.5220073.267671.098370.034865.204260.950664.111556.056662.864747.983851.585350.293063.023262.600649.1362230
36.62.5320073.055770.041469.208862.438358.539561.497054.790555.006448.736253.392651.294361.219960.809950.7123230
46.62.5420073.780569.549068.413761.664160.142160.185058.549757.112149.960354.153652.800160.343259.103851.7962230
56.62.5120074.437972.754666.283261.934760.587159.590853.676453.857246.315852.043049.476461.390361.137950.8397230
66.62.5220074.074772.576765.456059.854258.466057.036851.340145.799844.793851.142849.295758.742455.552351.7058230
76.62.5320074.593572.913866.325362.434760.955759.906554.230048.215847.446853.976152.833762.054860.657453.2377230
86.62.5420072.471070.819768.368553.159351.691750.403645.923841.459039.811245.572344.172250.911551.860541.2088230
96.62.5120075.628072.848568.347064.586256.205863.767854.117162.721550.338753.973651.809064.628263.337249.4757230
106.62.5220075.994273.240968.705465.182656.730364.381056.464263.320848.174654.372852.425565.099763.472853.6270230
116.62.5320074.936672.401067.316062.096754.139160.471852.361460.235244.323253.978853.183561.906961.291349.8882230
126.62.5420075.530372.541168.694164.432957.115263.384055.705662.012646.814353.036751.081263.246263.506752.5463230
136.62.5115062.481859.898658.478754.591552.761653.346851.718452.374843.900452.856046.739156.339654.842049.6587230
146.62.5215063.598060.915560.153657.347155.079556.926751.861156.499743.577052.376646.459955.767254.242049.0446230
156.62.5315062.327359.956058.220053.747750.773952.793649.920352.381540.808546.368244.812051.650050.209344.7691230
166.62.5415065.128262.591062.583761.167459.995859.312159.047957.235443.263346.447245.375151.296950.352945.7208230
176.62.5115064.748863.057059.087056.306649.458555.057747.013554.201343.552446.683944.737454.807455.049544.2170230
186.62.5215063.705762.322658.194953.723847.197852.586143.019850.271442.257046.362645.067652.247551.615144.8941230
196.62.5315063.982462.707453.520658.696350.885654.886048.688554.149343.182847.023046.284753.390351.228043.4638230
206.62.5415060.994459.829255.620143.680338.087741.969135.843941.074035.594738.584537.643642.392742.143235.8157230
216.62.5115064.333062.113660.321960.136852.463658.643950.894058.090843.085052.090649.579758.738258.766750.4560230
226.62.5215064.590762.091260.494859.821852.085358.862051.119358.070942.056049.524049.459559.163158.498751.3731230
236.62.5315064.337261.928060.312159.493052.295258.513851.335457.838743.007049.345449.174558.870357.869849.9273230
246.62.5415064.855762.337160.697859.926553.079459.127552.299458.277643.542949.812749.069659.442458.564650.1417230
253.74.8115043.061042.093440.325540.190038.170540.231637.578639.065433.895937.125135.119840.069938.094434.7726230
263.74.8215042.400541.433239.632439.559538.167039.253537.323139.334133.207334.768734.383339.146137.496333.5128230
273.74.8315041.251440.117438.503038.283137.310038.304636.050737.105232.403634.298233.371438.429437.075434.3952230
283.74.8415041.173540.000638.250537.944436.078937.840235.839637.201432.406334.946933.765737.923736.297434.1599230
295.67115059.208157.470859.315154.417953.690554.727151.843953.126245.723248.287447.470455.268951.155645.1504230
305.67215059.329057.140459.527155.726153.556754.622551.765352.540344.419048.199547.381155.181850.518045.3199230
315.67315058.659357.387358.053053.288051.126452.301949.792650.354143.499946.153845.412652.661648.670644.6377230
325.67415058.003956.756156.411351.047748.760049.911346.855148.758340.935944.205143.399850.121747.032842.8005230
335.67115060.247960.082358.672955.587954.808755.924152.966054.309646.034648.565747.902655.647152.424745.4455230
345.67215059.784259.185758.514454.441452.258453.452150.932551.506443.838046.505245.774053.038749.019744.9693230
355.67315060.484360.646258.235856.806854.646855.773052.902253.693144.773148.529947.737855.546450.854445.6664230
365.67415059.150057.898457.560652.189349.902451.059248.002649.923442.085445.355644.620751.241448.190943.9458230
376.64.8415065.520263.596460.244459.434952.728258.513451.903957.593843.710049.380149.350958.891457.572949.2975230.3
386.64.8415074.148270.873264.934755.306251.878852.937747.334152.606243.295648.553045.675557.870156.689448.2075230.5
396.69412058.700855.352954.197752.124350.958052.109851.783549.289939.309044.892744.651752.725351.474447.5482230
406.69312058.990656.536455.523954.190552.367353.202050.681252.900340.037845.990845.721654.207353.012048.8041230
416.69212059.082657.048856.127254.852452.978153.783450.999353.024040.297546.717546.374954.855753.522449.4213230
426.69112058.823657.333056.501355.239053.483853.960051.235252.768340.710346.748245.056055.129754.278549.8648230
435.67412052.829352.563151.929950.896050.160350.549449.728749.237837.574644.218443.548047.248547.216242.1930230
445.67312053.121052.697352.062651.092249.898950.823549.407150.303037.916144.455943.887047.472046.673342.4596230
455.67212053.171952.885452.353851.364850.624951.203949.738150.226638.180544.231743.202347.671946.809842.9117230
465.67112053.427353.515252.925952.016051.248951.920750.845450.353738.706545.289344.641047.987547.903343.6178230
473.74.8412040.261539.025136.068337.715534.699735.623731.251535.336024.692332.674430.461835.501834.115529.4740230
483.74.8312040.949839.663938.473037.345333.529137.018632.836036.750325.887432.170530.084637.085735.482530.9051230
493.74.8212040.786239.480038.362437.497333.553936.320132.293036.593226.558732.257229.992337.639736.010731.2878230
503.74.8112040.078438.769037.795937.310233.575636.820132.151336.091926.868133.448031.666837.235735.527130.5587230
513.74.8412041.711940.431338.616738.724637.260238.167334.268837.050733.407136.207934.407238.311837.567033.7110230
523.74.8312041.623940.281938.812238.495937.378338.437736.945337.142633.449136.433634.400538.286037.693934.3605230
533.74.8212041.410639.988838.714038.310237.418638.400137.141036.919133.562636.490834.783538.293037.661634.3045230
543.74.8112040.638639.269438.459738.163337.165737.798936.703736.429033.250236.312134.338838.085637.403933.8363230
Figure A1. Experimental pinch analysis graphs.
Entropy 26 00809 g0a1aEntropy 26 00809 g0a1bEntropy 26 00809 g0a1cEntropy 26 00809 g0a1d

References

  1. Aghbashlo, M.; Kianmehr, M.H.; Samimi-Akhijahani, H. Influence of Drying Conditions on the Effective Moisture Diffusivity, Energy of Activation and Energy Consumption during the Thin-Layer Drying of Berberis Fruit (Berberidaceae). Energy Convers. Manag. 2008, 49, 2865–2871. [Google Scholar] [CrossRef]
  2. Nummer, B.A.; Brian, A. Historical Origins of Food Preservation. Ph.D. Thesis, National Center for Home Food Preservation, Athens, GA, USA, 2002. [Google Scholar]
  3. Mujumdar, A.S. Handbook of Industrial Drying, 3rd ed.; CRC Press: Boca Raton, FL, USA, 2006. [Google Scholar]
  4. Erbay, Z.; Koca, N.; Kaymak-Ertekin, F.; Ucuncu, M. Optimization of Spray Drying Process in Cheese Powder Production. Food Bioprod. Process. 2015, 93, 156–165. [Google Scholar] [CrossRef]
  5. Patel, S.K.; Bade, M.H. Energy Targeting and Process Integration of Spray Dryer with Heat Recovery Systems. Energy Convers. Manag. 2020, 221, 113148. [Google Scholar] [CrossRef]
  6. Pakowski, Z.; Druzdzel, A.; Drwiega, J. Validation of a Model of an Expanding Superheated Steam Flash Dryer for Cut Tobacco Based on Processing Data. Dry. Technol. 2004, 22, 45–57. [Google Scholar] [CrossRef]
  7. Van Heiningen, A.R.P.; Crotogino, R.H.; Douglas, W.J.M. An Experimental Study of the Falling Rate Period of Superheated Steam Impingement Drying of Paper. Dry. Technol. 1992, 10, 961–977. [Google Scholar] [CrossRef]
  8. Li, J.; Liang, Q.C.; Bennamoun, L. Superheated Steam Drying: Design Aspects, Energetic Performances, and Mathematical Modeling. Renew. Sustain. Energy Rev. 2016, 60, 1562–1583. [Google Scholar] [CrossRef]
  9. Linnhoff, B.; Alanis, F.J. Integration of a New Process Into an Existing Site: A Case Study in the Application of Pinch Technology. J. Eng. Gas. Turbine Power 1991, 113, 159–168. [Google Scholar] [CrossRef]
  10. Tan, R.R.; Sum Ng, D.K.; Yee Foo, D.C. Pinch Analysis Approach to Carbon-Constrained Planning for Sustainable Power Generation. J. Clean. Prod. 2009, 17, 940–944. [Google Scholar] [CrossRef]
  11. Dimian, A.C.; Bildea, C.S.; Kiss, A.A. Pinch Point Analysis. Comput. Aided Chem. Eng. 2014, 35, 525–564. [Google Scholar] [CrossRef]
  12. Di Pretoro, A.; Manenti, F. Spray Drying. In Non-Conventional Unit Operations; Springer Briefs in Applied Sciences and Technology; Springer: Cham, Switzerland, 2020; pp. 65–74. [Google Scholar] [CrossRef]
  13. Johnson, P.W.; Langrish, T.A.G. Inversion Temperature and Pinch Analysis, Ways to Thermally Optimize Drying Processes. Dry. Technol. 2011, 29, 488–507. [Google Scholar] [CrossRef]
  14. Zhang, K.; Liu, Z.; Huang, S.; Li, Y. Process Integration Analysis and Improved Options for an MEA CO2 Capture System Based on the Pinch Analysis. Appl. Therm. Eng. 2015, 85, 214–224. [Google Scholar] [CrossRef]
  15. Langrish, T.A.G. Multi-Scale Mathematical Modelling of Spray Dryers. J. Food Eng. 2009, 93, 218–228. [Google Scholar] [CrossRef]
  16. Lei, Z.; Langrish, T. Energy and Exergy Analysis for a Laboratory-Scale Closed-Loop Spray Drying System: Experiments and Simulations. Dry. Technol. 2024. [Google Scholar] [CrossRef]
  17. B-290 Mini Spray Dryer Operation Manual 093001|Q En. Available online: https://www.scientificlabs.co.uk/handlers/libraryFiles.ashx?filename=Manuals_E_EVA4514_B.pdf (accessed on 18 September 2024).
  18. Ting, D. Thermofluids: From Nature to Engineering; Academic Press: Cambridge, MA, USA, 2022; pp. 1–397. [Google Scholar] [CrossRef]
  19. Integration, I.K.-P. Analysis and Process; Undefined. Key Concepts of Pinch Analysis. 2007. Available online: https://cir.nii.ac.jp./all?q=Key+Concepts+of+Pinch+Analysis&count=20&sortorder=0 (accessed on 18 September 2024).
  20. Kemp, I.C. Reducing Dryer Energy Use by Process Integration and Pinch Analysis. Dry. Technol. 2005, 23, 2089–2104. [Google Scholar] [CrossRef]
  21. Johnson, P.W.; Langrish, T.A.G. Interpreting Exergy Analysis as Applied to Spray Drying Systems. Int. J. Exergy 2020, 31, 120–149. [Google Scholar] [CrossRef]
  22. Serth, R.W.; Lestina, T.G. Process Heat Transfer: Principles, Applications and Rules of Thumb, 2nd ed.; Academic Press: Cambridge, MA, USA, 2014. [Google Scholar] [CrossRef]
  23. Ficarella, A.; Laforgia, D. Energy Conservation in Alcohol Distillery with the Application of Pinch Technology. Energy Convers. Manag. 1999, 40, 1495–1514. [Google Scholar] [CrossRef]
  24. Harkin, T.; Hoadley, A.; Hooper, B. Reducing the Energy Penalty of CO2 Capture and Compression Using Pinch Analysis. J. Clean. Prod. 2010, 18, 857–866. [Google Scholar] [CrossRef]
  25. Kaviani, A.; Aslani, A.; Zahedi, R.; Ahmadi, H.; Malekli, M.R. A New Approach for Energy Optimization in Dairy Industry. Clean. Eng. Technol. 2022, 8, 100498. [Google Scholar] [CrossRef]
  26. Sarker, M.S.H.; Ibrahim, M.N.; Abdul Aziz, N.; Punan, M.S. Energy and Exergy Analysis of Industrial Fluidized Bed Drying of Paddy. Energy 2015, 84, 131–138. [Google Scholar] [CrossRef]
  27. Surendhar, A.; Sivasubramanian, V.; Vidhyeswari, D.; Deepanraj, B. Energy and Exergy Analysis, Drying Kinetics, Modeling and Quality Parameters of Microwave-Dried Turmeric Slices. J. Therm. Anal. Calorim. 2019, 136, 185–197. [Google Scholar] [CrossRef]
  28. Guo, S.; Xiao, Y.; Tian, W.; Zhang, Z. Energy and Exergy Analysis of a Novel Efficient Combined Process by Hydrothermal Degradation and Superheated Steam Drying of Degradable Organic Wastes. J. Therm. Sci. 2006, 15, 274–280. [Google Scholar] [CrossRef]
  29. Aghbashlo, M.; Mobli, H.; Rafiee, S.; Madadlou, A. Energy and Exergy Analyses of the Spray Drying Process of Fish Oil Microencapsulation. Biosyst. Eng. 2012, 111, 229–241. [Google Scholar] [CrossRef]
  30. Amjad, W.; Hensel, O.; Munir, A.; Esper, A.; Sturm, B. Thermodynamic Analysis of Drying Process in a Diagonal-Batch Dryer Developed for Batch Uniformity Using Potato Slices. J. Food Eng. 2016, 169, 238–249. [Google Scholar] [CrossRef]
  31. Dincer, I.; Rosen, M.A. Exergy as a Driver for Achieving Sustainability. Int. J. Green. Energy 2004, 1, 1–19. [Google Scholar] [CrossRef]
  32. Erbay, Z.; Hepbasli, A. Application of Conventional and Advanced Exergy Analyses to Evaluate the Performance of a Ground-Source Heat Pump (GSHP) Dryer Used in Food Drying. Energy Convers. Manag. 2014, 78, 499–507. [Google Scholar] [CrossRef]
  33. Johnson, P.W.; Langrish, T.A.G. Exergy Analysis of a Spray Dryer: Methods and Interpretations. Dry Technol. 2018, 36, 578–596. [Google Scholar] [CrossRef]
  34. Golman, B.; Julklang, W. Analysis of Heat Recovery from a Spray Dryer by Recirculation of Exhaust Air. Energy Convers. Manag. 2014, 88, 641–649. [Google Scholar] [CrossRef]
  35. Li, J.; Si, Z.; Han, D.; Hang, Z. Thermo-Economic Performance Enhancement in Batch Evaporation Process via Mechanical Vapor Recompression System Coupled with Steam Accumulator. Desalination 2022, 532, 115735. [Google Scholar] [CrossRef]
Figure 1. Schematic diagram of multi-section condenser closed-loop drying system. (The temperature values in blue are from Run 13, Table A1, with the gas and cooling water temperatures marked in black and blue, respectively.)
Entropy 26 00809 g001
Figure 2. (A) Condenser setup of spray dryer; (B) Water-fed heat-recycling system [16].
Entropy 26 00809 g002
Figure 3. Spray dryer diagram with heat flows demonstrating location of pinch analysis.
Entropy 26 00809 g003
Figure 4. (A) Temperature–enthalpy graph for the hot streams. (B) Temperature–enthalpy graph of hot and cold streams on a composite curve.
Entropy 26 00809 g004
Figure 5. ΔTmin values for all experiments.
Entropy 26 00809 g005
Figure 6. Impact of pump rate, cooling water flow, and inlet temperature on ΔTmin across different aspirators (3.7, 5.6, 6.6 m/s) and its ANOVA results.
Entropy 26 00809 g006
Table 1. Thermodynamic information of designated streams.
StreamSource Temperature (°C)Target Temperature (°C)Heat Capacity Rate (W/K)
H175.1762.7210
H263.7047.5069.77
C146.3463.7069.77
Table 2. Heat capacity rates and heat loads of hot-stream sections.
Interval (°C)Temperature DifferenceTotal Heat Cap Rate (W/K)Heat Load (W)
75.17–63.7011.4810114.76
63.70–62.720.974879.7777.75
62.72–47.5015.2369.771062.34
Disclaimer/Publisher’s Note: The statements, opinions and data contained in all publications are solely those of the individual author(s) and contributor(s) and not of MDPI and/or the editor(s). MDPI and/or the editor(s) disclaim responsibility for any injury to people or property resulting from any ideas, methods, instructions or products referred to in the content.

