
Numerical Investigation of Effect of Nozzle Upper Divergent Angle on Asymmetric Rectangular Section Ejector


Abstract
1. Introduction
2. Methods
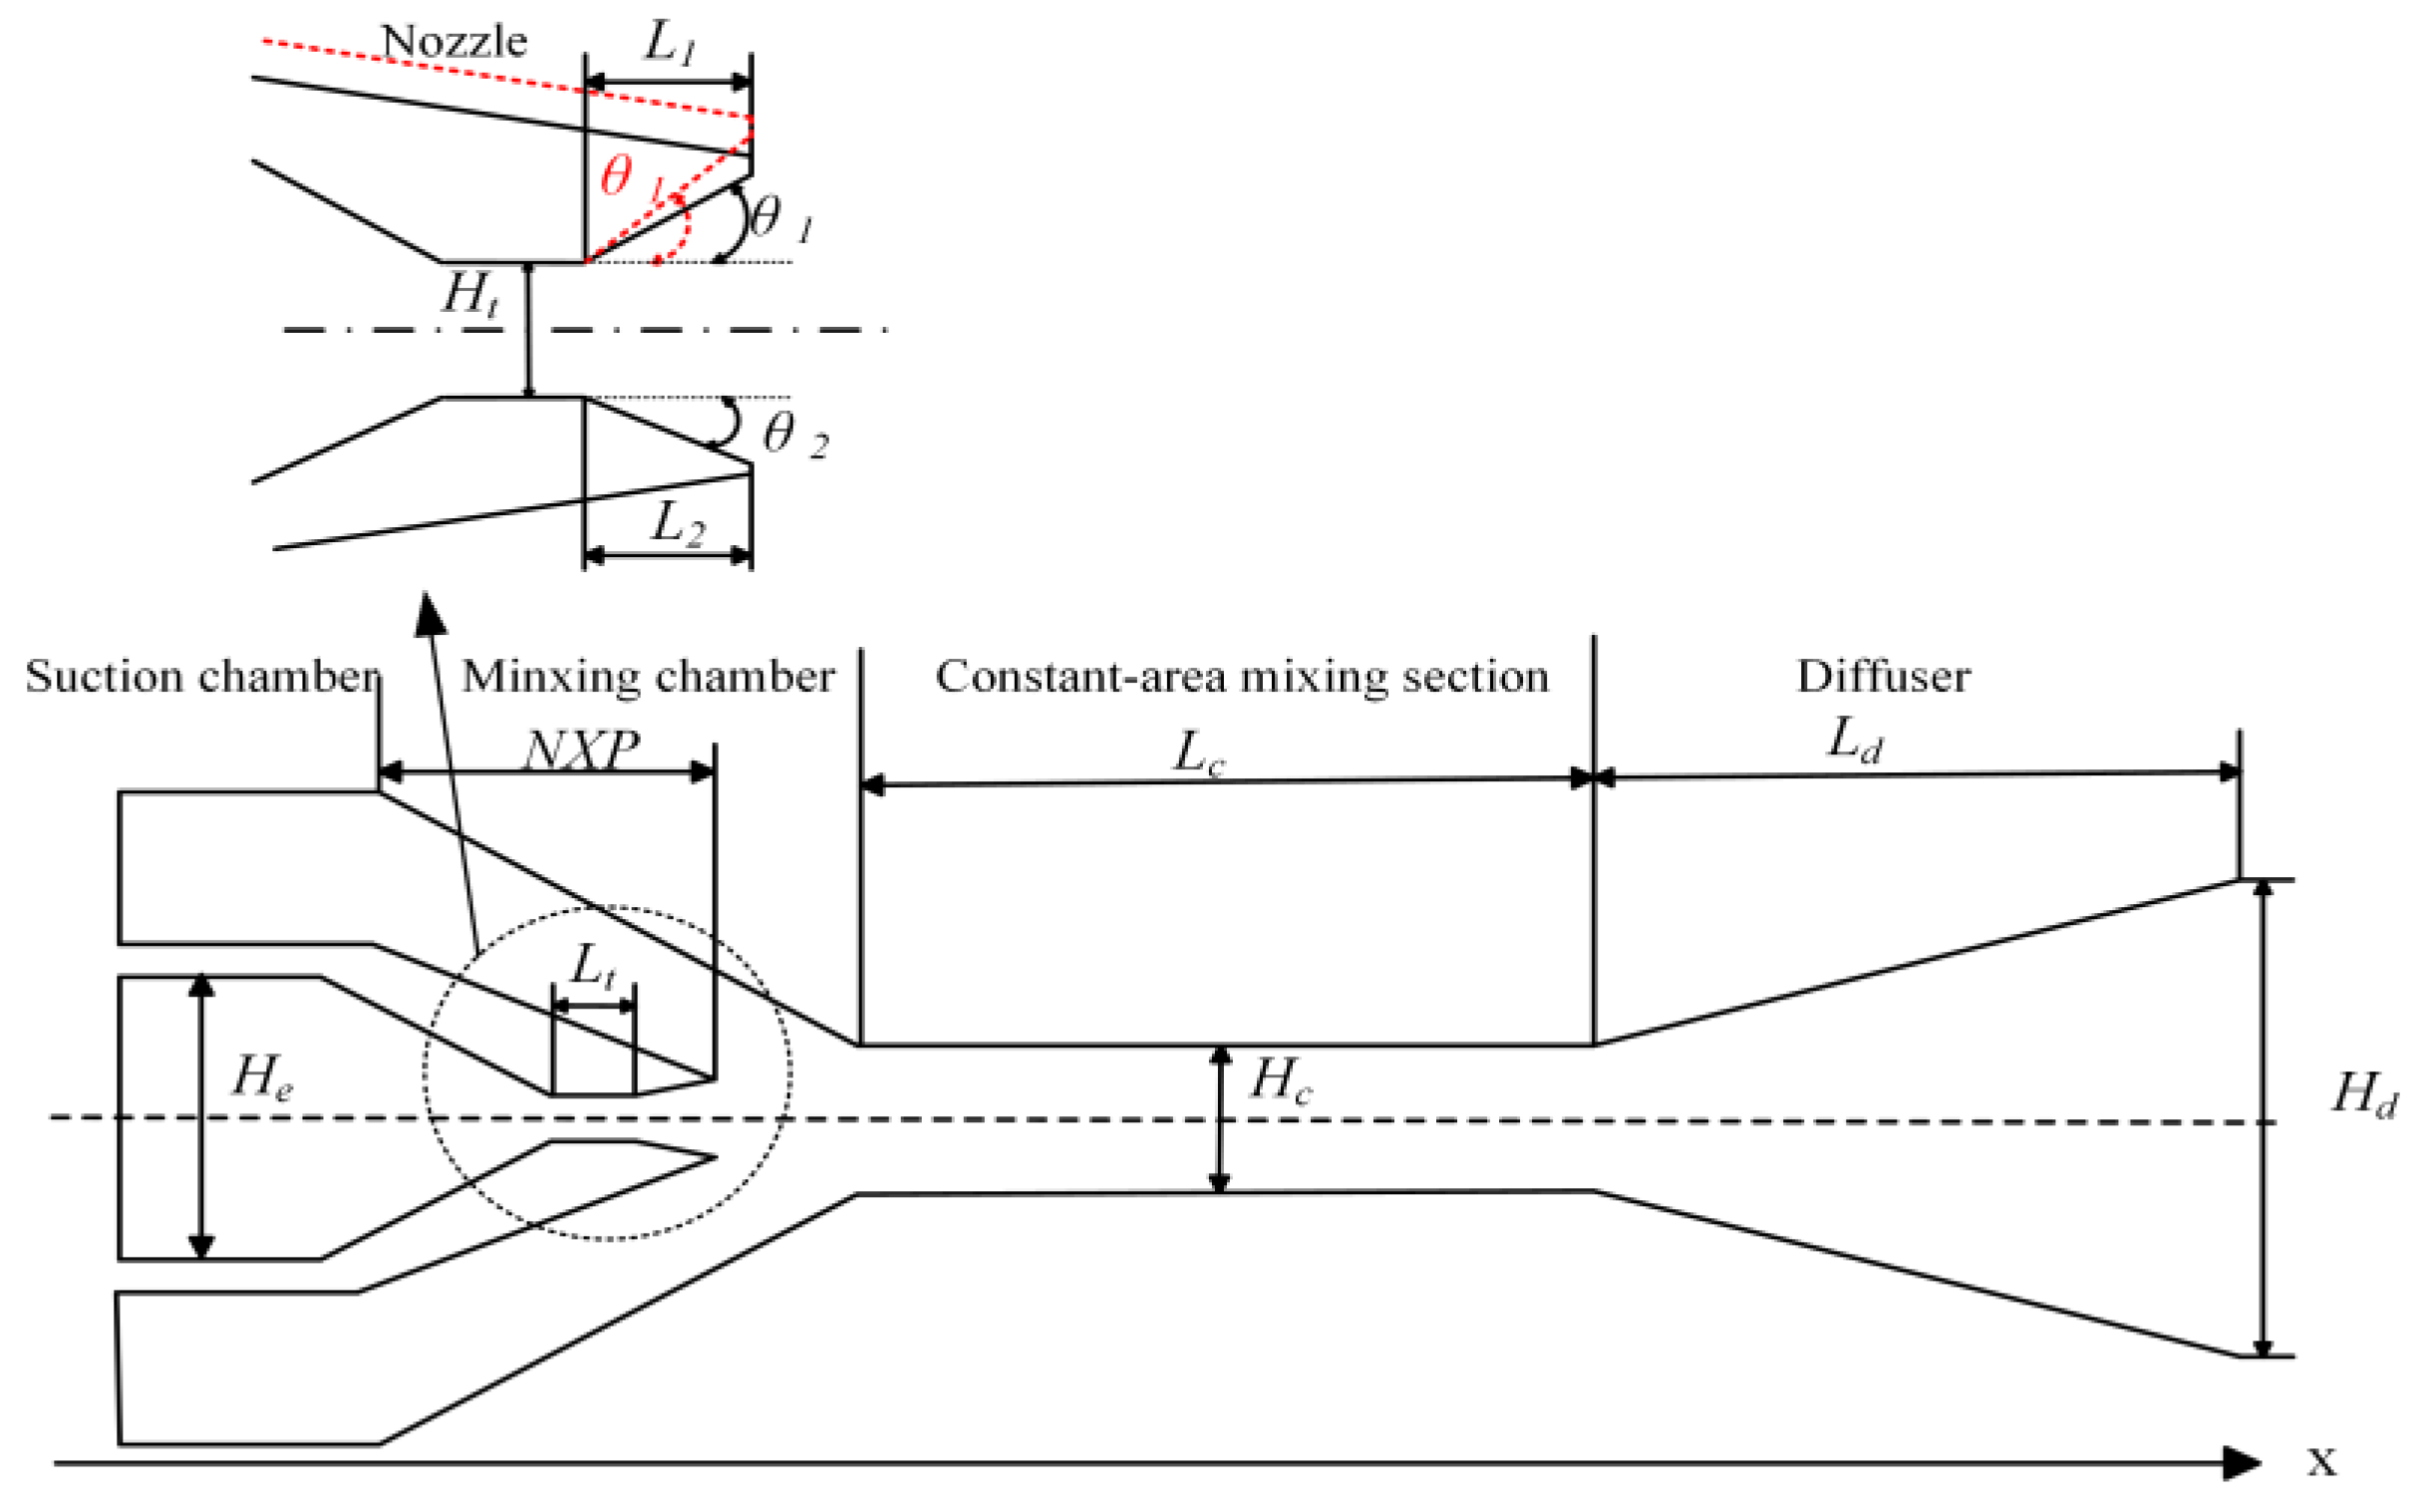
2.1. Geometry Model
2.2. Numerical Method and Physical Model
- (1)
- The fluid in the ejector is a compressible ideal gas.
- (2)
- The walls of the ejector are non-slip and adiabatic.
- (3)
- Throughout the entire operation, the temperature variations brought on by the gas supersonic movement are disregarded.
- (4)
- The constant pressure principle governs the mixing process.
- (5)
- At all inlets, the fluid velocity is disregarded.
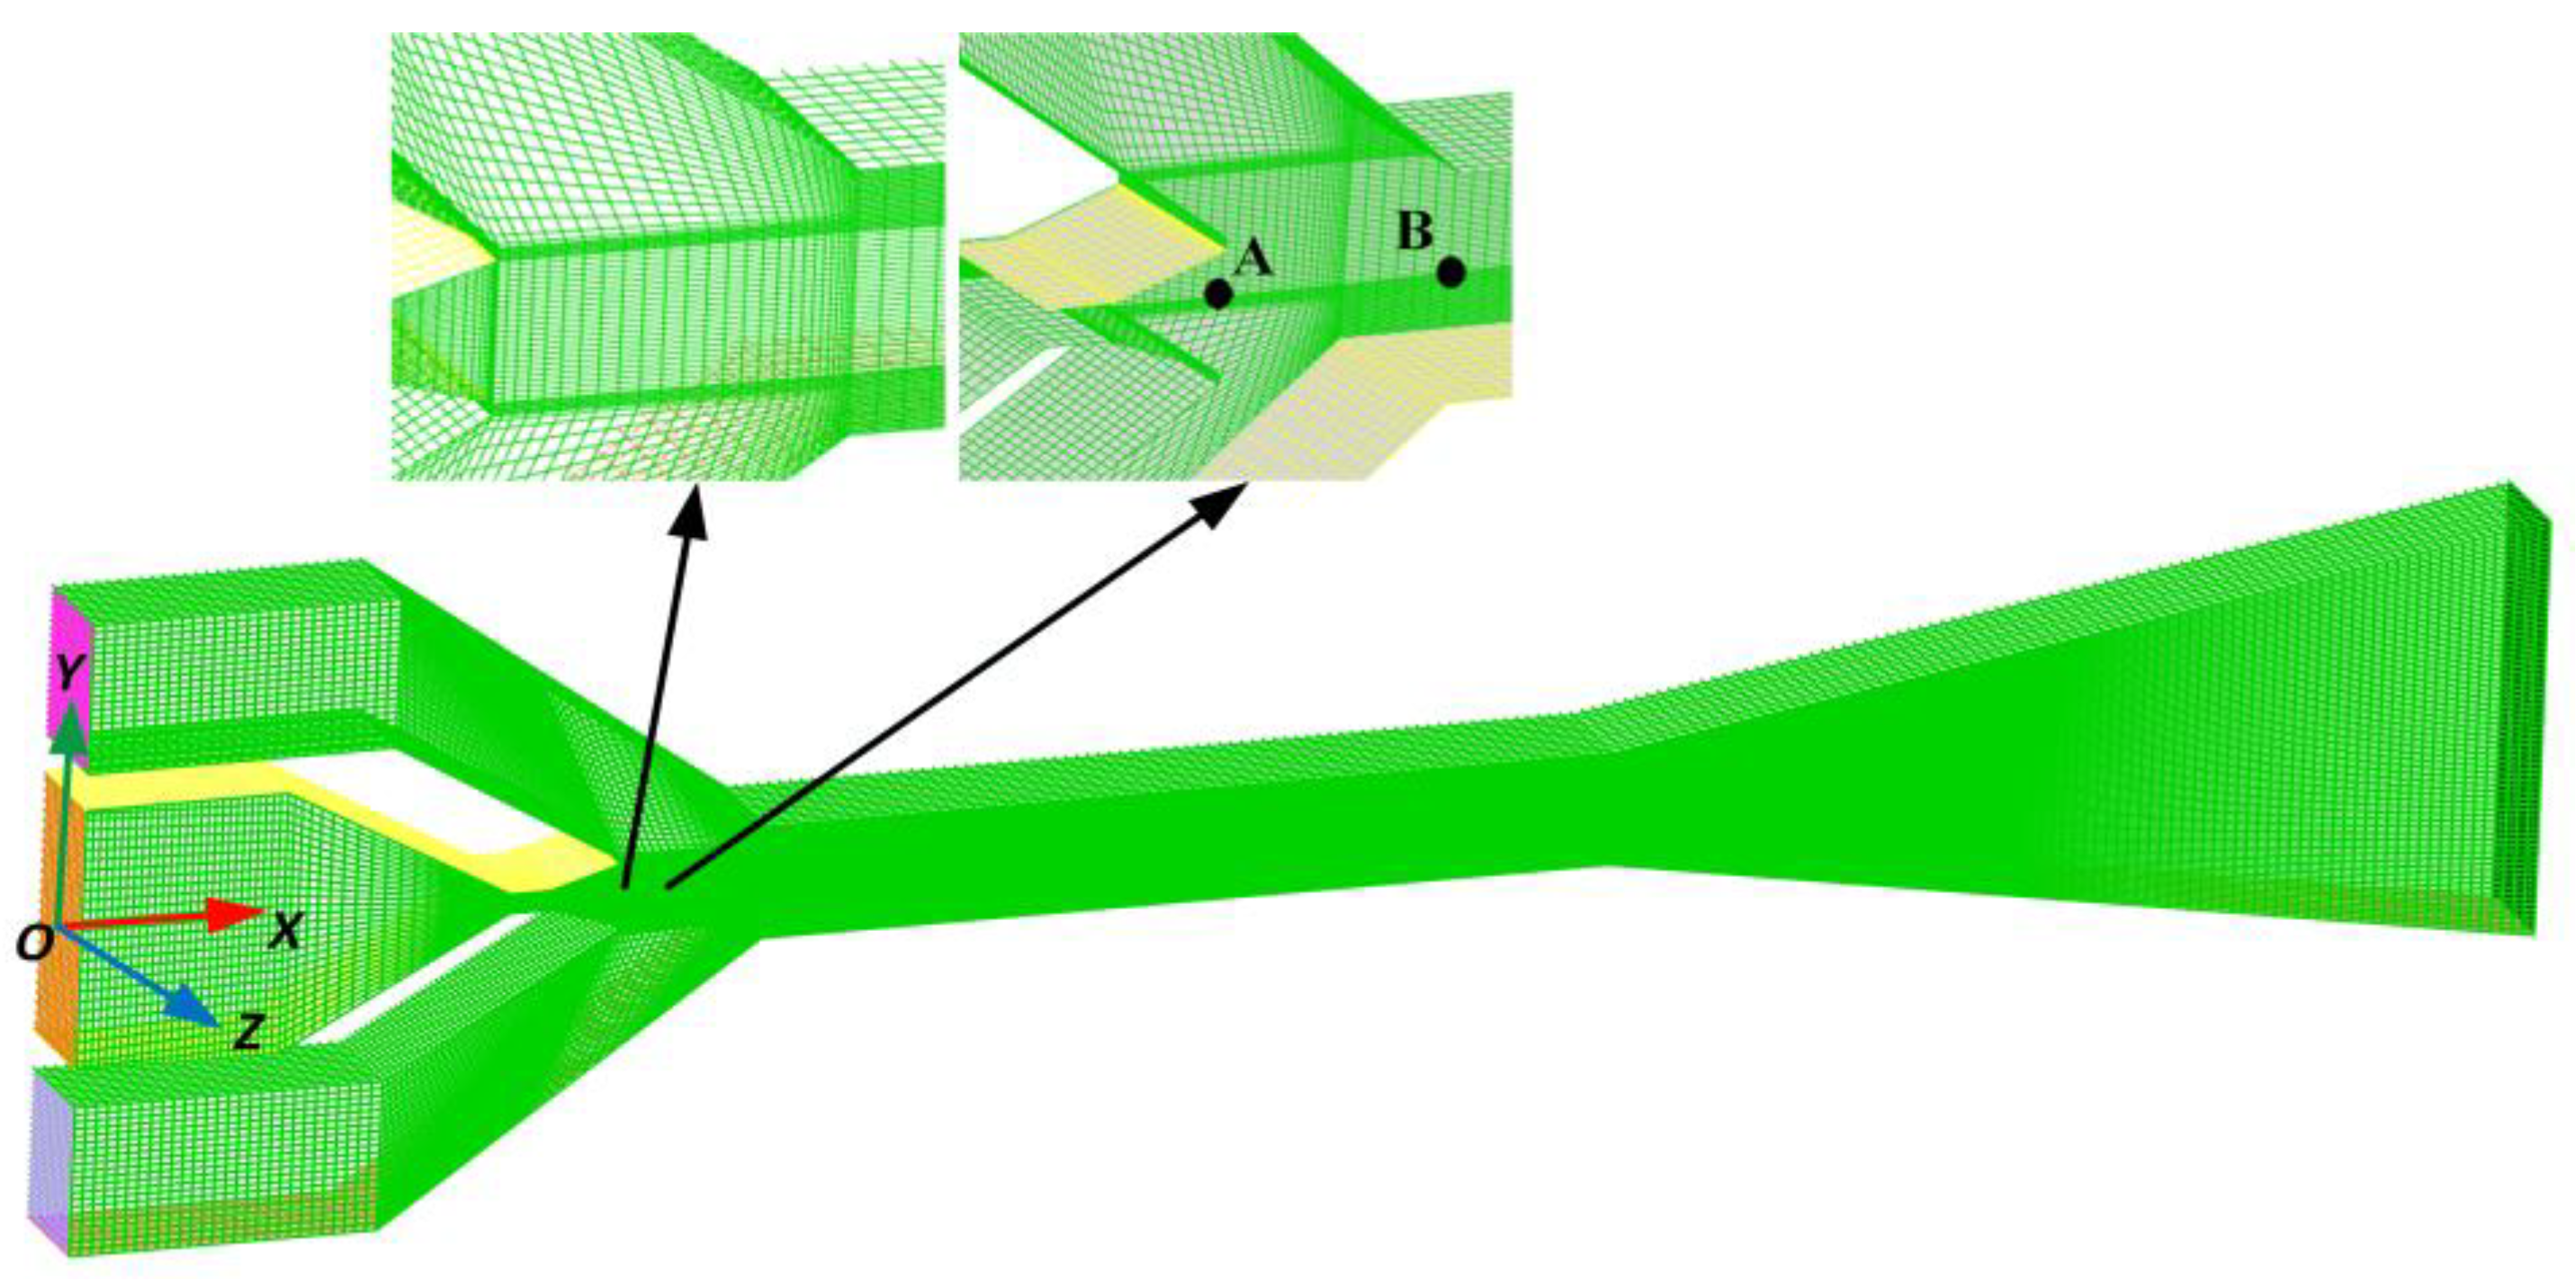
2.3. Validation of Grid Independence
3. Results and Discussion
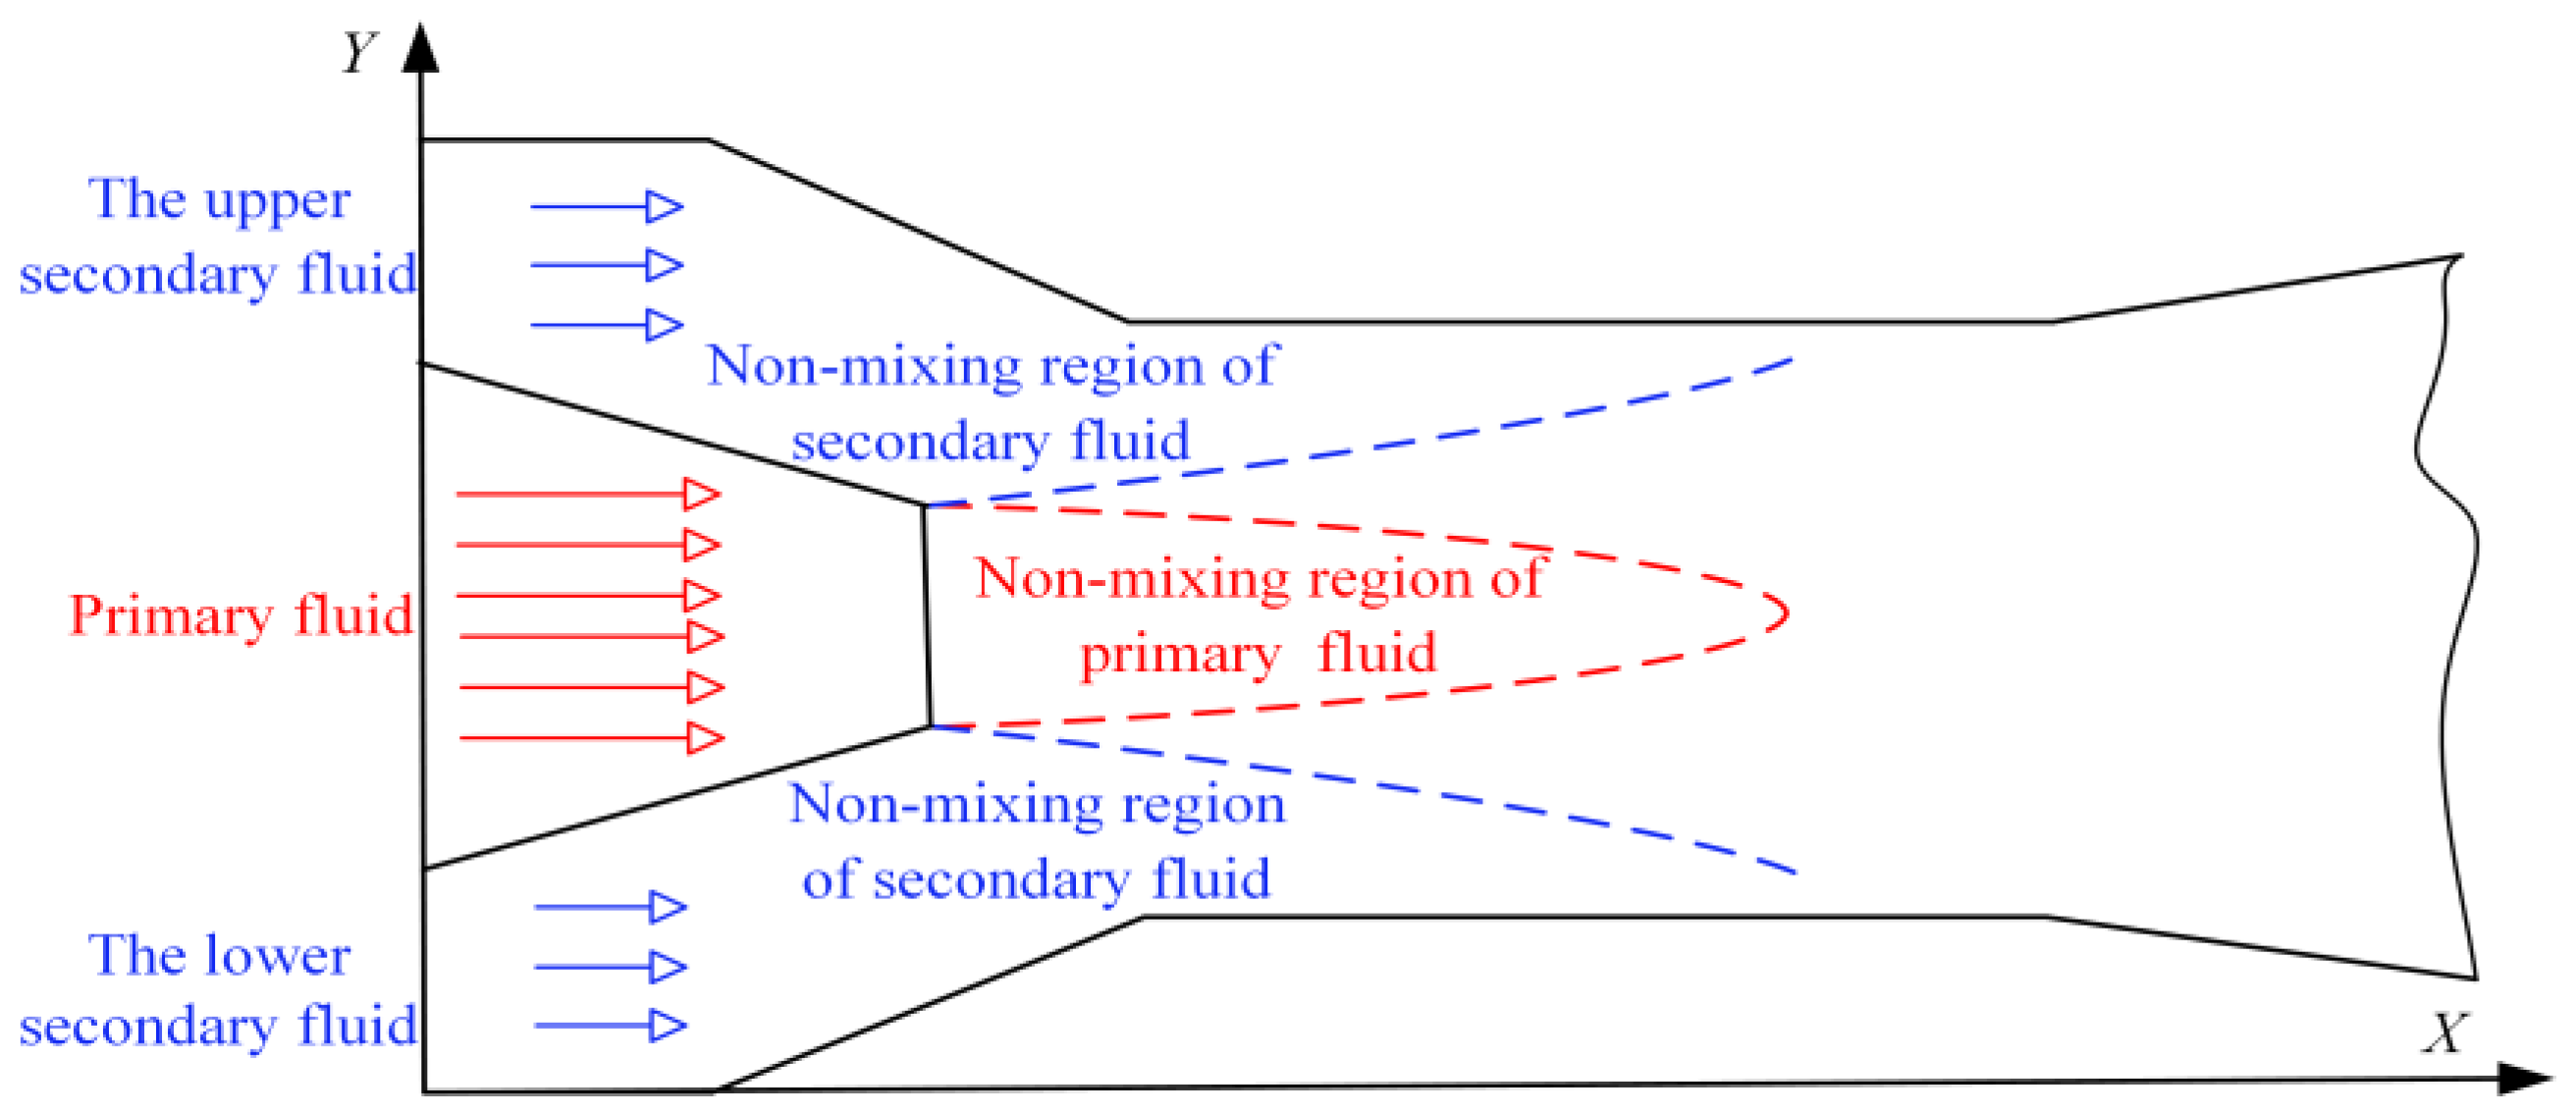
3.1. Flow Characteristic Analysis
3.2. Mixing Characteristic Analysis
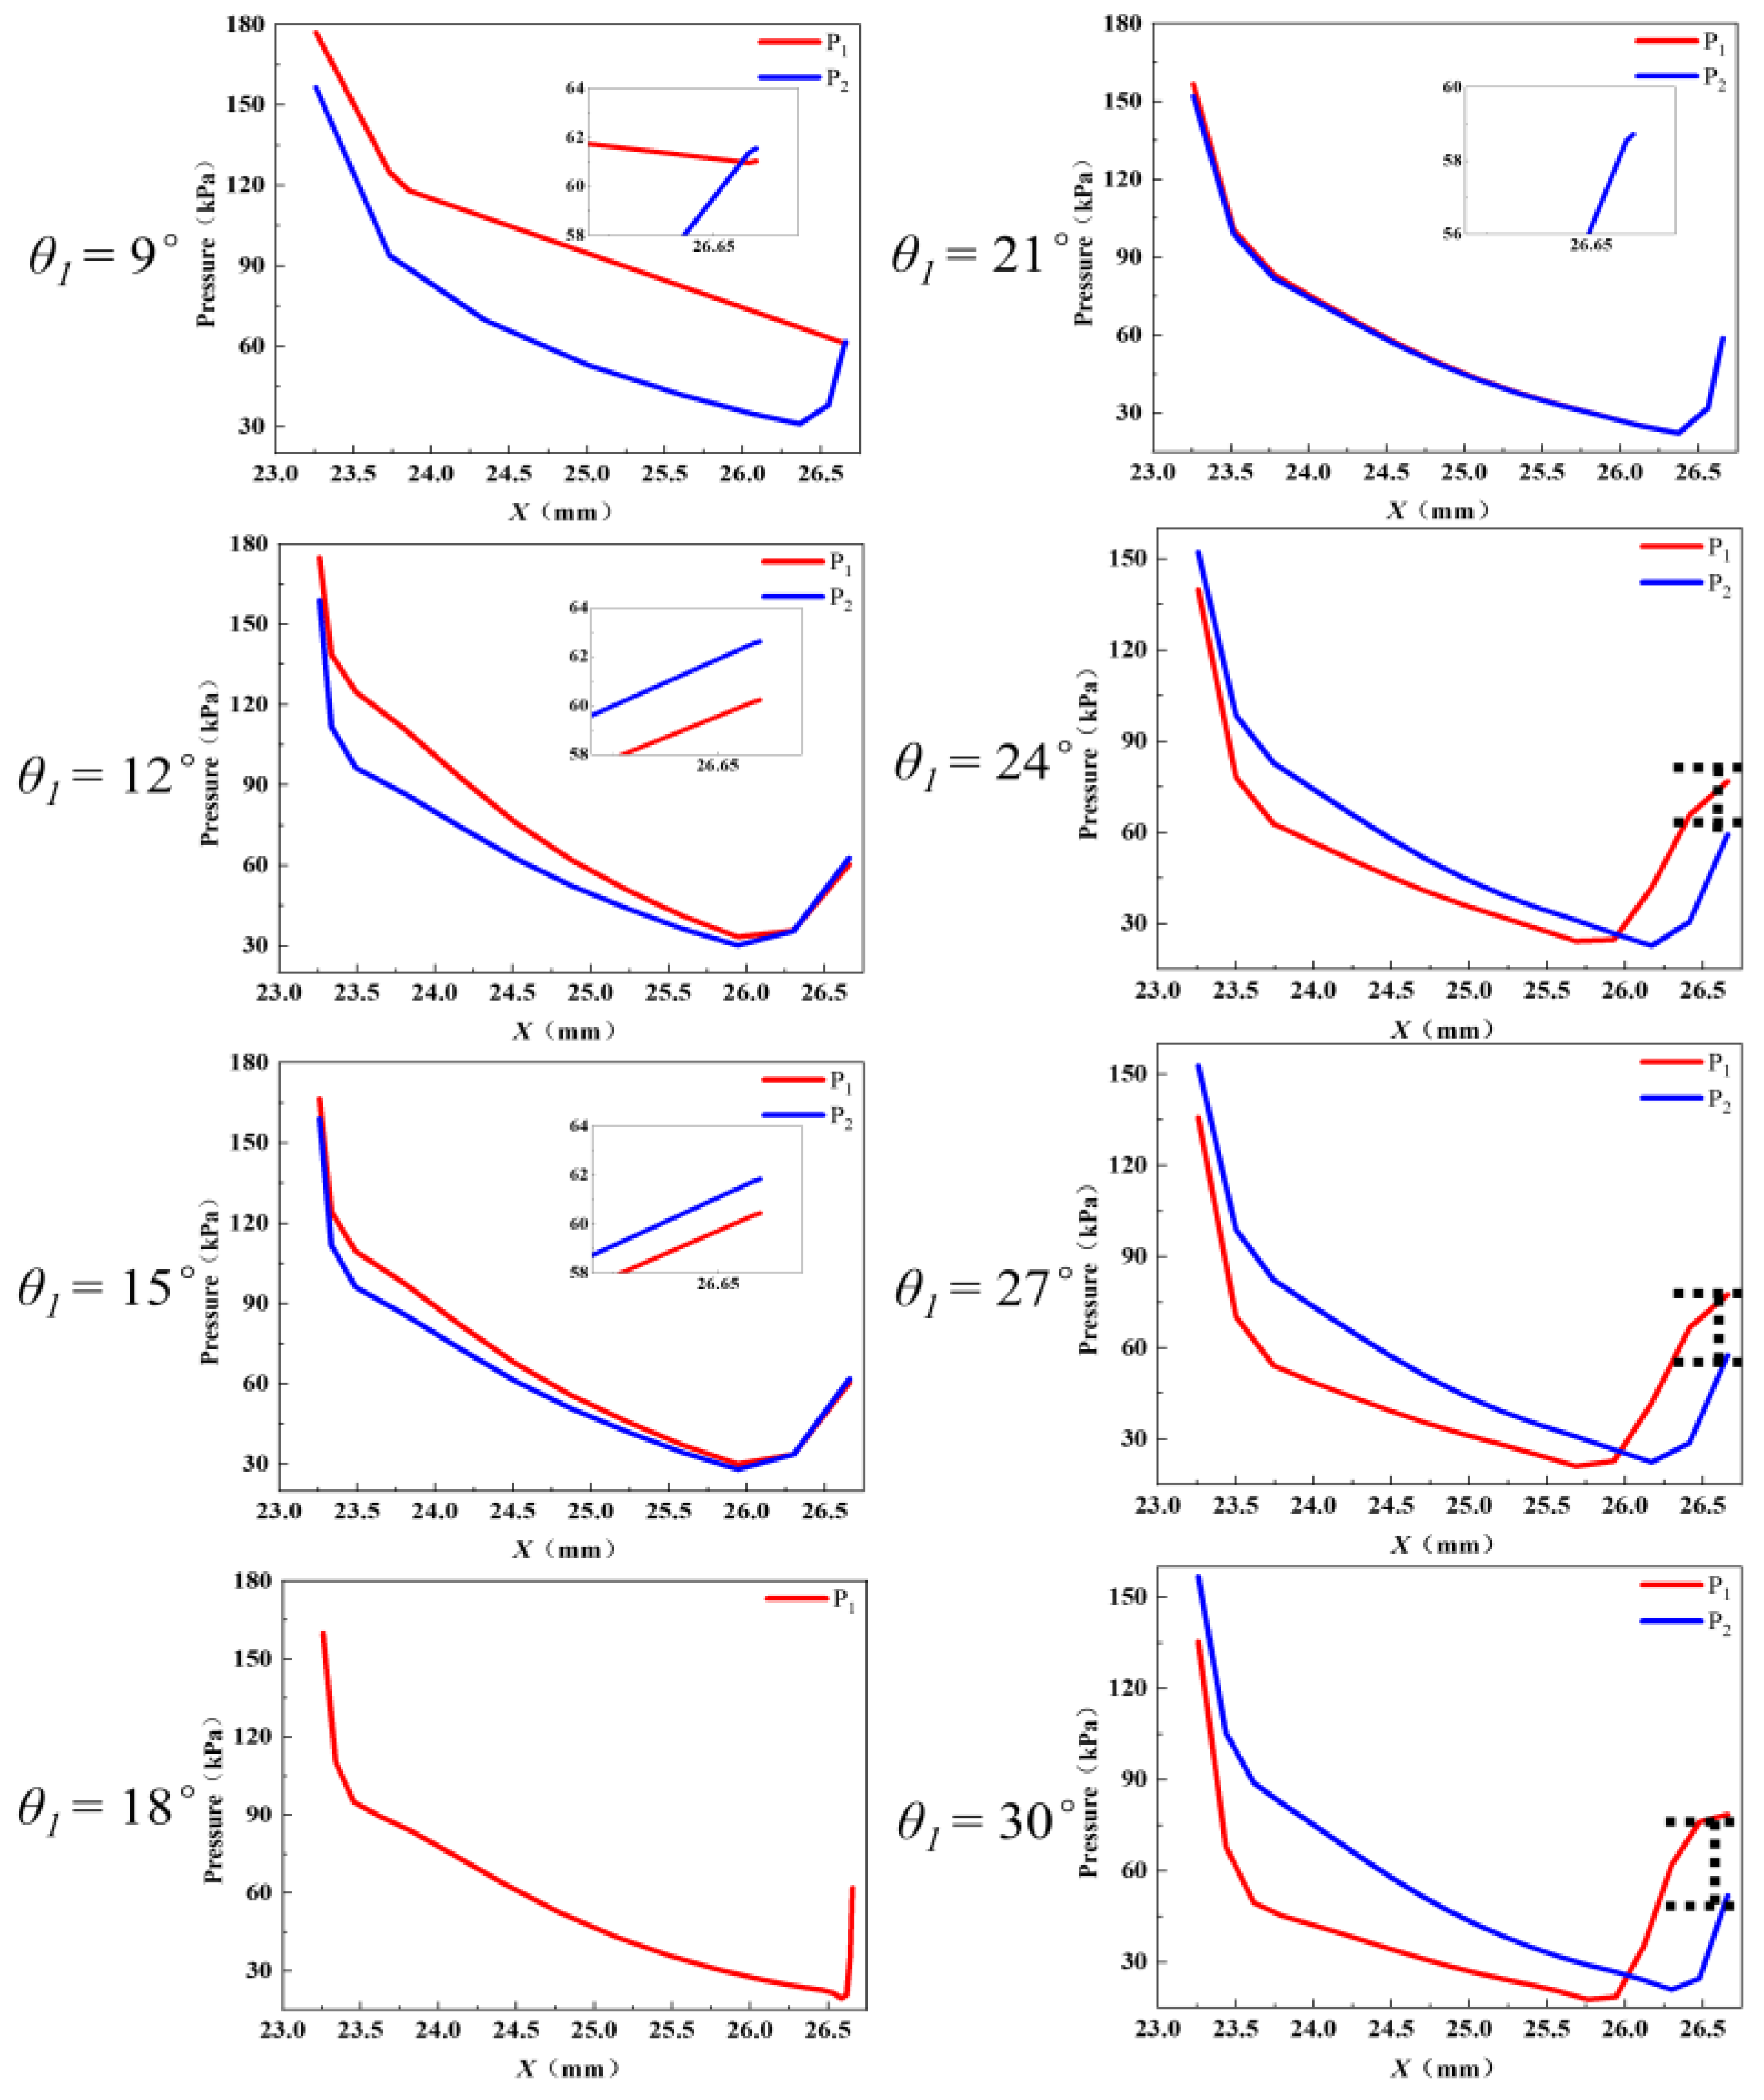
3.3. Shock Wave Characteristic Analysis
4. Conclusions
- (1)
- The nozzle upper divergent angle had a significant effect on the ω. With an increase in θ1, ω decreased gradually. The ω decreased from 0.575 to 0.46, a decrease of 20%. However, the variation trend of ms1 and ms2 was opposite. When θ1 was smaller than θ2, ms1 was greater than ms2. When θ1 was greater than θ2, ms1 was less than ms2.
- (2)
- The deflection of the central jet of the primary fluid was caused by the pressure difference between the walls of the upper and lower expansion section of the nozzle.
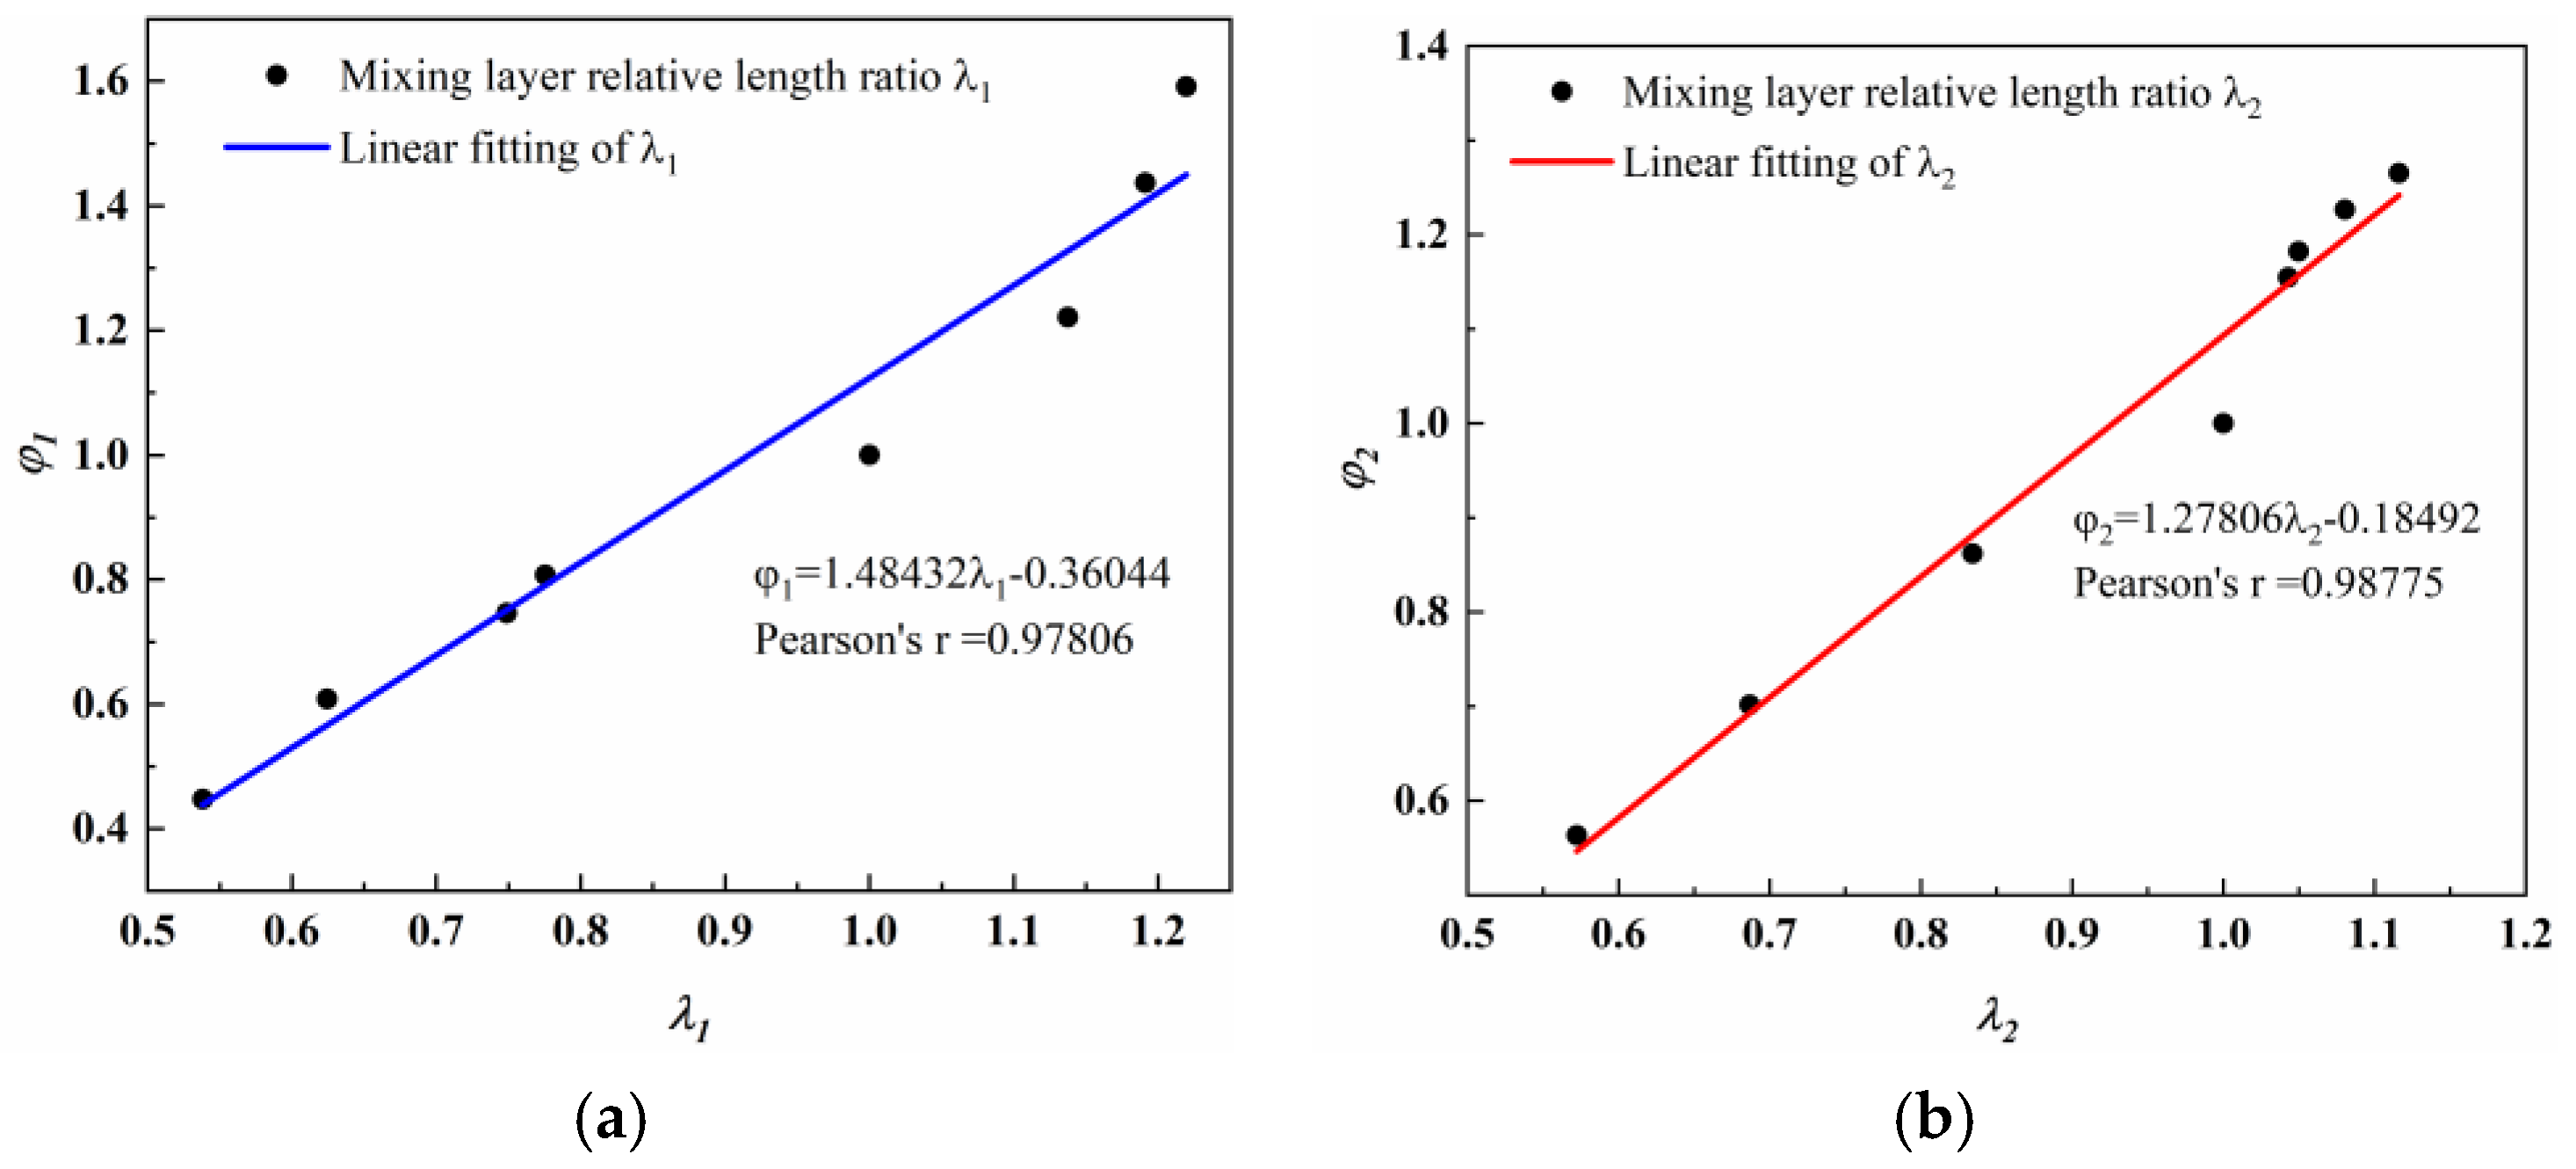
- (3)
- As λ increased, there was a corresponding increase in φ. There was a high degree of linear correlation between λ and φ.
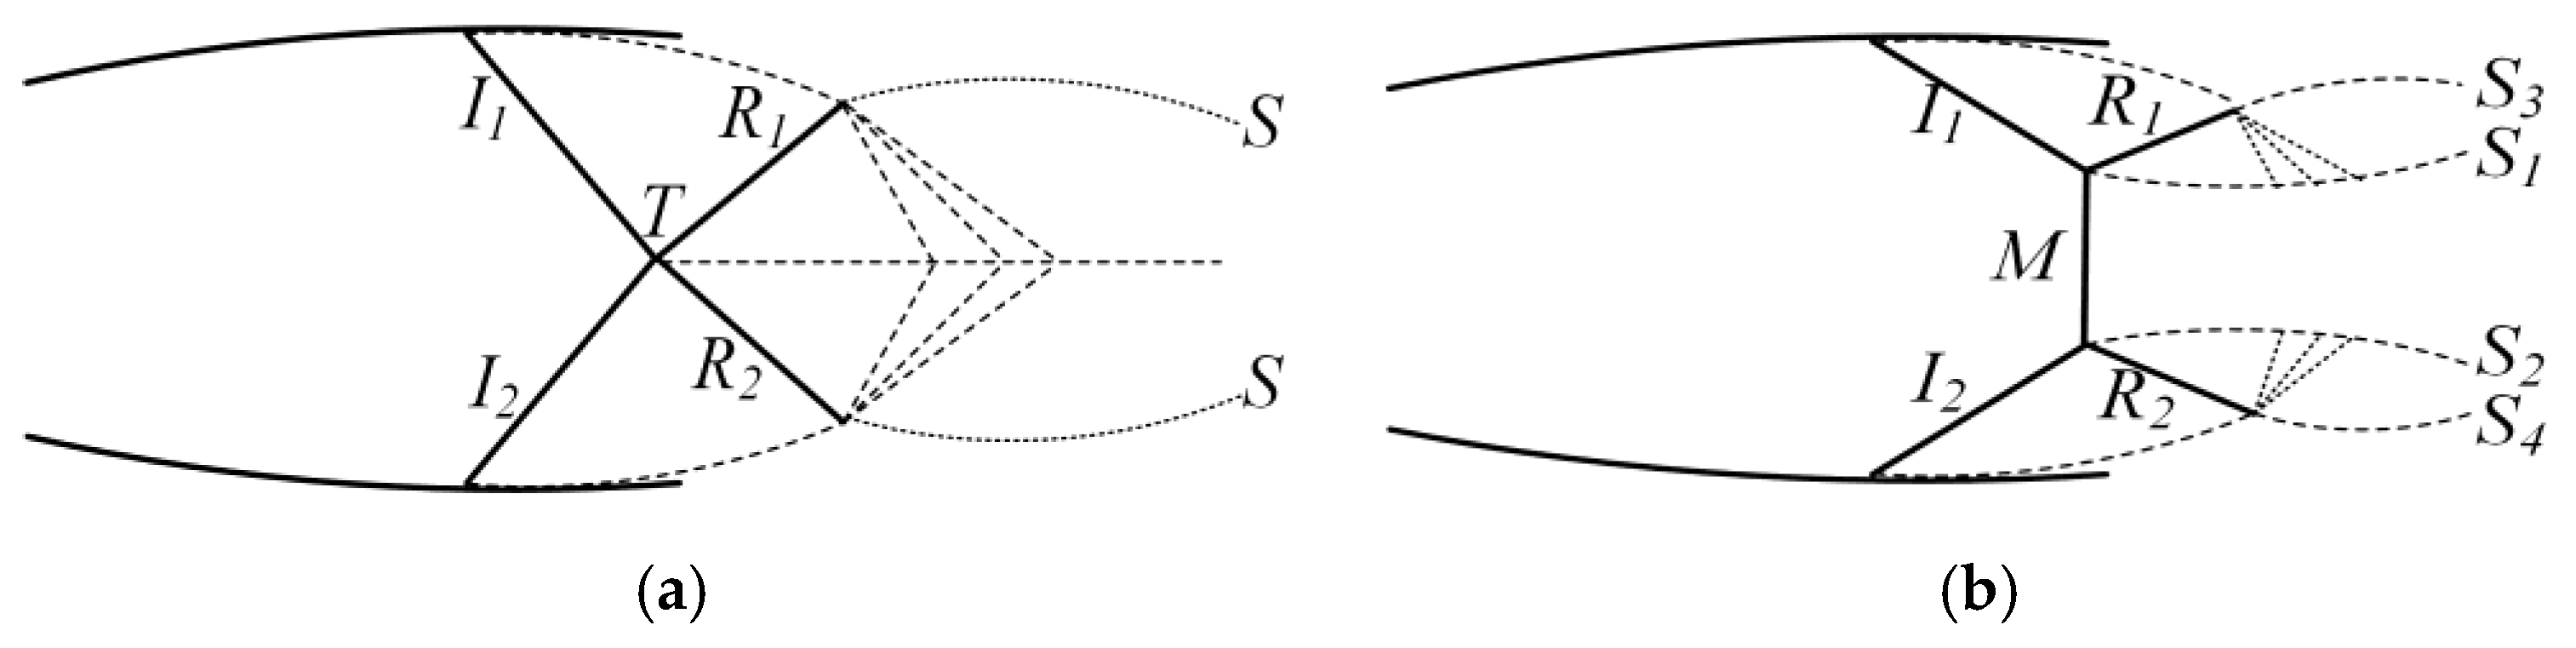
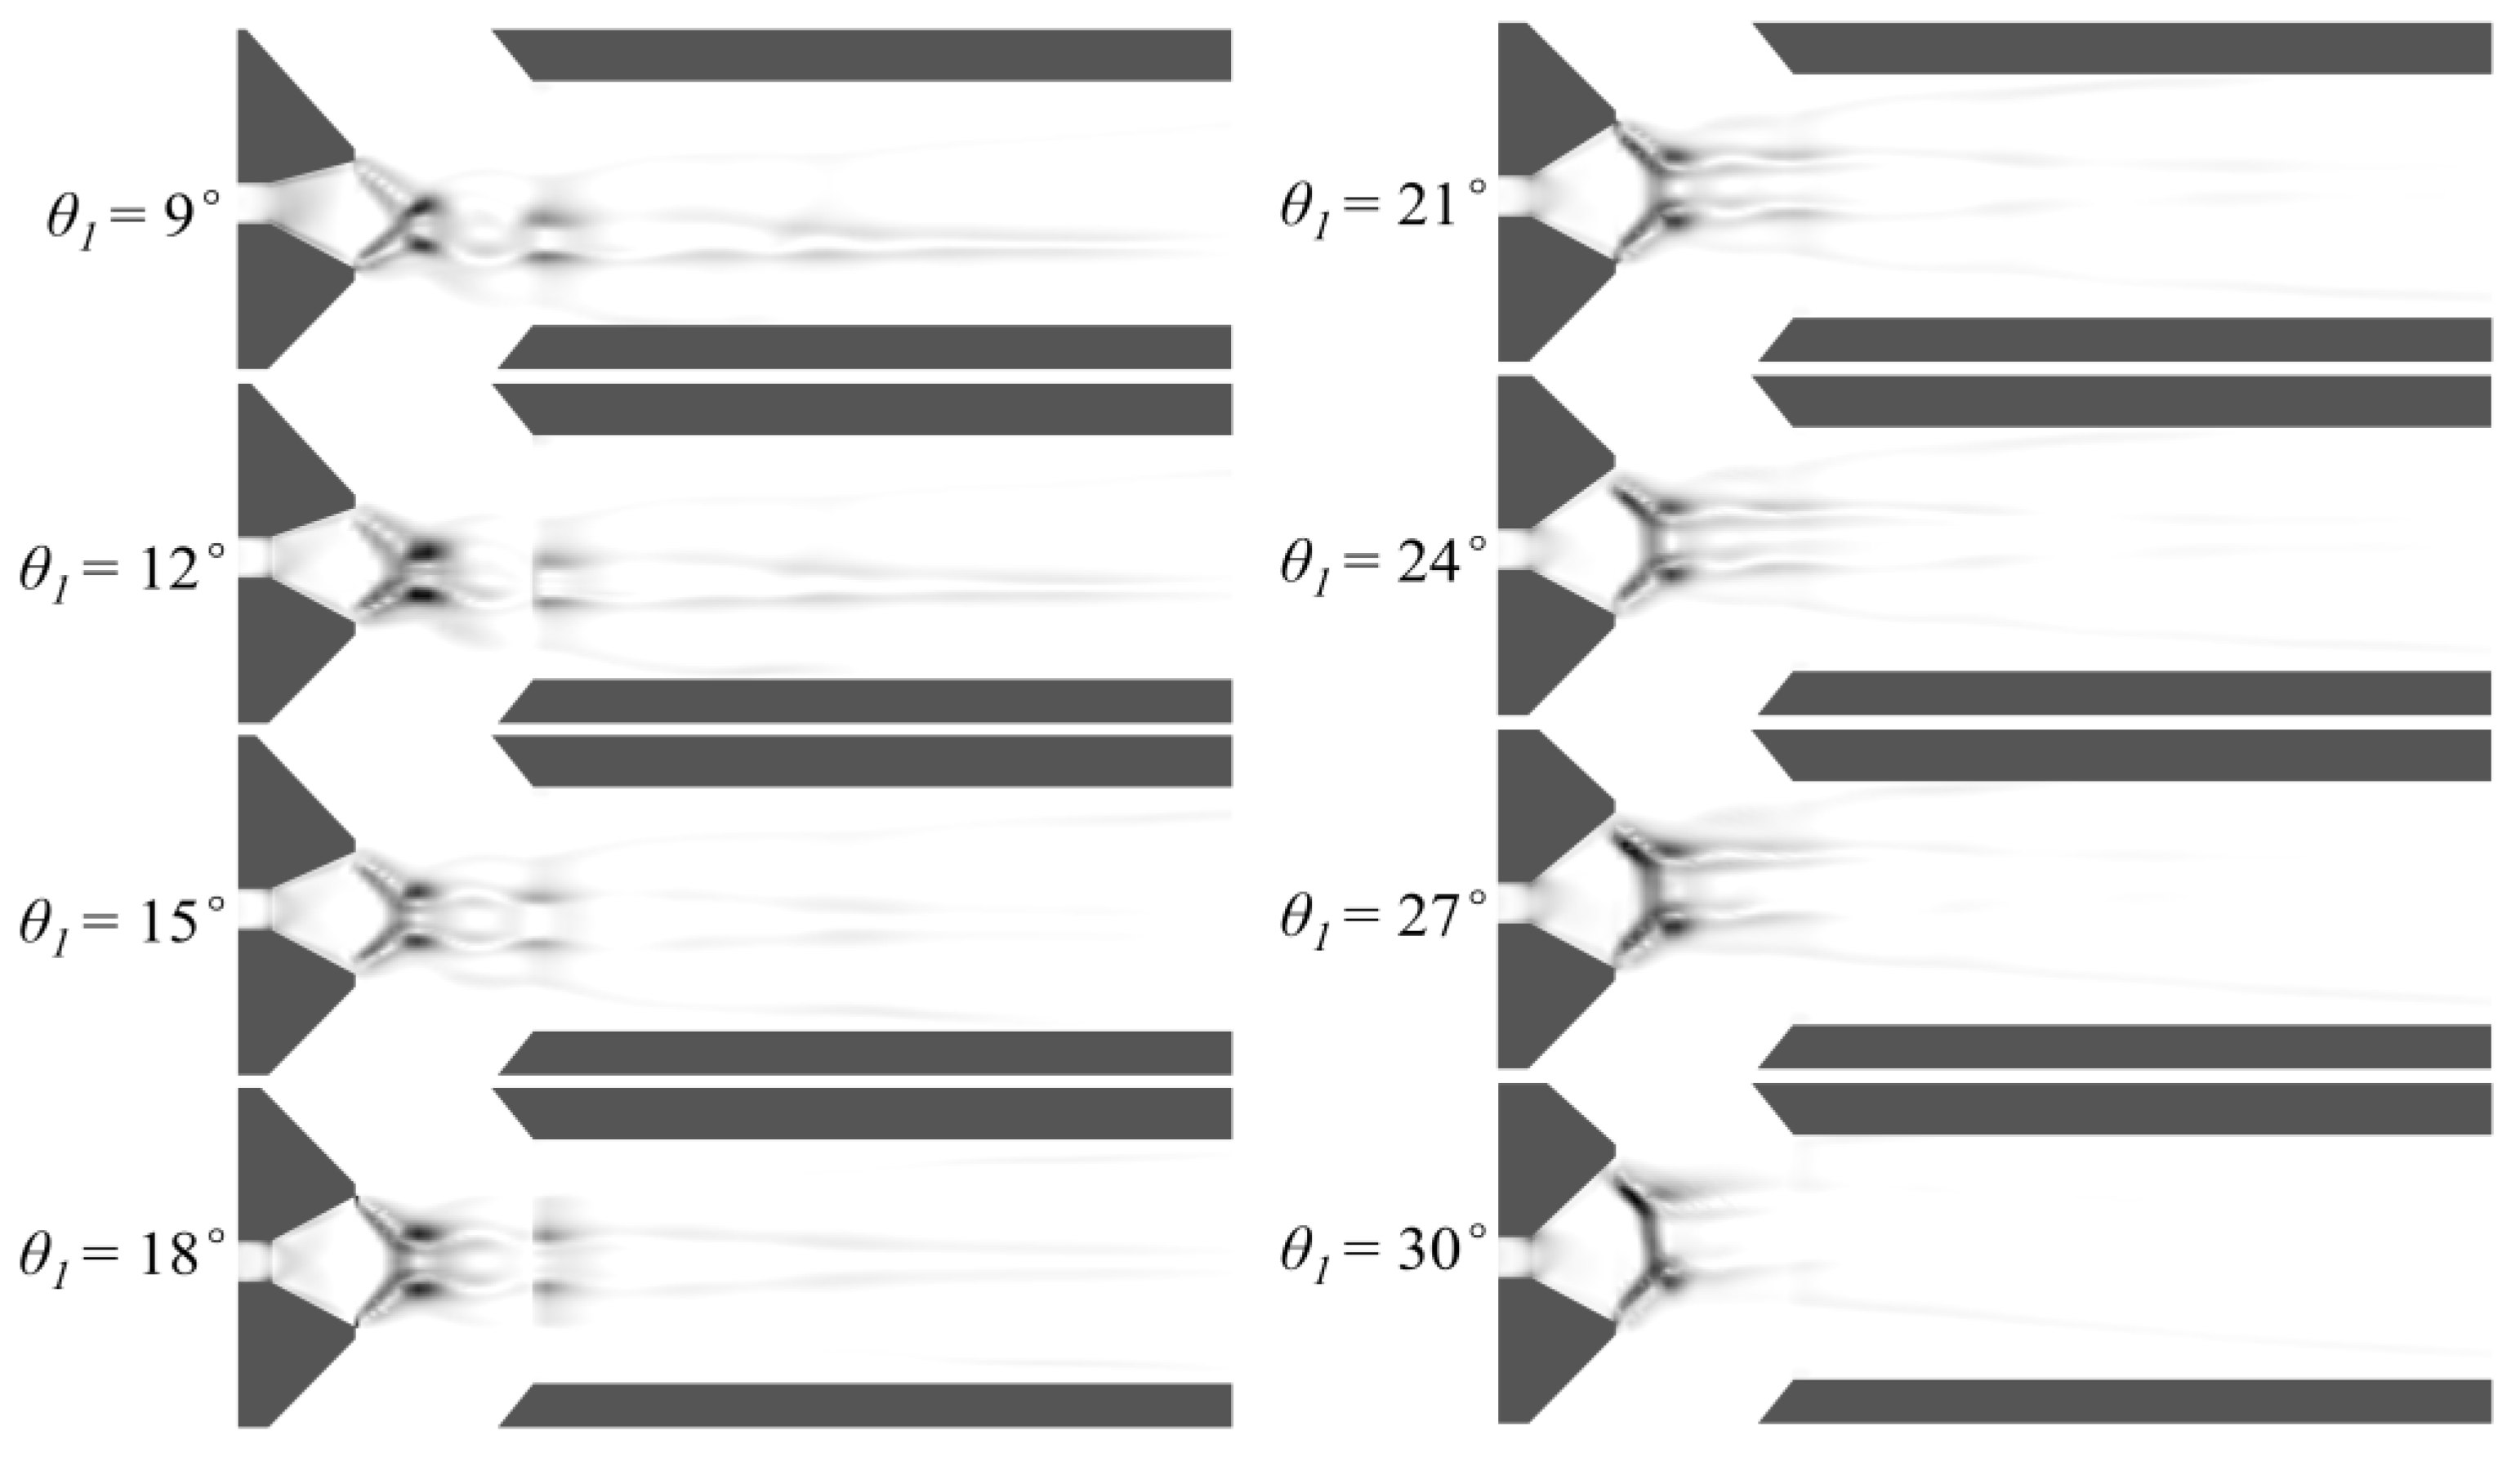
- (4)
- As θ1 increased, the reflection type of the first shock wave transitioned from regular reflection to Mach reflection. In the condition of Mach reflection, the increase in θ1 caused a rise in the height of the Mach stem, accompanied by a decrease in the intensity of the shock wave. These alterations collectively deteriorated the ejector performance to a certain extent.
Author Contributions
Funding
Institutional Review Board Statement
Data Availability Statement
Conflicts of Interest
References
- Wen, C.; Gong, L.; Ding, H.B.; Yang, Y. Steam ejector performance considering phase transition for multi-effect distillation with thermal vapour compression (MED-TVC) desalination system. Appl. Energy. 2020, 279, 115831. [Google Scholar] [CrossRef]
- Dong, J.M.; Yu, M.Q.; Wang, W.N.; Song, H.; Li, C.L.; Pan, X.X. Experimental investigation on low-temperature thermal energy driven steam ejector refrigeration system for cooling application. Appl. Therm. Eng. 2017, 123, 167–176. [Google Scholar] [CrossRef]
- Zhang, J.G.; Wang, X.G.; Pourranjbar, D.; Dykas, S.; Li, H.; Chen, J.H. The comprehensive analysis of the relationship between the latent heat, entrainment ratio, and ejector performance under different superheating degree conditions considering the non-equilibrium condensation. Appl. Therm. Eng. 2022, 200, 117701. [Google Scholar] [CrossRef]
- Cao, Z.; Zhou, S.H.; He, Y.; Xu, Y.J.; Chen, H.S.; Deng, J.Q. Numerical study on adiabatic compressed air energy storage system with only one ejector alongside final stage compression. Appl. Therm. Eng. 2022, 216, 119071. [Google Scholar] [CrossRef]
- Zhou, S.H.; He, Y.; Chen, H.S.; Xu, Y.J.; Deng, J.Q. Performance analysis of a novel adiabatic compressed air energy system with ejectors enhanced charging process. Energy 2020, 205, 118050. [Google Scholar] [CrossRef]
- Qing, S.W.; Wang, Y.; Wen, X.K.; Zhong, J.L.; Gou, X.L.; Tang, S.L. Optimal working-parameter analysis of an ejector integrated into the energy-release stage of a thermal-storage compressed air energy storage system under constant-pressure operation: A case study. Energy Convers. Manag. 2021, 247, 114715. [Google Scholar] [CrossRef]
- Dong, J.M.; Hu, Q.Y.; Yu, M.Q.; Han, Z.T.; Cui, W.B.; Liang, D.L.; Ma, H.B.; Pan, X.X. Numerical investigation on the influence of mixing chamber length on steam ejector performance. Appl. Therm. Eng. 2020, 174, 115204. [Google Scholar] [CrossRef]
- Tang, Y.Z.; Liu, Z.L.; Li, Y.X.; Yang, N.; Wan, Y.D.; Chua, K.J. A double-choking theory as an explanation of the evolution laws of ejector performance with various operational and geometrical parameters. Energy Convers. Manag. 2020, 206, 112499. [Google Scholar] [CrossRef]
- Croquer, S.; Poncet, S.; Galanis, N. Comparison of ejector predicted performance by thermodynamic and CFD models. Int. J. Refrig. 2016, 68, 28–36. [Google Scholar] [CrossRef]
- Han, J.Q.; Pang, Z.H.; Feng, J.M.; Besagni, G.; Mereu, R.; Inzoli, F.; Peng, X.Y. Experimental and numerical study on the ejector containing condensable species in the secondary flow for PEM fuel cell applications. Appl. Therm. Eng. 2023, 232, 121091. [Google Scholar] [CrossRef]
- Tan, J.G.; Zhang, D.D.; Lv, L. A review on enhanced mixing methods in supersonic mixing layer flows. Acta Astronaut. 2018, 152, 310–324. [Google Scholar] [CrossRef]
- Fu, W.N.; Li, Y.X.; Liu, Z.L.; Wu, H.Q.; Wu, T.R. Numerical study for the influences of primary nozzle on steam ejector performance. Appl. Therm. Eng. 2016, 106, 1148–1156. [Google Scholar] [CrossRef]
- Wang, L.; Yan, J.; Wang, C.; Li, X.B. Numerical study on optimization of ejector primary nozzle geometries. Int. J. Refrig. 2017, 76, 219–229. [Google Scholar] [CrossRef]
- Yan, J.; Cai, W.J.; Li, Y.Z. Geometry parameters effect for air-cooled ejector cooling systems with R134a refrigerant. Renew. Energy 2012, 46, 155–163. [Google Scholar] [CrossRef]
- Li, C.; Sun, B.G.; Luo, Q.H. Effect of Structural Parameters and Operational Characteristic Analysis on Ejector Used in Proton Exchange Membrane Fuel Cell. Sustainability 2022, 14, 9205. [Google Scholar] [CrossRef]
- Munday, J.T.; Bagster, D.F. A new ejector theory applied to steam jet refrigeration. Ind. Eng. Chem. Process 1977, 16, 442–449. [Google Scholar] [CrossRef]
- Huang, B.J.; Chang, J.M.; Wang, C.P.; Petrenko, V.A. A 1-D analysis of ejector performance. Int. J. Refrig. 1999, 22, 354–364. [Google Scholar] [CrossRef]
- Ariafar, K.; Buttsworth, D.; Al-Doori, G.; Malpress, R. Effect of mixing on the performance of wet steam ejectors. Energy 2015, 93, 2030–2041. [Google Scholar] [CrossRef]
- Ariafar, K.; Buttsworth, D.; Al-Doori, G.; Sharifi, N. Mixing layer effects on the entrainment ratio in steam ejectors through ideal gas computational simulations. Energy 2016, 95, 380–392. [Google Scholar] [CrossRef]
- Tang, Y.Z.; Liu, Z.L.; Li, Y.X.; Huang, Z.F.; Chua, K.J. Study on fundamental link between mixing efficiency and entrainment performance of a steam ejector. Energy 2021, 215, 119128. [Google Scholar] [CrossRef]
- Tang, Y.Z.; Liu, Z.L.; Li, Y.X.; Zhao, F.; Fan, P.Y.; Chua, K.J. Mixing process of two streams within a steam ejector from the perspectives of mass, momentum and energy transfer. Appl. Therm. Eng. 2021, 185, 116358. [Google Scholar] [CrossRef]
- Zhu, Y.H.; Jiang, P.X. Experimental and analytical studies on the shock wave length in convergent and convergent–divergent nozzle ejectors. Energy Convers. Manag. 2014, 88, 907–914. [Google Scholar] [CrossRef]
- Chen, W.X.; Hou, Y.Y.; Zheng, J.T.; Chong, D.T.; Yan, J.J. Studies on Shock Wave Structures in Supersonic Ejector and Its Influence on Ejector Performance. Heat Transf. Eng. 2024, 45, 631–641. [Google Scholar] [CrossRef]
- Arun, K.M.; Tiwari, S.; Mani, A. Three-dimensional numerical investigations on rectangular cross-section ejector. Int. J. Therm. Sci. 2017, 122, 257–265. [Google Scholar] [CrossRef]
- Su, Y.F. Investigation on Pumping Performance of Non-Axisymmetric Supersonic Ejector. Master’s Thesis, Nanjing University of Aeronautics and Astronautics, Nanjing, China, 2020. [Google Scholar]
- Leng, Z.M.; Zhou, J.H. Numerical Investigation for Performance of Non-Axisymmetric Front Variable Area Bypasses Injector. J. Propuls. Technol. 2015, 36, 1465–1473. [Google Scholar]
- Zhang, Y.; Dong, J.M.; Song, S.Y.; Pan, X.X.; He, N.; Lu, M.F. Numerical Investigation on the Effect of Section Width on the Performance of Air Ejector with Rectangular Section. Entropy 2023, 25, 179. [Google Scholar] [CrossRef]
- Su, Y.F.; Shan, Y.; Wang, L. Experimental Investigation on Non-Axisymmetric Supersonic Ejector. J. Chongqing Univ. Technol. (Nat. Sci.) 2020, 34, 91–98. [Google Scholar]
- Besagni, G.; Inzoli, F. Computational fluid-dynamics modeling of supersonic ejectors: Screening of turbulence modeling approaches. Appl. Therm. Eng. 2017, 117, 122–144. [Google Scholar] [CrossRef]
- Ruangtrakoon, N.; Thongtip, T.; Aphornratana, S.; Sriveerakul, T. CFD simulation on the effect of primary nozzle geometries for a steam ejector in refrigeration cycle. Int. J. Therm. Sci. 2013, 63, 133–145. [Google Scholar] [CrossRef]
- Quirk, J.J. A contribution to the great Riemann solver debate. Int. J. Numer. Methods Fluids 2010, 18, 555–574. [Google Scholar] [CrossRef]
- Mach, E.G.E. Ueber den Verlauf der Funkenwellen in der Ebene und in Raume. J. Phys. Theor. Appl. 1879, 8, 94–100. [Google Scholar]


| Parameter | Symbol | Value | Unit |
|---|---|---|---|
| Constant-area mixing section height | Hc | 6 | mm |
| Diffuser outlet height | Hd | 22.3 | mm |
| Nozzle entrance height | He | 14 | mm |
| Nozzle throat height | Ht | 1 | mm |
| Constant-area mixing section length | Lc | 42 | mm |
| Diffuser length | Ld | 46.22 | mm |
| Nozzle throat length | Lt | 2 | mm |
| Nozzle upper divergent section length | L1 | 3.4 | mm |
| Nozzle lower divergent section length | L2 | 3.4 | mm |
| Ejector section width | Ws | 6 | mm |
| Nozzle upper divergent angle | θ1 | 9, 12, 15, 18, 21, 24, 27, 30 | ° |
| Nozzle lower divergent angle | θ2 | 18 | ° |
| Nozzle exit position | NXP | 11.41 | ° |
| Grid Numbers | Pressure (kPa) | Deviation (%) | Velocity (m/s) | Deviation (%) | |
|---|---|---|---|---|---|
| Point A | 280,636 | 21.497 | 0 | 595.47 | 0 |
| 339,600 | 21.034 | 2.2012 | 594.12 | 0.2272 | |
| 389,840 | 20.747 | 1.3833 | 593.458 | 0.1116 | |
| 430,396 | 20.612 | 0.6549 | 593.276 | 0.0307 | |
| 522,148 | 20.712 | 0.4828 | 593.432 | 0.0263 | |
| 609,964 | 20.656 | 0.2711 | 593.521 | 0.0145 | |
| Point B | 280,636 | 78.124 | 0 | 364.584 | 0 |
| 339,600 | 79.911 | 2.2362 | 363.314 | 0.3500 | |
| 389,840 | 80.989 | 1.3310 | 362.922 | 0.1080 | |
| 430,396 | 80.247 | 0.9246 | 362.764 | 0.04355 | |
| 522,148 | 79.998 | 0.3113 | 362.740 | 0.0066 | |
| 609,964 | 79.841 | 0.1966 | 362.722 | 0.0050 |
Disclaimer/Publisher’s Note: The statements, opinions and data contained in all publications are solely those of the individual author(s) and contributor(s) and not of MDPI and/or the editor(s). MDPI and/or the editor(s) disclaim responsibility for any injury to people or property resulting from any ideas, methods, instructions or products referred to in the content. |
© 2025 by the authors. Licensee MDPI, Basel, Switzerland. This article is an open access article distributed under the terms and conditions of the Creative Commons Attribution (CC BY) license (https://creativecommons.org/licenses/by/4.0/).
Share and Cite
Lu, M.; Dong, J.; Feng, C.; Song, S.; Zhang, M.; Wang, R. Numerical Investigation of Effect of Nozzle Upper Divergent Angle on Asymmetric Rectangular Section Ejector. Entropy 2025, 27, 312. https://doi.org/10.3390/e27030312
Lu M, Dong J, Feng C, Song S, Zhang M, Wang R. Numerical Investigation of Effect of Nozzle Upper Divergent Angle on Asymmetric Rectangular Section Ejector. Entropy. 2025; 27(3):312. https://doi.org/10.3390/e27030312
Chicago/Turabian StyleLu, Manfei, Jingming Dong, Chi Feng, Shuaiyu Song, Miao Zhang, and Runfa Wang. 2025. "Numerical Investigation of Effect of Nozzle Upper Divergent Angle on Asymmetric Rectangular Section Ejector" Entropy 27, no. 3: 312. https://doi.org/10.3390/e27030312
APA StyleLu, M., Dong, J., Feng, C., Song, S., Zhang, M., & Wang, R. (2025). Numerical Investigation of Effect of Nozzle Upper Divergent Angle on Asymmetric Rectangular Section Ejector. Entropy, 27(3), 312. https://doi.org/10.3390/e27030312