
Simultaneous Determination of Six Immunosuppressants in Human Whole Blood by HPLC-MS/MS Using a Modified QuEChERS Method


Abstract
:
1. Introduction
2. Results
Validation of the Analytical Method
3. Discussion
3.1. Column and Mobile Phase Selection
3.2. Selecting and Optimizing Preprocessing Conditions
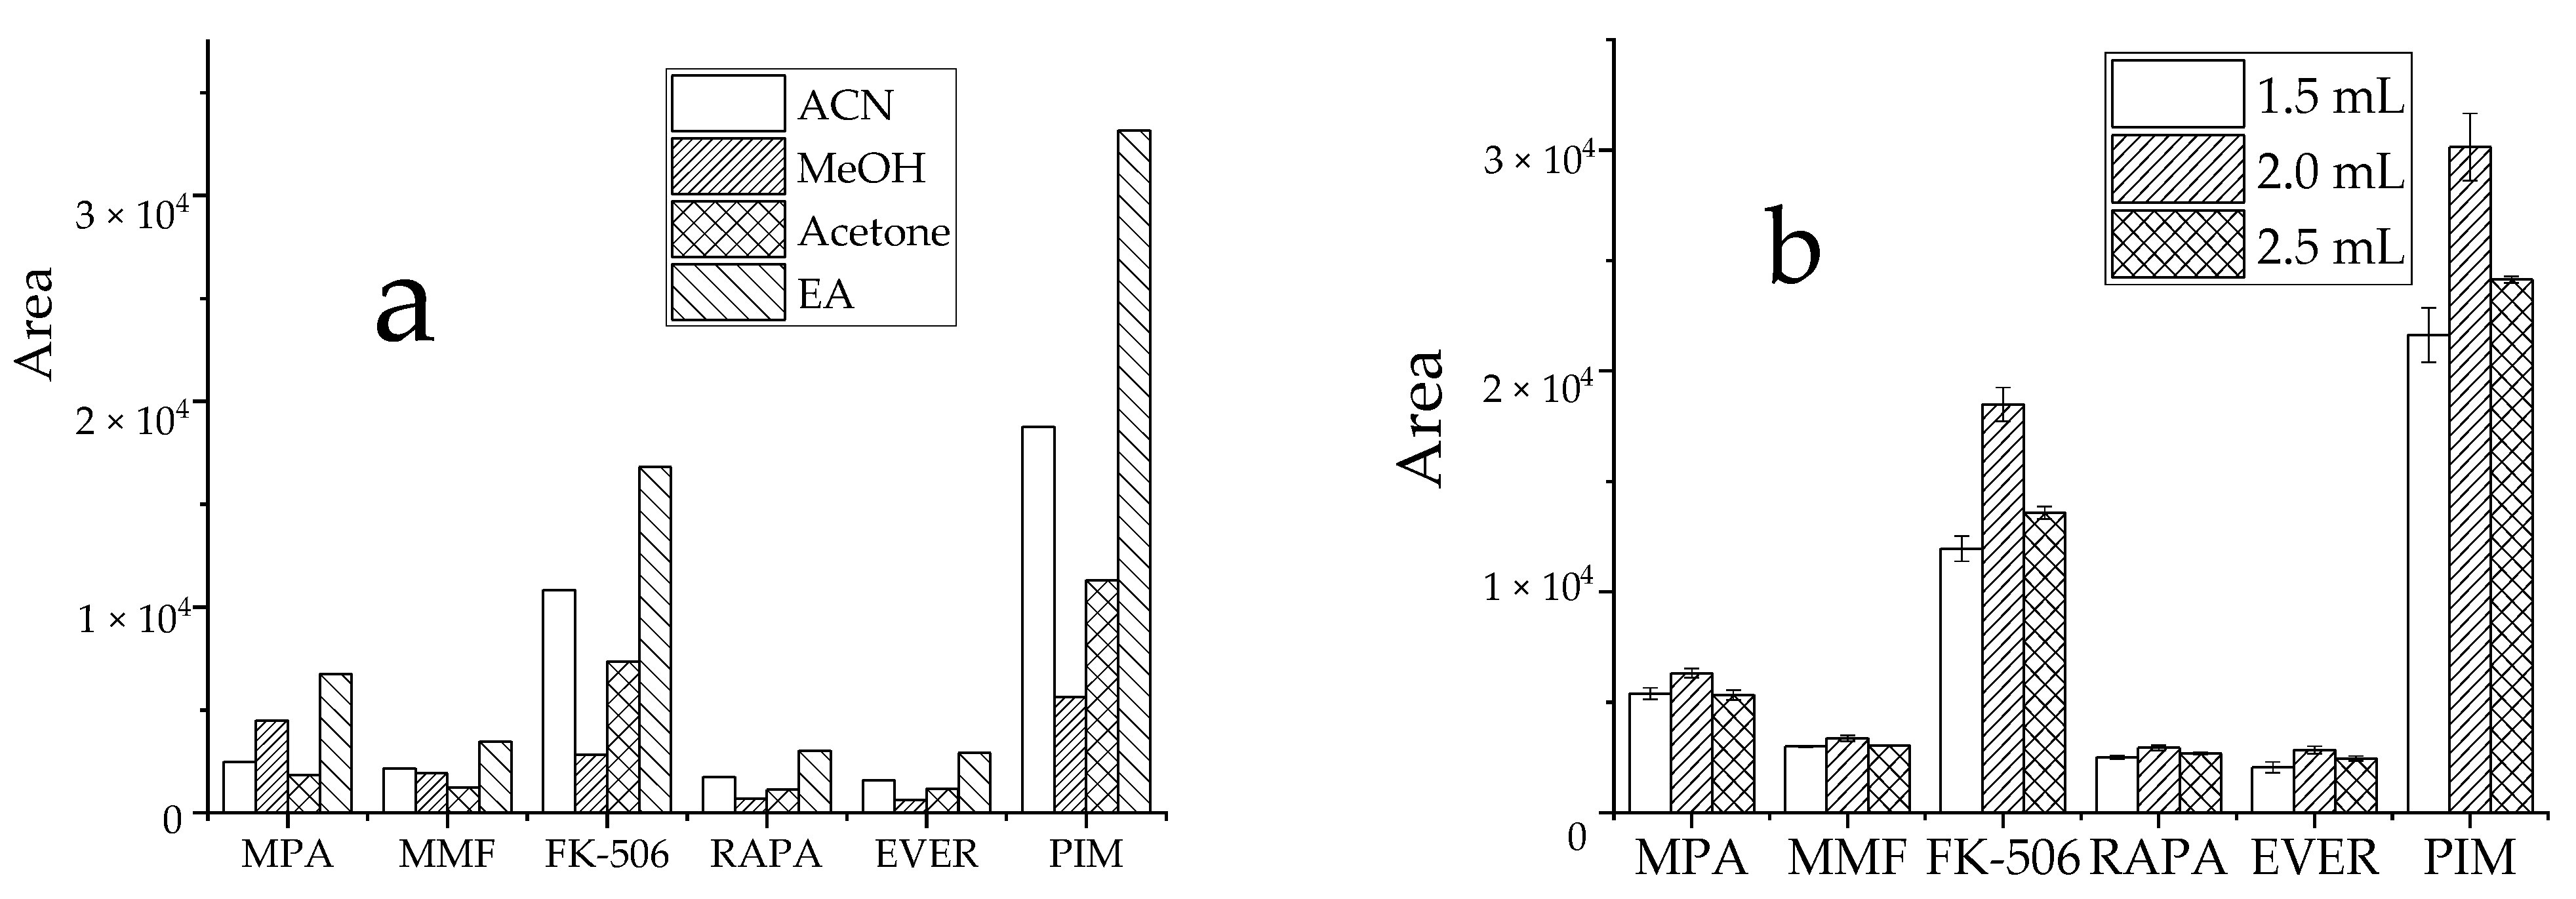
3.2.1. Optimizing Extraction Conditions
3.2.2. Optimization of Salinization Conditions
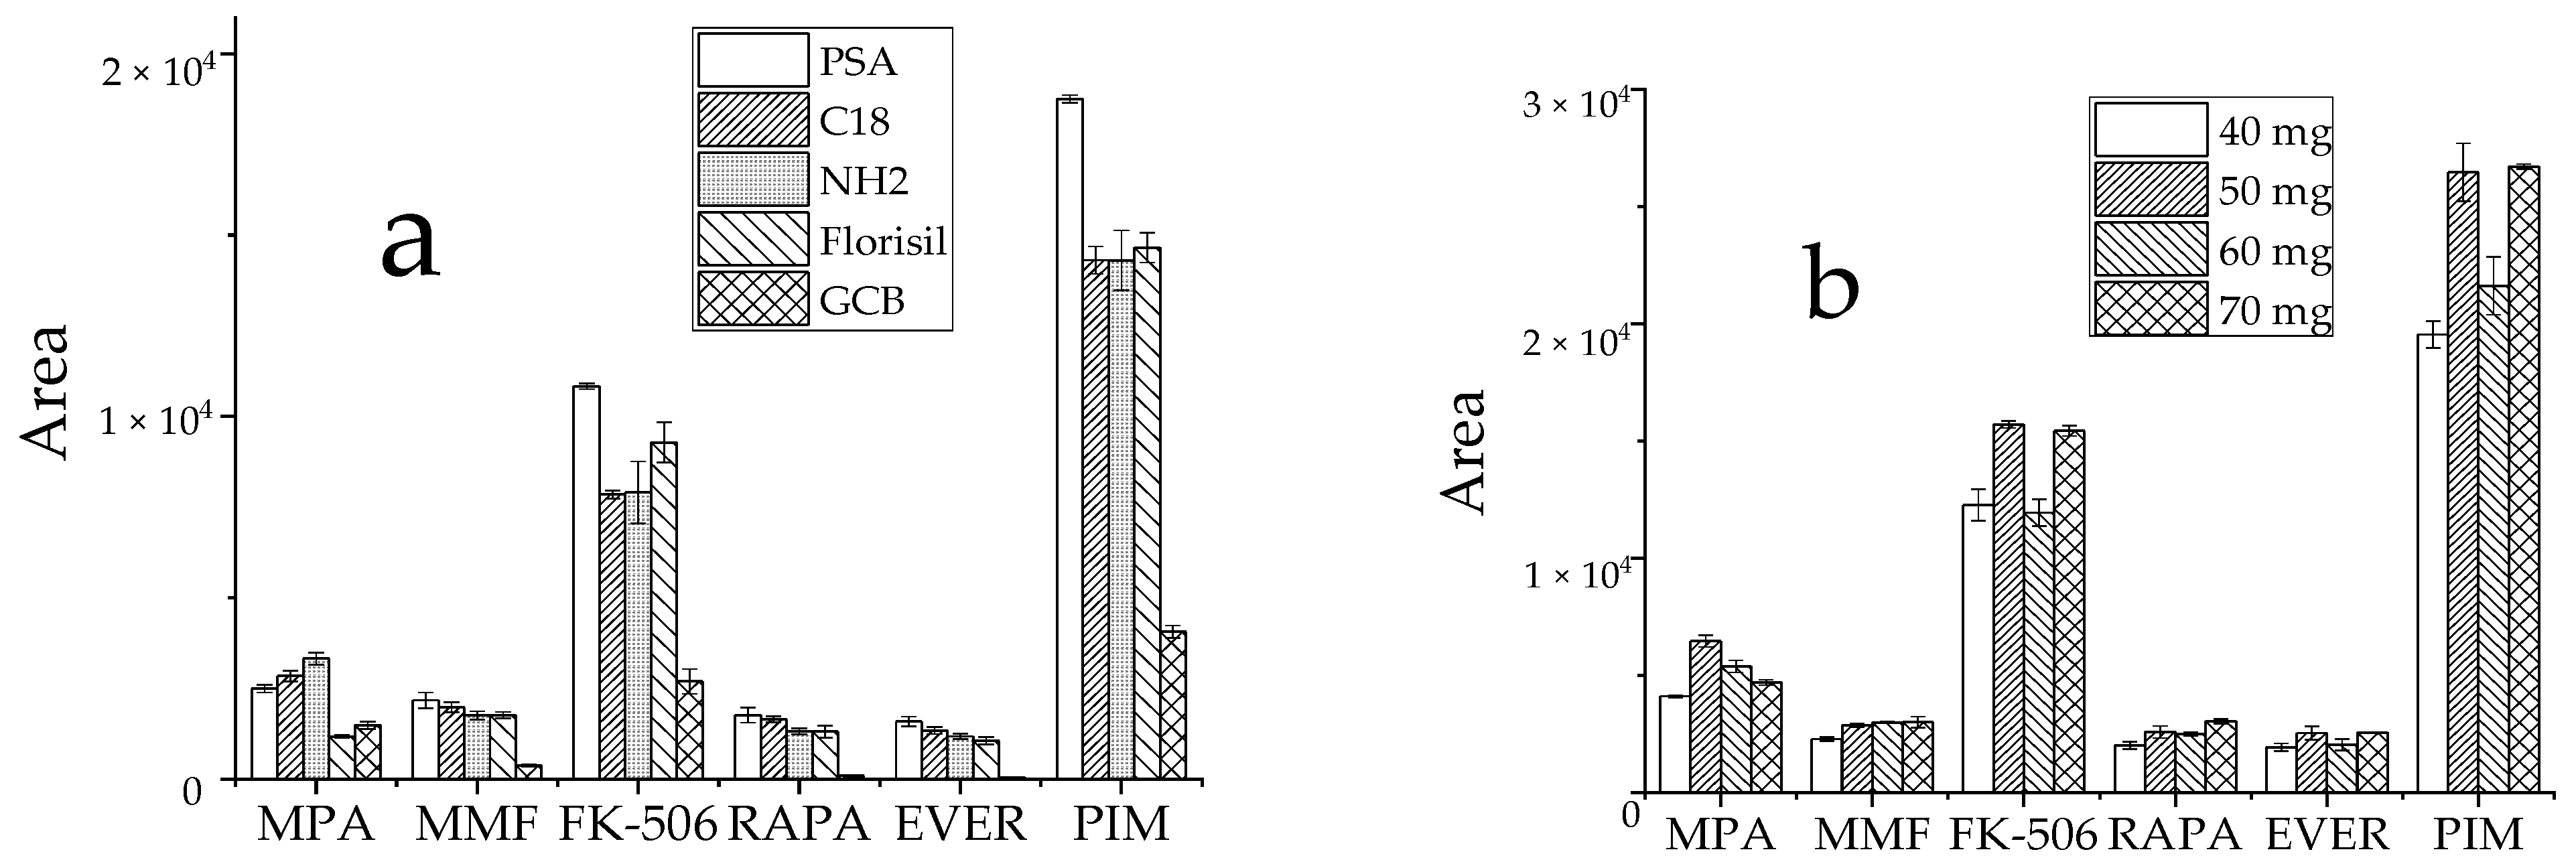
3.2.3. Optimization of Purification Conditions
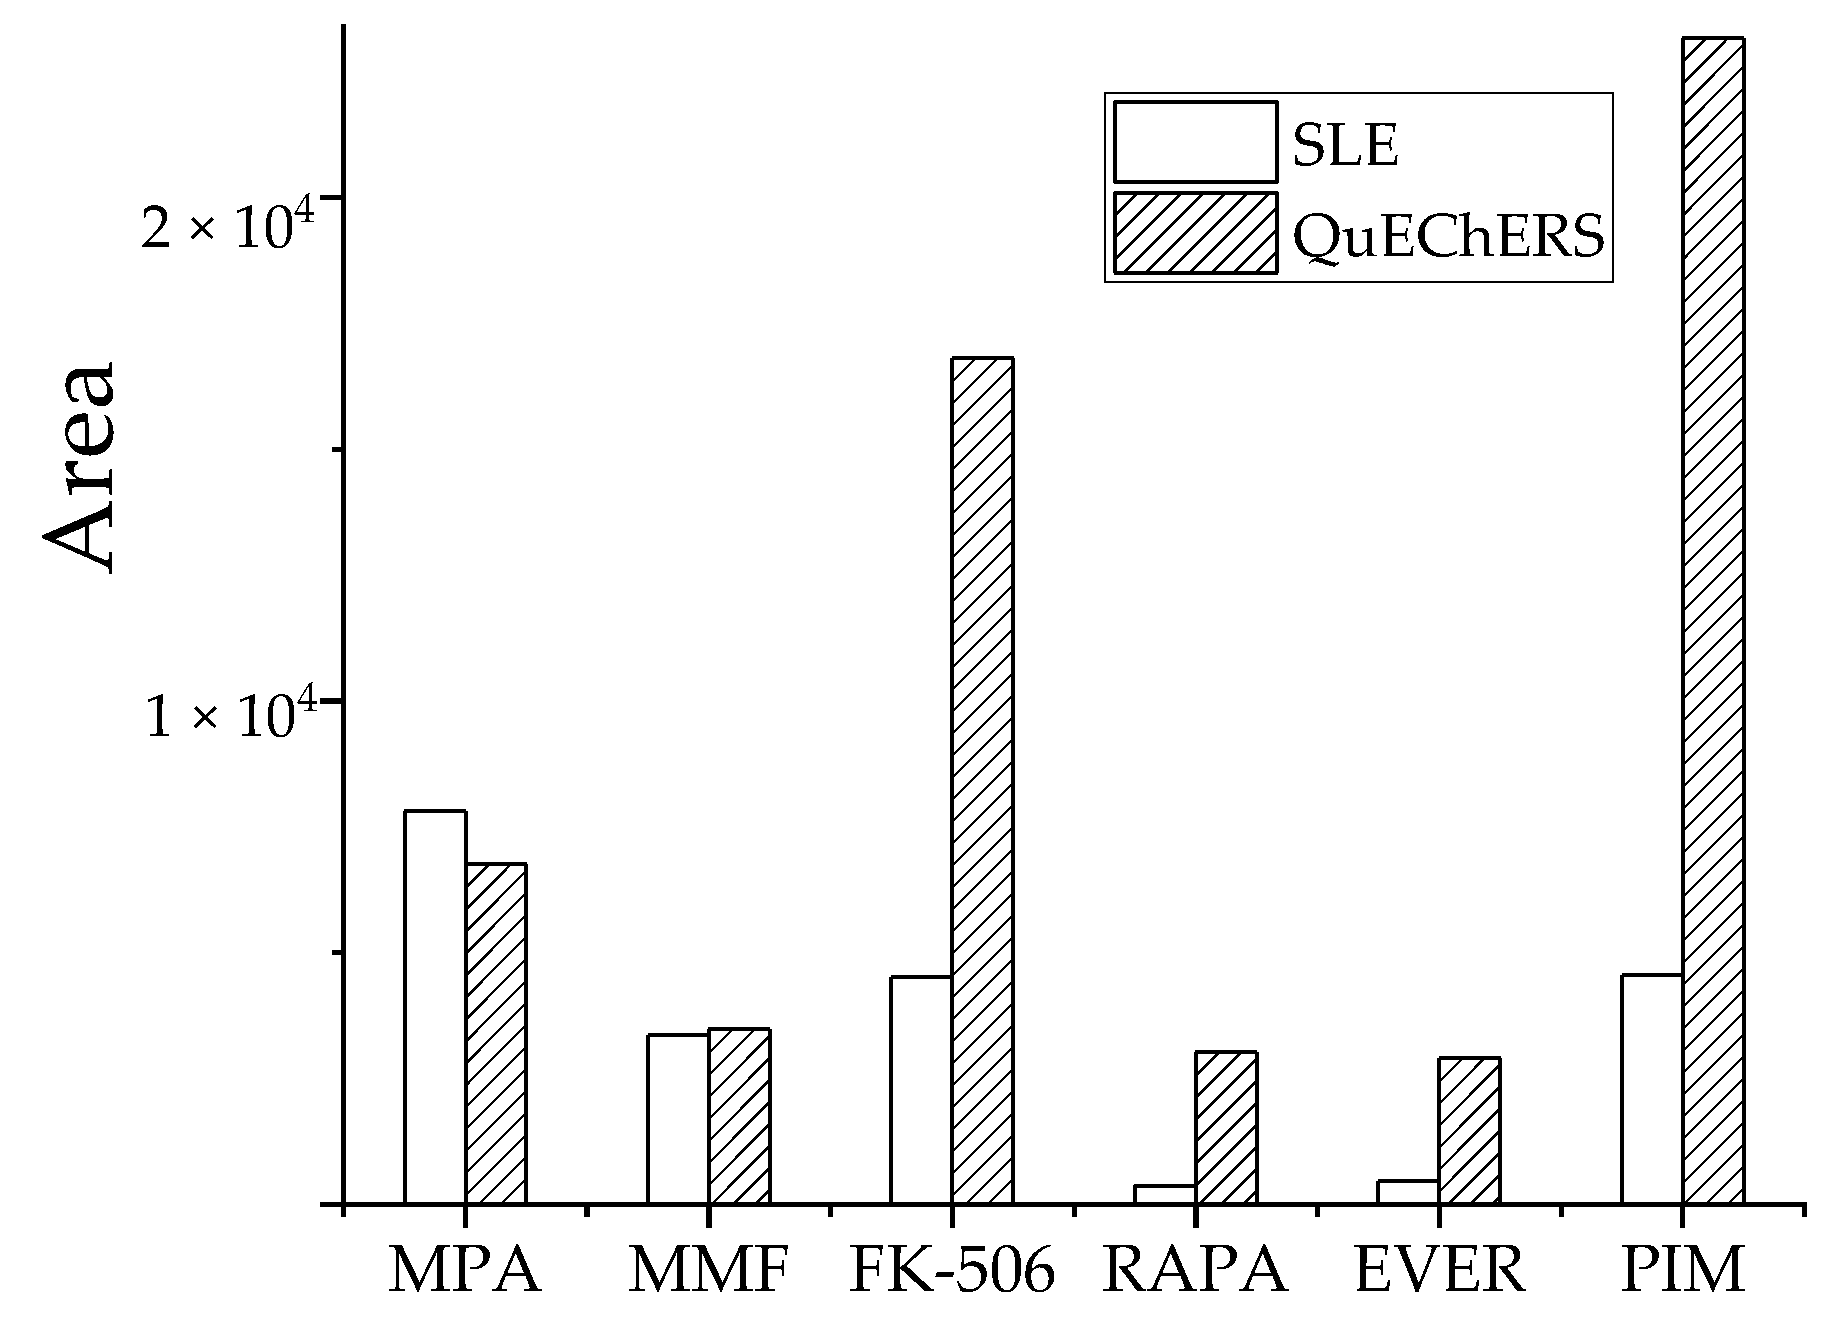
3.2.4. Comparative Analysis of QuEChERS and Solid-Phase Supported Liquid-Liquid Extraction (SLE)
3.3. Comparisons with Other Methods
4. Materials and Methods
4.1. Quantitative Analysis by UHPLC-MS/MS
4.1.1. Reagents and Chemicals
4.1.2. Preparation of the Standard Stock Solutions and Working Solutions
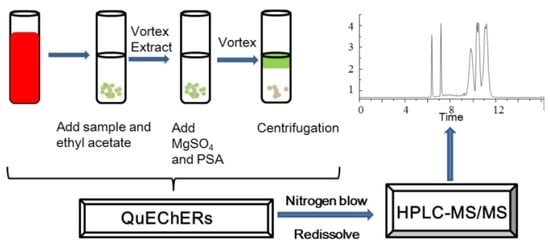
4.1.3. Sample Preparation
4.1.4. LC-MS/MS Analysis
4.2. Method Validation
5. Conclusions
Supplementary Materials
Author Contributions
Funding
Institutional Review Board Statement
Informed Consent Statement
Data Availability Statement
Conflicts of Interest
Sample Availability
References
- Vosough, M.; Tehrani, S.M. Development of a fast HPLC-DAD method for simultaneous quantitation of three immunosuppressant drugs in whole blood samples using intelligent chemometrics resolving of coeluting peaks in the presence of blood interferences. J. Chromatogr. B Analyt. Technol. Biomed. Life Sci. 2018, 1073, 69–79. [Google Scholar] [CrossRef] [PubMed]
- Al-Kamali, A.S.N.; Al-Hazmi, A.A.; Alhousami, M.H.M.; Al-Masany, M.A. Synthesis and antibacterial activity of some novel thieno [2,3-c] pyridazines using 3-amino-5-phenyl-2-ethoxycarbonylthieno [2,3-c] pyridazine as a starting material. Arab. J. Chem. 2014, 7, 775–780. [Google Scholar] [CrossRef] [Green Version]
- Krnac, D.; Reiffova, K.; Rolinski, B. A new HPLC-MS/MS method for simultaneous determination of Cyclosporine A, Tacrolimus, Sirolimus and Everolimus for routine therapeutic drug monitoring. J. Chromatogr. B Analyt. Technol. Biomed. Life Sci. 2019, 1128, 121772. [Google Scholar] [CrossRef]
- Stolp, J.; Zaitsu, M.; Wood, K.J. Immune Tolerance and Rejection in Organ Transplantation. Methods Mol. Biol. 2019, 1899, 159–180. [Google Scholar]
- Anssar, T.M.; Leitzmann, M.F.; Linker, R.A.; Meier, C.; Becker, C.; Jick, S.; Sahm, K.; Platten, M.; Hau, P.; Seliger, C. Autoimmune diseases and immunosuppressive therapy in relation to the risk of glioma. Cancer Med. 2020, 9, 1263–1275. [Google Scholar] [CrossRef] [PubMed]
- Smith, J.M.; Nemeth, T.L.; McDonald, R.A. Current immunosuppressive agents: Efficacy, side effects, and utilization. Pediatr. Clin. North Am. 2003, 50, 1283–1300. [Google Scholar] [CrossRef]
- Perazella, M.A.; Shirali, A.C. Nephrotoxicity of Cancer Immunotherapies: Past, Present and Future. J. Am. Soc. Nephrol. 2018, 29, 2039–2052. [Google Scholar] [CrossRef]
- Bamgbola, O. Metabolic consequences of modern immunosuppressive agents in solid organ transplantation. Ther. Adv. Endocrinol. Metab. 2016, 7, 110–127. [Google Scholar] [CrossRef] [Green Version]
- Fatourou, E.M.; Tsochatzis, E.A. Management of metabolic syndrome and cardiovascular risk after liver transplantation. Lancet Gastroenterol. Hepatol. 2019, 4, 731–741. [Google Scholar] [CrossRef]
- Tuzimski, T.; Petruczynik, A. Review of Chromatographic Methods Coupled with Modern Detection Techniques Applied in the Therapeutic Drugs Monitoring (TDM). Molecules 2020, 25, 4026. [Google Scholar] [CrossRef]
- Mei, S.; Wang, J.; Chen, D.; Zhu, L.; Zhao, M.; Tian, X.; Hu, X.; Zhao, Z. Simultaneous determination of cyclosporine and tacrolimus in human whole blood by ultra-high performance liquid chromatography tandem mass spectrometry and comparison with a chemiluminescence microparticle immunoassay. J. Chromatogr. B Analyt. Technol. Biomed. Life Sci. 2018, 1087–1088, 36–42. [Google Scholar] [CrossRef] [PubMed]
- Chen, H.; Gu, Z.; Chen, B.; Mao, H.; Zhang, W.; Fan, Q. Models for the Prediction of Mycophenolic Acid Area Under the Curve Using a Limited-Sampling Strategy and an Enzyme Multiplied Immunoassay Technique in Chinese Patients Undergoing Liver Transplantation. Clin. Ther. 2008, 30, 2387–2401. [Google Scholar] [CrossRef] [PubMed]
- Hashi, S.; Masuda, S.; Kikuchi, M.; Uesugi, M.; Yano, I.; Omura, T.; Yonezawa, A.; Fujimoto, Y.; Ogawa, K.; Kaido, T.; et al. Assessment of Four Methodologies (Microparticle Enzyme Immunoassay, Chemiluminescent Enzyme Immunoassay, Affinity Column-Mediated Immunoassay, and Flow Injection Assay-Tandem Mass Spectrometry) for Measuring Tacrolimus Blood Concentration in Japanese Liver Transplant Recipients. Transpl. Proc. 2014, 46, 758–760. [Google Scholar]
- Xie, X.; Zhao, H.; Qin, D.; Qiao, X. Pharmacokinetics and pharmacodynamics of two antithymocyte globulins in treatment of pediatric aplastic anemia. Int. J. Clin. Exp. Med. 2015, 8, 4349–4355. [Google Scholar] [PubMed]
- Rebollo, N.; Calvo, M.V.; Martin-Suarez, A.; Dominguez-Gil, A. Modification of the EMIT immunoassay for the measurement of unbound mycophenolic acid in plasma. Clin. Biochem. 2011, 44, 260–263. [Google Scholar] [CrossRef] [PubMed]
- Piancatelli, D.; Maccarone, D.; Colanardi, A.; Sebastiani, P.; D’Anselmi, F.; Iesari, S.; Binda, B.; Pisani, F. Evaluation of Plasma Levels of Soluble HLA-G and HLA-G Genotypes in Kidney Transplant Recipients. Transpl. Proc. 2020, 52, 1559–1561. [Google Scholar] [CrossRef] [PubMed]
- Koster, R.A.; Dijkers, E.C.; Uges, D.R. Robust, High-Throughput LC-MS/MS Method for Therapeutic Drug Monitoring of Cyclosporine, Tacrolimus, Everolimus, and Sirolimus in Whole Blood. Ther. Drug Monit. 2009, 31, 116–125. [Google Scholar] [CrossRef]
- Llinàs-Mallol, L.; Redondo-Pachón, D.; Raïch-Regué, D.; Pérez-Sáez, M.J.; Yélamos, J.; Duran, X.; Faura, A.; López-Botet, M.; Pascual, J.; Crespo, M. Long-Term Redistribution of Peripheral Lymphocyte Subpopulations after Switching from Calcineurin to mTOR Inhibitors in Kidney Transplant Recipients. J. Clin. Med. 2020, 9, 1088. [Google Scholar] [CrossRef]
- Pascual, J.; Berger, S.P.; Chadban, S.J.; Citterio, F.; Kamar, N.; Hesselink, D.A.; Legendre, C.; Eisenberger, U.; Oppenheimer, F.; Russ, G.R.; et al. Evidence-based practice: Guidance for using everolimus in combination with low-exposure calcineurin inhibitors as initial immunosuppression in kidney transplant patients. Transpl. Rev. 2019, 33, 191–199. [Google Scholar] [CrossRef]
- Nanmoku, K.; Kurosawa, A.; Kubo, T.; Shinzato, T.; Shimizu, T.; Kimura, T.; Yagisawa, T. Effective and Safe Reduction of Conventional Immunosuppressants Using Everolimus in Maintenance Kidney Transplant Recipients. Transpl. Proc. 2017, 49, 1724–1728. [Google Scholar] [CrossRef]
- Gooptu, M.; Kim, H.T.; Howard, A.; Choi, S.W.; Soiffer, R.J.; Antin, J.H.; Ritz, J.; Cutler, C.S. Effect of Sirolimus on Immune Reconstitution Following Myeloablative Allogeneic Stem Cell Transplantation: An Ancillary Analysis of a Randomized Controlled Trial Comparing Tacrolimus/Sirolimus and Tacrolimus/Methotrexate (Blood and Marrow Transplant Clinical Trials Network/BMT CTN 0402). Biol. Blood Marrow Transpl. 2019, 25, 2143–2151. [Google Scholar]
- Anastassiades, M.; Lehotay, S.J.; Stajnbaher, D.; Schenck, F.J. Fast and Easy Multiresidue Method Employing Acetonitrile Extraction/Partitioning and “Dispersive Solid-Phase Extraction” for the Determination of Pesticide Residues in Produce. J. AOAC Int. 2003, 86, 412–431. [Google Scholar] [CrossRef] [PubMed] [Green Version]
- Liu, W.; Su, Y.; Liu, J.; Zhang, K.; Wang, X.; Chen, Y.; Duan, L.; Shi, F. Determination of cyflufenamid residues in 12 foodstuffs by QuEChERS-HPLC-MS/MS. Food Chem. 2021, 362, 130148. [Google Scholar] [CrossRef] [PubMed]
- Abdelghani, J.I.; Al-Degs, Y.S. Spectroscopic quantifiication of preservatives in different food matrices using QuEChERS extraction and multivariate calibration with comparison against liquid chromatography. Arab. J. Chem. 2022, 15, 103462. [Google Scholar] [CrossRef]
- Hernández-Mesa, M.; García-Campaña, M. Determination of sulfonylurea pesticide residues in edible seeds used as nutraceuticals by QuEChERS in combination with ultra-high-performance liquid chromatography-tandem mass spectrometry. J. Chromatogr. A 2020, 1617, 460831. [Google Scholar] [CrossRef]
- Kim, L.; Lee, D.; Cho, H.K.; Choi, S.D. Review of the QuEChERS method for the analysis of organic pollutants: Persistent organic pollutants, polycyclic aromatic hydrocarbons, and pharmaceuticals. Trends Environ. Anal. Chem. 2019, 22, e00063. [Google Scholar] [CrossRef]
- Yoshioka, T.; Izumi, Y.; Nagatomi, Y.; Miyamoto, Y.; Suzuki, K.; Bamba, T. A highly sensitive determination method for acrylamide in beverages, grains, and confectioneries by supercritical fluid chromatography tandem mass spectrometry. Food Chem. 2019, 294, 486–492. [Google Scholar] [CrossRef]
- Rejczak, T.; Tuzimski, T. A review of recent developments and trends in the QuEChERS sample preparation approach. Open Chem. 2015, 13, 980–1010. [Google Scholar] [CrossRef]
- Kim, J.; Cho, H.D.; Suh, J.H.; Lee, J.Y.; Lee, E.; Jin, C.H.; Wang, Y.; Cha, S.; Im, H.; Han, S.B. Analysis of Nicotine Metabolites in Hair and Nails Using QuEChERS Method Followed by Liquid Chromatography-Tandem Mass Spectrometry. Molecules 2020, 25, 1763. [Google Scholar] [CrossRef]
- Pouliopoulos, A.; Tsakelidou, E.; Krokos, A.; Gika, H.G.; Theodoridis, G.; Raikos, N. Quantification of 15 Psychotropic Drugs in Serum and Postmortem Blood Samples after a Modified Mini-QuEChERS by UHPLC-MS-MS. J. Anal. Toxicol. 2018, 42, 337–345. [Google Scholar] [CrossRef]
- Tsochatzis, E.; Karayannakidis, P.; Kalogiannis, S. Determination of selected dichloroanilines and phthalates in lyophilised mussels samples with ultra-high performance liquid chromatography-tandem mass spectrometry after QuEChERS clean-up. Food Addit. Contam. Part A Chem. Anal. Control Expo. Risk Assess 2019, 36, 1253–1260. [Google Scholar] [CrossRef] [PubMed]
- Stienstra, N.A.; Sikma, M.A.; van Dapperen, A.L.; de Lange, D.W.; van Maarseveen, E.M. Development of a Simple and Rapid Method to Measure the Free Fraction of Tacrolimus in Plasma Using Ultrafifiltration and LC-MS/MS. Ther. Drug Monit. 2016, 38, 722–727. [Google Scholar] [CrossRef] [PubMed]
- Karapirli, M.; Kizilgun, M.; Yesilyurt, O.; Gul, H.; Kunak, Z.I.; Akgul, E.O.; Macit, E.; Cayci, T.; Gulcan Kurt, Y.; Aydin, I.; et al. Simultaneous determination of cyclosporine A, tacrolimus, sirolimus, and everolimus in whole-blood samples by LC-MS/MS. Sci. World J. 2012, 2012, 571201. [Google Scholar] [CrossRef] [Green Version]
- Buchwald, A.; Winkler, K.; Epting, T. Validation of an LC-MS/MS method to determine five immunosuppressants with deuterated internal standards including MPA. BMC Clin. Pharmacol. 2012, 12, 2. [Google Scholar] [CrossRef] [PubMed] [Green Version]
- Marcelín-Jiménez, G.; García-González, G.; Ángeles-Moreno, A.P.; Contreras-Zavala, L.; Rivera, L.; Morales, M. Development of an Ultra-Performance Liquid Chromatography Technique Coupled with Mass Spectrometry for the Measurement of Tacrolimus in Micro-Samples of Whole Blood, and Its Application on a Pharmacokinetic Trial. Drug Res. 2007, 57, 659–664. [Google Scholar] [CrossRef]
- Neu, V.; Delmotte, N.; Kobold, U.; Dülffer, T.; Herrmann, R.; von der Eltz, H.; Huber, C.G. On-line solid-phase extraction high-performance liquid chromatography-tandem mass spectrometry for the quantitative analysis of tacrolimus in whole blood hemolyzate. Anal. Bioanal. Chem. 2012, 404, 863–874. [Google Scholar] [CrossRef]
- Giovagnoli, S.; Cassano, T.; Pace, L.; Magini, A.; Polchi, A.; Tancini, B.; Perluigi, M.; De Marco, F.; Emiliani, C.; Dolcetta, D. Evaluation of a LC-MS method for everolimus preclinical determination in brain by using [(13)C2D4]RAD001 internal standard. J. Chromatogr. B Analyt. Technol. Biomed. Life Sci. 2015, 985, 155–163. [Google Scholar] [CrossRef]


| Analyte | Spiked (ng·mL−1) | ME (%) | Precision (RSD %) | Accuracy (%) | |
|---|---|---|---|---|---|
| Inter-Day | Intra-Day | ||||
| MPA | 20 | 101.99 | 3.52 | 1.13 | 107.79 |
| 500 | 85.78 | 2.94 | 3.44 | 114.95 | |
| 800 | 103.19 | 6.73 | 2.31 | 110.75 | |
| MMF | 0.2 | 112.69 | 6.44 | 2.78 | 109.56 |
| 5 | 86.25 | 1.29 | 7.71 | 109.60 | |
| 8 | 78.95 | 3.76 | 1.33 | 106.42 | |
| FK-506 | 2 | 91.23 | 9.98 | 3.88 | 95.66 |
| 50 | 80.51 | 0.55 | 1.36 | 109.09 | |
| 80 | 78.97 | 1.40 | 1.19 | 101.50 | |
| RAPA | 2 | 94.08 | 4.31 | 5.49 | 109.43 |
| 50 | 92.29 | 5.40 | 0.54 | 113.47 | |
| 80 | 47.81 | 3.05 | 4.94 | 113.09 | |
| EVER | 2 | 106.65 | 14.92 | 4.59 | 92.24 |
| 50 | 51.42 | 5.02 | 3.20 | 102.22 | |
| 80 | 50.26 | 2.07 | 1.61 | 102.44 | |
| PIM | 2 | 91.17 | 7.02 | 2.98 | 85.07 |
| 50 | 84.21 | 0.23 | 4.79 | 99.30 | |
| 80 | 85.20 | 0.86 | 1.01 | 92.07 | |
| Analyte | Inter-Day (CV, %) | Intra-Day (CV, %) | LOD (ng·mL−1) | LOQ (ng·mL−1) | Recovery (%) |
|---|---|---|---|---|---|
| MPA | 4.40 ± 2.0 | 2.29 ± 1.2 | 2.30 | 7.60 | 116 ± 3.6 |
| MMF | 3.83 ± 2.6 | 3.94 ± 3.3 | 0.02 | 0.07 | 109 ± 1.8 |
| FK-506 | 3.98 ± 5.2 | 2.14 ± 1.5 | 0.03 | 0.09 | 102 ± 6.7 |
| RAPA | 4.25 ± 1.2 | 3.66 ± 2.7 | 0.05 | 0.20 | 112 ± 2.2 |
| EVER | 7.34 ± 6.7 | 3.13 ± 1.5 | 0.05 | 0.20 | 99.0 ± 5.8 |
| PIM | 2.70 ± 3.8 | 2.93 ± 1.9 | 0.02 | 0.06 | 92.1 ± 7.1 |
| Method | Solvent | Sample | Analytes | Detection System | LOQ (ng·mL−1) | RSD (%) | Recovery (%) | Ref. |
|---|---|---|---|---|---|---|---|---|
| QuEChERS | - | Whole blood | MPA/MMF/FK-506/ RAPA/EVER/PIM | LC-MS/MS | 7.60/0.07/0.09/0.20/0.20/0.06 | 0.23~14.92 | 85.07~114.95 | this work |
| PP | Methanol | Plasma | FK-506 | LC-MS/MS | 0.1 | - | 107% | [32] |
| Online SPE | ZnSO4 | Plasma | MPA/ FK-506/ RAPA/ EVER | LC-MS/MS | 7.0/7.5/ 4.6/6.4 | 0.9~14.7 | 89.0~138.0 | [33] |
| PP | ACN/ MTBE | Whole blood | FK-506/ RAPA/EVER | LC-MS/MS | 0.5/0.5/ 0.5 | 1.87~11.2 | 78.6~85.9 | [34] |
| Online SPE | MeOH- ZnSO4 (66:34) | Whole blood | FK-506/ RAPA/ EVER | LC-MS/MS | 1.4/0.72/1.15 | <5 | 92.8~95.9 | [35] |
| PP | ZnSO4/ ACN | Whole blood | FK-506 | LC-MS/MS | 1.0 | - | 94 | [36] |
| SPE | - | Brain | EVER | LC-MS | 4.0 | 3~19 | 82~102 | [37] |
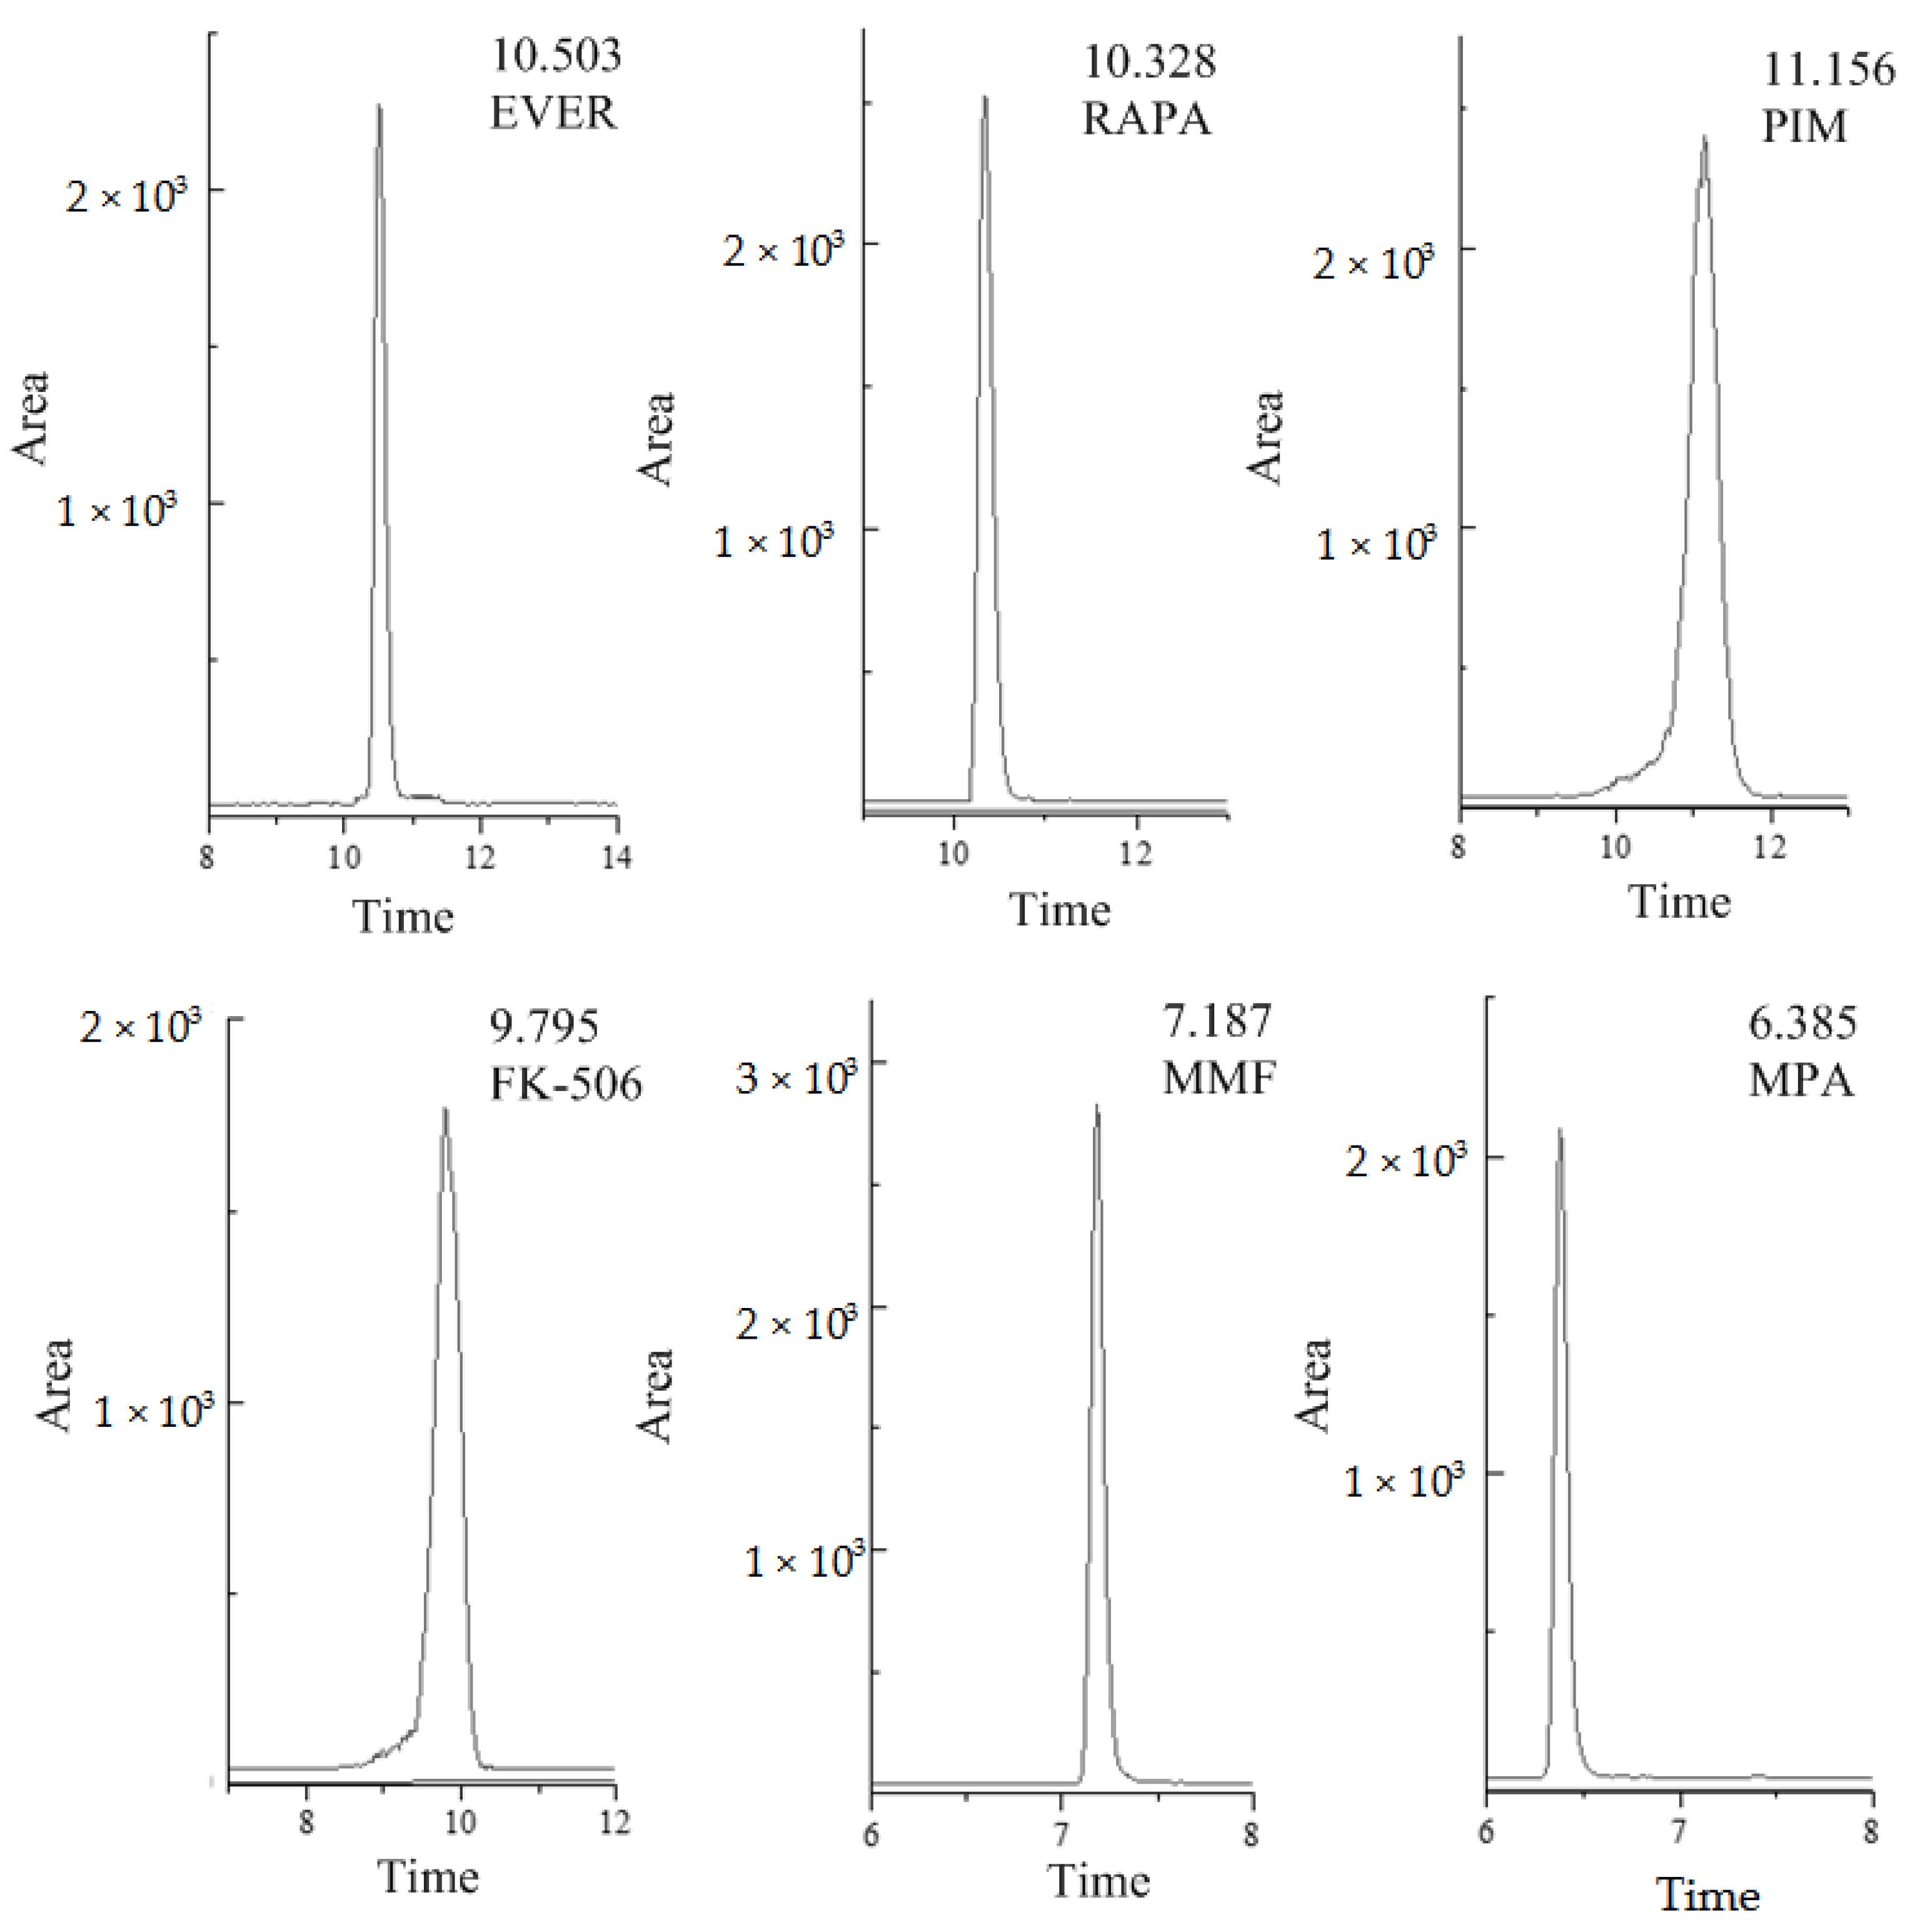
| Analyte | Precursor Ion (m/z) | Product Ion (m/z) | Fragmentor Voltage (V) | Collision Voltage (eV) | Retention Time (min) |
|---|---|---|---|---|---|
| MPA | 338.3 | 207.1 * | 140 | 20 | 6.4 |
| 338.3 | 302.9 | 140 | 10 | ||
| MMF | 434.2 | 114.2 * | 145 | 28 | 7.2 |
| 434.2 | 285.0 | 145 | 26 | ||
| FK-506 | 821.5 | 768.2 * | 165 | 18 | 9.8 |
| 821.5 | 786.2 | 165 | 14 | ||
| RAPA | 931.5 | 864.4 * | 155 | 15 | 10.3 |
| 931.5 | 882.2 | 155 | 6 | ||
| EVER | 975.5 | 908.3 * | 165 | 10 | 10.5 |
| 975.5 | 926.2 | 165 | 6 | ||
| PIM | 827.4 | 774.2 * | 170 | 20 | 11.2 |
| 827.4 | 792.2 | 170 | 18 |
Publisher’s Note: MDPI stays neutral with regard to jurisdictional claims in published maps and institutional affiliations. |
© 2022 by the authors. Licensee MDPI, Basel, Switzerland. This article is an open access article distributed under the terms and conditions of the Creative Commons Attribution (CC BY) license (https://creativecommons.org/licenses/by/4.0/).
Share and Cite
Zheng, M.; Song, J.; Xue, H.; Li, H.; Lian, K. Simultaneous Determination of Six Immunosuppressants in Human Whole Blood by HPLC-MS/MS Using a Modified QuEChERS Method. Molecules 2022, 27, 4087. https://doi.org/10.3390/molecules27134087
Zheng M, Song J, Xue H, Li H, Lian K. Simultaneous Determination of Six Immunosuppressants in Human Whole Blood by HPLC-MS/MS Using a Modified QuEChERS Method. Molecules. 2022; 27(13):4087. https://doi.org/10.3390/molecules27134087
Chicago/Turabian StyleZheng, Min, Jianshi Song, Hua Xue, Hui Li, and Kaoqi Lian. 2022. "Simultaneous Determination of Six Immunosuppressants in Human Whole Blood by HPLC-MS/MS Using a Modified QuEChERS Method" Molecules 27, no. 13: 4087. https://doi.org/10.3390/molecules27134087
APA StyleZheng, M., Song, J., Xue, H., Li, H., & Lian, K. (2022). Simultaneous Determination of Six Immunosuppressants in Human Whole Blood by HPLC-MS/MS Using a Modified QuEChERS Method. Molecules, 27(13), 4087. https://doi.org/10.3390/molecules27134087