1. Introduction
Currently, the primary cancer treatment methods include surgery, chemotherapy, and radiotherapy [
1]. The inability to completely remove all cancer cells during surgery increases the possibility of cancer recurrence [
2]. Chemotherapy and radiotherapy generally have limitations, such as systemic toxicity and side effects. In response to these challenges, researchers have explored novel approaches for cancer therapy, including the development of nanomaterial-based strategies that can offer better personalized treatments [
3].
Nanomaterials can selectively target and kill cancer cells while sparing healthy tissues. Among these materials, gold nanorods (GNRs) and metal–organic frameworks (MOFs) have emerged as significant candidates because of their unique properties and potential for medical applications [
4,
5]. GNRs are particularly notable for their photothermal capabilities; they can convert near-infrared light into heat and effectively kill cancer cells through hyperthermia [
6]. Synthesized GNRs are nanomaterials with good and stable physical and chemical properties and photothermal effects. They offer good biocompatibility, and their surfaces are easily modified, which can be enriched in tumor cells by cell uptake [
7]. Developing multifunctional GNR platforms that integrate imaging, drug delivery, photothermal therapy, and other therapeutic modalities can offer comprehensive cancer treatment strategies [
8]. Designing versatile GNR systems with tunable properties for personalized medicine approaches may be a promising application. After combining multiple therapies, the therapeutic effect was greatly improved, as composite materials with the ability to load drug molecules further strengthened their therapeutic effects.
By contrast, MOFs are crystalline materials composed of metal ions or clusters connected by organic ligands, forming porous structures with high surface areas and tunable properties. MOFs have emerged as a promising class of materials for cancer therapy applications, including drug delivery or imaging [
9,
10]. The controlled pore size and surface chemistry characteristics of MOFs allow for the encapsulation and release of therapeutic agents, thus offering potential advantages for cancer treatment. Owing to the unique redox chemistry, photochemical property, and catalytic activity of copper-based MOFs (Cu-MOFs), they have been extensively explored in biomedical fields. A synergistic approach to combination cancer therapy allows MOF-based hybrids to improve cancer treatment outcomes [
11].
Doxorubicin (DOX) is a widely used chemotherapeutic drug for tumor treatment. It belongs to the anthracycline class of medications and is effective against a variety of cancers, including breast, ovarian, and lung cancers. DOX exerts its anticancer effects through multiple mechanisms, including intercalation into DNA, the inhibition of topoisomerase II, the generation of free radicals, and the induction of apoptosis in cancer cells [
12]. Despite its potent therapeutic efficacy, the clinical utility of DOX is often limited by its dose-limiting systemic toxicity. Strategies to mitigate systemic toxicity, such as liposomal formulations and polymer-based nanoparticles, have been developed to reduce side effects [
13]. Moreover, the combination of photodynamic therapy with chemotherapy can lead to additive or synergistic antitumor effects [
14].
The integration of GNRs and MOFs with drugs represents a favorable approach in nanomedicine to harness the multiple effects of photothermal therapy, catalytic action, and drug release. This hybrid system is a combinatorial strategy that can potentially overcome the limitations of conventional cancer therapies by integrating the multiple effects of hyperthermia or low-dose drug delivery within a single platform [
15,
16].
In this context, the present study aimed to investigate the potential of metal–organic framework-capped gold nanorod hybrids for combinatorial cancer therapy. We synthesized hybrid materials using MOFs and GNRs; characterized their physicochemical properties; and evaluated their drug-loading capacity, encapsulation rate, and drug release, reasonably adjusted to realize drug delivery, reduce side effects, and increase the malignant tumor treatment effect by combining the chemo-photothermal effect in vitro. By exploring the multiple effects of photothermal therapy, chemotherapy, and catalytic action, we aimed to develop novel strategies for precise cancer treatment with enhanced therapeutic outcomes.
3. Discussion
Nanodrug carriers based on gold nanorods are a new and significant research topic [
18,
19,
20]. GNR nanomaterials were characterized using their solution color, UV–visible absorption spectra, and TEM, confirming their successful synthesis [
21,
22,
23]. They were then characterized using TEM, UV–visible absorption spectroscopy, Fourier transform infrared spectroscopy, and STEM-EDS specta [
24,
25,
26,
27], which proved the successful synthesis by coating Cu-MOF on the GNR surface. Finally, GMD was characterized by transmission electron microscopy and STEM-EDS, and the results proved that GMD nanomaterials have drug-carrying capacity, as we successfully loaded DOX (
Figure S3).
We found that GMD nanomaterials had horseradish peroxidase (HRP) activity at a pH of 5 and a temperature of 37 °C (
Figure S4). In normal cells, oxidation and antioxidant systems maintain a fairly balanced state [
28,
29,
30], while an increase in pro-oxidation levels or a decrease in antioxidant capacity can lead to an increase in ROS levels, resulting in a cascade of changes [
31,
32]. ROS levels are higher in tumor cells than in normal cells, resulting in oxidative stress [
33,
34]. Therefore, GMD nanomaterials exert their biological functions by elevating ROS levels (
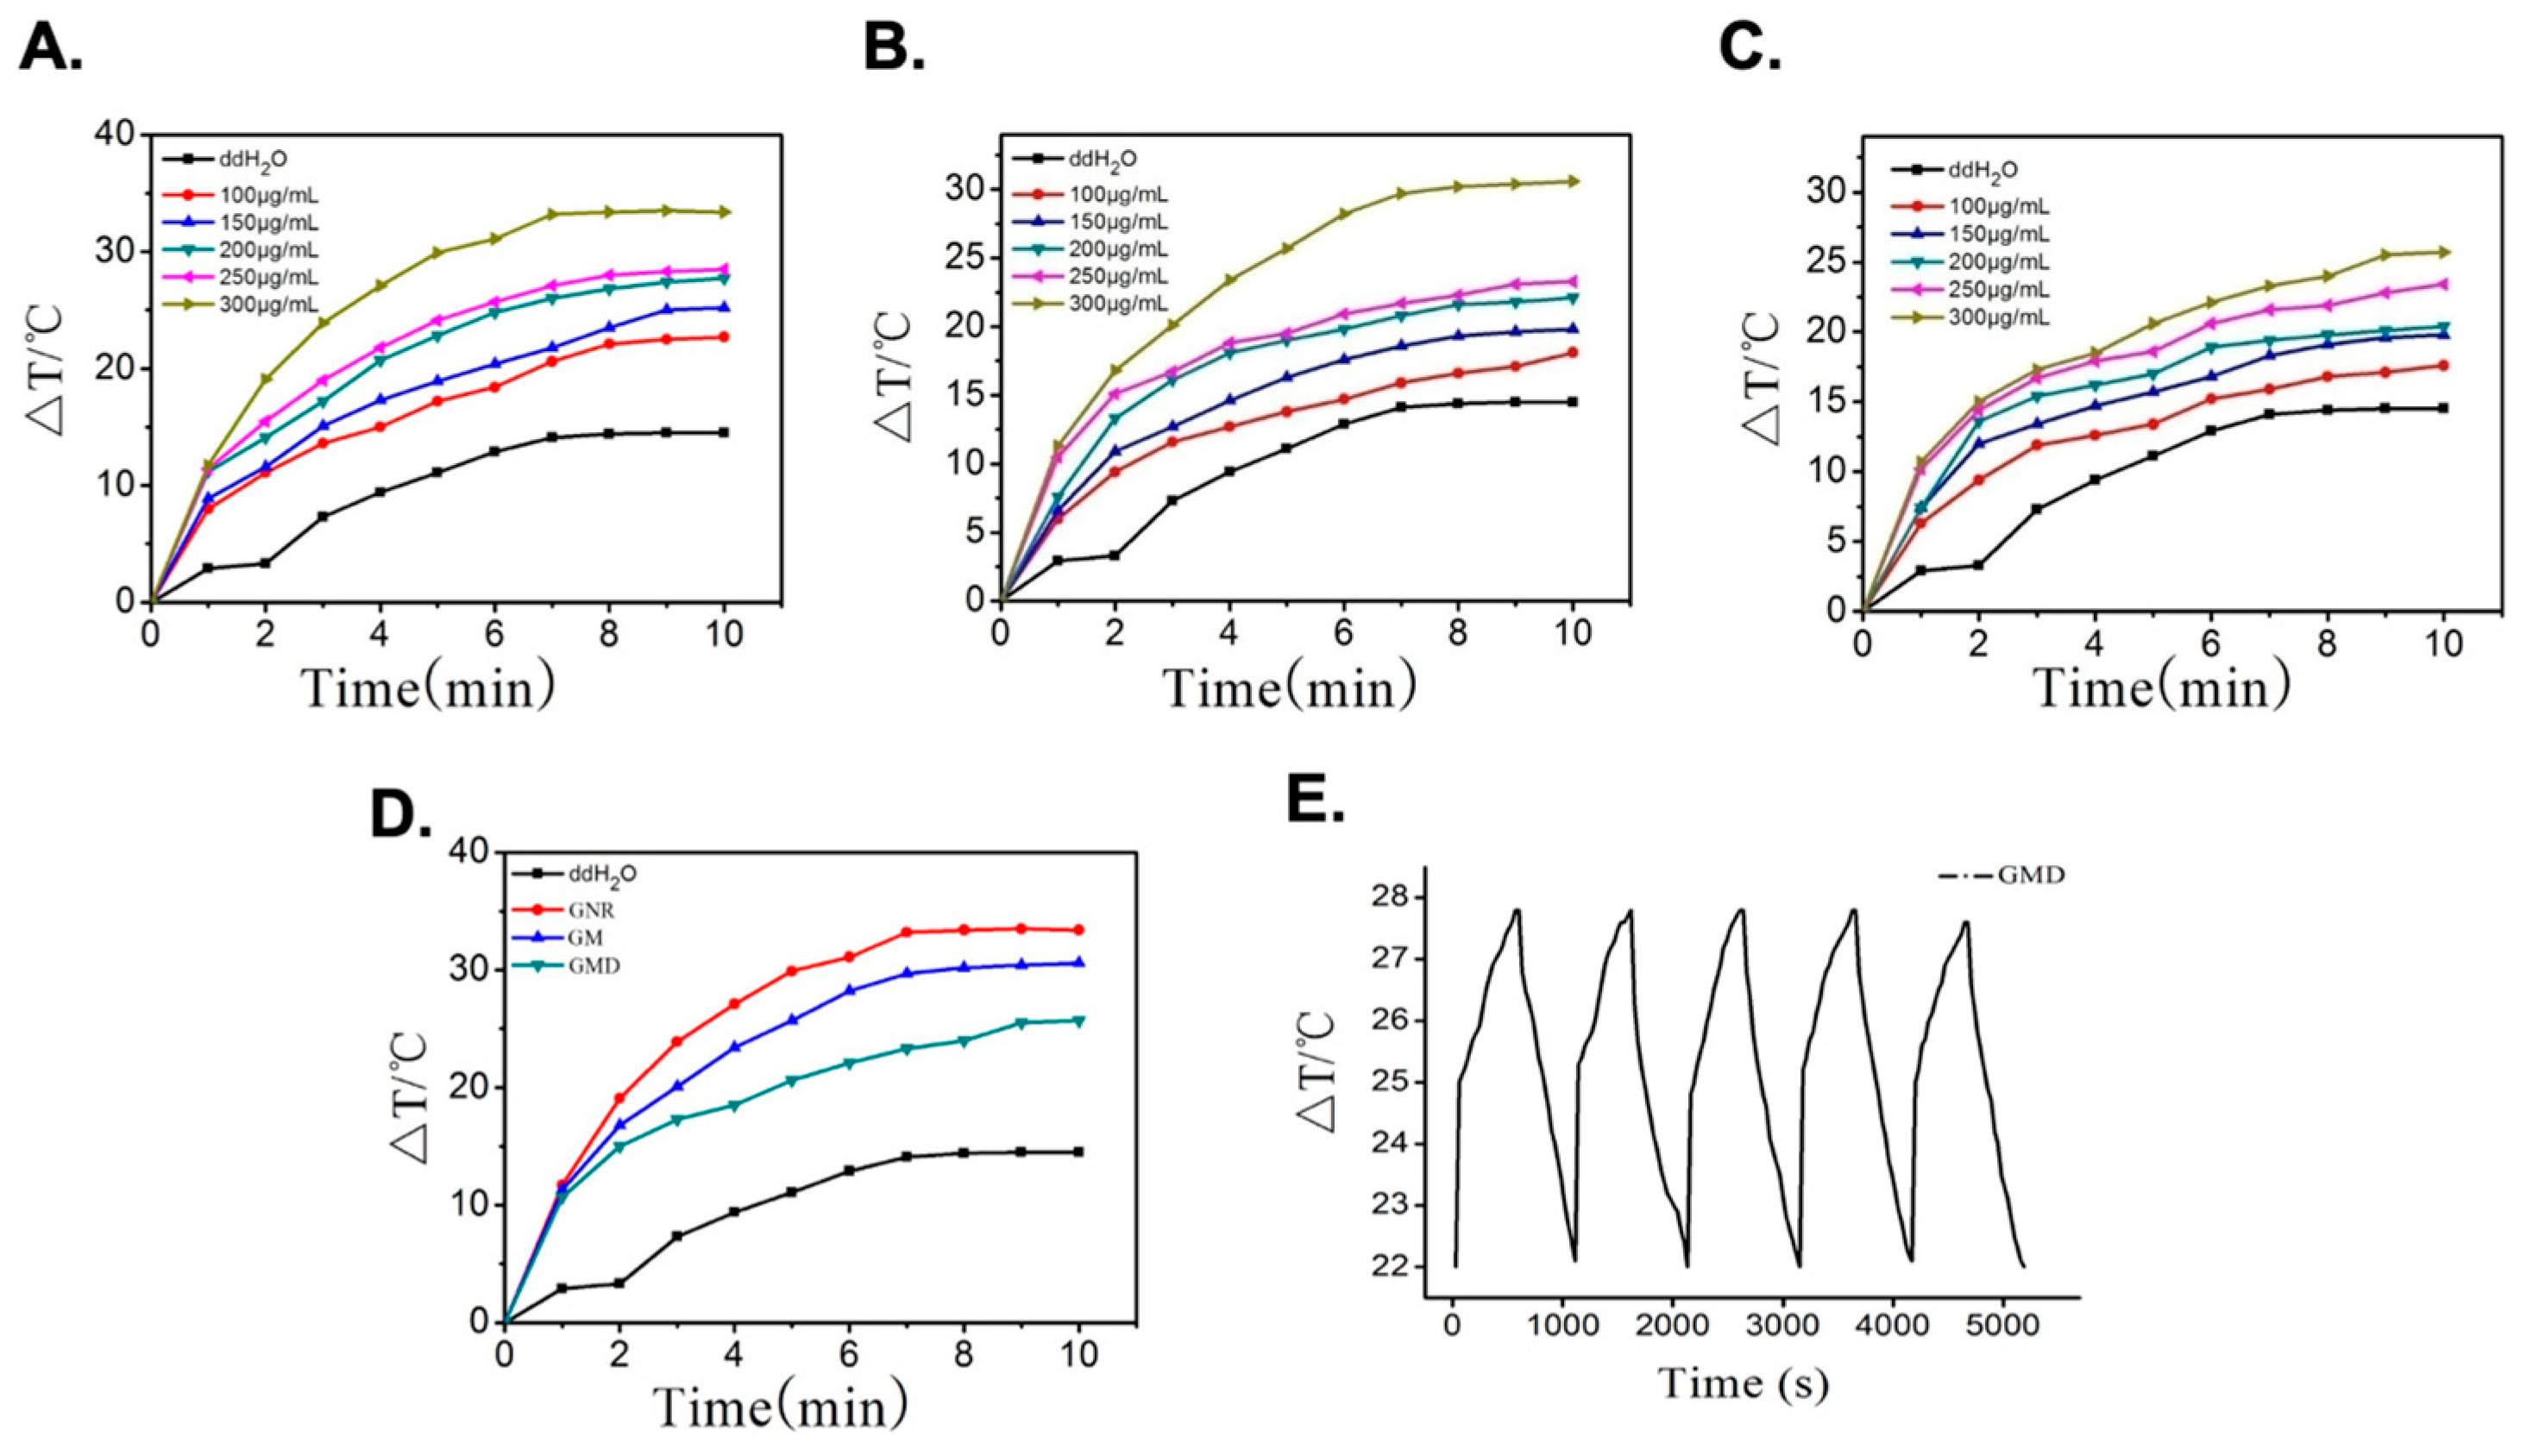
Figure 9). Subsequently, we examined the photothermal effects of the GM and GMD nanomaterials, realizing favorable recyclability of the photothermal conversion in tumor therapy. The drug loading time was screened, and we found that maximum drug loading could be achieved with ultrasound for 30 min. The GMD drug loading and encapsulation rates were 1.29% and 37.5%, respectively. We also explored the drug release ability and conditions and determined that the amount of the drug released could be increased under near-infrared light, which is conducive to sustained drug release. Ultimately, the GMD nanomaterials we constructed not only combined a photothermal effect with that of a chemotherapeutic drug but also had an oxidation function.
To further verify its anti-tumor activity through in vitro cell experiments, GM, GMD, GML, and GMDL nanomaterials were shown to reduce A549 cell survival by the MTT method, especially after 30 μg/mL GMDL treatment. The apoptosis rate was the highest, and the cell survival rate was only 45.67 ± 8.36%. The free DOX was used to test the cytotoxicity (
Figure S5). The calculated IC
50 of DOX is 1.15 μg/mL. We also calculated the IC
50 of DOX in the DOX-loaded system (GMD, GMDL groups); the drug IC
50 was 0.41 μg/mL for GMD and 0.29 μg/mL for GMDL. This combinatorial therapy effectively reduced the IC
50 of the drug. It may considerably increase the sensitivity of cells to DOX, with about a 4.0-fold reduction. Apoptosis was investigated by flow cytometry (
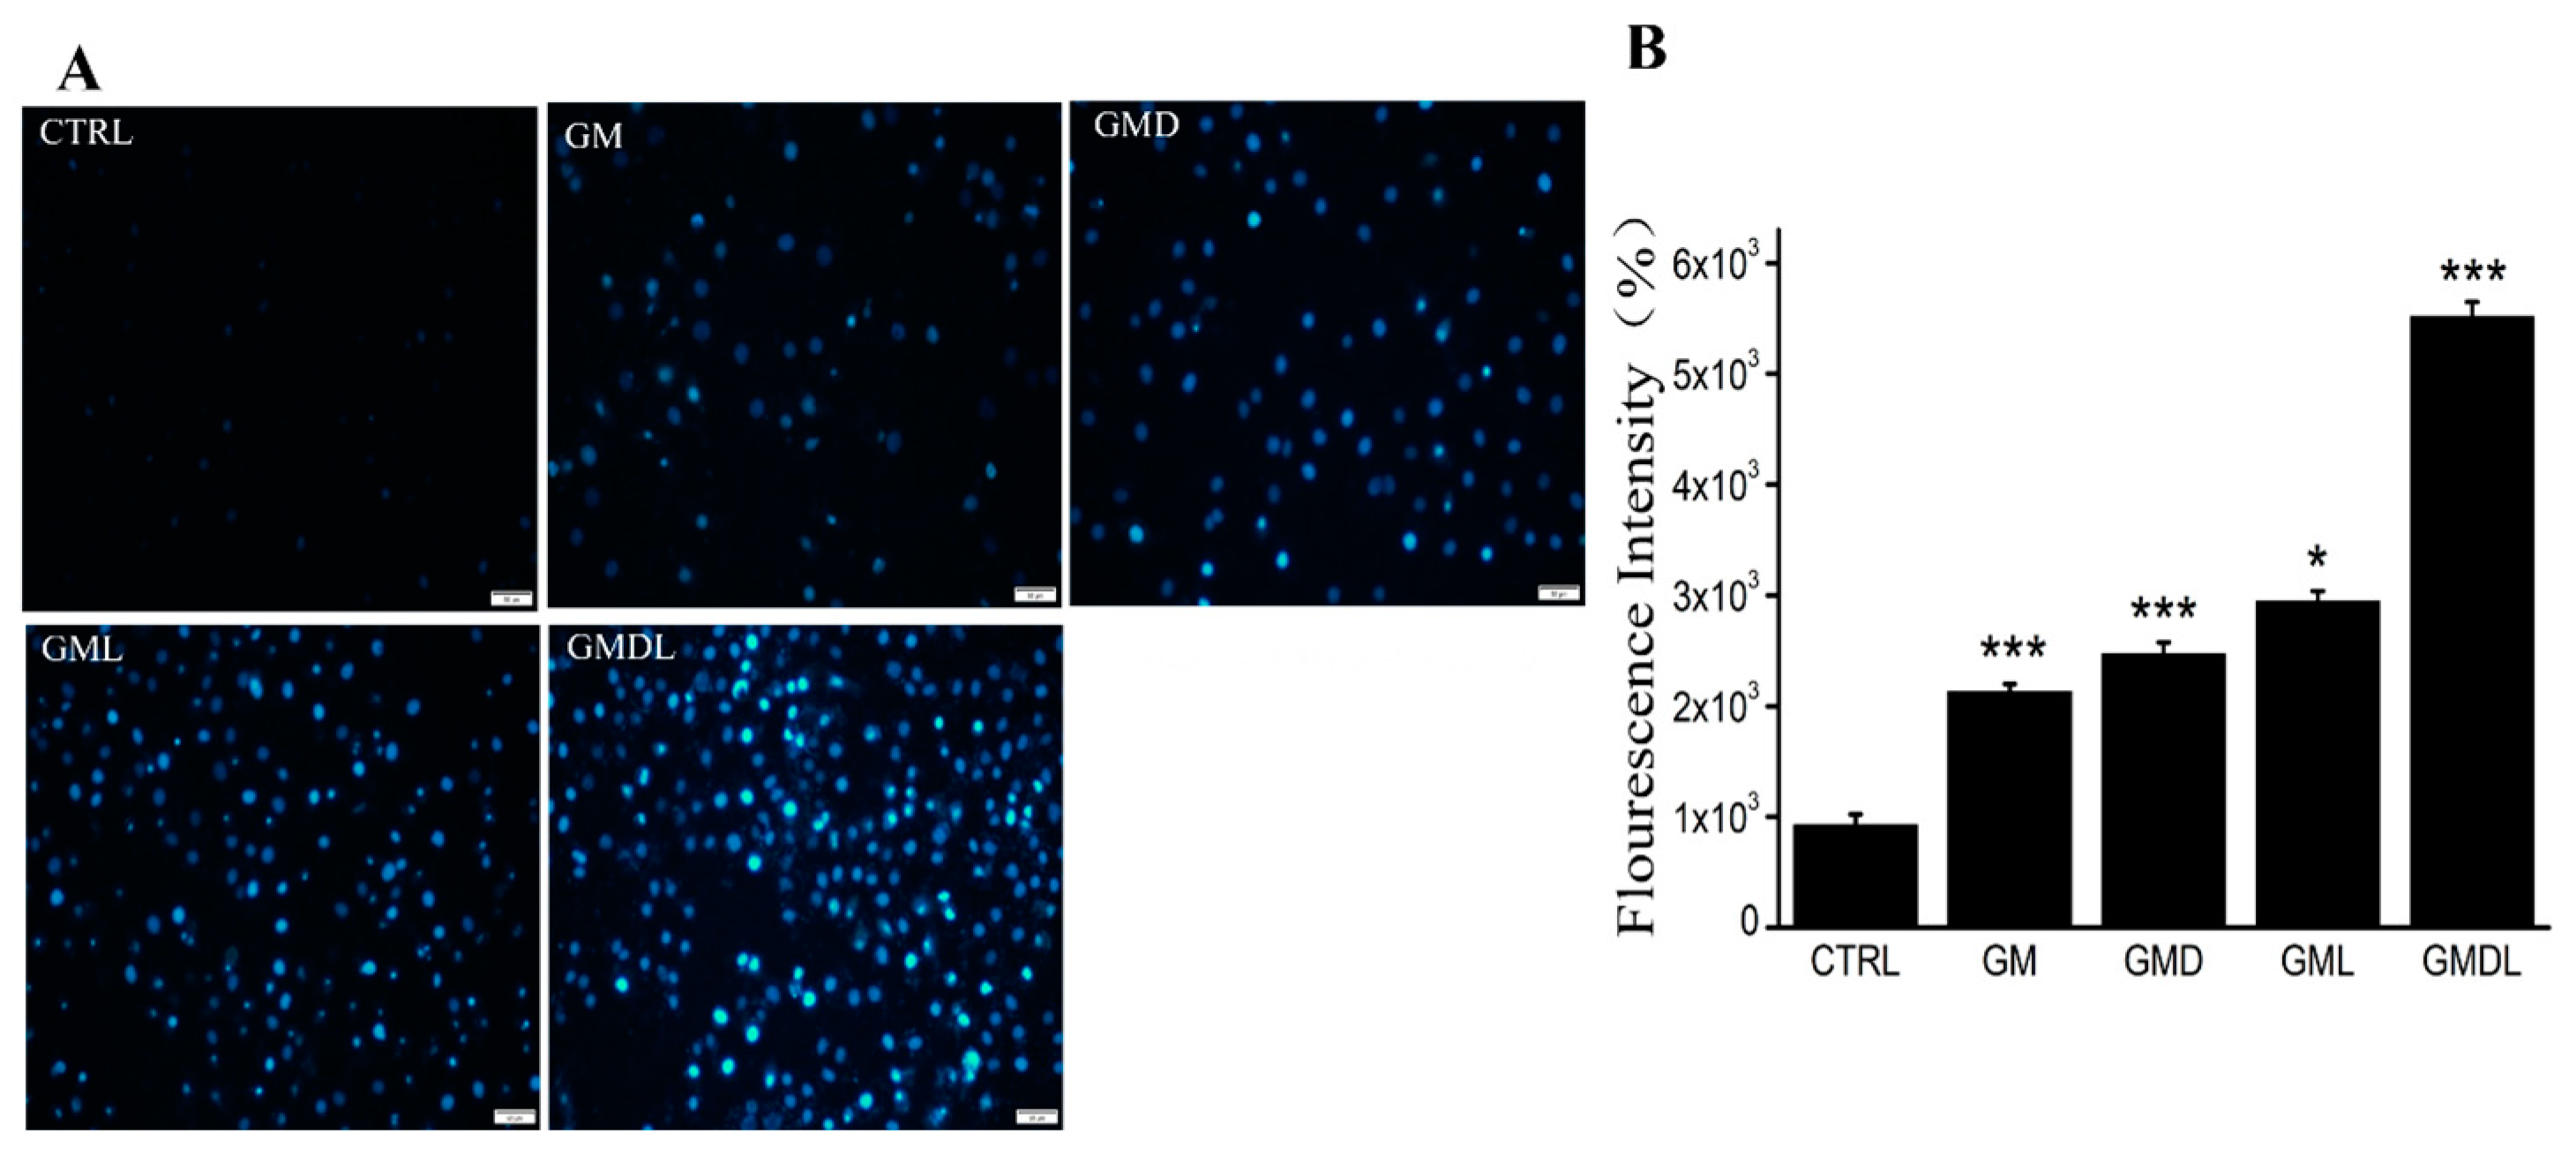
Figure S2). The above-mentioned nanomaterials induced apoptosis to varying degrees, especially in the GMDL group, where it was as high as 90%, consistent with the MTT results. The cell membranes are broken after cell injury and apoptosis induced by the nanomaterial, allowing the Hoechst 33342 fluorescent probe to easily pass through the biofilm and bind to the double-stranded DNA embedded in the nucleus, forming obvious bright blue fluorescence. Through experimental observations, we found that these nanomaterials produced bright blue fluorescence, which was particularly significant in the GMDL group. For in vivo application, the size distribution of the GMD system was evaluated by DLS (
Figure S6). A range of 140–950 nm is not commonly associated with enhanced permeability and retention (EPR effect) in tumors. However, the large size (up to 2600 nm) of the drug system also exhibited specific biodistribution in mice [
35]. The particle suspension can be injected via the tail vein, with larger particles showing accumulation in the lung tissue. Therefore, the A549 cell line in our system was used to assess the feasibility in tumor treatment. This could help us to establish animal experiments for lung cancer treatment in the future.
We also found that intracellular Ca2+ flow increased after treatment with nanomaterials, and the intracellular mitochondrial transmembrane potential and reactive oxygen species levels improved, showing significant performance in the GMDL group in various experiments. Additionally, nanomaterials reduced Nrf2 and HO1 protein expression levels and regulated Caspase-3/-8/-9 and Keap1 levels.
Overall, this GMDL nanomaterial can induce A549 cell apoptosis, indicating that it can improve combinatorial cancer therapy and enhance cancer treatment (
Scheme 1).
4. Materials and Methods
4.1. Chemicals and Characterization
All analytical-grade chemicals used in this study were purchased from Aladdin Chemistry Co., Ltd. (Shanghai, China) and used directly without purification. HRP (≥300 U·mg−1) was purchased from Shanghai Yuanye Bio-Technology Co., Ltd. (Shanghai, China). H2O was purified using a Milli-Q water purification system (Millipore, St. Louis, MO, USA). The UV–Vis and fluorescence spectra of the nanomaterials were collected using a UV-2700 spectrophotometer (Shimadzu Corp., Kyoto, Japan) and an RF-6000 fluorescence spectrophotometer (Shimadzu Corp.), respectively. FTIR spectra were acquired using a VERTEX 80VFT-IR spectrometer (Bruker Daltonik GmbH, Bremen, Germany). The TEM images were obtained using a JEM-2100 microscope (JEOL Ltd., Tokyo, Japan) at 200 kV. The particle sizes were determined using the Dynamic Light Scattering (DLS) method with a Zetasizer Nano ZS 90 (Malvern Panalytical, Malvern, UK).
4.2. Preparation and Characterization of Nanomaterials
4.2.1. Synthesis of GNRs
GNRs were prepared using a previously published method [
18]. Firstly, 1.8 mL of 0.2 M cetyltrimethyl ammonium bromide (CTAB) solution and 72 μL of 10.0 mM tetrachloroauric acid (HAuCl
4·4H
2O) were slowly poured into the centrifuge tube and gently stirred evenly. Then, 4.1 μL AgNO
3 solution (4.0 mM) was dropped into the centrifuge tube evenly while shaking. Next, 5.0 μL (1.0 M) hydrochloric acid solution was added to the centrifuge tube, and the pH of the solution was adjusted to about 1. We then added 94.5 μL (0.1 M) hydroquinone solution to the centrifuge tube and stirred it vigorously for 15 min. Stirring was stopped when the solution became colorless. After that, 0.7 μL of NaBH
4 (10.0 mM) was added immediately while the tube was in an ice bath, and the mixed solution was placed in a 27 °C water bath overnight. The solution was then centrifuged at 9000 rpm for 15 min and cleaned twice to obtain a GNR stock solution (1 mg/mL).
4.2.2. Synthesis of MOF-Capped Gold Nanorod
A quantity of 100 μL of 4-mercaptobenzoic acid (4-MBA) ethanol solution (5 mg/mL) was added to 2 mL GNR stock solution with agitation by vigorous shaking for an additional 2 h in a 27 °C water bath. After the reaction was completed, 10 μL copper acetate aqueous solution (10 mg/mL) was added to the above solution, and it was sonicated for 10 min. The solution was mixed well with the following added in order: 1 mL H2O, 1 mL trimesic acid–N,N-dimethylformamide solution (v:v = 1:1). This was subjected to ultrasonication for 10 min. This was then incubated for 30 min in a 55 °C water bath, and GM was obtained via centrifugation at 9000 rpm for 10 min before being stored in ethanol at 4 °C.
4.2.3. DOX Loading
MOF-capped gold nanorods hybrids were obtained by mixing the prepared doxorubicin (DOX) aqueous solution (100 μg/mL) with the GM nanomaterials suspension (1 mg/mL) via sonication for 30 min. According to the carrying amount and drug-loading formula, the encapsulation rate and the drug-loading rate were calculated via UV–Vis absorption spectroscopy. After centrifugation and discarding the supernatant, the gold nanorod@MOF@DOX (GMD) suspension was dissolved in water for later use.
4.3. Photothermal Performance of Nanomaterials
To measure the photothermal conversion performance of different nanomaterials, GNR, GM, or GMD with different concentrations (100, 150, 200, 250, and 300 μg/mL) in 1 mL aqueous solution were irradiated with near-infrared light (808 nm laser, 1.0 W·cm−2) for different amounts of time, and a temperature sensor was used to record the temperature change per minute.
4.4. Drug Loading and Release
The DOX-loading ability was evaluated according to the incubation time of the drug in the GM suspension. The GM deposit (100 μg) was resuspended in 1 mL of DOX solution (70 μg/mL) by ultrasonication for different time periods (10–40 min). After incubation, the GM–DOX suspension was centrifuged at 9000 rpm for 10 min. The absorbance intensity of the supernatant was measured using a UV–Vis spectrophotometer. A standard curve was recorded in a concentration range of 10–60 μg/mL DOX aqueous solution using the UV–Vis spectrophotometer. The loading capacities and encapsulation efficiency of the GMD hybrids were measured using the standard curve method.
Release behavior was monitored in a simulated tumor environment. GMD hybrids were dissolved in citric acid buffer solution (pH 5) with a temperature of 37 °C for 30 min. After centrifugation at 9000 rpm for 10 min, the supernatant was analyzed using a UV–Vis spectrophotometer. For photodynamic release, the GMD sample was exposed to an 808 nm laser for 5 min and incubated for 25 min for detection.
4.5. Peroxidase-like Activity
In the positive control group, 930 μL of citric acid buffer (50 mM, pH 5), 10 μL of HRP (1.6 ng/mL), 20 μL of 3,3′,5,5′-tetramethylbenzidine (TMB), and 40 μL of H
2O
2 (4 mM) were added successively. Next, in the experimental group, 100 μL of GMD (0.2 mg/mL), 20 μL of TMB, and 40 μL of H
2O
2 (4 mM) were added in order to 840 μL citric acid buffer (50 mM, pH 5). Then, in the negative control group, 20 μL of TMB and 40 μL of H
2O
2 (4 mM) were added successively to 940 μL of citric acid buffer (50 mM, pH 5). The reaction temperature was 37 °C, and the reaction time was 15 min. UV–Vis absorption measurements were also performed. A typical reaction involves the catalytic reduction of H
2O
2 to water, coupled with TMB oxidation (Equation (1)). The optical density at 652 nm was used to calculate relative activity.
4.6. Cell Culture
A549 cells (low differentiation; passages < 10; CRL-1721; ATCC, Manassas, VA, USA) derived from cancerous human lung alveolar basal epithelial cells were used. They were cultured in Dulbecco’s modified eagle medium (DMEM; Thermo Fisher Scientific, Waltham, MA, USA) and supplemented with 10% (v/v) horse serum (HS; Kangyuan Biology, Tianjin, China), 5% (v/v) fetal bovine serum (FBS; Kangyuan Biology, Tianjin, China), 100 μg/mL penicillin, or 100 μg/mL streptomycin (Invitrogen, Carlsbad, CA, USA). The cells were incubated under a humidified atmosphere containing 5% CO2 and 95% air at 37 °C. The media were replaced every 2 d. The cells were considered ready for treatment when they reached 75% confluence.
4.7. MTT Assay
A549 cells were inoculated in 96-well plates at a density of 2 × 10⁴ cells per well at 37 °C under 5% CO2. Different concentrations of the nanomaterials were added and co-incubated. After 24 h, cells were digested with 0.25% (w/v) trypsin and centrifuged. Next, 5 mg/mL MTT solution was added to the cells, and they were incubated for 4 h at 37 °C in the dark. Then, 100 μL of DMSO was added to dissolve the formazan crystals. The MTT assay was then repeated as described above. A microplate reader (Infinite F200 Pro; Tecan Group AG, Männedorf, Switzerland) was used to measure optical density (OD) at 540 nm. In the laser exposure experiments, GML and GMDL samples were added with different concentrations of GM and GMD for 24 h, irradiated with a near-infrared laser (808 nm) of 1 W/cm2 for 5 min, and cultured for 3 h. The MTT assay was then conducted.
4.8. Analysis of Apoptosis Morphology
The A549 cells were treated with GM, GMD, GML, or GMDL for 24 h. The laser exposure time was 5 min after incubation. The cells were washed with phosphate buffer and centrifuged to remove the supernatant. The Annexin V-FITC/PI kit dye was used for 30 mins at 4 °C in the dark. The stained cells were collected by centrifugation, and the excess staining fluid was removed. The cells were suspended in phosphate buffer, and the fluorescence of each cell was analyzed using flow cytometry (CytoFLEX, Beckman Coulter, Brea, CA, USA).
4.9. Nuclear Apoptosis Measurement
A549 cells were treated with the different nanomaterials for 24 h. At 37 °C in the dark, 5 μg/mL Hoechst 33342 (Beyotime, Shanghai, China) was added to stain the cells and hatched for 20 min. The cells were then washed three times with phosphate buffer. Morphological changes in apoptotic cells were photographed using a fluorescence microscope (×10; CCD camera; IX73; Olympus, Tokyo, Japan). ImageJ software was used for the quantitative analysis of the fluorescent images.
4.10. Analysis of Mitochondrial Membrane Potential (MMP)
A549 cells were treated with the different nanomaterials for 24 h. At 37 °C in the dark, 10 μg/mL JC-1 (Beyotime, Shanghai, China) staining solution was added to stain the cells and hatched for 20 min. The cells were then washed three times with phosphate buffer. Red and green fluorescence were measured using a fluorescence microscope.
4.11. Intracellular Ca2+ Concentration
A549 cells were treated with the different nanomaterials for 24 h. At 37 °C in the dark, 5 μM Fluo-4 AM (Fluo-4 acetoxymethyl ester) staining solution was added to stain the cells and hatched for 20 min. The cells were then washed thrice with phosphate buffer and analyzed using a fluorescence microscope.
4.12. Intracellular ROS
Intracellular ROS levels were detected using 2′,7′-dichlorofluorescein diacetate (DCFH-DA) (Beyotime Biotechnology, Shanghai, China). Briefly, the A549 cells were treated with different nanomaterials for 24 h. At 37 °C in the dark, 10 μM DCFH-DA solution was added to stain the cells and hatched for 30 min. The cells were then washed three times with phosphate buffer. Morphological changes in the cells were photographed using a fluorescence microscope. Intracellular green fluorescence intensity was detected using a microplate reader.
4.13. Caspase 3/8/9 Activity Assay
A549 cells were treated with various experimental drugs for 24 h. Digested cells were washed with phosphate buffer and centrifuged to remove the supernatant. The protein content of the cell lysates was determined according to the BCA protein assay kit. Extracted protein was also added to the buffer and caspase 3/8/9 assay substrate and incubated for 4 h at 37 °C in the dark. Absorbance at 400 nm was measured using a microplate reader.
4.14. Western Blotting
A549 cells treated with different nanomaterials were lysed and centrifuged for 10 min at 12,000 rpm (4 °C). The total protein content of the supernatant was determined using a bicinchoninic acid (BCA) protein assay kit (Biosynthesis Biotechnology, Beijing, China). The proteins were loaded onto concentrated gel and 10% sodium dodecyl sulfate-polyacrylamide gel, separated by electrophoresis (SDS-PAGE), and transferred to a 0.45 μm polyvinylidene fluoride (PVDF) membrane (Invitrogen, Carlsbad, CA, USA). After methanol activation for 1 min, 5% (v/v) bovine serum albumin (BSA) was blocked with Tris-buffered saline and Tween-20 (TBST) at 25 °C for 2 h. Then, the membranes were probed with primary antibodies, anti-β-actin (bs-0061R), Nrf2 (bs-1074R), keap1 (bs-3648R) (all from Biosynthesis and Technology, Beijing, China), and HO1 (ab13248; Abcam, Cambridge, UK), respectively, overnight at 4 °C. TBST was used to wash them three times for 10 min each. The blots were then incubated with the corresponding HRP-conjugated secondary antibodies (HRP-labeled goat anti-rabbit IgG antibody 1:1000, CST, USA) for 1 h. Relative protein band intensities were detected using enhanced chemiluminescence (ECL, C05-07004, Biosynthesis Biotechnology Co., Ltd., Beijing, China) and analyzed using a fully automated chemiluminescence imaging analysis system (Tanon 5200, Teneng Technology Co., Ltd., Shanghai, China).
4.15. Statistical Analysis
All data are presented as the mean ± SEM. The statistical significance of the differences between two groups was analyzed by Student’s t-test or one-way analysis of variance (ANOVA). Statistical significance was set at p < 0.05.


