Scaly MoS2/rGO Composite as an Anode Material for High-Performance Potassium-Ion Battery

 ,
, 
Abstract
1. Introduction
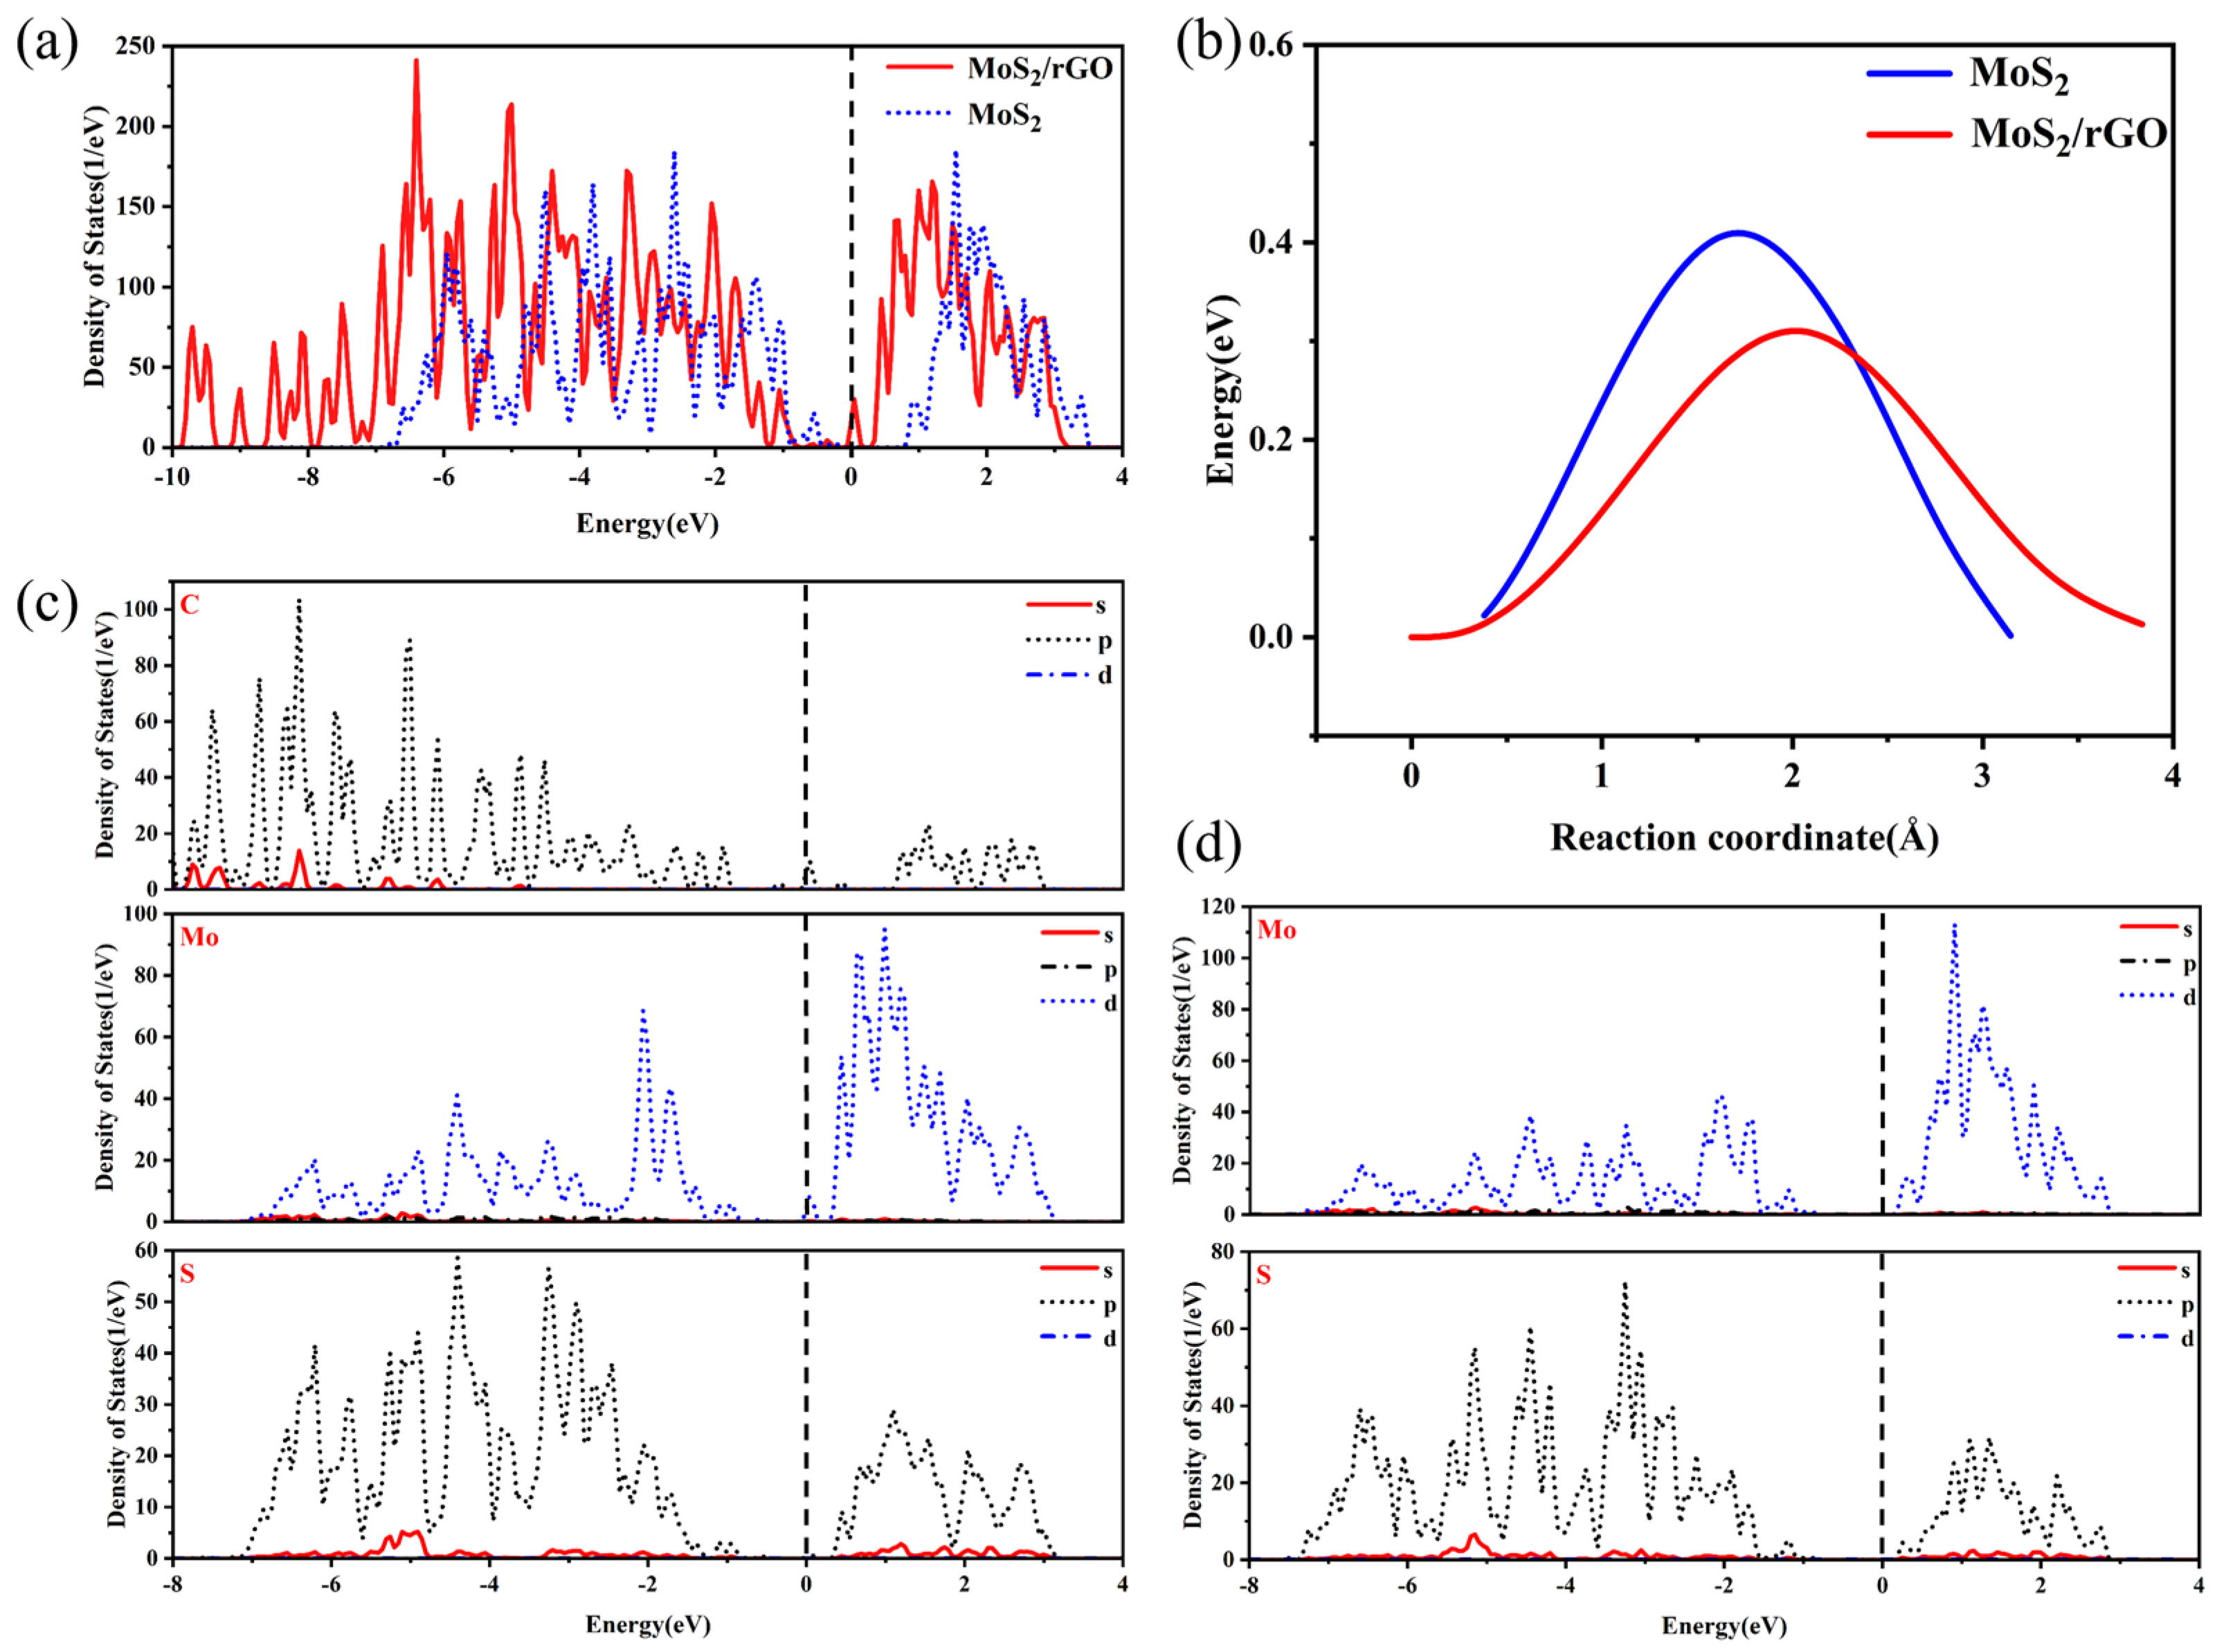
2. Results and Discussion
3. Materials and Methods
3.1. Material
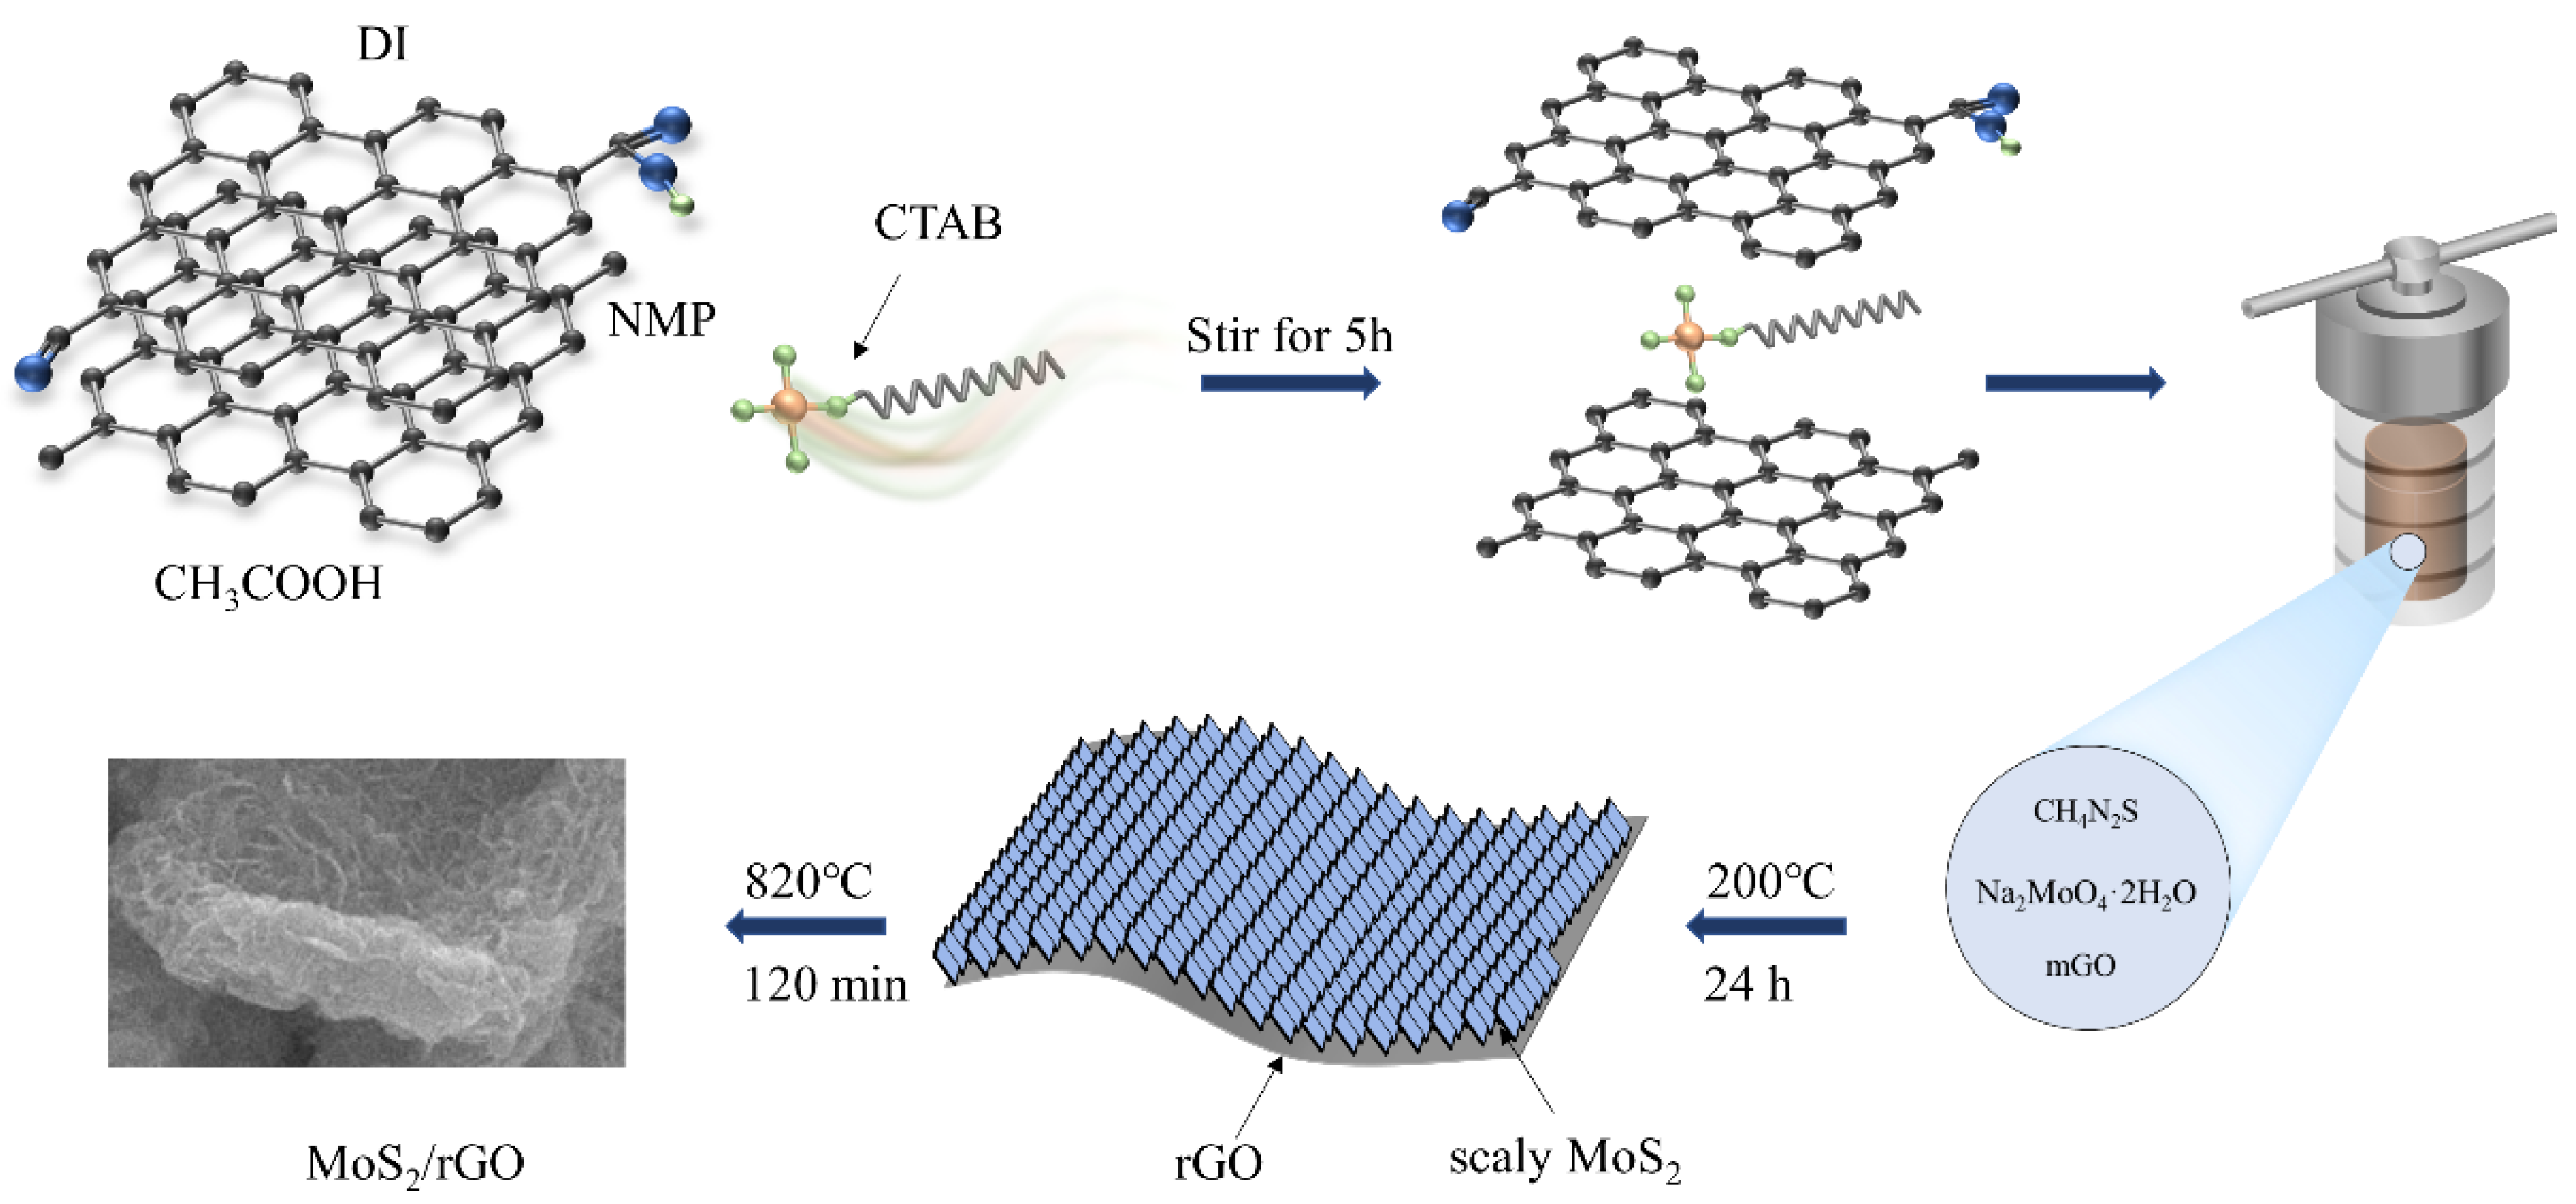
3.2. Preparation of MoS2/rGO Composite
3.3. Structural Characterization
3.4. Electrochemical Characterization
3.5. Theoretical Calculation
4. Conclusions
Supplementary Materials
Author Contributions
Funding
Institutional Review Board Statement
Informed Consent Statement
Data Availability Statement
Acknowledgments
Conflicts of Interest
References
- Sui, Y.; Zhou, J.; Wang, X.; Wu, L.; Zhong, S.; Li, Y. Recent Advances in Black-Phosphorus-Based Materials for Electrochemical Energy Storage. Mater. Today 2021, 42, 117–136. [Google Scholar] [CrossRef]
- Zhou, G.; Xu, L.; Hu, G.; Mai, L.; Cui, Y. Nanowires for Electrochemical Energy Storage. Chem. Rev. 2019, 119, 11042–11109. [Google Scholar] [CrossRef] [PubMed]
- De Rosa, M.; Afanaseva, O.; Fedyukhin, A.V.; Bianco, V. Prospects and Characteristics of Thermal and Electrochemical Energy Storage Systems. J. Energy Storage 2021, 44, 103443. [Google Scholar] [CrossRef]
- Wang, C.-Y.; Liu, T.; Yang, X.-G.; Ge, S.; Stanley, N.V.; Rountree, E.S.; Leng, Y.; McCarthy, B.D. Fast Charging of Energy-Dense Lithium-Ion Batteries. Nature 2022, 611, 485–490. [Google Scholar] [CrossRef] [PubMed]
- Abu, S.M.; Hannan, M.A.; Hossain Lipu, M.S.; Mannan, M.; Ker, P.J.; Hossain, M.J.; Mahlia, T.M.I. State of the Art of Lithium-Ion Battery Material Potentials: An Analytical Evaluations, Issues and Future Research Directions. J. Clean. Prod. 2023, 394, 136246. [Google Scholar] [CrossRef]
- Chayambuka, K.; Mulder, G.; Danilov, D.L.; Notten, P.H.L. Sodium-Ion Battery Materials and Electrochemical Properties Reviewed. Adv. Energy Mater. 2018, 8, 1800079. [Google Scholar] [CrossRef]
- Guo, Q.; Zeng, W.; Liu, S.-L.; Li, Y.-Q.; Xu, J.-Y.; Wang, J.-X.; Wang, Y. Recent Developments on Anode Materials for Magnesium-Ion Batteries: A Review. Rare Met. 2021, 40, 290–308. [Google Scholar] [CrossRef]
- Das, S.K.; Mahapatra, S.; Lahan, H. Aluminium-Ion Batteries: Developments and Challenges. J. Mater. Chem. A 2017, 5, 6347–6367. [Google Scholar] [CrossRef]
- Min, X.; Xiao, J.; Fang, M.; Wang, W.; Zhao, Y.; Liu, Y.; Abdelkader, A.M.; Xi, K.; Kumar, R.V.; Huang, Z. Potassium-Ion Batteries: Outlook on Present and Future Technologies. Energy Environ. Sci. 2021, 14, 2186–2243. [Google Scholar] [CrossRef]
- Zhang, W.; Yin, J.; Wang, W.; Bayhan, Z.; Alshareef, H.N. Status of Rechargeable Potassium Batteries. Nano Energy 2021, 83, 105792. [Google Scholar] [CrossRef]
- Hwang, J.-Y.; Myung, S.-T.; Sun, Y.-K. Recent Progress in Rechargeable Potassium Batteries. Adv. Funct. Mater. 2018, 28, 1802938. [Google Scholar] [CrossRef]
- Eftekhari, A.; Jian, Z.; Ji, X. Potassium Secondary Batteries. ACS Appl. Mater. Interfaces 2017, 9, 4404–4419. [Google Scholar] [CrossRef] [PubMed]
- Rajagopalan, R.; Tang, Y.; Ji, X.; Jia, C.; Wang, H. Advancements and Challenges in Potassium Ion Batteries: A Comprehensive Review. Adv. Funct. Mater. 2020, 30, 1909486. [Google Scholar] [CrossRef]
- Zhang, J.; Liu, T.; Cheng, X.; Xia, M.; Zheng, R.; Peng, N.; Yu, H.; Shui, M.; Shu, J. Development Status and Future Prospect of Non-Aqueous Potassium Ion Batteries for Large Scale Energy Storage. Nano Energy 2019, 60, 340–361. [Google Scholar] [CrossRef]
- Liu, S.; Kang, L.; Henzie, J.; Zhang, J.; Ha, J.; Amin, M.A.; Hossain, M.S.A.; Jun, S.C.; Yamauchi, Y. Recent Advances and Perspectives of Battery-Type Anode Materials for Potassium Ion Storage. ACS Nano 2021, 15, 18931–18973. [Google Scholar] [CrossRef] [PubMed]
- Lei, Y.; Chen, M.; Li, Y.; Zhang, W.; Zhao, D.; Zhu, Q. Dendrite-Free Potassium Metal Anode Induced by in-Situ Phase Transitions of MoS2. Mater. Today Phys. 2023, 35, 101141. [Google Scholar] [CrossRef]
- Sha, M.; Liu, L.; Zhao, H.; Lei, Y. Anode Materials for Potassium-Ion Batteries: Current Status and Prospects. Carbon Energy 2020, 2, 350–369. [Google Scholar] [CrossRef]
- Presolski, S.; Pumera, M. Covalent Functionalization of MoS2. Mater. Today 2016, 19, 140–145. [Google Scholar] [CrossRef]
- Wang, Y.-Z.; Shan, X.-Y.; Wang, D.-W.; Sun, Z.-H.; Cheng, H.-M.; Li, F. A Rechargeable Quasi-Symmetrical MoS2 Battery. Joule 2018, 2, 1278–1286. [Google Scholar] [CrossRef]
- Li, C.; Lao, B.; Li, Z.; Yin, H.; Yang, Z.; Wang, H.; Chen, D.; Zhang, X.; Xu, Y.; Sun, C. Dual-Ion Battery with MoS2 Cathode. Energy Storage Mater. 2020, 32, 159–166. [Google Scholar] [CrossRef]
- Wu, K.; Cao, X.; Li, M.; Lei, B.; Zhan, J.; Wu, M. Bottom-Up Synthesis of MoS2/CNTs Hollow Polyhedron with 1T/2H Hybrid Phase for Superior Potassium-Ion Storage. Small 2020, 16, 2004178. [Google Scholar] [CrossRef] [PubMed]
- Yao, K.; Xu, Z.; Ma, M.; Li, J.; Lu, F.; Huang, J. Densified Metallic MoS2/Graphene Enabling Fast Potassium-Ion Storage with Superior Gravimetric and Volumetric Capacities. Adv. Funct. Mater. 2020, 30, 2001484. [Google Scholar] [CrossRef]
- Cui, Y.; Liu, W.; Feng, W.; Zhang, Y.; Du, Y.; Liu, S.; Wang, H.; Chen, M.; Zhou, J. Controlled Design of Well-Dispersed Ultrathin MoS 2 Nanosheets inside Hollow Carbon Skeleton: Toward Fast Potassium Storage by Constructing Spacious “Houses” for K Ions. Adv. Funct. Mater. 2020, 30, 1908755. [Google Scholar] [CrossRef]
- Liu, Y.; Xiao, Y.; Liu, F.; Han, P.; Qin, G. Controlled Building of Mesoporous MoS2 @MoO2-Doped Magnetic Carbon Sheets for Superior Potassium Ion Storage. J. Mater. Chem. A 2019, 7, 26818–26828. [Google Scholar] [CrossRef]
- Krishnamoorthy, K.; Veerapandian, M.; Yun, K.; Kim, S.-J. The Chemical and Structural Analysis of Graphene Oxide with Different Degrees of Oxidation. Carbon 2013, 53, 38–49. [Google Scholar] [CrossRef]
- Xie, K.; Yuan, K.; Li, X.; Lu, W.; Shen, C.; Liang, C.; Vajtai, R.; Ajayan, P.; Wei, B. Superior Potassium Ion Storage via Vertical MoS2 “Nano-Rose” with Expanded Interlayers on Graphene. Small 2017, 13, 1701471. [Google Scholar] [CrossRef] [PubMed]
- Pei, B.; Jiang, Z.; Zhang, W.; Yang, Z.; Manthiram, A. Nanostructured Li3V2(PO4)3 Cathode Supported on Reduced Graphene Oxide for Lithium-Ion Batteries. J. Power Sources 2013, 239, 475–482. [Google Scholar] [CrossRef]
- Ma, G.; Zhou, Y.; Wang, Y.; Feng, Z.; Yang, J. N, P-Codoped Graphene Supported Few-Layered MoS2 as a Long-Life and High-Rate Anode Materials for Potassium-Ion Storage. Nano Res. 2021, 14, 3523–3530. [Google Scholar] [CrossRef]
- Wang, J.; Fang, W.; Hu, Y.; Zhang, Y.; Dang, J.; Wu, Y.; Chen, B.; Zhao, H.; Li, Z. Single Atom Ru Doping 2H-MoS2 as Highly Efficient Hydrogen Evolution Reaction Electrocatalyst in a Wide pH Range. Appl. Catal. B Environ. 2021, 298, 120490. [Google Scholar] [CrossRef]
- Wurst, K.M.; Strolka, O.; Hiller, J.; Keck, J.; Meixner, A.J.; Lauth, J.; Scheele, M. Electronic Structure of Colloidal 2H-MoS2 Mono and Bilayers Determined by Spectroelectrochemistry. Small 2023, 19, 2207101. [Google Scholar] [CrossRef]
- Huang, H.-H.; De Silva, K.K.H.; Kumara, G.R.A.; Yoshimura, M. Structural Evolution of Hydrothermally Derived Reduced Graphene Oxide. Sci. Rep. 2018, 8, 6849. [Google Scholar] [CrossRef] [PubMed]
- Liu, M.; Liu, Y.; Tang, B.; Zhang, P.; Yan, Y.; Liu, T. 3D Conductive Network Supported Monolithic Molybdenum Disulfide Nanosheets for High-Performance Lithium Storage Applications. Adv. Mater. Inter. 2017, 4, 1601228. [Google Scholar] [CrossRef]
- Hu, X.; Li, Y.; Zeng, G.; Jia, J.; Zhan, H.; Wen, Z. Three-Dimensional Network Architecture with Hybrid Nanocarbon Composites Supporting Few-Layer MoS2 for Lithium and Sodium Storage. ACS Nano 2018, 12, 1592–1602. [Google Scholar] [CrossRef] [PubMed]
- Gao, J.; Li, Y.; Liu, Y.; Jiao, S.; Li, J.; Wang, G.; Zeng, S.; Zhang, G. The Dual-Function Sacrificing Template Directed Formation of MoS2/C Hybrid Nanotubes Enabling Highly Stable and Ultrafast Sodium Storage. J. Mater. Chem. A 2019, 7, 18828–18834. [Google Scholar] [CrossRef]
- Xu, Z.; He, M.; Zhou, Y.; Nie, S.; Wang, Y.; Huo, Y.; Kang, Y.; Wang, R.; Xu, R.; Peng, H.; et al. Spider Web-like Carbonized Bacterial Cellulose/MoSe2 Nanocomposite with Enhanced Microwave Attenuation Performance and Tunable Absorption Bands. Nano Res. 2021, 14, 738–746. [Google Scholar] [CrossRef]
- Jia, B.; Yu, Q.; Zhao, Y.; Qin, M.; Wang, W.; Liu, Z.; Lao, C.-Y.; Liu, Y.; Wu, H.; Zhang, Z.; et al. Bamboo-Like Hollow Tubes with MoS2/N-Doped-C Interfaces Boost Potassium-Ion Storage. Adv. Funct. Mater. 2018, 28, 1803409. [Google Scholar] [CrossRef]
- Wang, H.; Zhai, D.; Kang, F. Solid Electrolyte Interphase (SEI) in Potassium Ion Batteries. Energy Environ. Sci. 2020, 13, 4583–4608. [Google Scholar] [CrossRef]
- Gu, M.; Rao, A.M.; Zhou, J.; Lu, B. In Situ Formed Uniform and Elastic SEI for High-Performance Batteries. Energy Environ. Sci. 2023, 16, 1166–1175. [Google Scholar] [CrossRef]
- Zhang, Y.; Zhu, L.; Xu, H.; Wu, Q.; Duan, H.; Chen, B.; He, H. Interlayer-Expanded MoS2 Enabled by Sandwiched Monolayer Carbon for High Performance Potassium Storage. Molecules 2023, 28, 2608. [Google Scholar] [CrossRef]
- Liu, H.; He, Y.; Cao, K.; Wang, S.; Jiang, Y.; Liu, X.; Huang, K.-J.; Jing, Q.-S.; Jiao, L. Stimulating the Reversibility of Sb2S3 Anode for High-Performance Potassium-Ion Batteries. Small 2021, 17, 2008133. [Google Scholar] [CrossRef]
- Fagiolari, L.; Versaci, D.; Di Berardino, F.; Amici, J.; Francia, C.; Bodoardo, S.; Bella, F. An Exploratory Study of MoS2 as Anode Material for Potassium Batteries. Batteries 2022, 8, 242. [Google Scholar] [CrossRef]
- Chen, L.; Chen, Z.; Chen, L.; Zhou, P.; Wang, J.; Yang, H.; Feng, Z.; Li, X.; Huang, J. The Exfoliation of Bulk MoS2 by a Three-Roller Mill for High-Performance Potassium Ion Batteries. Appl. Surf. Sci. 2023, 615, 156253. [Google Scholar] [CrossRef]
- Zhang, J.; Cui, P.; Gu, Y.; Wu, D.; Tao, S.; Qian, B.; Chu, W.; Song, L. Encapsulating Carbon-Coated MoS2 Nanosheets within a Nitrogen-Doped Graphene Network for High-Performance Potassium-Ion Storage. Adv. Mater. Interfaces 2019, 6, 1901066. [Google Scholar] [CrossRef]
- Li, J.; Rui, B.; Wei, W.; Nie, P.; Chang, L.; Le, Z.; Liu, M.; Wang, H.; Wang, L.; Zhang, X. Nanosheets Assembled Layered MoS2/MXene as High Performance Anode Materials for Potassium Ion Batteries. J. Power Sources 2020, 449, 227481. [Google Scholar] [CrossRef]
- Kim, H.; Byeon, Y.-W.; Wang, J.; Zhang, Y.; Scott, M.C.; Jun, K.; Cai, Z.; Sun, Y. Understanding of Electrochemical K+/Na+ Exchange Mechanisms in Layered Oxides. Energy Storage Mater. 2022, 47, 105–112. [Google Scholar] [CrossRef]
- Ma, M.; Zhang, S.; Yao, Y.; Wang, H.; Huang, H.; Xu, R.; Wang, J.; Zhou, X.; Yang, W.; Peng, Z.; et al. Heterostructures of 2D Molybdenum Dichalcogenide on 2D Nitrogen-Doped Carbon: Superior Potassium-Ion Storage and Insight into Potassium Storage Mechanism. Adv. Mater. 2020, 32, 2000958. [Google Scholar] [CrossRef]
- Fang, G.; Wu, Z.; Zhou, J.; Zhu, C.; Cao, X.; Lin, T.; Chen, Y.; Wang, C.; Pan, A.; Liang, S. Observation of Pseudocapacitive Effect and Fast Ion Diffusion in Bimetallic Sulfides as an Advanced Sodium-Ion Battery Anode. Adv. Energy Mater. 2018, 8, 1703155. [Google Scholar] [CrossRef]
- Zhao, J.; Burke, A.F. Electrochemical Capacitors: Materials, Technologies and Performance. Energy Storage Mater. 2021, 36, 31–55. [Google Scholar] [CrossRef]
- Wang, S.; Zhang, J.; Gharbi, O.; Vivier, V.; Gao, M.; Orazem, M.E. Electrochemical Impedance Spectroscopy. Nat. Rev. Methods Primers 2021, 1, 41. [Google Scholar] [CrossRef]
- Blöchl, P.E. Projector Augmented-Wave Method. Phys. Rev. B 1994, 50, 17953–17979. [Google Scholar] [CrossRef]
- Kresse, G.; Joubert, D. From Ultrasoft Pseudopotentials to the Projector Augmented-Wave Method. Phys. Rev. B 1999, 59, 1758–1775. [Google Scholar] [CrossRef]
- Marlo, M.; Milman, V. Density-Functional Study of Bulk and Surface Properties of Titanium Nitride Using Different Exchange-Correlation Functionals. Phys. Rev. B 2000, 62, 2899–2907. [Google Scholar] [CrossRef]
- White, J.A.; Bird, D.M. Implementation of Gradient-Corrected Exchange-Correlation Potentials in Car-Parrinello Total-Energy Calculations. Phys. Rev. B 1994, 50, 4954–4957. [Google Scholar] [CrossRef]


| Chemical Formula | Electrochemical Performance | Cycle Number |
|---|---|---|
| MoS2 [41] | 102 mAh g−1 (100 mAg1) | 86 mAh g−1 (200 cycles) |
| MoS2@C [42] | ~290 mAh g−1 (500 mAg1) | 241 mAh g−1 (100 cycles) |
| MoS2@Cnanosheets [43] | 300 mAh g−1 (100 mA g−1) | 164.5 mAh g−1 (350 cycles) |
| MoS2/MXene [44] | 271.4 mAh g−1 (50 mA g−1) | 206 mAh g−1 (100 cycles) |
| C-MoS2 [39] | ~340 mAh g−1 (1000 mA g−1) | 273 mAh g−1 (100 cycles) |
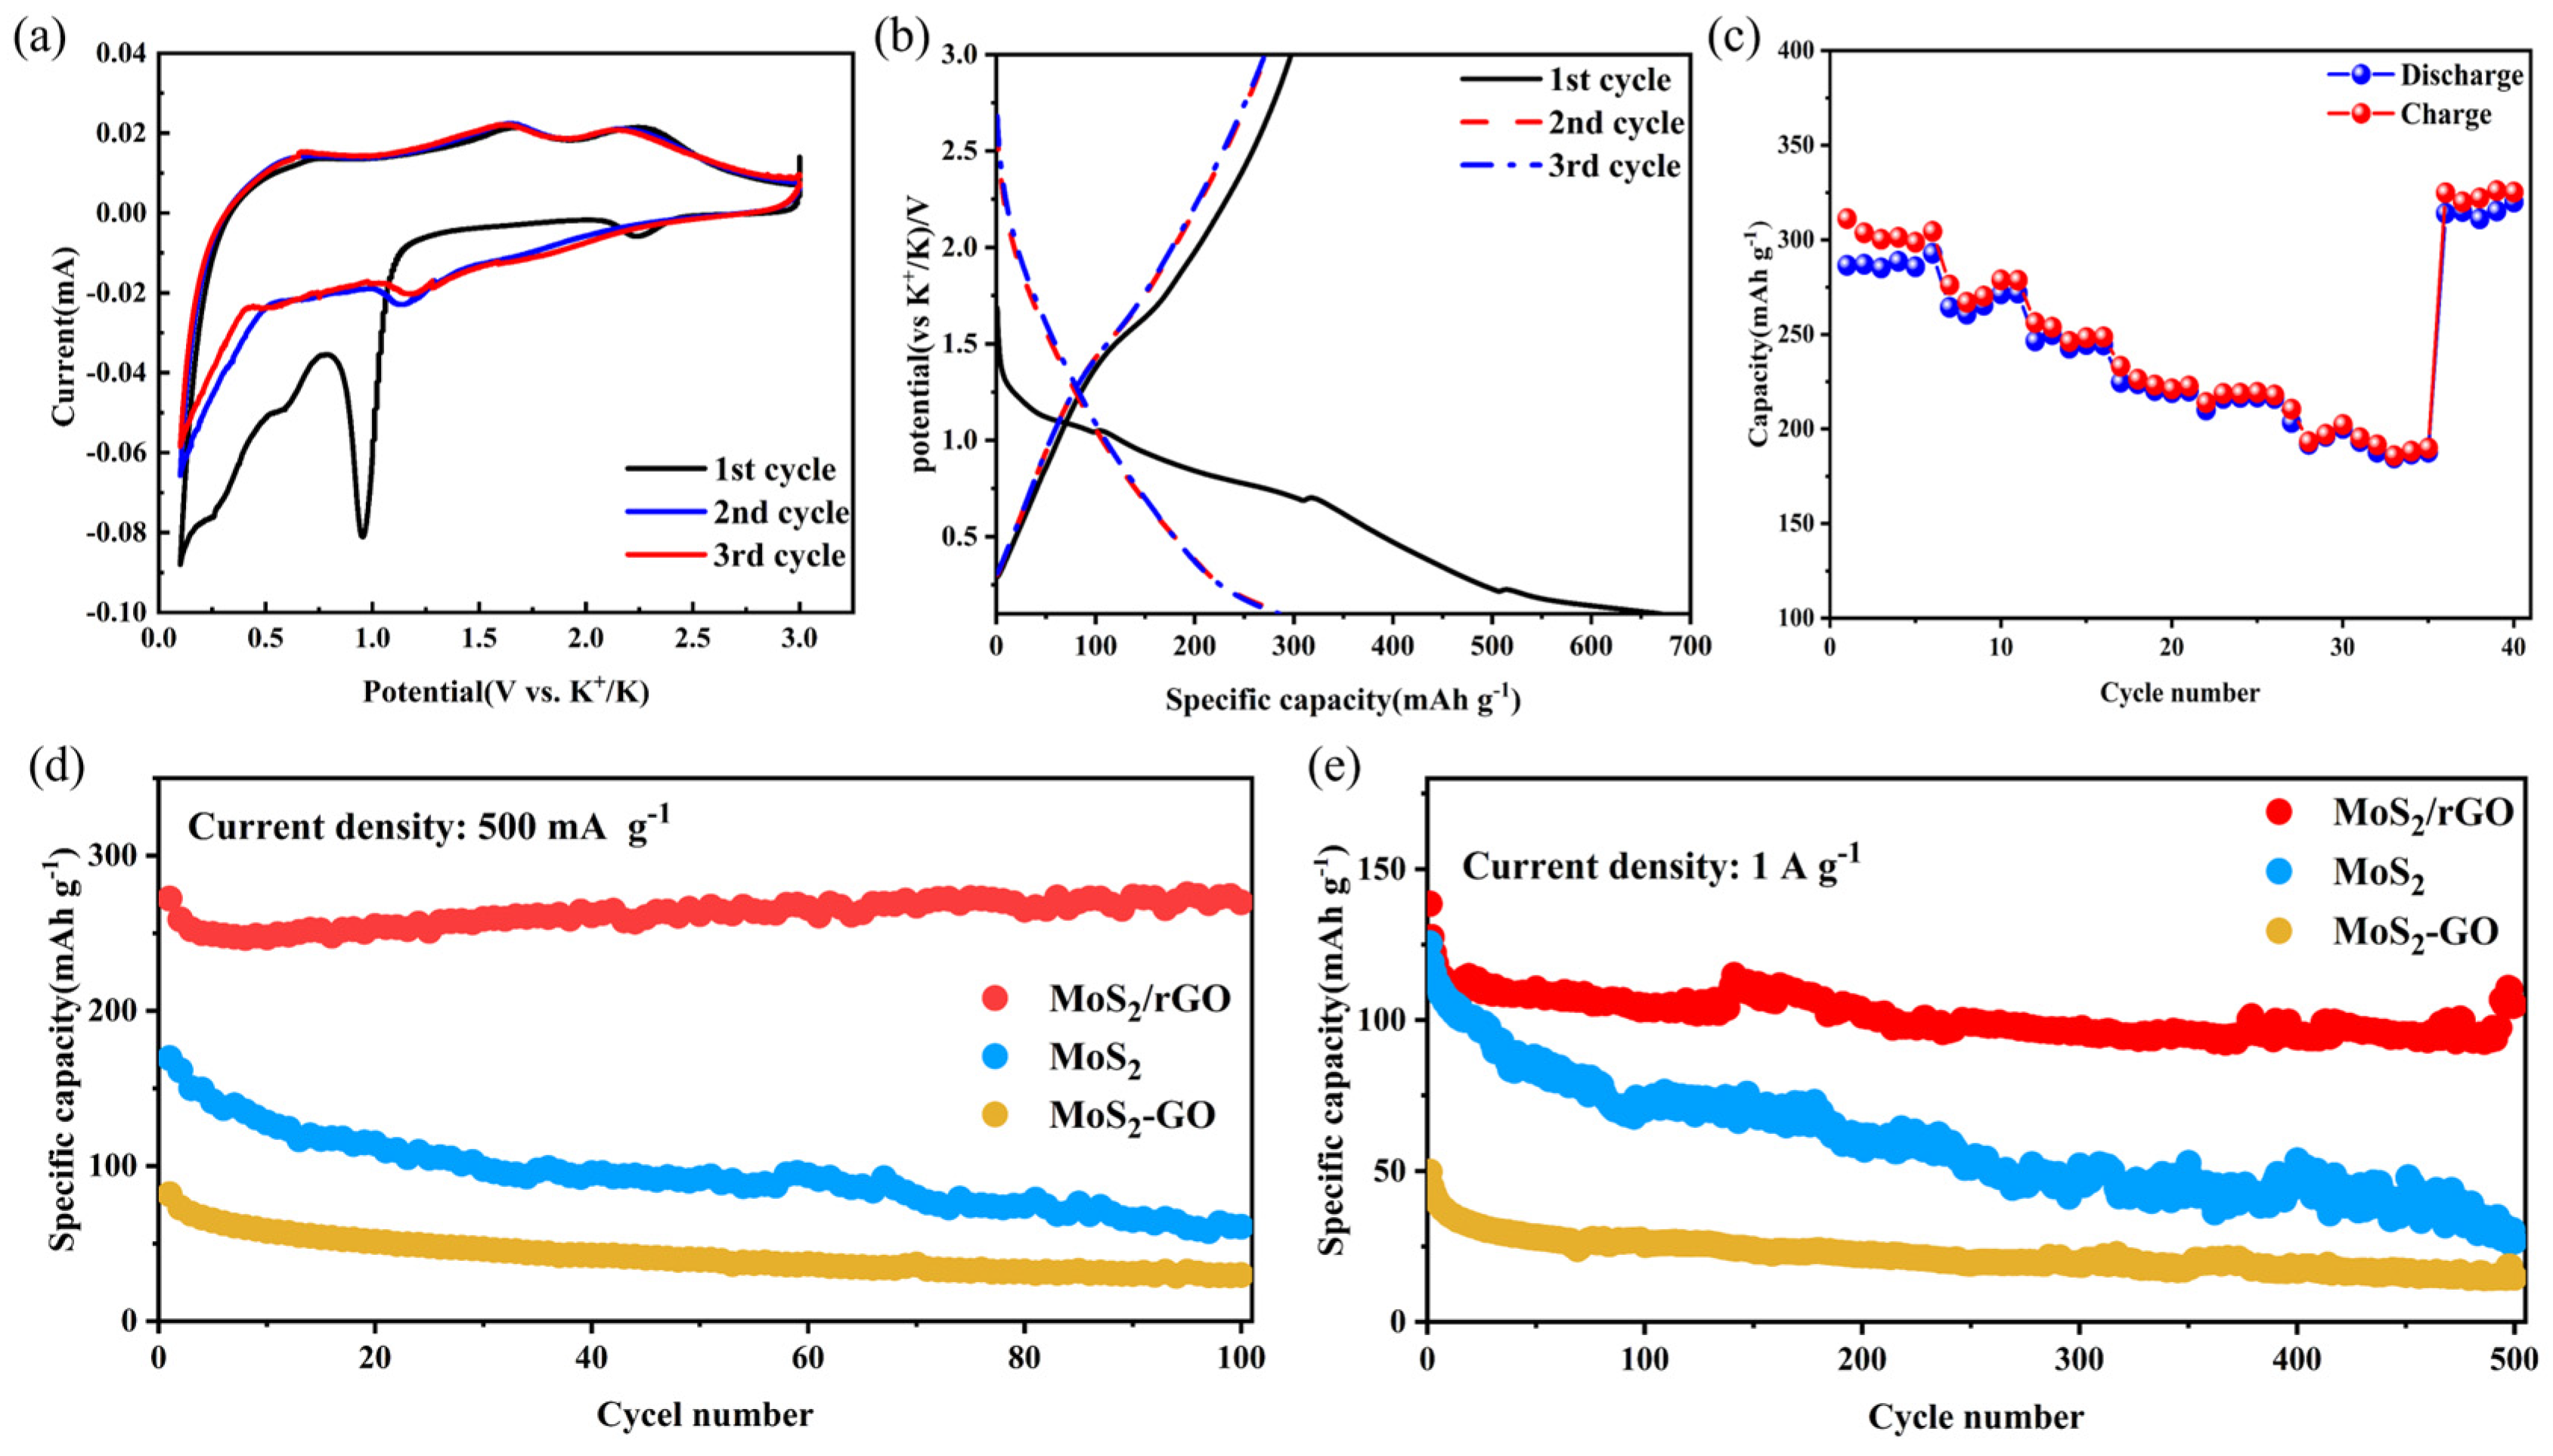
| This work | 272.49 mAh g−1 (500 mA g−1) | 269.5 mAh g−1 (100 cycles) |
Disclaimer/Publisher’s Note: The statements, opinions and data contained in all publications are solely those of the individual author(s) and contributor(s) and not of MDPI and/or the editor(s). MDPI and/or the editor(s) disclaim responsibility for any injury to people or property resulting from any ideas, methods, instructions or products referred to in the content. |
© 2024 by the authors. Licensee MDPI, Basel, Switzerland. This article is an open access article distributed under the terms and conditions of the Creative Commons Attribution (CC BY) license (https://creativecommons.org/licenses/by/4.0/).
Share and Cite
Wang, B.; Deng, T.; Liu, J.; Sun, B.; Su, Y.; Ti, R.; Shangguan, L.; Zhang, C.; Tang, Y.; Cheng, N.; et al. Scaly MoS2/rGO Composite as an Anode Material for High-Performance Potassium-Ion Battery. Molecules 2024, 29, 2977. https://doi.org/10.3390/molecules29132977
Wang B, Deng T, Liu J, Sun B, Su Y, Ti R, Shangguan L, Zhang C, Tang Y, Cheng N, et al. Scaly MoS2/rGO Composite as an Anode Material for High-Performance Potassium-Ion Battery. Molecules. 2024; 29(13):2977. https://doi.org/10.3390/molecules29132977
Chicago/Turabian StyleWang, Bin, Tao Deng, Jingjing Liu, Beibei Sun, Yun Su, Ruixia Ti, Lihua Shangguan, Chaoyang Zhang, Yu Tang, Na Cheng, and et al. 2024. "Scaly MoS2/rGO Composite as an Anode Material for High-Performance Potassium-Ion Battery" Molecules 29, no. 13: 2977. https://doi.org/10.3390/molecules29132977
APA StyleWang, B., Deng, T., Liu, J., Sun, B., Su, Y., Ti, R., Shangguan, L., Zhang, C., Tang, Y., Cheng, N., Xu, Y., & Guo, J. (2024). Scaly MoS2/rGO Composite as an Anode Material for High-Performance Potassium-Ion Battery. Molecules, 29(13), 2977. https://doi.org/10.3390/molecules29132977