Article

Atomistic Modeling of Quaternized Chitosan Head Groups: Insights into Chemical Stability and Ion Transport for Anion Exchange Membrane Applications

by
Mirat Karibayev
1,
Bauyrzhan Myrzakhmetov
2,
Dias Bekeshov
1,
Yanwei Wang
1,2,* and
Almagul Mentbayeva
1,*
1
Department of Chemical & Materials Engineering, School of Engineering and Digital Sciences, Nazarbayev University, Astana 010000, Kazakhstan
2
Center for Energy and Advanced Materials Science, National Laboratory Astana, Nazarbayev University, Astana 010000, Kazakhstan
*
Authors to whom correspondence should be addressed.
Molecules 2024, 29(13), 3175; https://doi.org/10.3390/molecules29133175
Submission received: 12 May 2024 / Revised: 19 June 2024 / Accepted: 20 June 2024 / Published: 3 July 2024
(This article belongs to the Special Issue Advances in the Theoretical and Computational Chemistry)

Abstract

:
The chemical stability and ion transport properties of quaternized chitosan (QCS)-based anion exchange membranes (AEMs) were explored using Density Functional Theory (DFT) calculations and all-atom molecular dynamics (MD) simulations. DFT calculations of LUMO energies, reaction energies, and activation energies revealed an increasing stability trend among the head groups: propyl trimethyl ammonium chitosan (C) < oxy propyl trimethyl ammonium chitosan (B) < 2-hydroxy propyl trimethyl ammonium chitosan (A) at hydration levels (HLs) of 0 and 3. Subsequently, all-atom MD simulations evaluated the diffusion of hydroxide ions ( OH ) through mean square displacement (MSD) versus time curves. The diffusion coefficients of OH ions for the three types of QCS (A, B, and C) were observed to increase monotonically with HLs ranging from 3 to 15 and temperatures from 298 K to 350 K. Across different HLs and temperatures, the three QCS variants exhibited comparable diffusion coefficients, underlining their effectiveness in vehicular transport of OH ions.

1. Introduction

Anion exchange membrane fuel cells (AEMFCs) have gained prominence because of their potential for high efficiency and cost-effectiveness in energy conversion [1,2,3,4]. These systems utilize solid polymeric electrolytes and operate at lower temperatures compared to other types of fuel cells. Among various materials explored for AEMFCs, polysaccharide-based biopolymers, particularly chitosan, have attracted significant attention. Chitosan, a natural biopolymer derived from chitin, is abundant and environmentally benign, offering an attractive alternative to traditional petroleum-derived polymers [5].
The inherent structural properties of chitosan, including its film-forming ability and mechanical strength, render it an exceptional candidate for the development of anion exchange membranes (AEMs). Furthermore, enhancing the ionic conductivity of chitosan through quaternization makes it particularly suitable for high-performance AEMFCs [6,7,8,9]. Despite these advantages, the detailed molecular mechanisms involved in the transport of ions and the chemical stability of quaternized chitosan (QCS) under operational conditions remain underexplored. This is particularly crucial at lower hydration levels (HLs), where ionic transport and membrane stability are challenging [10,11].
In this context, our study employs Density Functional Theory (DFT) and classical all-atom molecular dynamics (MD) simulations to explore the chemical stability and ion transport properties of QCS-based AEMs. We focus on the interaction dynamics of hydroxide ions ( OH ) within the polymer matrix and investigate the influence of different levels of hydration and temperatures on the performance of QCS-based AEMs. Through computational modeling, this study aims to provide a deeper understanding of the physicochemical interactions at play, which are crucial to optimizing the design of AEMs for sustainable energy applications.
Our approach includes an analysis of the lowest unoccupied molecular orbital (LUMO) energies, reaction energies ( Δ E reaction ), and activation energies ( Δ E activation ), alongside evaluations of diffusion coefficients using mean square displacement (MSD) vs. time curves. This comprehensive investigation elucidates the fundamental mechanisms that underpin the transport and stability characteristics of quaternized chitosan in AEM applications, contributing to the field of renewable energy technologies.

2. Results and Discussion

2.1. DFT Results

DFT-based quantum chemical calculations provide valuable insights into the chemical stability and quantum chemical features of various QCS derivatives. This section focuses on Δ E reaction and Δ E activation for the S N 2 degradation processes, as well as on the distribution and energies of LUMO.

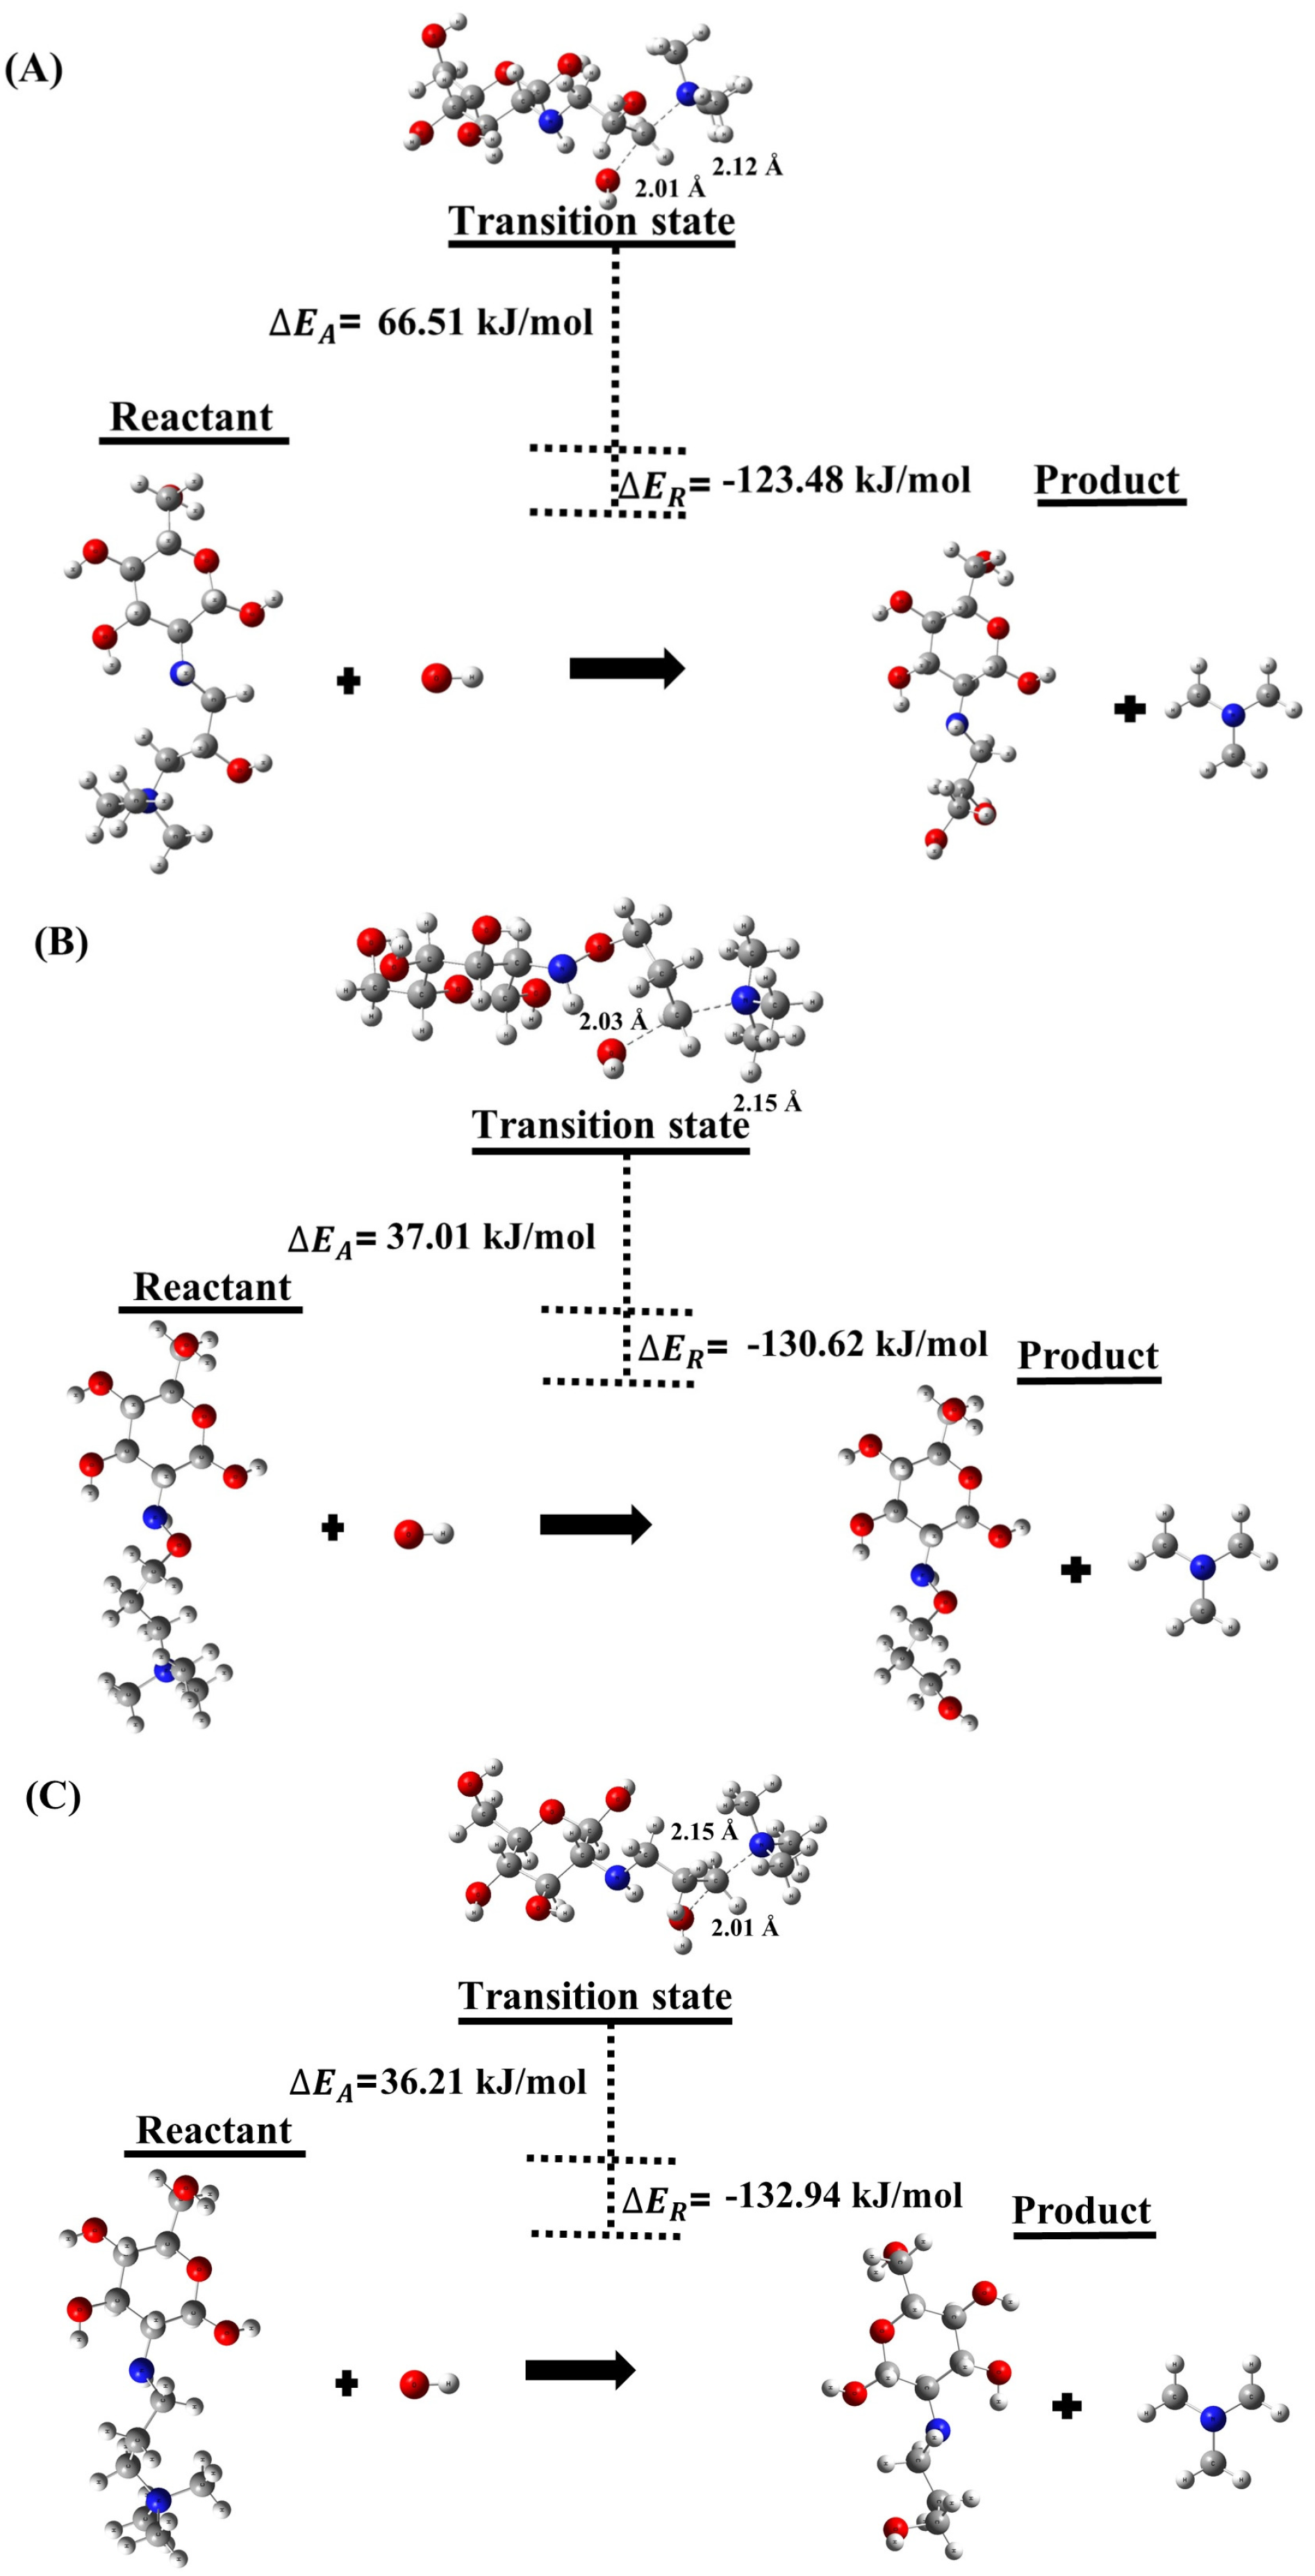
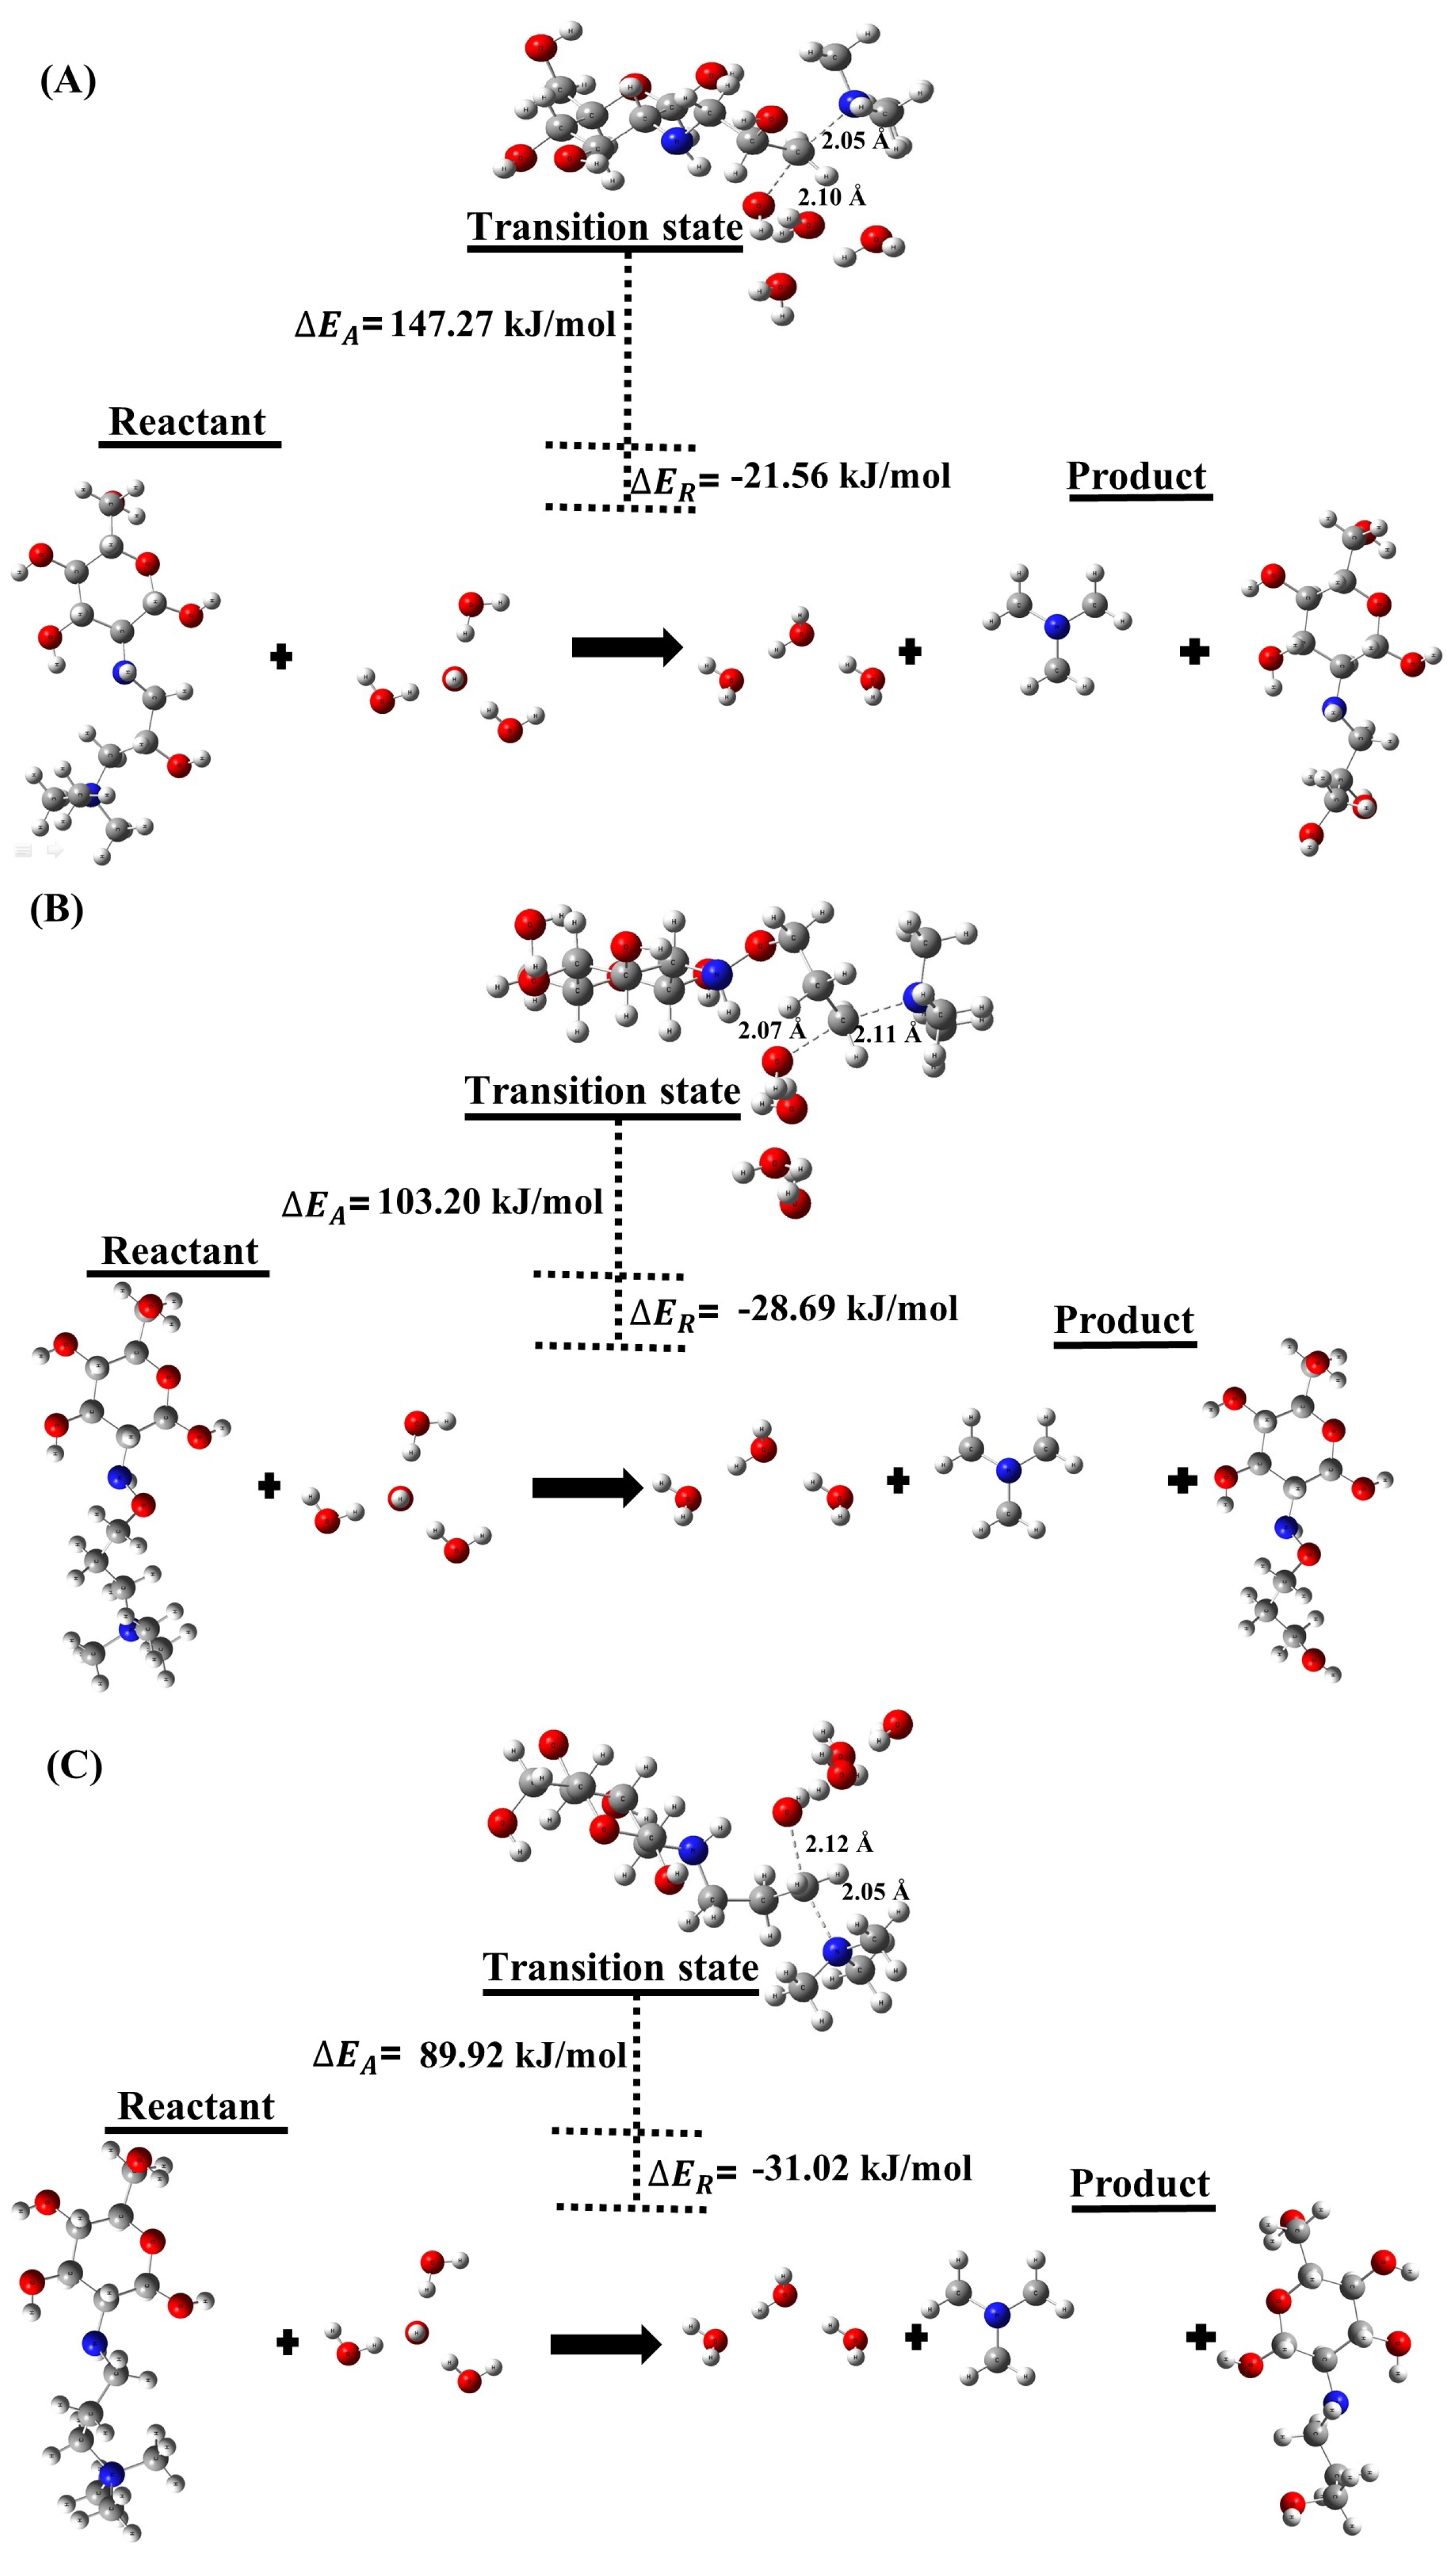
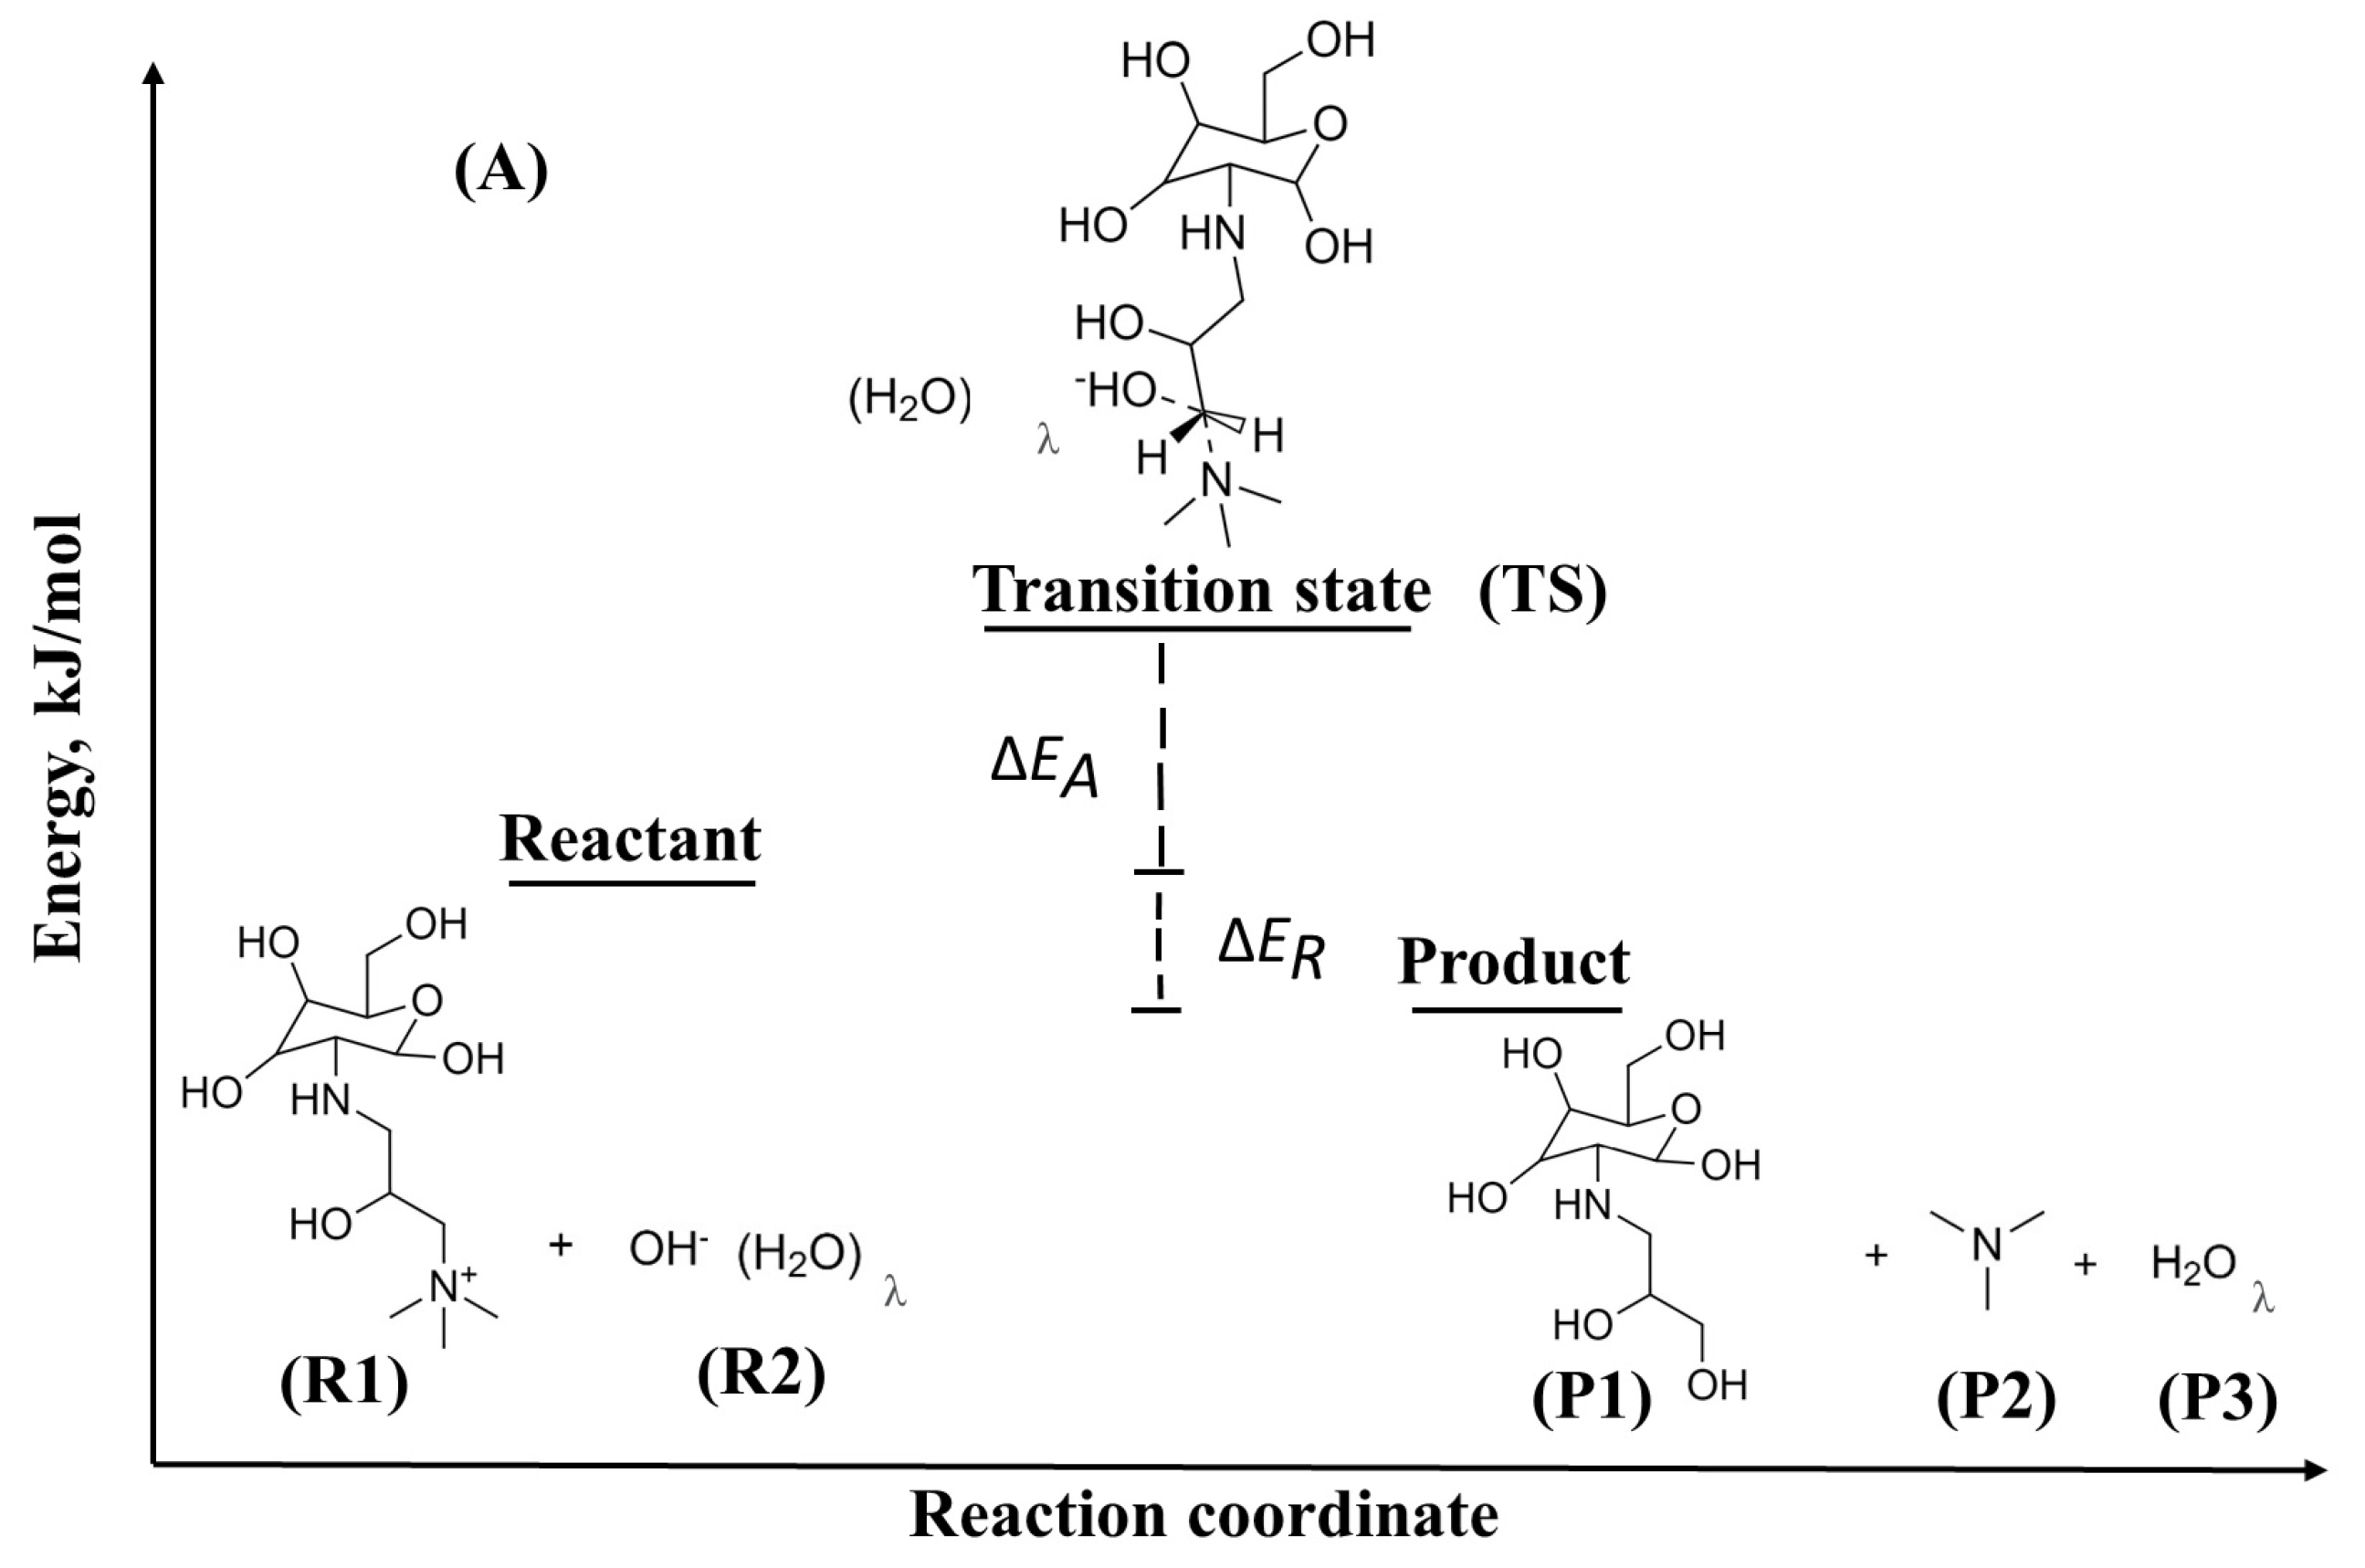
2.1.1. Degradation Reactions

The operating environment of AEMFCs can lead to dry conditions at the cathode electrode due to the increased current density, resulting in a lower water content and enhanced OH ion formation. This condition facilitates the nucleophilic attack of OH ions on the QA head groups of QCS via S N 2 degradation processes, particularly in high pH conditions [12,13]. At high pH, OH ions become more nucleophilic, and this enhanced nucleophilicity can lead to the degradation of QA head groups in AEM. [12,13]. The B3LYP DFT method was used to further assess the chemical degradation reaction between the OH ion and QCS, as well as to calculate the Δ E reaction , Δ E activation , and transition state for different QCS. Here, OH ions have the potential to target the methylene carbon atoms of QCS, which could lead to chemical degradation via the S N 2 degradation process.
Table 1 and Table 2 as well as Figure 1 and Figure 2 present our results of Δ E reaction , transition state, and Δ E activation for the degradation S N 2 of the different QCS in alkaline media in the HL of 0 and 3. The S N 2 degradation mechanism involves the attack of a nucleophile, such as OH ion, on the QCS, leading to bond cleavage and degradation of the AEM. Our overall DFT transition state calculations reveal that the Δ E reaction for S N 2 degradation of the QCS is 123.48 kJ / mol (HL 0), and 21.56 kJ / mol (HL 3) for (A), 130.62 kJ / mol (HL 0) and 28.69 kJ / mol (HL 3) for (B), and, 132.94 kJ / mol (HL 0) and 31.02 kJ / mol (HL 3) for (C) as shown in Figure 1 and Figure 2. The results have significant implications for the stability and durability of AEMs. In particular, our DFT calculations indicate that the overall reaction associated with QCS (A) exhibits a less exothermic Δ E reaction compared to the values observed for QCS (B) and QCS (C). This suggests that AEMs containing QCS (B) and QCS (C) are more prone to degradation when exposed to nucleophiles, such as OH ions, in contrast to AEMs incorporating QCS (A).
Figure 1 and Figure 2 also show the Δ E activation for OH ion attack on the QCS is 66.51 kJ/mol (HL 0) and 147.27 kJ/mol (HL 3) for (A), 37.01 kJ/mol (HL 0) and 103.20 kJ/mol (HL 3) for (B), and 36.21 kJ/mol (HL 0) and 89.92 kJ/mol (HL 3) for (C). It reveals that QCS (B) and (C) of the AEM degrade much faster compared to QCS (A), according to this statement. The higher Δ E activation for QCS (A) shows that the quaternized head group of chitosan is more resistant to OH ion attack and therefore more stable compared to QCS (B) and QCS (C). The lower Δ E activation values for QCS (B) and (C) reveal that the quaternized head group of chitosan is less stable and can degrade more easily under the attack of OH ions. A closer examination from a chemical structural perspective reveals that QCS (A) possesses an alkoxy group surrounding a carbon atom, which is susceptible to attack by OH ions through S N 2 . Interestingly, the presence of this protecting group in QCS (A) hinders OH ion attachment, an effect not observed in QCS (B) and QCS (C). This hindrance contributes to an increased activation barrier, suggesting improved chemical stability. These insights demonstrate the importance of protective groups in improving the stability of QCS, shedding light on potential strategies for the development of more stable and durable AEMs.
In prior experimental studies, it was observed that the synthesis of QCS was achieved by the use of glycidyltrimethylammonium chloride precursors, resulting in the production of two isomeric forms of QCS, namely QCS (A) and QCS (B). In particular, QCS (A) [8,14,15] has been extensively investigated in the field of anion exchange membrane (AEM) applications compared to the study of QCS (B) and QCS (C) [16]. In our previous work, the degradation mechanism of two different QA head groups was studied by Δ E reaction and Δ E activation from HL 0 to 3 using DFT calculations [17]. The chemical stability of trimethylhexylammonium was higher than that of benzyltrimethylammonium because Δ E activation of benzyltrimethylammonium was lower than Δ E activation of trimethylhexylammonium, while Δ E reaction for benzyltrimethylammonium and trimethylhexylammonium was similar in the different HLs [17]. Further comparison of our previous work with current work states that the chemical stability of QCS is higher in comparison with benzyltrimethylammonium, and trimethylhexylammonium from our previous work. By optimizing the chemical structure of the QCS, it may be possible to develop AEMs that are more resistant to nucleophilic attack and have better long-term stability and durability.

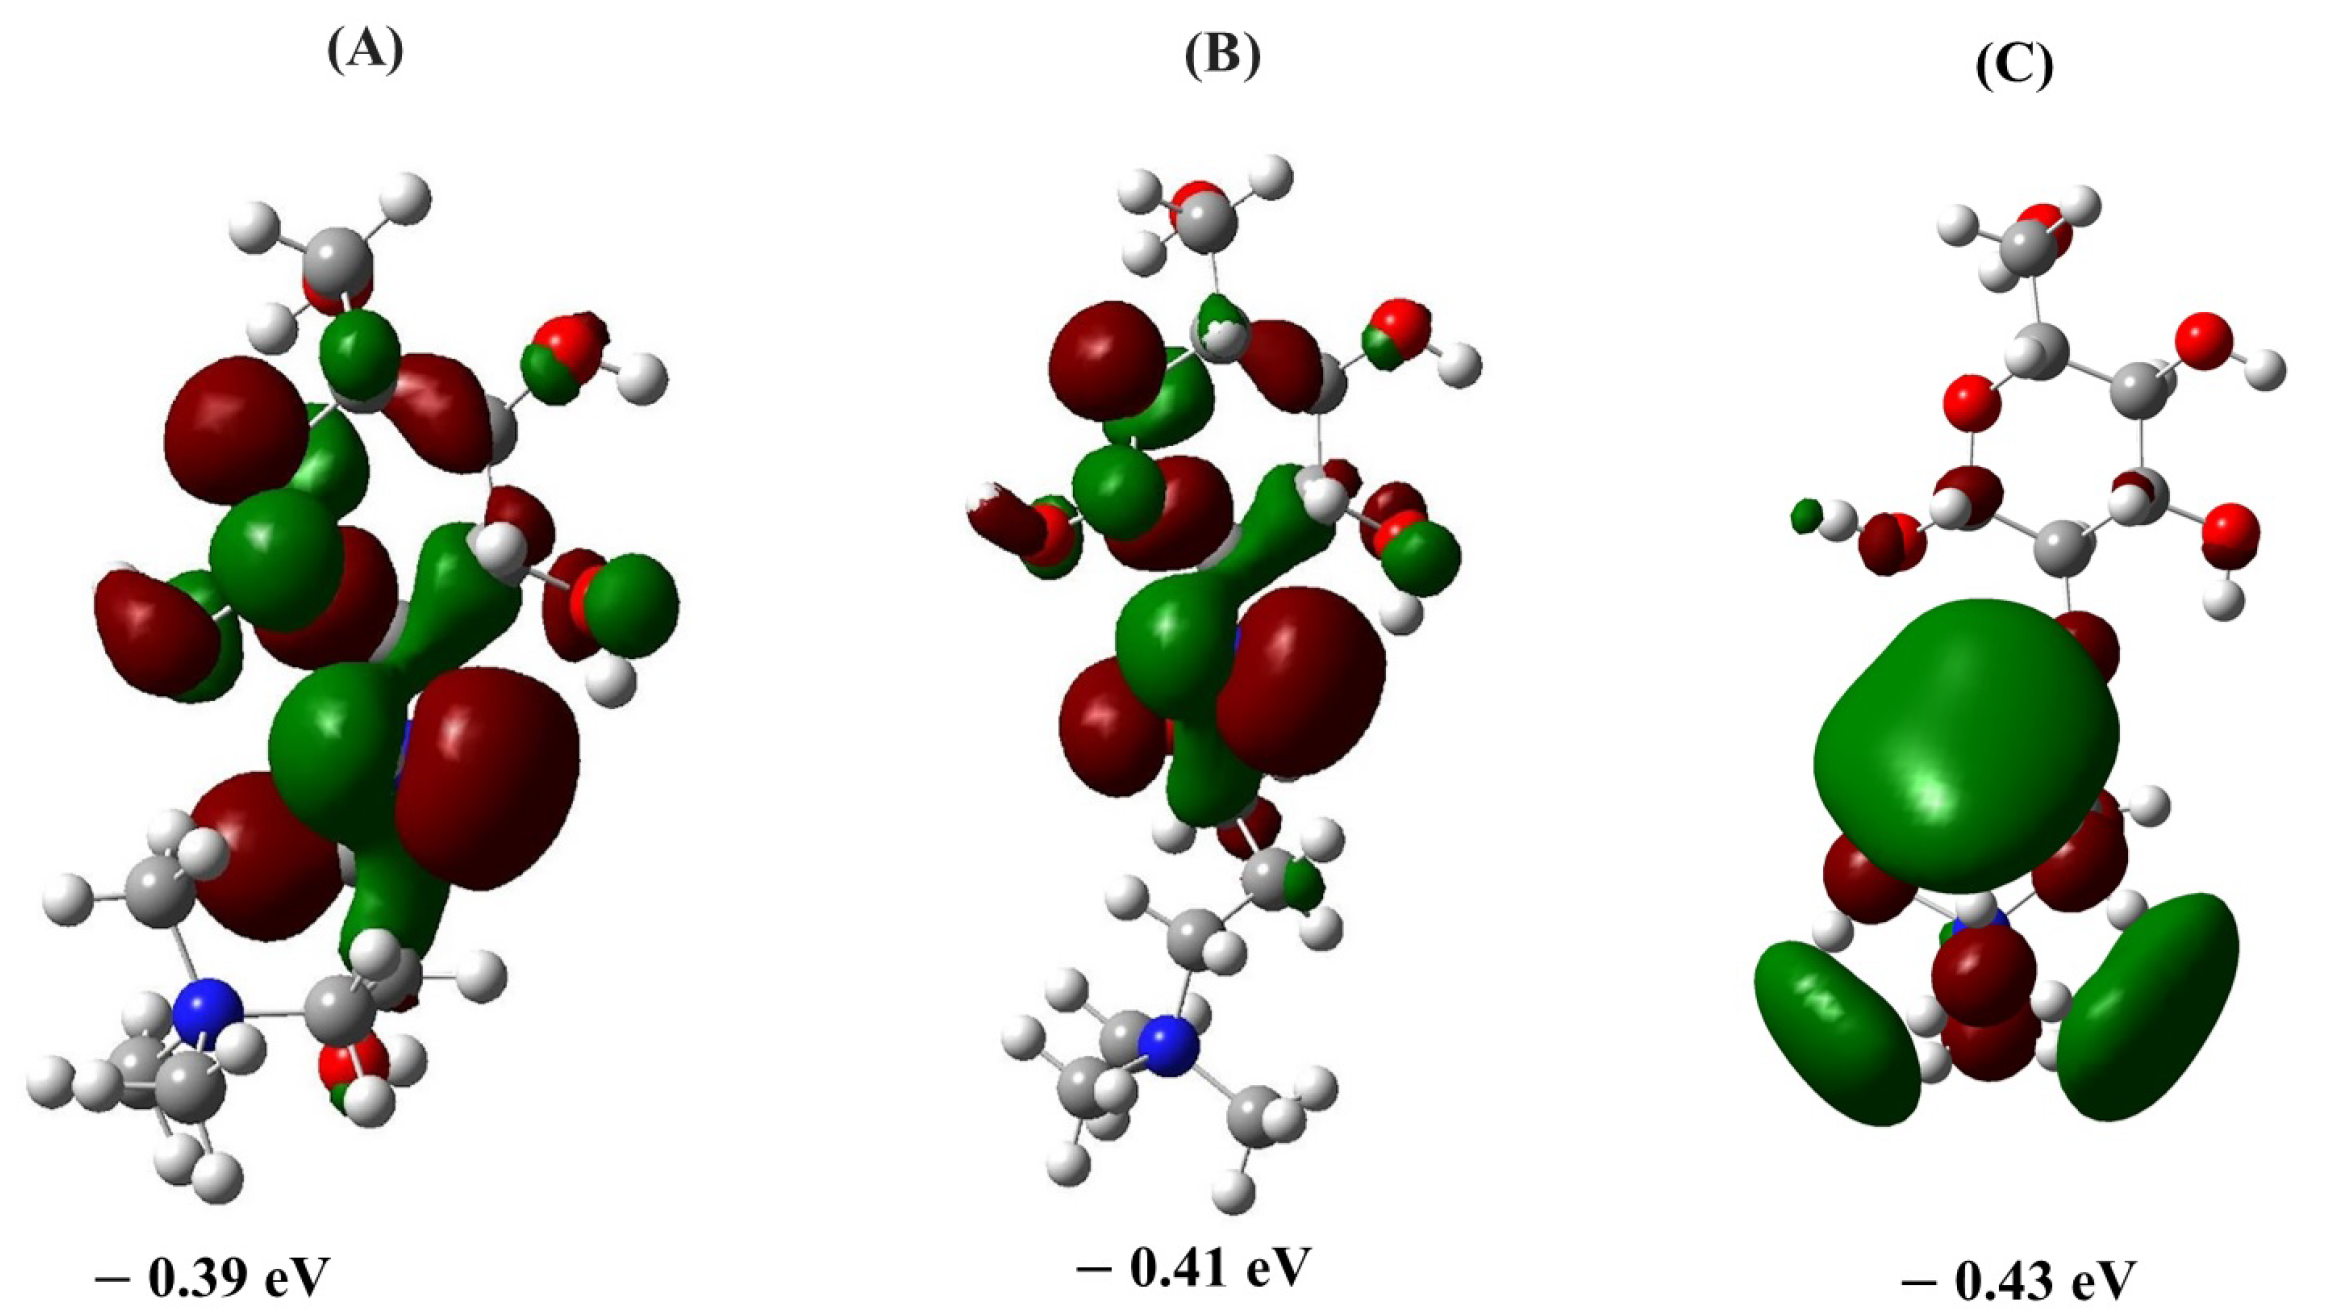
2.1.2. LUMO Distribution and Energies

The LUMO energies play a pivotal role in understanding the reactivity and stability of QCS variants. In our analysis, the ascending order of the LUMO energies correlates directly with the chemical stability observed in the transition state calculations of Δ E reaction and Δ E activation . A higher LUMO energy (less negative) generally indicates that it is more difficult for the molecule to accept electrons. In the context of nucleophilic attacks, such as those involving OH ions in this study, a higher LUMO energy means that the molecule is less prone to react with nucleophiles. This is because nucleophiles donate electrons, and a higher LUMO energy implies a lower propensity to accept these electrons.
Figure 3 illustrates these LUMO energies, confirming the stability order from QCS (C) to QCS (A). Specifically, QCS (A), which shows the highest LUMO energy among the variants, exhibits the greatest chemical resistance, as demonstrated by its higher Δ E activation and less exothermic Δ E reaction (see Table 1 and Table 2). Furthermore, QCS (A) displays not only a higher LUMO energy but also a more distributed LUMO within the chitosan moiety, enhancing its protective effect against nucleophilic attacks. This observation is consistent with our previous studies [17], which have established a similar correlation between LUMO energies and chemical stability in different QA head groups, thus strengthening the reliability of using LUMO energy as a predictive tool to evaluate the alkaline stability of QCS in AEM applications [17]. The comparative analysis with previous findings further underscores the value of using LUMO energies as an efficient and less computationally demanding method to gauge the long-term durability and stability of AEM materials.

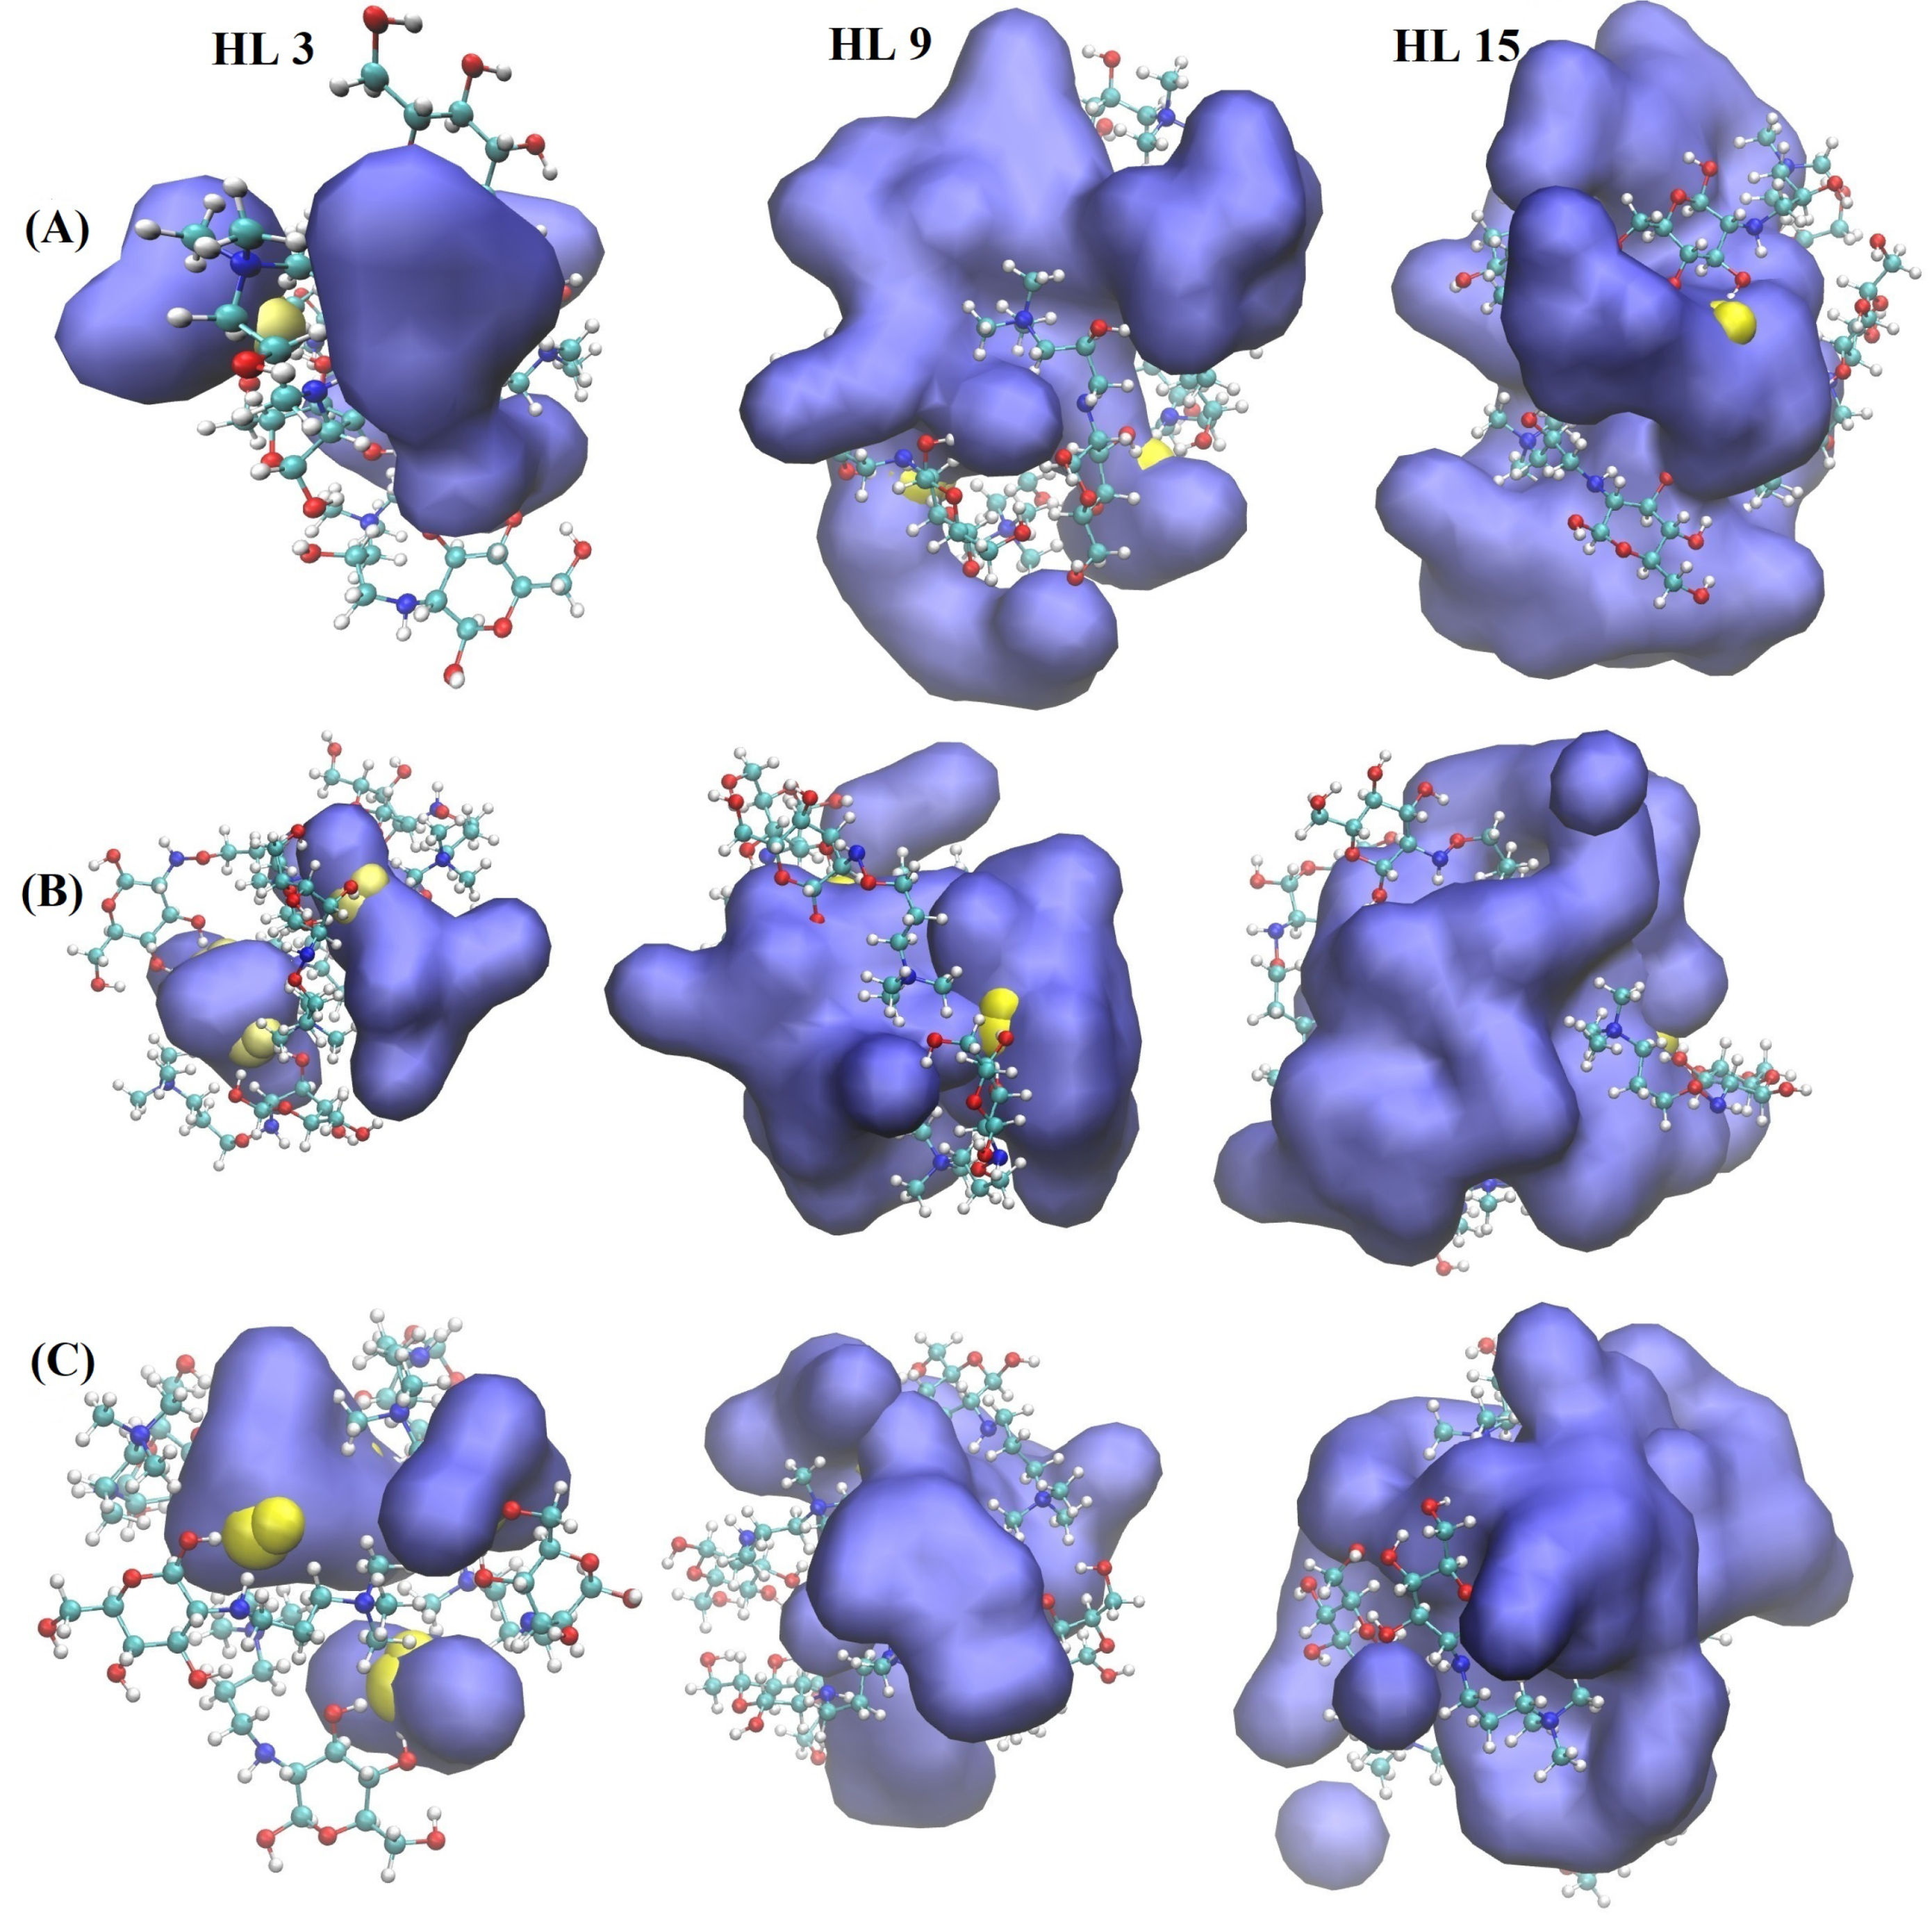
2.2. Classical All-Atom MD Results

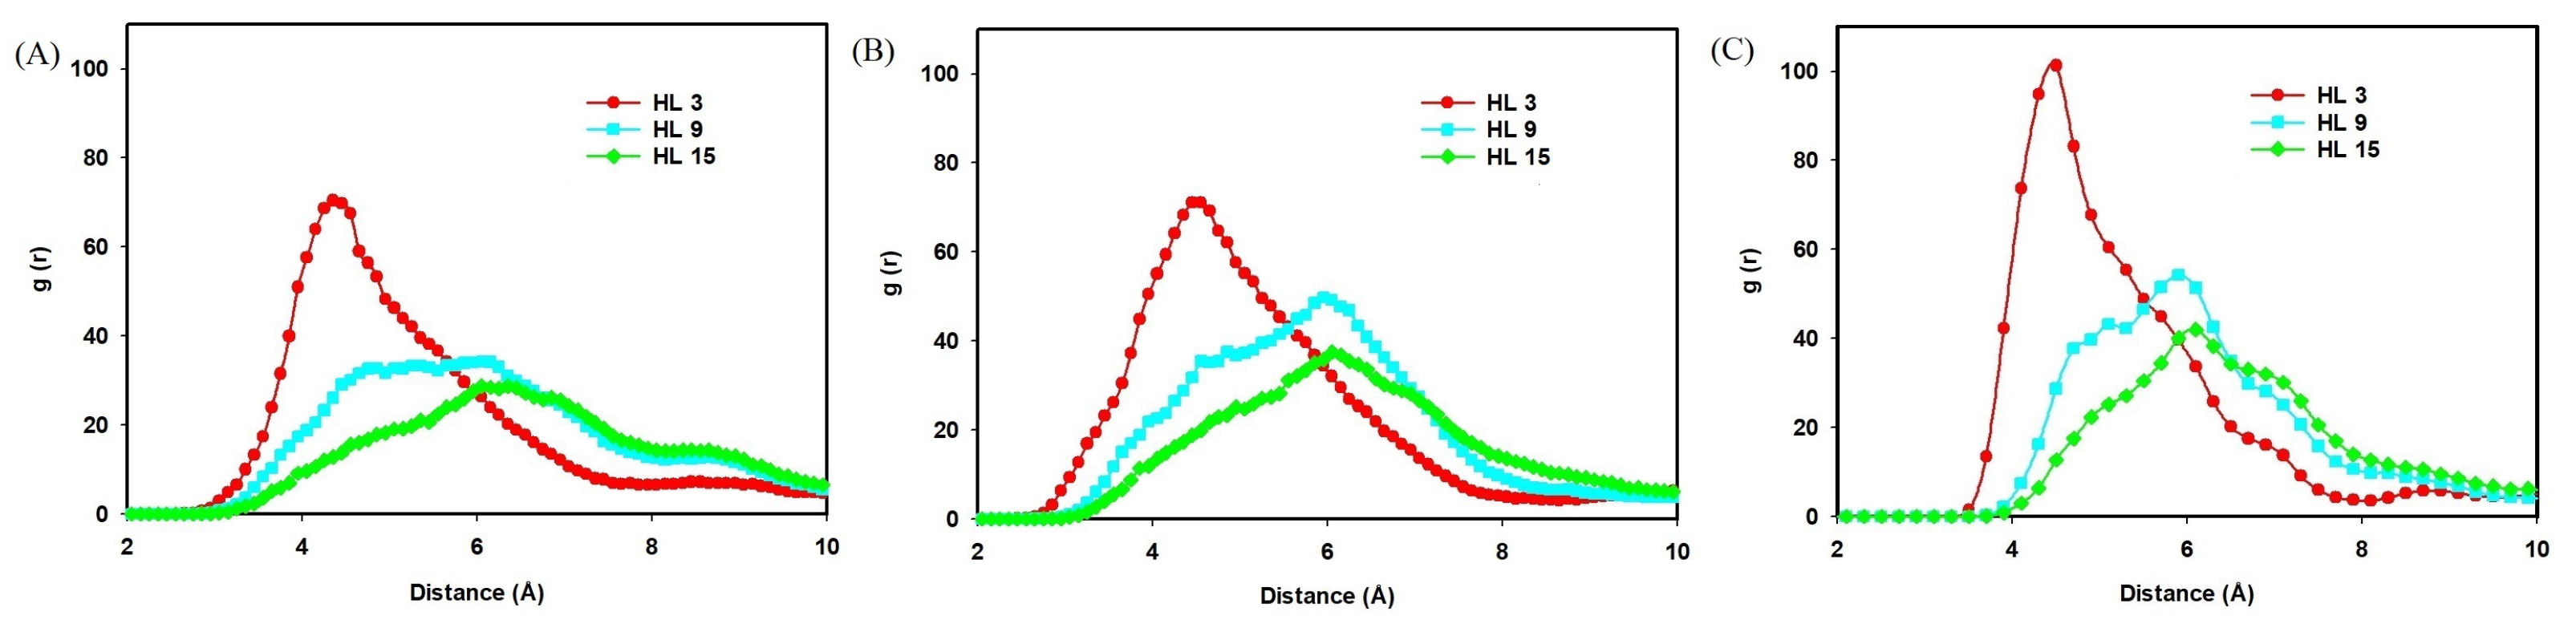
2.2.1. Effect of Hydration Level

The correlation between the nitrogen atom of QCS and the OH ion was investigated by computing the radial distribution functions from classical all-atom MD simulations. The RDF profiles (Figure 4) describe the likelihood of finding the oxygen atom of the OH ion at various distances from the nitrogen atoms of QCS. As shown in Figure 4, the peak values of the RDFs indicate the spatial relationship between the OH ions and QCS at different hydration levels. At HL 3, the highest peak of 70.4 at 4.4 Åcorresponds to a close approach between the oxygen of OH and the nitrogen of QCS (A). As the hydration level increases to HL 9 and 15, the peak values decrease to 34.3 at 5.4 Åand 28.7 at 6.2 Å, respectively, indicating a reduction in interaction strength. This trend suggests that increased hydration leads to an expected dilution effect, which reduces the strength of close interactions between OH ions and QCS.
To investigate the influence of hydration levels on ion mobility, the mean square displacement was analyzed for OH ions and water molecules in different HLs, as shown in Figure 5. The slopes of the linear region of the resulting MSD vs. time curves were used to calculate the diffusion coefficients, which are tabulated in Table 3 and Table 4. Our results of the diffusion coefficients of OH ions align closely with those reported in previous studies [18,19]. The diffusion coefficients of OH ions and water molecules show a clear increase as the hydration level rises from 3 to 15. For instance, in the presence of QCS (A), the diffusion coefficient of OH ions escalates from 0.011 to 0.027   nm 2 / ns , while that of water molecules jumps from 0.20 to 0.46   nm 2 / ns . Similar trends are observed for QCS (B) and QCS (C), underscoring a consistent increase in mobility with a higher water content.
Representative snapshots of molecular configurations around QCS groups are presented in Figure 6, which shows the structural configuration of QCS (in the CPK representation), OH ions (in the VdW representation), and water molecules (in the Quick Surface representation). The results show that water molecules form a bicontinuous network [20,21,22,23] at high HLs. This visualization helps to understand the microstructural dynamics that contributes to the diffusion behavior observed in Figure 5.
In summary, increasing the level of hydration not only enhances the mobility of OH ions, but also weakens their interactions with QCS, thus facilitating more efficient ion transport across the membrane. This relationship between elevated hydration levels and improved diffusion highlights the pivotal role of water in promoting OH ion mobility within AEMs. At higher hydration levels, water molecules reduce the interaction strength between the OH ions and the nitrogen atoms of QCS, as demonstrated by the RDF analysis, and form a bicontinuous network, as demonstrated by the simulation snapshots. These observations underscore the critical importance of hydration in optimizing the performance of QCS-based AEMs.

2.2.2. Effect of Temperature

The effect of temperature on the interaction between OH ions and QCS head groups was studied using classical all-atom MD simulations at temperatures ranging from 298 K to 350 K. Figure 7 presents the RDF profiles, which quantify the likelihood of finding an oxygen atom of an ion OH at various distances from nitrogen atoms of different types of QCS (A, B, and C). As the temperature increases, noticeable changes are observed in the RDF peaks. For QCS (A), the peak at 298 K is the highest with a value of 104.7 at 4.4 Å, indicating tighter binding at lower temperatures. As the temperature rises to 330 K and 350 K, the peaks decrease to 94.8 at 4.5 Åand 64.7 at 4.4 Å, respectively, suggesting reduced interaction strength. Similar trends are observed for QCS (B) and QCS (C), with peak values decreasing as temperatures increase, as shown in Figure 7. This trend indicates that higher temperatures lead to a weakening of the interactions between OH ions and QCS, potentially affecting the dynamics of those species.
To elucidate the impact of temperature on ion mobility, the MSD was analyzed for OH ions and water molecules at different temperatures. Figure 8 displays the MSD for both components, and the slopes of these curves were used to calculate the diffusion coefficients, presented in Table 5 and Table 6. An increase in temperature from 298 K to 350 K results in higher diffusion coefficients for both OH ions and water molecules. Specifically, in the presence of QCS (A), the diffusion coefficient of OH ions increases from 0.011 to 0.027   nm 2 / ns , and for water molecules from 0.20 to 2.86   nm 2 / ns . Similar increases are observed for QCS (B) and QCS (C), suggesting that higher temperatures enhance the mobility of both OH ions and water molecules, as evidenced in Table 5 and Table 6.
This increase in mobility at higher temperatures may be attributed to a change in the dynamics of how molecules and ions interact with each other and with their environment at elevated temperatures. Higher temperatures typically reduce the viscosity of the medium, decrease intermolecular interactions between water molecules, and weaken interactions with QCS functional groups, thereby enhancing ion mobility.
The mobility of OH ions and water molecules is critical for the efficiency of alkaline fuel cells. Our findings demonstrate that higher temperatures facilitate faster diffusion of these molecules, which is essential for effective ion transport in AEMs. While this study focuses on vehicular transportation of ions, further research incorporating the Grotthuss mechanism, which involves proton hopping facilitated by interactions among water molecules, could provide deeper insights into ion transport dynamics in AEMs. Future investigations will explore these aspects using ab initio molecular dynamics [22,23] to better understand the contributions of different ion transport mechanisms under varying operational conditions.

3. Methodology

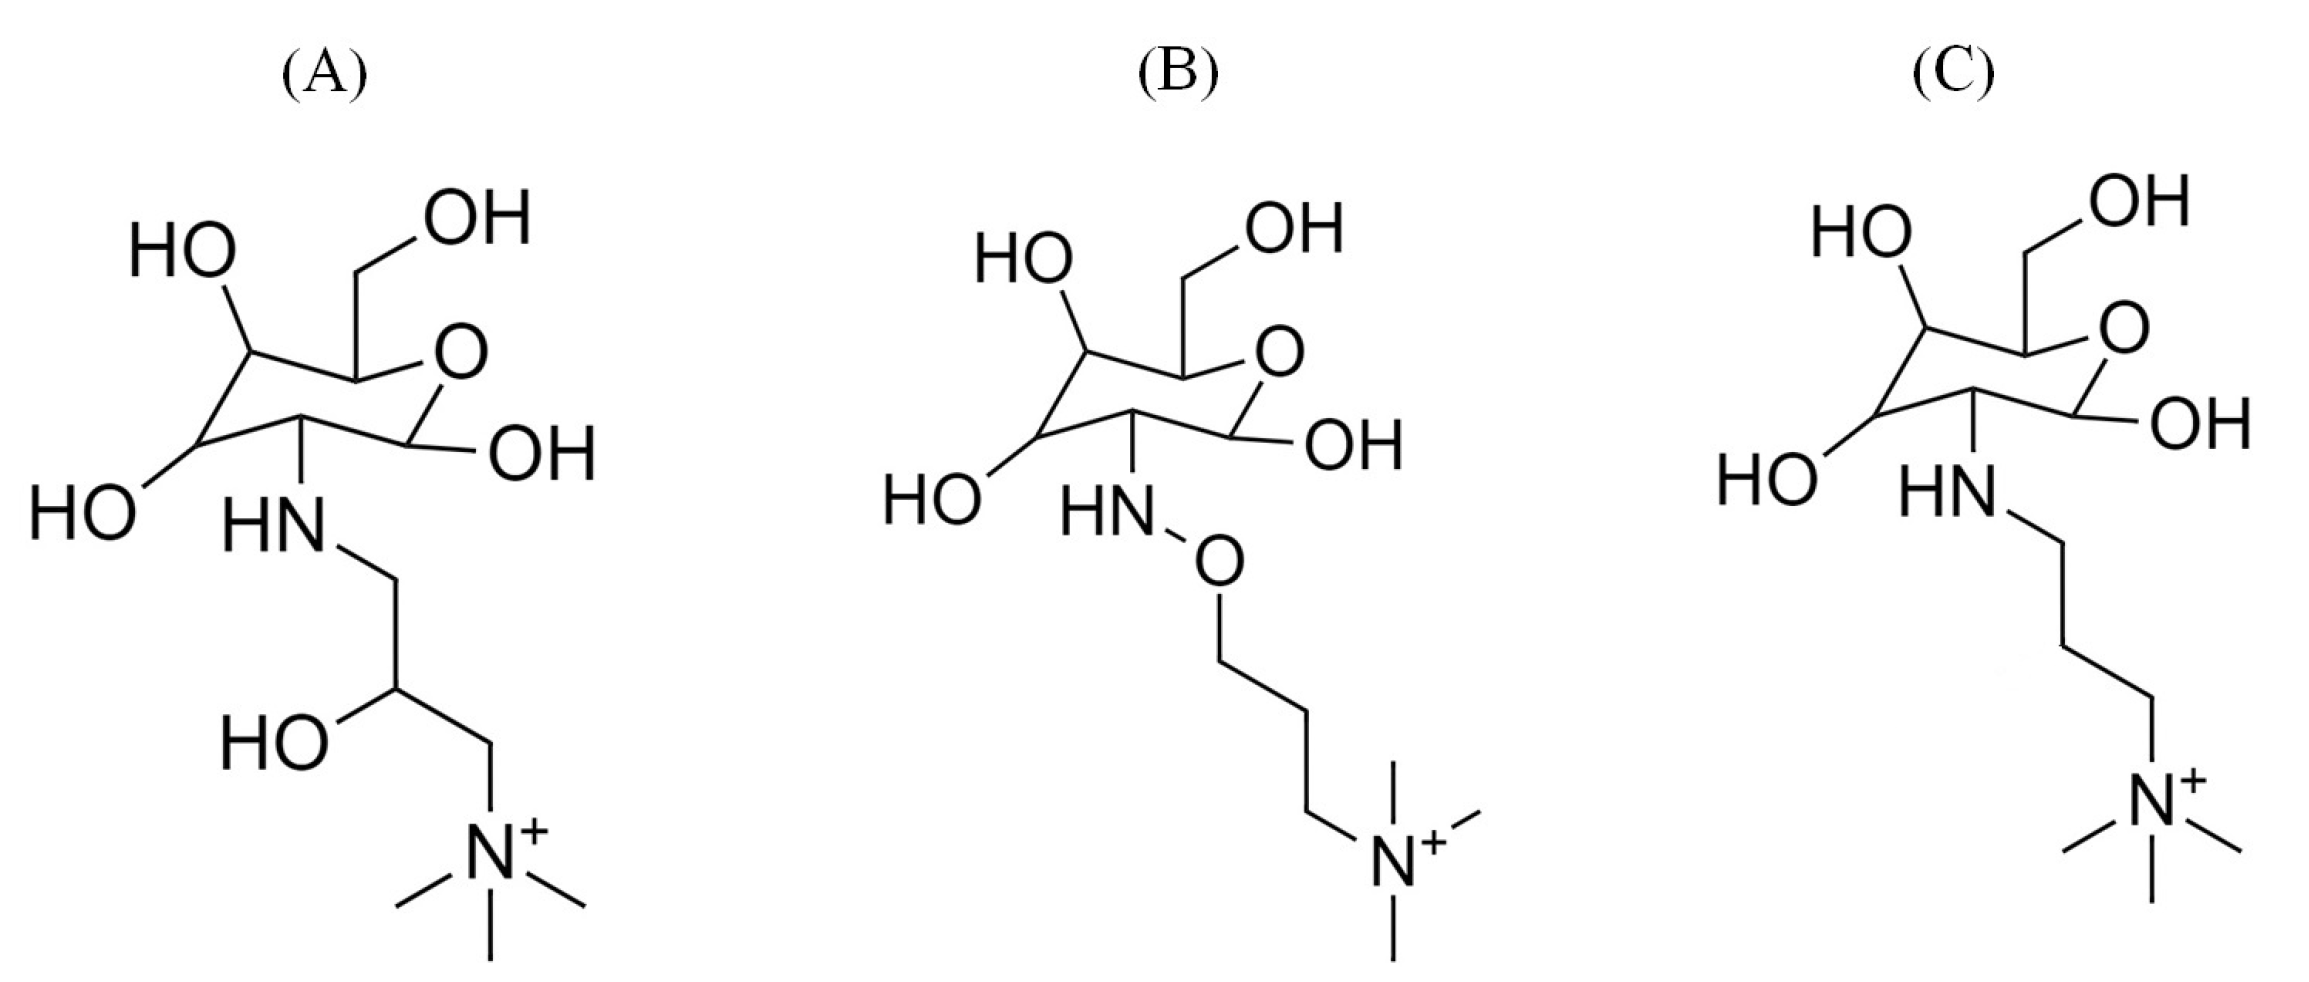
3.1. Computational Models

Computational models for our DFT-based quantum chemical calculations and classical all-atom MD simulations were constructed based on QCS monomeric structures, designated as A, B, and C, as illustrated in Figure 9. These models draw inspiration from recent experimental works that have explored the synthesis and properties of similar systems [14,24,25,26]. Additional details on the experimental basis for these models can be found in related publications [27,28].
In the DFT calculations, each model comprised a single QCS-based monomeric segment (A, B, or C) associated with one hydroxide ion ( OH ) in the presence of an implicit water environment. This setup was employed to investigate the chemical stability of the monomeric segments and the transport properties of OH ions within a simulated anion exchange membrane (AEM) environment. Subsequently, for the classical all-atom MD simulations, five monomeric segments of each type (A–C) were combined with five corresponding OH counterions. The hydration model included a range of 15 to 75 water molecules per OH ion, reflecting various levels of membrane hydration. The simulations were conducted over a temperature range from 298 K to 350 K, with detailed configurations and initial conditions provided in the Supplementary Materials.
In this study, simulations of monomeric units of QCS were employed to approximate the properties of full polymers, a common approach [12,13,29,30] in computational chemistry where the extensive computational demands of simulating entire polymer chains are a limiting factor. This focused approach targets the QA head groups, where chemical reactions are typically localized and critical to assessing the chemical stability and degradation mechanisms within AEMs. Although this method provides valuable insights into localized chemical behavior, it may not fully capture the broader dynamics of the entire polymer system. Future research will incorporate oligomer simulations to determine how well these localized findings extend to more complex polymer structures.

3.2. DFT Calculations

DFT calculations were employed to optimize electronic ground state geometries and to assess molecular electrostatic potential (MEP) maps, bond lengths, LUMO energies distribution, and binding energies ( Δ E binding ). Furthermore, these calculations facilitated the identification of transition states and the computation of reaction energies ( Δ E reaction ) and activation energies ( Δ E activation ). Noncovalent and covalent interactions were analyzed in the intermolecular contacts between the positively charged QCS and the OH ions in an aqueous phase. We utilized the B3LYP functional combined with the polarizable continuum model (PCM) to optimize the geometries of three QCS segments in both the presence and absence of OH ions [31,32].
To ascertain MEP, LUMO distribution, LUMO energies, and Δ E binding , B3LYP 6-311++G(2d,p) level DFT calculations were performed (see Supplementary Materials) [33,34]. Binding energies ( Δ E binding ) were determined by the change in total energy when the OH ions were combined with the QCS segments, as shown in Equation (1):
Δ E binding = E QCS OH ( E QCS + E OH )
For the transition states of the S N 2 degradation reactions (see Equation (2)) of QCS types A, B, and C in the presence of OH ions and explicit water molecules at a hydration level of 3, optimizations were performed using B3LYP 6-311++G(2d,p) in implicit DMSO.
R N + ( CH 3 ) 3 + OH ( H 2 O ) 3 R OH + N ( CH 3 ) 3 + 3 H 2 O
where the R group represents C 9 H 16 O 6 for QCS (A) and QCS (B), and C 9 H 16 O 5 for QCS (C).
As illustrated in Figure 10, Δ E reaction and Δ E activation for these reactions are given by
Δ E reaction = E products E reactants
Δ E activation = E transition state ( E reactants + E BSSE )
For these calculations, all systems were modeled in the implicit DMSO solvent with a dielectric constant of 46.83 . The calculations were further refined using a water cluster model in our PCM to enhance accuracy by minimizing discrepancies in solvation effects.
The low values of Δ E activation suggest that the QCS segments are more susceptible to degradation by OH ions. The correctness of all stationary points as absolute minima on their respective potential energy surfaces was confirmed by further calculations of the second derivatives of the energy. All DFT analyses and calculations were conducted using the GaussView (v6.0) software and GAUSSIAN16 suite [35].

3.3. Classical All-Atom MD Simulation

Classical all-atom MD simulations were performed to investigate the behavior of a monomeric unit of QCS and hydroxide ion ( OH ) in water, representative of the environments of the anion exchange membrane (AEM) as shown in Figure 9. Initial topology and force field parameters for the QCS segments were derived using SwissParam, configured for compatibility with the CHARMM36 force field [36,37]. For the simulation, QCS head groups were modeled using standard CHARMM36 parameters, while water molecules were represented using the TIP3P water model [38]. Parameters for the hydroxide ion were adapted from Han et al. [39], applying approaches consistent with those used in similar polymer systems by Zhang et al. [18].
The initial setup of the simulated systems consists of QCS, OH ions, and water molecules adjusted to hydration levels (HL) of 3, 9, and 15 and temperatures ranging from 298 to 350 K, detailed in the Supplementary Materials. The system’s charge neutrality was maintained by adjusting the number of OH ions, with the number of water molecules adjusted to the specified HL.
The simulation protocol began with an energy minimization using the steepest descent method, limiting the maximum force to 500 kJ/mol/nm, followed by 1 ns of NPT equilibration at each temperature setting (298, 330, and 350 K) and 1 bar pressure. Subsequent NVT equilibration at the same temperatures ensured system stability before running production MD simulations for 10 ns under the NVT ensemble.
The LINCS algorithm was employed to constrain all bonds. Short-range interactions were treated with a 1.0 nm cut-off for Lennard-Jones and Coulombic interactions, while long-range electrostatics were handled via the particle mesh Ewald summation method, utilizing a 0.14 nm grid spacing and fourth-order interpolation [40]. Temperature control was achieved with the Nose–Hoover thermostat [41] with a coupling constant of 0.2 ps. Pressure control was achieved using the Berendsen barostat [42] with isotropic pressure coupling and a coupling constant of 0.5 ps, and a reference pressure of 1 bar. Periodic boundary conditions were applied in all directions. These settings align with commonly used parameters in the field.
The simulation densities were calculated as 1.14 g/ cm 3 , 1.09 g/ cm 3 , and 1.07 g/ cm 3 for HLs of 3, 9, and 15, respectively, aligning closely with the experimental values reported in the literature [18].
The simulations were executed using GROMACS 2021.4 [43], with system visualization and analysis of radial distribution functions (RDFs), mean square displacement (MSD), and diffusion coefficients performed using visualization molecular dynamics (VMD) software [44].

4. Conclusions

This study conducted a computational analysis of the chemical stability and ion transport properties of several functional groups in QCS-based anion exchange membranes using a combination of DFT-based quantum chemical calculations and all-atom MD simulations. The DFT calculations were instrumental in elucidating the electronic structure, revealing an increasing trend in chemical stability among the QCS variants: propyl trimethyl ammonium chitosan (C) < oxy propyl trimethyl ammonium chitosan (B) < 2-hydroxy propyl trimethyl ammonium chitosan (A) at hydration levels (HL) of 0 and 3. This trend is supported by the calculated LUMO energies, reaction energies, and activation energies, which collectively highlight the superior stability of the 2-hydroxy propyl trimethyl ammonium chitosan (A) variant under varying hydration conditions.
Further exploration through all-atom MD simulations provided a dynamic view of the ion transport mechanisms across different hydration levels and temperatures. The diffusion coefficients of OH ions for all three QCS variants were observed to increase with hydration level and temperature, suggesting that higher hydration levels and temperatures enhance ion mobility across the membrane. The comparable diffusion coefficients across the three variants underscore their effectiveness in the vehicular transport of OH ions in AEM applications.
Comparing our results with other theoretical studies and experimental data in the literature, our previous work [17,45] utilizing DFT and classical MD methods highlighted the chemical stability and OH ion diffusion characteristics of various QA head groups. Compared to those head groups explored in our previous work, QCS-A demonstrated higher stability, in agreement with recent experimental studies [46,47] which also identified QCS-A as exhibiting higher LUMO energies and activation energies, indicating a greater resistance to OH ion attack. Furthermore, the diffusion coefficients of the OH ions obtained from our MD simulations are consistent with values reported in the literature [18,19], thus validating our computational methods. Although direct experimental comparisons between QCS-A and its variants (B and C) remain unavailable, the consistency of our theoretical findings with established experimental data on similar systems supports the reliability of our results.
These findings not only confirm the crucial role of structural variations between QCS variants in determining the stability and performance of AEMs but also underscore the importance of operational conditions such as hydration level and temperature in optimizing membrane performance. The study contributes valuable insights into the design and development of AEMs, offering guidance for the selection of QCS materials on the basis of the desired balance of stability and ion transport efficiency. Future work will focus on extending these analyses to include the impact of other environmental factors, with the aim of developing more robust and efficient AEMs for sustainable energy applications.

Supplementary Materials

The following supporting information can be downloaded at: https://www.mdpi.com/article/10.3390/molecules29133175/s1, The Supplementary Material includes extended DFT results, MD settings, and detailed MSD vs. time curves for OH ions and water across different QCS types and conditions; Figure S1: Structure of representative segments of QCS (A) were illustrated for the S N 2 degradation reaction; Figure S2: Structure of representative segments of QCS (B) were illustrated for the S N 2 degradation reaction; Figure S3: Structure of representative segments of QCS (C) were illustrated for the S N 2 degradation reaction; Figure S4: Representation of molecular electrostatic potential maps for various QCS segments, and their complexes with OH ions; Figure S5: Complexes of three different QCS segments with OH ions. Color key: white (hydrogen); grey (carbon); blue (nitrogen); green (chloride); Figure S6: MSD plot and the trend line at the HL 3 for OH ions in the presence of QCS (A) of AEM; Figure S7: MSD plot and the trend line at the HL 9 for OH ions in the presence of QCS (A) of AEM; Figure S8: MSD plot and the trend line at the HL 15 for OH ions in the presence of QCS (A) of AEM; Figure S9: MSD plot and the trend line at the HL 3 for OH ions in the presence of QCS (B) of AEM; Figure S10: MSD plot and the trend line at the HL 9 for OH ions in the presence of QCS (B) of AEM; Figure S11: MSD plot and the trend line at the HL 15 for OH ions in the presence of QCS (B) of AEM.; Figure S12: MSD plot and the trend line at the HL 3 for OH ions in the presence of QCS (C) of AEM; Figure S13: MSD plot and the trend line at the HL 9 for OH ions in the presence of QCS (C) of AEM; Figure S14: MSD plot and the trend line at the HL 15 for OH ions in the presence of QCS (C) of AEM; Figure S15: MSD plot and the trend line at the HL 3 for H 2 O ions in the presence of QCS (A) of AEM; Figure S16: MSD plot and the trend line at the HL 9 for H 2 O ions in the presence of QCS (A) of AEM; Figure S17: MSD plot and the trend line at the HL 15 for H 2 O ions in the presence of QCS (A) of AEM; Figure S18: MSD plot and the trend line at the HL 3 for H 2 O ions in the presence of QCS (B) of AEM; Figure S19: MSD plot and the trend line at the HL 9 for H 2 O ions in the presence of QCS (B) of AEM; Figure S20: MSD plot and the trend line at the HL 15 for H 2 O ions in the presence of QCS (B) of AEM; Figure S21: MSD plot and the trend line at the HL 3 for H 2 O ions in the presence of QCS (C) of AEM; Figure S22: MSD plot and the trend line at the HL 9 for H 2 O ions in the presence of QCS (C) of AEM; Figure S23: MSD plot and the trend line at the HL 15 for H 2 O ions in the presence of QCS (C) of AEM; Figure S24: MSD plot and the trend line at the HL 3 for OH ions in the presence of QCS (A) of AEM at 298 K; Figure S25: MSD plot and the trend line at the HL 3 for OH ions in the presence of QCS (A) of AEM at the 330 K; Figure S26: MSD plot and the trend line at the HL 3 for OH ions in the presence of QCS (A) of AEM at the 350 K; Figure S27: MSD plot and the trend line at the HL 3 for OH ions in the presence of QCS (B) of AEM at the 298 K; Figure S28: MSD plot and the trend line at the HL 3 for OH ions in the presence of QCS (B) of AEM at the 330 K; Figure S29: MSD plot and the trend line at the HL 3 for OH ions in the presence of QCS (B) of AEM at the 350 K; Figure S30: MSD plot and the trend line at the HL 3 for OH ions in the presence of QCS (C) of AEM at the 298 K; Figure S31: MSD plot and the trend line at the HL 3 for OH ions in the presence of QCS (C) of AEM at the 330 K; Figure S32: MSD plot and the trend line at the HL 3 for OH ions in the presence of QCS (C) of AEM at the 350 K; Figure S33: MSD plot and the trend line at the HL 3 for H 2 O ions in the presence of QCS (A) of AEM at the 298 K; Figure S34: MSD plot and the trend line at the HL 3 for H 2 O ions in the presence of QCS (A) of AEM at the 330 K; Figure S35: MSD plot and the trend line at the HL 3 for H 2 O ions in the presence of QCS (A) of AEM at the 350 K; Figure S36: MSD plot and the trend line at the HL 3 for H 2 O ions in the presence of QCS (B) of AEM at the 298 K; Figure S37: MSD plot and the trend line at the HL 3 for H 2 O ions in the presence of QCS (B) of AEM at the 330 K; Figure S38: MSD plot and the trend line at the HL 3 for H 2 O ions in the presence of QCS (B) of AEM at the 350 K; Figure S39: MSD plot and the trend line at the HL 3 for H 2 O ions in the presence of QCS (C) of AEM at the 298 K; Figure S40: MSD plot and the trend line at the HL 3 for H 2 O ions in the presence of QCS (C) of AEM at the 330 K; Figure S41: MSD plot and the trend line at the HL 3 for H 2 O ions in the presence of QCS (C) of AEM at 350 K; Table S1: Description for our designed systems at 298 K and 1 bar; Table S2: Energy values for our designed systems at 298 K and 1 bar; Table S3: Energy values for our designed systems of AEM studied by the DFT calculations at the HL 0; Table S4: Energy values for our designed systems of AEM studied by the DFT calculations at the HL 3.

Author Contributions

M.K.: computational methodology, formal analysis, writing—original draft; B.M.: calculation, writing—review and editing; D.B.: writing—review and editing; Y.W.: supervision, conceptualization, formal analysis, writing—review and editing; A.M.: funding acquisition, writing—review and editing. All authors have read and agreed to the published version of the manuscript.

Funding

This work was supported by the research grant AP14869880 “Deep eutectic solvent supported polymer-based high performance anion exchange membrane for alkaline fuel cells” project from MES RK.

Institutional Review Board Statement

Not applicable.

Informed Consent Statement

Not applicable.

Data Availability Statement

The data and materials are available from the authors upon request.

Acknowledgments

The authors are also grateful to Nazarbayev University Research Computing for providing computational resources for this work.

Conflicts of Interest

The authors have no conflicts to disclose.

Abbreviations

The following abbreviations are used in this manuscript:
AEMAnion Exchange Membrane
AEMFCsAnion Exchange Membrane Fuel Cells
AFCsAlkaline Fuel Cells
BSSEBasis set superposition error
DFTDensity Functional Theory
Δ E reaction Reaction energy
Δ E activation Activation energy
Δ E binding Binding energy
DMFCsDirect Methanol Fuel Cells
EFCsEnzymatic Fuel Cells
HLHydration level
OH Hydroxide ion
LUMOLowest unoccupied molecular orbital
MCFCsMolten Carbonate Fuel Cells
MDMolecular dynamics
MSDMean square displacement
S N 2 Nucleophilic substitution
PAFCsPhosphoric Acid Fuel Cells
PCMPolarizable continuum model
PEMFCsProton Exchange Membrane Fuel Cells
QCSQuaternized chitosan
QAQuaternary ammonium
RDFRadial distribution function
SOFCsSolid Oxide Fuel Cells

References

  1. Dekel, D.R. Review of cell performance in anion exchange membrane fuel cells. J. Power Sources 2018, 375, 158–169. [Google Scholar] [CrossRef]
  2. Chen, H.; Tao, R.; Bang, K.T.; Shao, M.; Kim, Y. Anion Exchange Membranes for Fuel Cells: State-of-the-Art and Perspectives. Adv. Energy Mater. 2022, 12, 2200934. [Google Scholar] [CrossRef]
  3. Li, F.; Chan, S.H.; Tu, Z. Recent Development of Anion Exchange Membrane Fuel Cells and Performance Optimization Strategies: A Review. Chem. Rec. 2024, 24, e202300067. [Google Scholar] [CrossRef]
  4. Varcoe, J.R.; Atanassov, P.; Dekel, D.R.; Herring, A.M.; Hickner, M.A.; Kohl, P.A.; Kucernak, A.R.; Mustain, W.E.; Nijmeijer, K.; Scott, K.; et al. Anion-exchange membranes in electrochemical energy systems. Energy Environ. Sci. 2014, 7, 3135–3191. [Google Scholar] [CrossRef]
  5. Aranaz, I.; Alcántara, A.R.; Civera, M.C.; Arias, C.; Elorza, B.; Heras Caballero, A.; Acosta, N. Chitosan: An Overview of Its Properties and Applications. Polymers 2021, 13, 3256. [Google Scholar] [CrossRef]
  6. Wan, Y.; Peppley, B.; Creber, K.A.; Bui, V.T. Anion-exchange membranes composed of quaternized-chitosan derivatives for alkaline fuel cells. J. Power Sources 2010, 195, 3785–3793. [Google Scholar] [CrossRef]
  7. Vijayakumar, V.; Nam, S.Y. A Review of Recent Chitosan Anion Exchange Membranes for Polymer Electrolyte Membrane Fuel Cells. Membranes 2022, 12, 1265. [Google Scholar] [CrossRef]
  8. Ma, J.; Sahai, Y. Chitosan biopolymer for fuel cell applications. Carbohydr. Polym. 2013, 92, 955–975. [Google Scholar] [CrossRef]
  9. Myrzakhmetov, B.; Akhmetova, A.; Bissenbay, A.; Karibayev, M.; Pan, X.; Wang, Y.; Bakenov, Z.; Mentbayeva, A. Review: Chitosan-based biopolymers for anion-exchange membrane fuel cell application. R. Soc. Open Sci. 2023, 10, 230843. [Google Scholar] [CrossRef]
  10. Maurya, S.; Shin, S.H.; Kim, Y.; Moon, S.H. A review on recent developments of anion exchange membranes for fuel cells and redox flow batteries. Rsc Adv. 2015, 5, 37206–37230. [Google Scholar] [CrossRef]
  11. Arges, C.G.; Zhang, L. Anion exchange membranes’ evolution toward high hydroxide ion conductivity and alkaline resiliency. ACS Appl. Energy Mater. 2018, 1, 2991–3012. [Google Scholar] [CrossRef]
  12. Dekel, D.R.; Amar, M.; Willdorf, S.; Kosa, M.; Dhara, S.; Diesendruck, C.E. Effect of water on the stability of quaternary ammonium groups for anion exchange membrane fuel cell applications. Chem. Mater. 2017, 29, 4425–4431. [Google Scholar] [CrossRef]
  13. Dekel, D.R.; Willdorf, S.; Ash, U.; Amar, M.; Pusara, S.; Dhara, S.; Srebnik, S.; Diesendruck, C.E. The critical relation between chemical stability of cations and water in anion exchange membrane fuel cells environment. J. Power Sources 2018, 375, 351–360. [Google Scholar] [CrossRef]
  14. Wan, Y.; Peppley, B.; Creber, K.A.; Bui, V.T.; Halliop, E. Quaternized-chitosan membranes for possible applications in alkaline fuel cells. J. Power Sources 2008, 185, 183–187. [Google Scholar] [CrossRef]
  15. Xiong, Y.; Liu, Q.L.; Zhang, Q.G.; Zhu, A.M. Synthesis and characterization of cross-linked quaternized poly (vinyl alcohol)/chitosan composite anion exchange membranes for fuel cells. J. Power Sources 2008, 183, 447–453. [Google Scholar] [CrossRef]
  16. Liao, G.M.; Yang, C.C.; Hu, C.C.; Pai, Y.L.; Lue, S.J. Novel quaternized polyvinyl alcohol/quaternized chitosan nano-composite as an effective hydroxide-conducting electrolyte. J. Membr. Sci. 2015, 485, 17–29. [Google Scholar] [CrossRef]
  17. Karibayev, M.; Myrzakhmetov, B.; Kalybekkyzy, S.; Wang, Y.; Mentbayeva, A. Binding and Degradation Reaction of Hydroxide Ions with Several Quaternary Ammonium Head Groups of Anion Exchange Membranes Investigated by the DFT Method. Molecules 2022, 27, 2686. [Google Scholar] [CrossRef]
  18. Zhang, N.; Huo, J.; Yang, B.; Ruan, X.; Zhang, X.; Bao, J.; Qi, W.; He, G. Understanding of imidazolium group hydration and polymer structure for hydroxide anion conduction in hydrated imidazolium-g-PPO membrane by molecular dynamics simulations. Chem. Eng. Sci. 2018, 192, 1167–1176. [Google Scholar] [CrossRef]
  19. Dubey, V.; Maiti, A.; Daschakraborty, S. Predicting the solvation structure and vehicular diffusion of hydroxide ion in an anion exchange membrane using nonreactive molecular dynamics simulation. Chem. Phys. Lett. 2020, 755, 137802. [Google Scholar] [CrossRef]
  20. Luo, X.; Liu, H.; Bae, C.; Tuckerman, M.E.; Hickner, M.A.; Paddison, S.J. Mesoscale Simulations of Quaternary Ammonium-Tethered Triblock Copolymers: Effects of the Degree of Functionalization and Styrene Content. J. Phys. Chem. C 2020, 124, 16315–16323. [Google Scholar] [CrossRef]
  21. Munoz-Santiburcio, D.; Marx, D. Confinement-controlled aqueous chemistry within nanometric slit pores: Focus review. Chem. Rev. 2021, 121, 6293–6320. [Google Scholar] [CrossRef]
  22. Zelovich, T.; Tuckerman, M.E. OH and H3O+ Diffusion in Model AEMs and PEMs at Low Hydration: Insights from Ab Initio Molecular Dynamics. Membranes 2021, 11, 355. [Google Scholar] [CrossRef]
  23. Zelovich, T.; Long, Z.; Hickner, M.; Paddison, S.J.; Bae, C.; Tuckerman, M.E. Ab initio molecular dynamics study of hydroxide diffusion mechanisms in nanoconfined structural mimics of anion exchange membranes. J. Phys. Chem. C 2019, 123, 4638–4653. [Google Scholar] [CrossRef]
  24. Wan, Y.; Creber, K.A.; Peppley, B.; Bui, V.T. Ionic conductivity of chitosan membranes. Polymer 2003, 44, 1057–1065. [Google Scholar] [CrossRef]
  25. Muller-Plathe, F. Permeation of polymers—a computational approach. Acta Polym. 1994, 45, 259–293. [Google Scholar] [CrossRef]
  26. Wan, Y.; Creber, K.A.; Peppley, B.; Bui, V.T. Synthesis, characterization and ionic conductive properties of phosphorylated chitosan membranes. Macromol. Chem. Phys. 2003, 204, 850–858. [Google Scholar] [CrossRef]
  27. Akhmetova, A.; Myrzakhmetov, B.; Wang, Y.; Bakenov, Z.; Mentbayeva, A. Development of Quaternized Chitosan Integrated with Nanofibrous Polyacrylonitrile Mat as an Anion-Exchange Membrane. ACS Omega 2022, 7, 45371–45380. [Google Scholar] [CrossRef] [PubMed]
  28. Wan, Y.; Creber, K.A.; Peppley, B.; Bui, V.T. Ionic conductivity and related properties of crosslinked chitosan membranes. J. Appl. Polym. Sci. 2003, 89, 306–317. [Google Scholar] [CrossRef]
  29. Tomasino, E.; Mukherjee, B.; Ataollahi, N.; Scardi, P. Water Uptake in an Anion Exchange Membrane Based on Polyamine: A First-Principles Study. J. Phys. Chem. B 2022, 126, 7418–7428. [Google Scholar] [CrossRef]
  30. Zhang, H.; Wang, X.; Wang, Y.; Zhang, Y.; Zhang, W.; You, W. Alkaline-Stable Anion-Exchange Membranes with Barium [2.2. 2] Cryptate Cations: The Importance of High Binding Constants. Angew. Chem. 2023, 135, e202217742. [Google Scholar] [CrossRef]
  31. Stephens, P.J.; Devlin, F.J.; Chabalowski, C.F.; Frisch, M.J. Ab initio calculation of vibrational absorption and circular dichroism spectra using density functional force fields. J. Phys. Chem. 1994, 98, 11623–11627. [Google Scholar] [CrossRef]
  32. Mennucci, B. Polarizable continuum model. Wiley Interdiscip. Rev. Comput. Mol. Sci. 2012, 2, 386–404. [Google Scholar] [CrossRef]
  33. Gill, P.M.; Johnson, B.G.; Pople, J.A.; Frisch, M.J. The performance of the Becke—Lee—Yang—Parr (B—LYP) density functional theory with various basis sets. Chem. Phys. Lett. 1992, 197, 499–505. [Google Scholar] [CrossRef]
  34. De Castro, E.; Jorge, F. Accurate universal Gaussian basis set for all atoms of the periodic table. Chem. Phys. 1998, 108, 5225–5229. [Google Scholar] [CrossRef]
  35. Frisch, M.; Trucks, G.; Schlegel, H.; Scuseria, G.; Robb, M.; Cheeseman, J.; Scalmani, G.; Barone, V.; Petersson, G.; Nakatsuji, H.; et al. G16_C01. Gaussian 16, Revision C. 01; Gaussian, Inc.: Wallingford, CT, USA, 2016; Volume 248. [Google Scholar]
  36. Zoete, V.; Cuendet, M.A.; Grosdidier, A.; Michielin, O. SwissParam: A fast force field generation tool for small organic molecules. J. Comput. Chem. 2011, 32, 2359–2368. [Google Scholar] [CrossRef]
  37. MacKerell, A.D., Jr.; Banavali, N.; Foloppe, N. Development and current status of the CHARMM force field for nucleic acids. Biopolym. Orig. Res. Biomol. 2000, 56, 257–265. [Google Scholar] [CrossRef]
  38. Jorgensen, W.L.; Chandrasekhar, J.; Madura, J.D.; Impey, R.W.; Klein, M.L. Comparison of simple potential functions for simulating liquid water. J. Chem. Phys. 1983, 79, 926–935. [Google Scholar] [CrossRef]
  39. Han, K.W.; Ko, K.H.; Abu-Hakmeh, K.; Bae, C.; Sohn, Y.J.; Jang, S.S. Molecular dynamics simulation study of a polysulfone-based anion exchange membrane in comparison with the proton exchange membrane. J. Phys. Chem. C 2014, 118, 12577–12587. [Google Scholar] [CrossRef]
  40. Ewald, P.P. Die Berechnung optischer und elektrostatischer Gitterpotentiale. Ann. Phys. 1921, 369, 253–287. [Google Scholar] [CrossRef]
  41. Evans, D.J.; Holian, B.L. The nose–hoover thermostat. J. Chem. Phys. 1985, 83, 4069–4074. [Google Scholar] [CrossRef]
  42. Berendsen, H.J.C. Transport properties computed by linear response through weak coupling to a bath. In Computer Simulation in Materials Science: Interatomic Potentials, Simulation Techniques and Applications; Springer: Dordrecht, The Netherlands, 1991; pp. 139–155. [Google Scholar] [CrossRef]
  43. Van Der Spoel, D.; Lindahl, E.; Hess, B.; Groenhof, G.; Mark, A.E.; Berendsen, H.J. GROMACS: Fast, flexible, and free. J. Comput. Chem. 2005, 26, 1701–1718. [Google Scholar] [CrossRef] [PubMed]
  44. Humphrey, W.; Dalke, A.; Schulten, K. VMD–Visual Molecular Dynamics. J. Mol. Graph. 1996, 14, 33–38. [Google Scholar] [CrossRef] [PubMed]
  45. Karibayev, M.; Bekeshov, D.; Myrzakhmetov, B.; Kalybekkyzy, S.; Wang, Y.; Bakenov, Z.; Mentbayeva, A. Effect of Hydration on the Intermolecular Interaction of Various Quaternary Ammonium Based Head Groups with Hydroxide Ion of Anion Exchange Membrane Studied at the Molecular Level. Eurasian-Chem.-Technol. J. 2023, 25, 89–102. [Google Scholar] [CrossRef]
  46. Nhung, L.T.T.; Kim, I.Y.; Yoon, Y.S. Quaternized chitosan-based anion exchange membrane composited with quaternized poly (vinylbenzyl chloride)/polysulfone blend. Polymers 2020, 12, 2714. [Google Scholar] [CrossRef] [PubMed]
  47. Jang, S.C.; Chuang, F.S.; Tsen, W.C.; Kuo, T.W. Quaternized chitosan/functionalized carbon nanotubes composite anion exchange membranes. J. Appl. Polym. Sci. 2019, 136, 47778. [Google Scholar] [CrossRef]
Figure 1. Depiction of S N 2 degradation reactions for QCS segments (AC) at the HL 0.
Molecules 29 03175 g001
Figure 2. Depiction of S N 2 degradation reactions for QCS segments (AC) at the HL 3.
Molecules 29 03175 g002
Figure 3. Representation of LUMO densities for the optimized ground state geometries of QCS segments, including (A) 2-hydroxy propyl trimethyl ammonium chitosan, (B) oxy propyl trimethyl ammonium chitosan, and (C) propyl trimethyl ammonium chitosan.
Molecules 29 03175 g003
Figure 4. RDFs for the correlation between the oxygen atom of OH ion and the nitrogen atom of QCS (types AC) in the presence of explicit water molecules at the different HLs.
Molecules 29 03175 g004
Figure 5. MSD vs. time curves at different HLs for OH ions and H 2 O molecules in systems with QCS types (AC), respectively.
Molecules 29 03175 g005
Figure 6. Snapshot of water clusters surrounding QCS types (AC) AEMs at various HLs. Drawing method for water: Quick Surface and color scheme for water: blue; Drawing method for OH ion: VdW representation and color scheme for OH ion: yellow (oxygen), grey (hydrogen); Drawing method for QCS: CPK representation and color scheme for QCS: violet (carbon), grey (hydrogen), red (oxygen), blue (nitrogen).
Molecules 29 03175 g006
Figure 7. RDFs for the correlation between the oxygen atom of OH ion and the nitrogen atom of QCS (types AC) in the presence of explicit water molecules at the different temperatures.
Molecules 29 03175 g007
Figure 8. MSD vs. time curves at different temperature values for OH ions and H 2 O in systems with QCS types (AC), respectively.
Molecules 29 03175 g008
Figure 9. Representative structures of different QCS segments: (A) 2-hydroxy propyl trimethyl ammonium chitosan, (B) oxy propyl trimethyl ammonium chitosan, and (C) propyl trimethyl ammonium chitosan.
Molecules 29 03175 g009
Figure 10. Illustration of the representative segment of QCS (A) for the S N 2 degradation reaction.
Molecules 29 03175 g010
Table 1. Reaction and activation energy values for our designed systems, measured at 298 K and 1 bar at the HL 0. Units: kJ/mol.
QCS Δ E reaction BSSE Δ E activation
(A)−123.4815.1266.51
(B)−130.6216.1137.01
(C)−132.9414.7236.21
Table 2. Reaction and activation energy values for our designed systems, measured at 298 K and 1 bar at the HL 3. Units: kJ/mol.
QCS Δ E reaction BSSE Δ E activation
(A)−21.5611.47147.27
(B)−28.698.38103.20
(C)−31.028.4789.92
Table 3. Diffusion coefficients of OH ions across different QCS structures and HLs.
D, nm 2 / ns , (SE)HL Values
3915
OH (A)0.011 (0.004)0.017 (0.005)0.027 (0.003)
(B)0.011 (0.003)0.016 (0.006)0.026 (0.002)
(C)0.011 (0.001)0.015 (0.002)0.026 (0.002)
Table 4. Diffusion coefficients of H 2 O molecules across different QCS structures and HLs.
D, nm 2 / ns , (SE)HL Values
3915
H 2 O (A)0.20 (0.07)0.40 (0.06)0.46 (0.04)
(B)0.18 (0.04)0.39 (0.05)0.43 (0.06)
(C)0.13 (0.03)0.39 (0.02)0.42 (0.05)
Table 5. Diffusion coefficients of OH ions across various QCS structures at different temperatures.
D, nm 2 / ns , (SE)Temperature Values (K)
298330350
OH (A)0.011 (0.004)0.023 (0.003)0.027 (0.003)
(B)0.011 (0.003)0.023 (0.003)0.026 (0.003)
(C)0.011 (0.001)0.016 (0.002)0.026 (0.003)
Table 6. Diffusion coefficients of H 2 O molecules across various QCS structures at different temperatures.
D, nm 2 / ns (SE)Temperature Values (K)
298330350
H 2 O (A)0.20 (0.07)1.54 (0.04)2.86 (0.25)
(B)0.18 (0.04)1.38 (0.06)1.92 (0.20)
(C)0.13 (0.03)0.44 (0.05)0.84 (0.09)
Disclaimer/Publisher’s Note: The statements, opinions and data contained in all publications are solely those of the individual author(s) and contributor(s) and not of MDPI and/or the editor(s). MDPI and/or the editor(s) disclaim responsibility for any injury to people or property resulting from any ideas, methods, instructions or products referred to in the content.

