Article

Solubility of Metal Precursors in Supercritical CO2: Measurements and Correlations

Institute for Technical Thermodynamics, Karlsruhe Institute of Technology (KIT), Engler-Bunte-Ring 21, 76131 Karlsruhe, Germany
*
Author to whom correspondence should be addressed.
Molecules 2025, 30(8), 1660; https://doi.org/10.3390/molecules30081660
Submission received: 26 February 2025 / Revised: 1 April 2025 / Accepted: 6 April 2025 / Published: 8 April 2025
(This article belongs to the Special Issue Thermodynamics of Organic Materials)

Abstract

:
Knowledge of the solubility of metal precursors in supercritical (sc) CO2 is a key factor for determining the best operation conditions for the synthesis of supported metallic nanoparticles. In this paper, new experimental solubility data of Cu(acac)2, Pd(acac)2, and Pt(acac)2 in scCO2 for temperatures from 313 to 353 K and pressures from 10 to 40 MPa are presented and compared with the literature data and correlated with semi-empirical density-based models (Chrastil, extended Kumar and Johnston, extended Bartle, and the original and modified Méndez–Santiago–Teja). In addition, literature data for the solubility of Cu(tmhd)2, Pd(tmhd)2, and Pt(cod)me2 in scCO2 were also correlated with the above-mentioned models. The best result, i.e., the best agreement between the experimental and calculated solubility datasets, was observed for the Chrastil model. Applying the Chrastil and extended Bartle models, the dissolution, sublimation, and solvation enthalpies were estimated. Furthermore, these correlation results were compared with the results from Ushiki et al., who correlated the solubilities of metal acetylacetonates in scCO2 from the literature using the PC-SAFT equation of state. This comparison showed that the original Méndez–Santiago–Teja model enabled a better description of the experimental data by a factor of three.

1. Introduction

The design, development, and synthesis of nanostructured materials, such as supported metal nanoparticles (NPs), are of particular interest to a large number of technologically important areas, such as chemistry, energy, electronics, optics, pharmacology, and material science. NPs are characterized by unique properties such as their high specific surface areas, leading to an enhanced energetic state and, thus, a higher reactivity. In particular, the synthesis of supported mono- or bimetallic NPs by supercritical fluid (SCFs)-based particle formation processes is a broad field of promising applications [1,2]. For example, in the case of particle formation processes such as a rapid expansion of supercritical solutions, supercritical fluid reactive deposition (SFRD), etc., the properties of the produced particles, such as particle size and morphology [3], dissolution behavior [4] or catalytic activity [5], are often strongly influenced by the underlying phase behavior.
A promising synthesis route is the use of supercritical (sc) CO2 as solvent, reaction, and separation media to synthesize nanostructured materials by SFRD. Numerous experimental results published in the literature demonstrate impressively that supported mono- or bimetallic NPs prepared by SFRD exhibit catalytic behavior that is much higher than the reference samples prepared by conventional methods (see, e.g., overview given in [2,6]). From a more general point of view, the solubility behavior affects the uptake and the size of the NPs [7] synthesized by SFRD and, thus, the catalytic activity of the supported NPs [2]. Thus, knowledge of metal precursor solubility in scCO2 is crucial for the determination of the best operating conditions since an insufficient solubility of the precursor in scCO2 limits practical applicability.
The literature contains numerous semi-empirical models for correlating the solubility of solids in scCO2 (e.g., [8,9]). These solubility data were correlated using two models in which the solubility of the dissolved solid, y 2 , depends on the CO2 density and temperature (i.e., Chrastil [10] and Kumar and Johnston [11]), two models that describe solubility as a function of CO2 density, temperature, and pressure (i.e., Bartle et al. [12] and the modified Méndez-Santiago and Teja method [13]), and one model which describes solubility as a function of CO2 density, temperature, pressure, and sublimation pressure of the solid (i.e., the original Méndez-Santiago and Teja [13]). The parameters for these models (except for the latter model) were obtained by performing a multiple linear regression on the experimental solubility data using the software OriginPro® 2022b. More details about these models are given in the corresponding original literature.
On the other hand, applying the cubic equations of state (EoS) requires knowledge of the thermophysical properties of the substances involved (such as critical properties and acentric factors) and at least one characteristic binary interaction parameter. However, due to partially low thermal degradation temperatures, reliable experimental critical data on the precursors are often not available in the literature, and the estimation techniques are inaccurate, as the contribution of metal cannot be taken into account [14]. Independently of whether the EoS approach or the enhancement factor E model [15,16] is applied, knowledge of the sublimation pressure is required for the correlation of solubility data [17]. Therefore, the influence of the sublimation pressure on the solubility correlation was also investigated.

2. Results

2.1. Presentation of the Models Used

2.1.1. Density-Based Approaches

According to the review written by Knez et al. [9], a widely used semi-empirical model was developed by Chrastil more than 40 years ago [10]. As pointed out by Stiver [18], there have been a number of modifications to Chrastil’s model in an effort to improve the performance of the original equation [19,20,21]. Since most solubility data are reported on a mole fraction basis, Stiver suggested transferring Chrastil’s original equation with solubility units ( g · d m 3 ) into an equation with solubility units of ( m o l · m o l 1 ).
l n y 2 = β + γ l n ρ 1 ρ 0 + α T
In Equation (1), y 2 is the solubility m o l · m o l 1 ; the density of pure CO2 is expressed as the normalized density ρ 1 / ρ 0   w i t h   ρ 0 = 1   m o l · d m 3 ; T is the temperature ( K ) ; and the three empirical Chrastil parameters are denoted by Greek letters ( α , β , and γ ) to distinguish the parameters of the modified equation from those of its original form [18]. The parameter γ expresses an average equilibrium association number, which is characteristic of a given binary system and represents the average number of CO2 molecules in an assumed solvent–solute complex. α   ( K ) is a parameter that is a function of the enthalpy of dissolution, Δ h d i s s   k J · m o l 1 , which is the sum of the enthalpies of sublimation (or vaporization), Δ h s u b , and solvation of the solute, Δ h s o l v , while β depends on the molecular weights of the solute and solvent. Furthermore, Equation (1) follows that plots of l n y 2 α / T   v s .   l n ρ 1 / ρ 0 for different temperatures will collapse to a single straight line, and the slope is equal to γ .
The widely used modified approach from Kumar and Johnston (KJ ext.) proposed a semi-empirical model in which the solubility of the dissolved solid depends on the pure CO2 density and system temperature [11,22]:
l n y 2 = b 0 + b 1 ρ 1 + b 2 T
In Equation (2), b 0   is the intersection with the y-axis; the slope b 1   d m 3 · m o l 1 is related to the solvent isothermal compressibility and the partial molar volume of the solute present at an infinite dilution in the SCF phase; and the value of b 2   ( K ) is related to Δ h d i s s . Again, plots of l n y 2 b 2 / T   v s .     ρ 1 for different temperatures should collapse to a single straight line, and the slope is equal to b 1 .
Based on a model suggested by Bartle et al. [12], Miller et al. [23] proposed an extended model (Bartle ext.) that correlates the solubility y 2 with the solvent’s density in the following way:
l n y 2 p p r e f = a 0 + a 1 ρ 1 ρ r e f + a 2 T
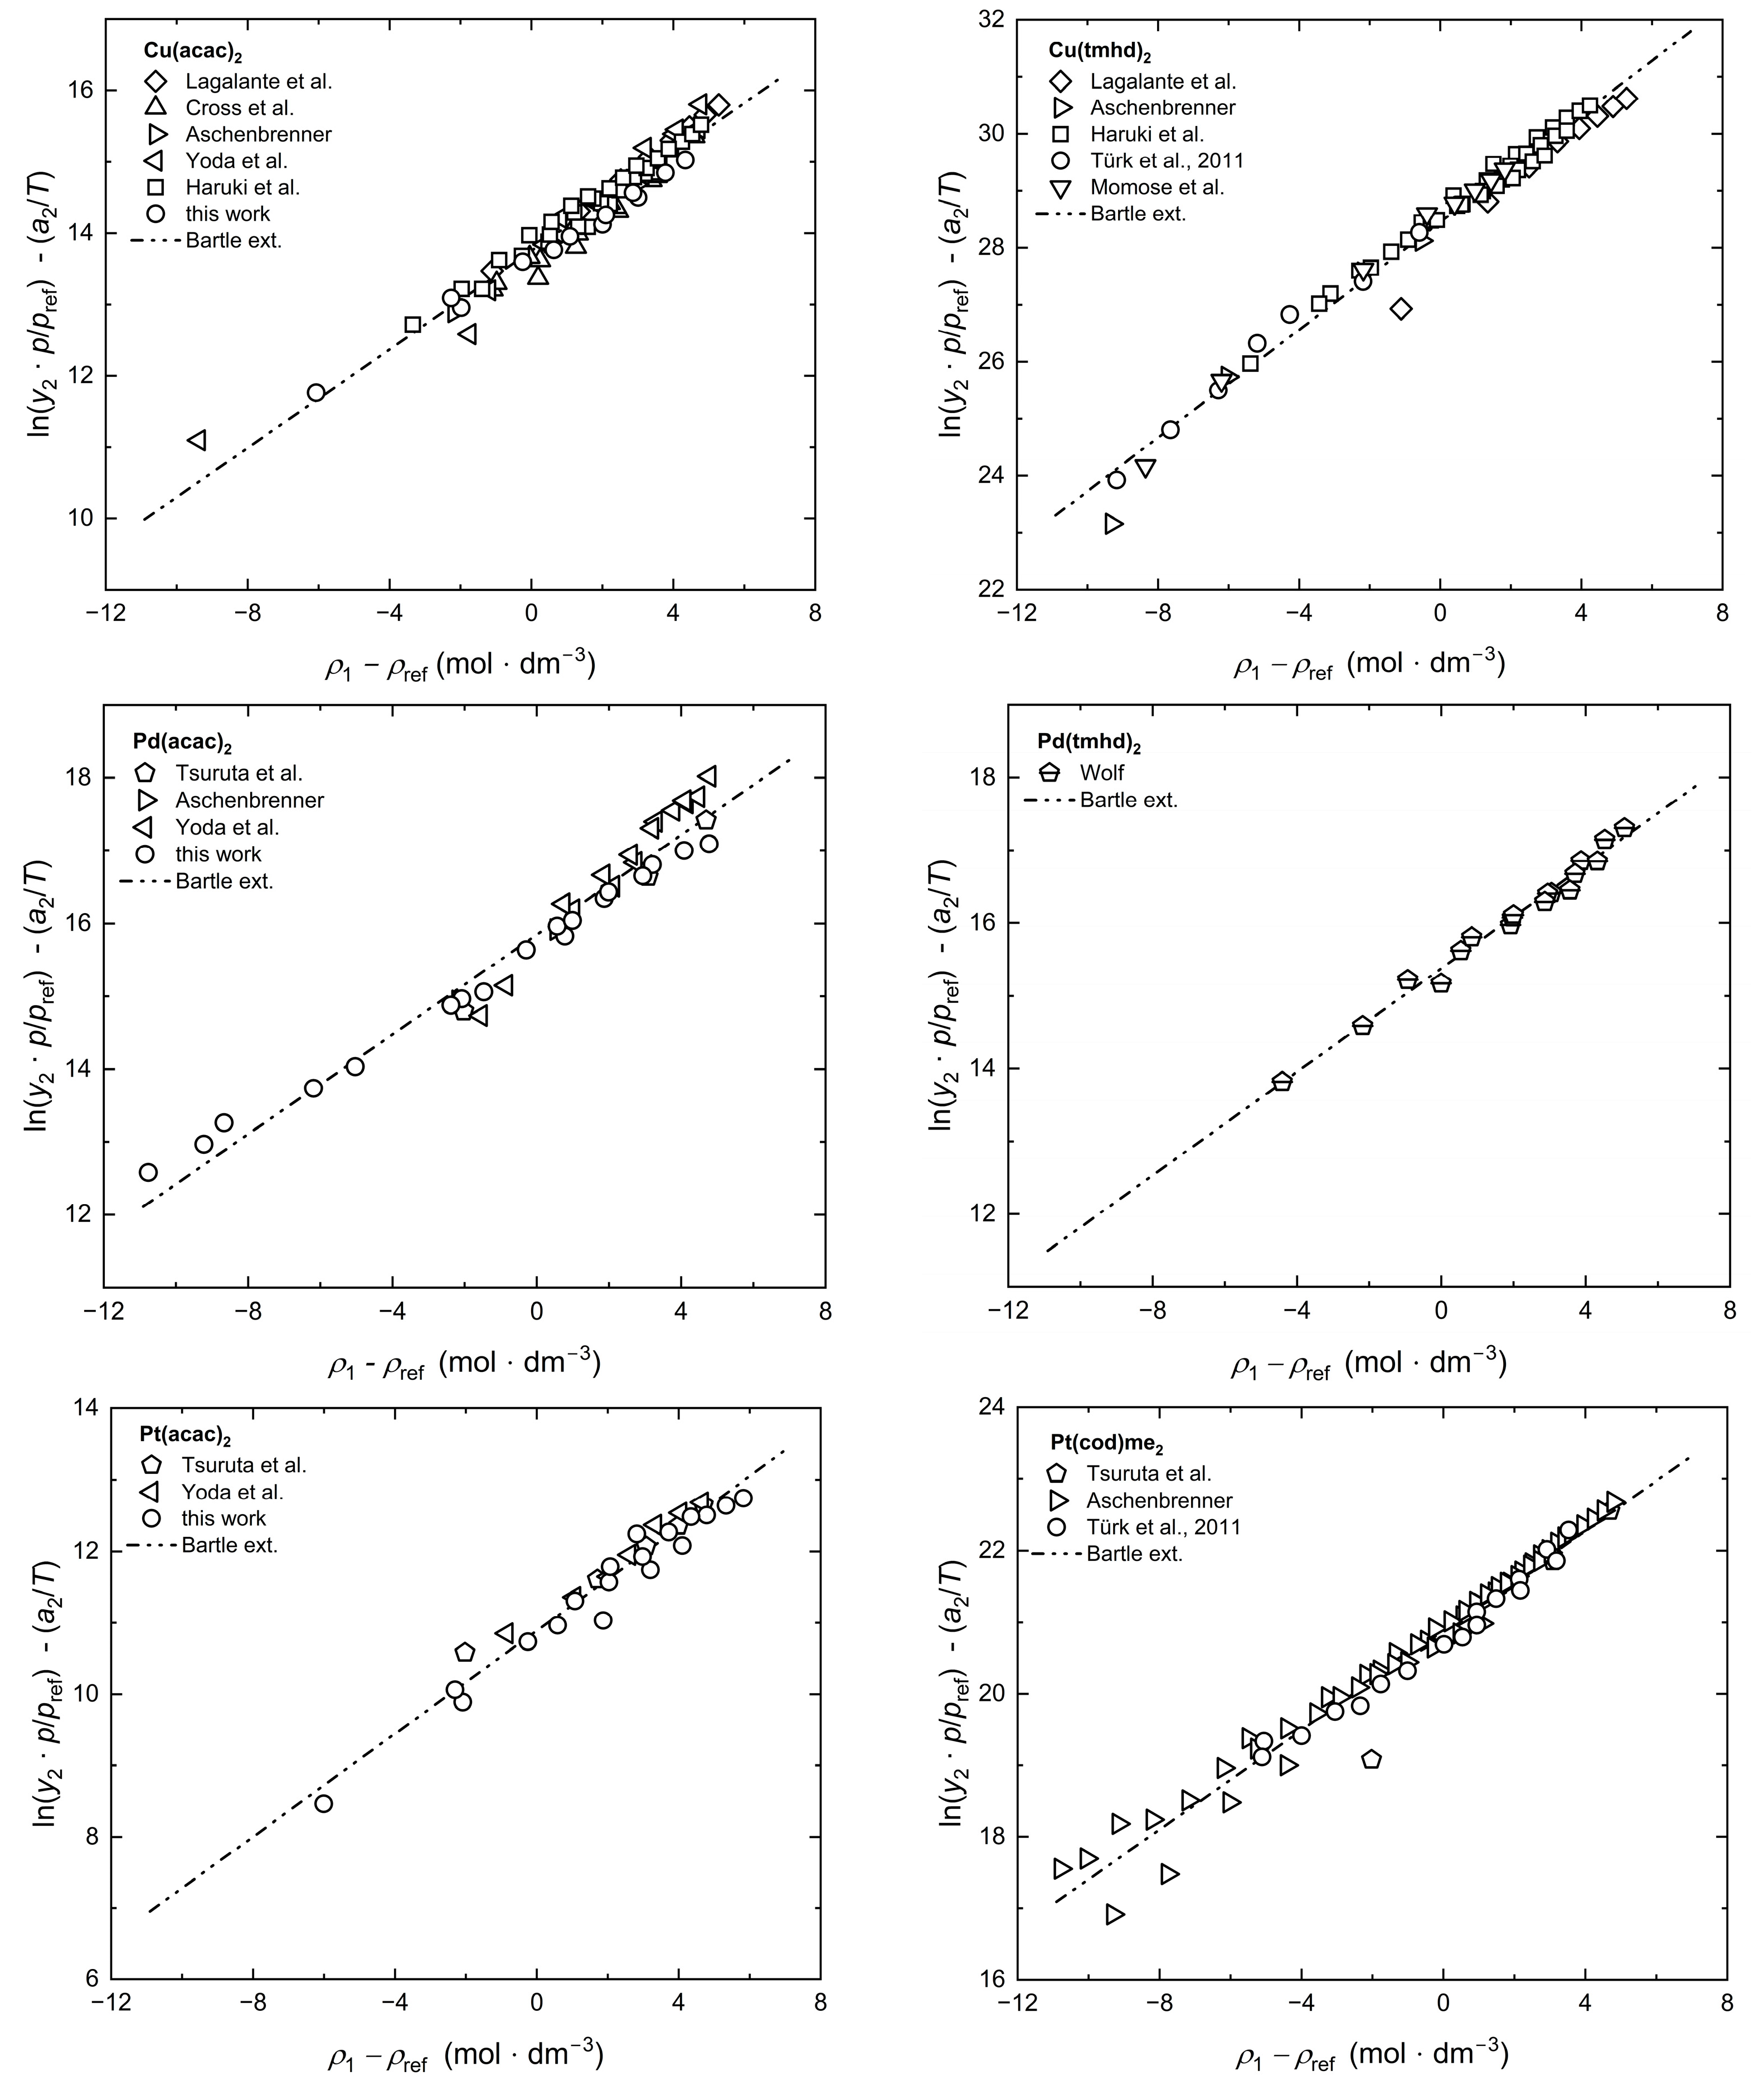
In Equation (3), p r e f = 0.1   M P a is the reference pressure, and ρ r e f = 15.90   m o l · d m 3 is the reference density; a 0 ,   a 1   d m 3 · m o l 1   a n d   a 2   K are the model’s parameters. Upon a suggestion by Miller et al., parameter a 2 can approximately be related to the sublimation enthalpy of the solid Δ h s u b [23]. It should be noted that the sublimation enthalpy estimated using this method is an approximate value. Plots of l n y 2 · p / p r e f a 2 / T   v s .   ρ 1   ρ r e f for different temperatures should collapse to a single straight line, and the slope is equal to a 1 .
One of the most commonly used models, which correlates the solubility y 2 of a solid in an SCF to the pure fluid’s density has been proposed by Méndez-Santiago and Teja (MST) [13]. This semi-empirical model (MST orig.) is based on the theory of dilute solutions. The linear relationship is as follows:
T · l n E = A + B · ρ 1
This can be used to prove the consistency of the experimental data. In Equation (4), ρ 1 is the density of pure CO2 at the equilibrium temperature T and pressure p . The so-called enhancement factor E is defined as the ratio of the mole fraction of the solid over the solubility in an ideal gas as follows:
E = y 2 p p 2 , s u b ( T )
E can be interpreted as a normalized solubility since it eliminates the effect of the solid’s sublimation pressure p 2 , s u b   ( P a ) at temperature T .
The two parameters from Equation (4), A   a n d   B   d m 3 · m o l 1 , are independent of the temperature so that the solubility data for binary systems at different temperatures should collapse to a single straight line when plotted   T · l n E   v s . ρ 1 and the slope is equal to B .
For the calculation of the enhancement factor E , reliable sublimation pressure data are required. Since such experimental data for solids are often not available, Méndez–Santiago and Teja incorporated the Clausius–Clapeyron-type expression for the sublimation pressure in Equation (6):
l n p 2 , s u b T p 0 = a + b T
where p 0 = 1   P a is the reference pressure, and a and b   K are the empirical parameters that are fitted to the experimental sublimation pressure data. As a result, Méndez–Santiago and Teja modified Equation (4) and proposed a semi-empirical correlation for the solid solubility, which has three adjustable parameters, A ,   B   a n d   C (MST mod.), which are independent of the temperature and pressure [13]:
ln y 2 · p p # = A T + B · ρ 1 T + C
Similar to the model proposed by Miller et al. [23], the normalized pressure p / p #   w i t h   p # = 1   M P a is incorporated into Equation (7). A K ,   B   K d m 3 · m o l 1   and   C are model parameters. Furthermore, the fact that all isotherms should collapse to a single line when plotted T · ln y 2 · p / p # C   v s . ρ 1 allows for determining the consistency of different experimental datasets.
It is worth noting that density-based approaches, which are based on the theory of dilute solutions, have some limitations. If the solubility is high (appr. 0.035 m o l · m o l 1 ), the pure solvent density has to be corrected since the density of the binary system differs significantly from that of the pure solvent [10,13,18]. Also, these density-based approaches are only valid over a limited range of temperature and pressure. It is important to consider that the upper limit of this linear behavior is about twofold, while the lower limit is around 0.6 of the solvent’s critical density [13] with ρ c = 10.5   m o l · d m 3 [24].
Furthermore, not all experimental datasets are suitable for the Chrastil, KJ ext., Bartle ext., or MST mod. approaches (Equations (1), (2), (3), and (7)) since datasets with less than five data points [18] are not applicable for fitting a model with three independent variables. Furthermore, isothermal data, i.e., measured at one single temperature, are inadequate to describe the temperature dependence. Nevertheless, these correlations are very useful because knowledge regarding the thermophysical properties of the solid (e.g., critical temperature, critical pressure, acentric factor, and sublimation pressure) is not necessary.

2.1.2. Equation of State Approaches

In addition to the density-based models, an approach based on cubic EoS is frequently used for the calculation of solid solubility in scCO2 as a function of temperature and pressure. Based on the equifugacity condition between the solid and fluid phases, this approach requires not only selecting the most appropriate EoS and mixing rule but also knowledge of the pure component parameters of both the fluid and the solid. Thus, modeling the solubility behavior by cubic EoS is a challenging task [22,25,26]. In principle, this challenge is a twofold one, namely both to correlate existing data and the prediction of phase equilibria in regions where experimental data are not yet available.
Pressure explicit EoS generally expresses the pressure p as the sum of two terms, a repulsion pressure p R and an attraction pressure p A , as shown in Equation (8) [27,28]:
p = p R + p A
Assuming that the molar volume of the pure solid ( v 2 , s ) at the system temperature is pressure independent, y 2 can be calculated according to Equation (9) as follows [29]:
y 2 T , p = ϕ 2 , s T , p 2 , s u b T · p 2 , s u b T ϕ 2 T , p , y 2 · p · e x p v 2 , s · p p 2 , s u b T R 0 · T
where p 2 , s u b is the sublimation pressure at temperature T , and ϕ 2 , s is the fugacity coefficient at T and p 2 , s u b , which is equal to one due to the low sublimation pressure of solids. ϕ 2 is the fugacity coefficient of the solid in the SCF phase at the current T , p , y 2 , and R 0 is the universal gas constant. Among others, the well-known Peng–Robinson EoS (PR EoS), in combination with the van der Waals-1 mixing rules using one, k i j , [27] or two binary interaction parameters, k i j and l i j , [29] are often used for the calculation of ϕ 2 .
Recently, the perturbed-chain statistical associating fluid theory (PC-SAFT) EoS was used by Ushiki et al. to calculate the solubilities of metal precursors in scCO2 [14,30]. In short, the PC-SAFT EoS describes the molar residual Helmholtz energy A r e s of a system as the sum of different additive and independent contributions, as shown in Equation (10):
A r e s = A h c + A d i s p + A a s s o c
These contributions are the hard-chain repulsion contribution A h c and the dispersion (van der Waals) attraction contribution A d i s p . Since associating components that form hydrogen bonds do not exist in the examined systems, the contribution of the molecular association A a s s o c was not considered by Ushiki et al. For the description of the phase behavior of a mixture composed of components i and j, the conventional Lorentz–Berthelot combining rules were usually applied [31]. Thereby, the binary interaction parameter k 12 , which describes the interactions between the components i and j, was used as a fitting parameter. More details about this approach can be found in the literature [32].

2.1.3. Evaluation of the Fitting Quality

The squared correlation coefficient ( R 2 ) and the adjusted R 2 ( R a d j 2 ) are used for statistical analysis [33]. As a rule of thumb, the more parameters there are for curve fitting, the more accurate the correlations are in order to obtain a reliable accuracy criterion for comparing the different models with a different number of fitting parameters. R 2 in Equation (11) is expressed as:
R 2 = i = 1 n y 2 e x p y 2 e x p ¯ · y 2 c a l c y 2 c a l c ¯ i = 1 n y 2 e x p y 2 e x p ¯ 2 · i = 1 n y 2 c a l c y 2 c a l c ¯ 2 2
where y 2 c a l c and y 2 e x p are the calculated and experimental solubility for each experimental data point; y 2 e x p ¯ and y 2 c a l c ¯ are the global mean values of the experimental and calculated data. Note that a R 2 value of 1 means that the agreement between the calculated and experimental data is perfect.
The R a d j 2 value is a modification of R 2 and enables the comparison of models with different adjustable parameters and can have negative, less than, or equal to R 2 values. The frequently used adjusted R a d j 2 in Equation (12) is expressed as:
R a d j 2 = 1 N 1 N K · 1 R 2
where R 2 is the coefficient of determination, N is the number of experimental data, and K the number of adjustable parameters in the correlation model. Since R a d j 2 considers the number of adjustable parameters, this value can be used to compare models with different numbers of independent variables. However, it must be noted that in the case of a large number of data, this correction is negligible.
For each of the above models, the average absolute relative deviation A A R D (%) between the experimental and modeled data for y 2 were calculated according to Equation (13) and used to evaluate the accuracy of the different models:
A A R D = 1 N 1 N y 2 c a l c y 2 e x p y 2 e x p · 100
where N is the number of data points.

2.2. Experimental Solubility Data

The solubility of the precursor in CO2 can be calculated from the dissolved molar amount of precursor divided by the sum of the dissolved molar amount of precursor plus the molar amount of CO2 dosed into the view cell (see Equation (14)):
y 2 = n 2 n 2 + n 1
with n i = m i / M i , where n 1 and n 2 are the moles of CO2 and the precursor, respectively, m i   ( g ) is the corresponding masses, and M i   ( g · m o l 1 ) is the corresponding molar masses.
The experimental data for the solubility of copper (II) acetylacetonate (Cu(acac)2), palladium (II) acetylacetonate (Pd(acac)2), and platinum (II) acetylacetonate (Pt(acac)2) in scCO2 were determined at different temperatures and pressures and are summarized in Table 1, Table 2 and Table 3. The values listed in Table 1, Table 2 and Table 3 for Δ ρ 1 / ρ 1 and Δ y 2 are calculated on the basis of the individual uncertainties for pressure, temperature, and mass determination, which are discussed in Section 3.2.
For the scCO2/Cu(acac)2 system, the solubility increases at 333 K and 15.2 MPa from y 2 = 1.05·10−5 to 3.16·10−5  m o l · m o l 1 at 40.1 MPa, and at 353 K and 15.1 MPa from y 2 = 9.66·10−6 to 5.96·10−5 at 40.5 MPa. The solubility of Pd(acac)2 in scCO2 increases at 313 K and 10.1 MPa from y 2 = 8.95·10−6 to 2.30·10−5 at 30.1 MPa, and at 353 K and 10.1 MPa from y 2 = 9.13·10−6 to 9.92·10−5 at 29.8 MPa. For the scCO2/Pt(acac)2 system, the solubility increases from 313 K and 15.2 MPa from y 2 = 1.37·10−5 to 2.88·10−5 at 40.1 MPa, and at 353 K and 15.2 MPa from y 2 = 7.34·10−6 to 1.22·10−4 at 40.2 MPa. At a given temperature and pressure condition, the order of the solubility of the precursors in scCO2 is: Pd(acac)2 > Pt(acac)2 > Cu(acac)2. The comparison of these (acac)2 precursors with the experimental solubility data at 353 K and 30 MPa published for Cu(tmhd)2 and Pt(cod)me2 [34] show that these solubility data are by a factor of about 70 higher, while the solubility data published for Pd(tmhd)2 [35] are by a factor of about 14 higher.
For all systems investigated, it holds that for a given pressure, the solubility of the precursors in scCO2 decreases with increasing temperatures for pressures between the lower and the upper crossover pressures (retrograde region) [36]. Outside this region, the opposite behavior is observed. Note that the upper crossover pressure for the systems investigated was found to be around 16 MPa and is caused by the competition between the impact of the precursor sublimation pressure and the CO2 density on temperature.

2.3. Experimental Sublimation Pressure Data from the Literature

For certain density-based approaches, e.g., MST orig., experimental sublimation pressure data, p 2 , s u b , are required. Figure 1a shows for Cu(acac)2 the numerous available experimental sublimation pressure data from the literature; at low temperatures (around 325 K), the differences for p 2 , s u b are up to three orders of magnitude, but they become significantly smaller with an increasing temperature.
The influence of the sublimation pressure on the enhancement factor E is clarified exemplarily for Cu(acac)2 in Figure 1b. It is obvious that the majority of the Cu(acac)2 solubility data published by different authors collapse to a single line if the experimental sublimation pressure data from Nasebulin [37] are used to calculate E . On the opposite thereto, the data published by Siddiqi [38] led to significantly higher values, while the data published by Teghil [39] led to clearly lower values for the enhancement factor E . This course is due to the noticeably higher values from Teghil [39] and the lower values from Siddiqi [38] published for p 2 , s u b (cf. Figure 1a). Therefore, when selecting the data for p 2 , s u b for the consistency test for the precursors investigated, the extent to which they match the solubility data was first checked.
It follows from the results obtained that the experimental sublimation pressure data are subject to large uncertainties and must, therefore, very often be estimated by using empirical group contribution methods (GCM). However, the common GC methods cannot be applied to metal precursors because the contribution of the metal atom cannot be considered [14]. Similar to the results shown in Figure 1b, it was also shown in [17] that the use of different GCM methods also leads to significantly different values for E .
In summary and in opposite to the results obtained for Cu(acac)2, Pd(acac)2, Pt(acac)2, Cu(tmhd)2, and Pd(tmhd)2, the different experimental data for Pt(cod)me2 do not collapse to a single line when using the experimental. p 2 , s u b data from Hierso et al. [48], which are, to our knowledge, the only p 2 , s u b data published in the literature. Thus, in the case of Pt(cod)me2, MST orig. was not able to prove the consistency of the different experimental solubility data (cf. Figure A4 in Appendix B and [34]).

2.4. Modeling of Solubility Data

The reliable experimental determination of the solubility in SCFs and its accurate modeling are important for the development of supercritical fluid technology. Therefore, different empirical density-based models were used for the correlation of experimental solubility data. In addition to our own solubility data (cf. Table 1, Table 2 and Table 3), experimental data from the literature (cf. Table 4) were used for modeling the solubility behavior of the (acac)2 precursors and of Cu(tmhd)2, Pd(tmhd)2, and Pt(cod)me2 in scCO2.
The linear relationships of Equations (1), (2), (3), (4), and (7) enable identifying experimental solubility data that are not consistent with other data. For most of the datasets (20 of 22) investigated, it holds that a pronounced linear trend was observed for a density range starting around 6.3 m o l · d m 3 (about 0.6· ρ c ) to nearly 22 m o l · d m 3 (about twofold of ρ c of CO2), which represents the upper limit of the available experimental data.
The values obtained from fitting the individual model parameters of Equations (1), (2), (3), (4), and (7), along with the R a d j 2 values for our own and literature solubility data are summarized in Table 5.
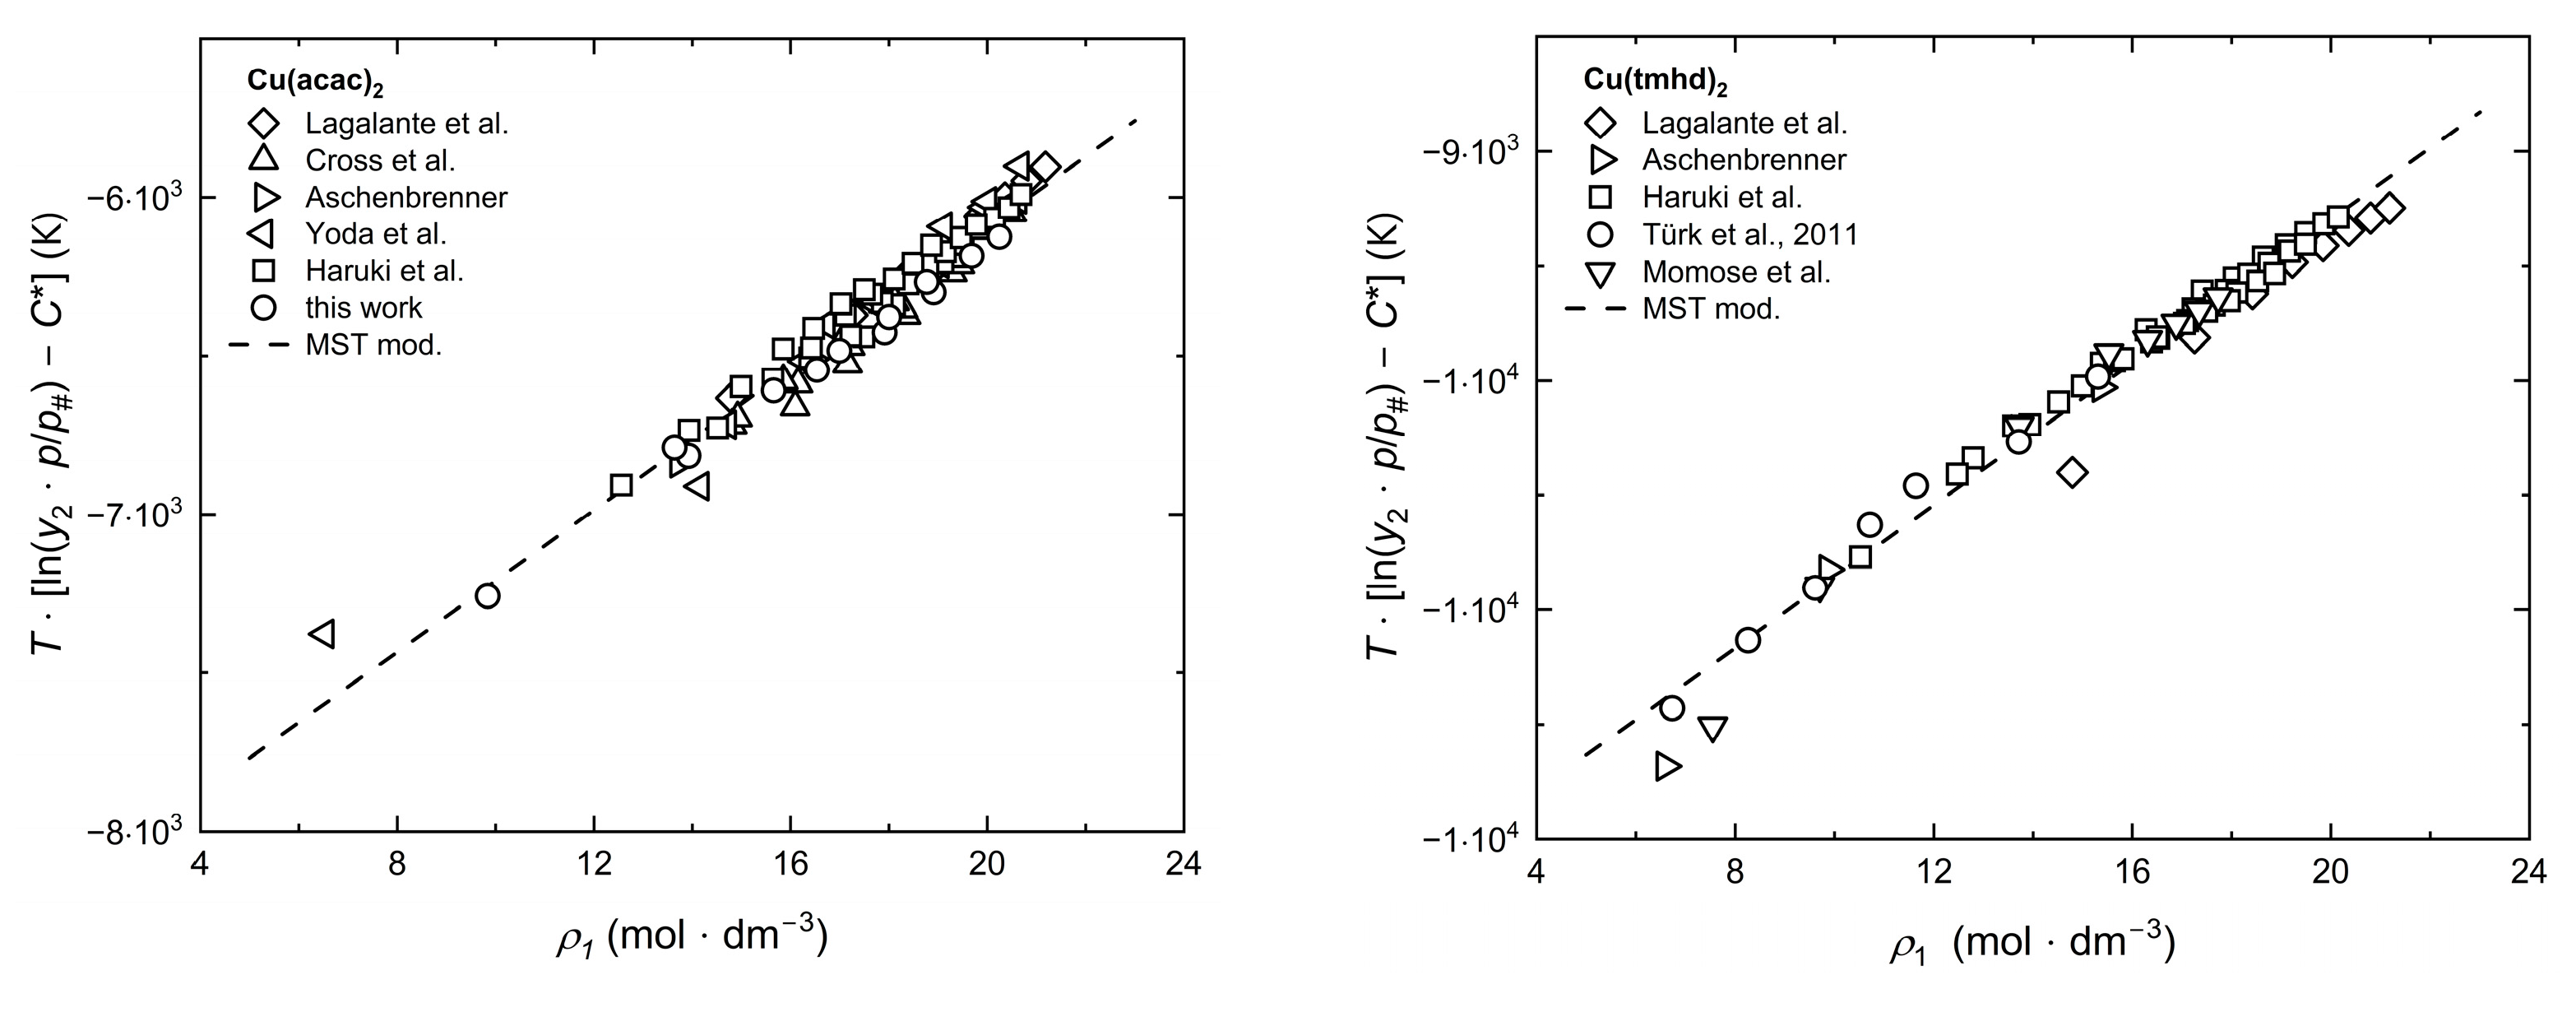
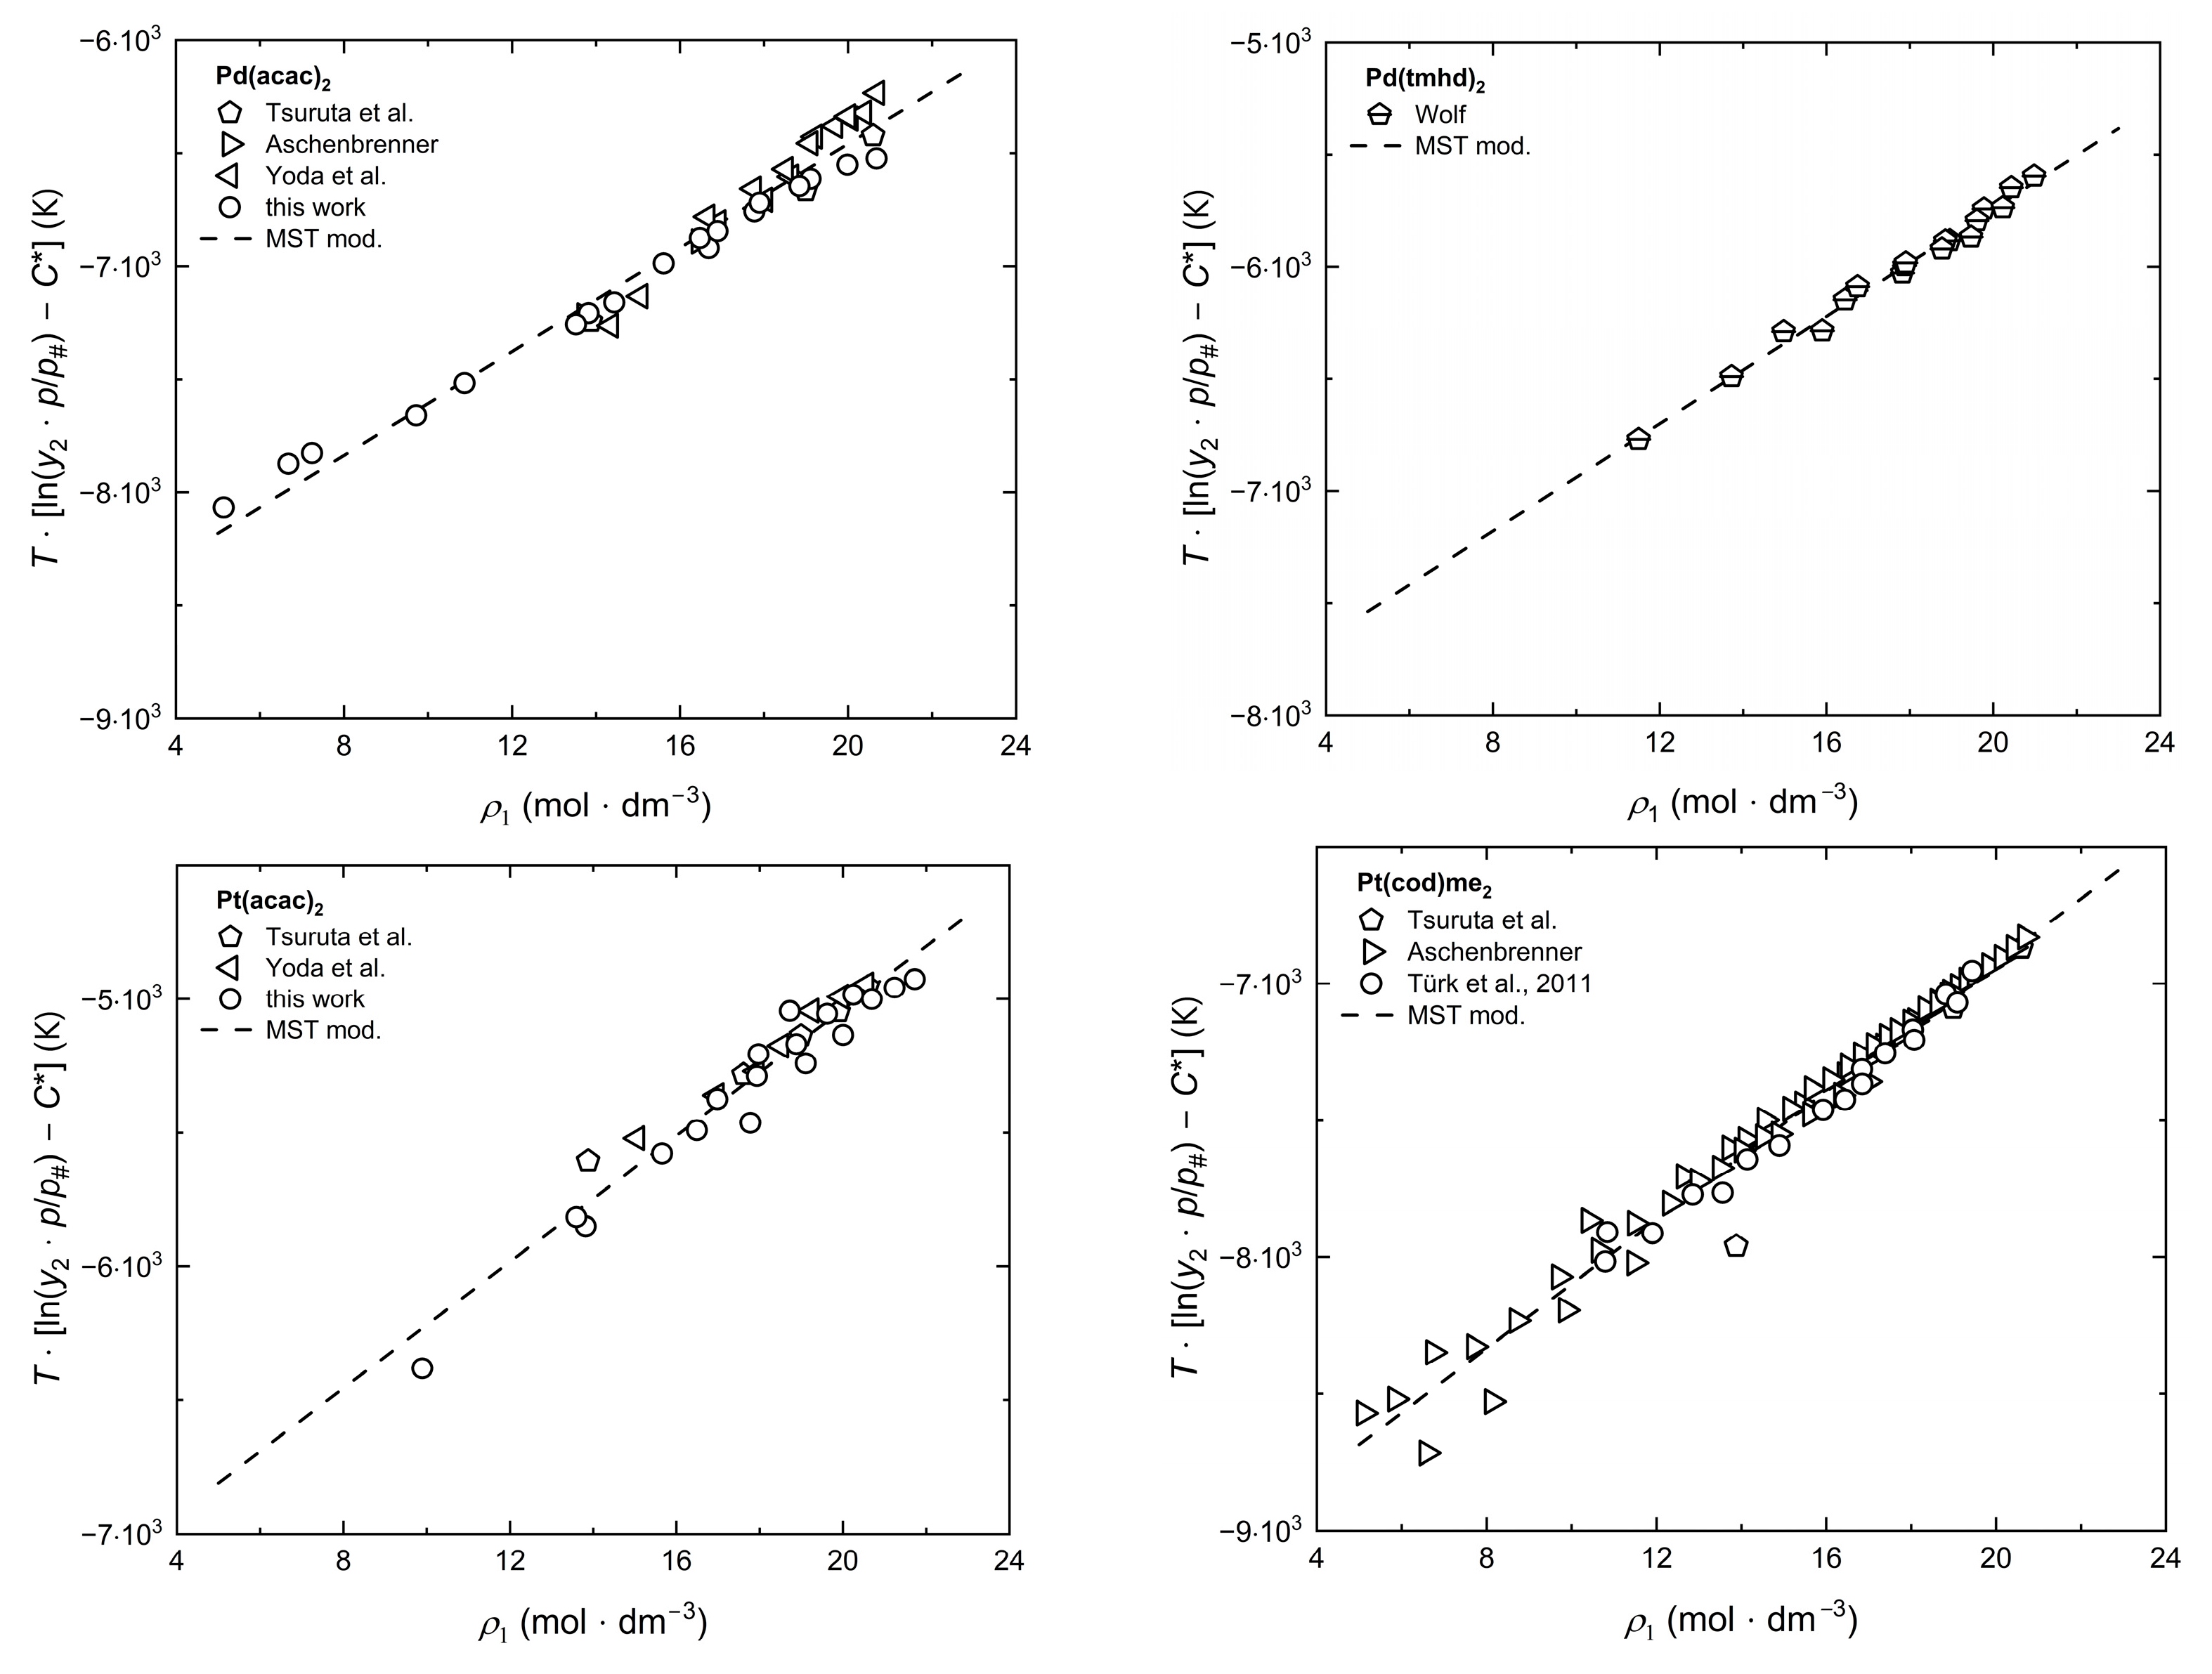
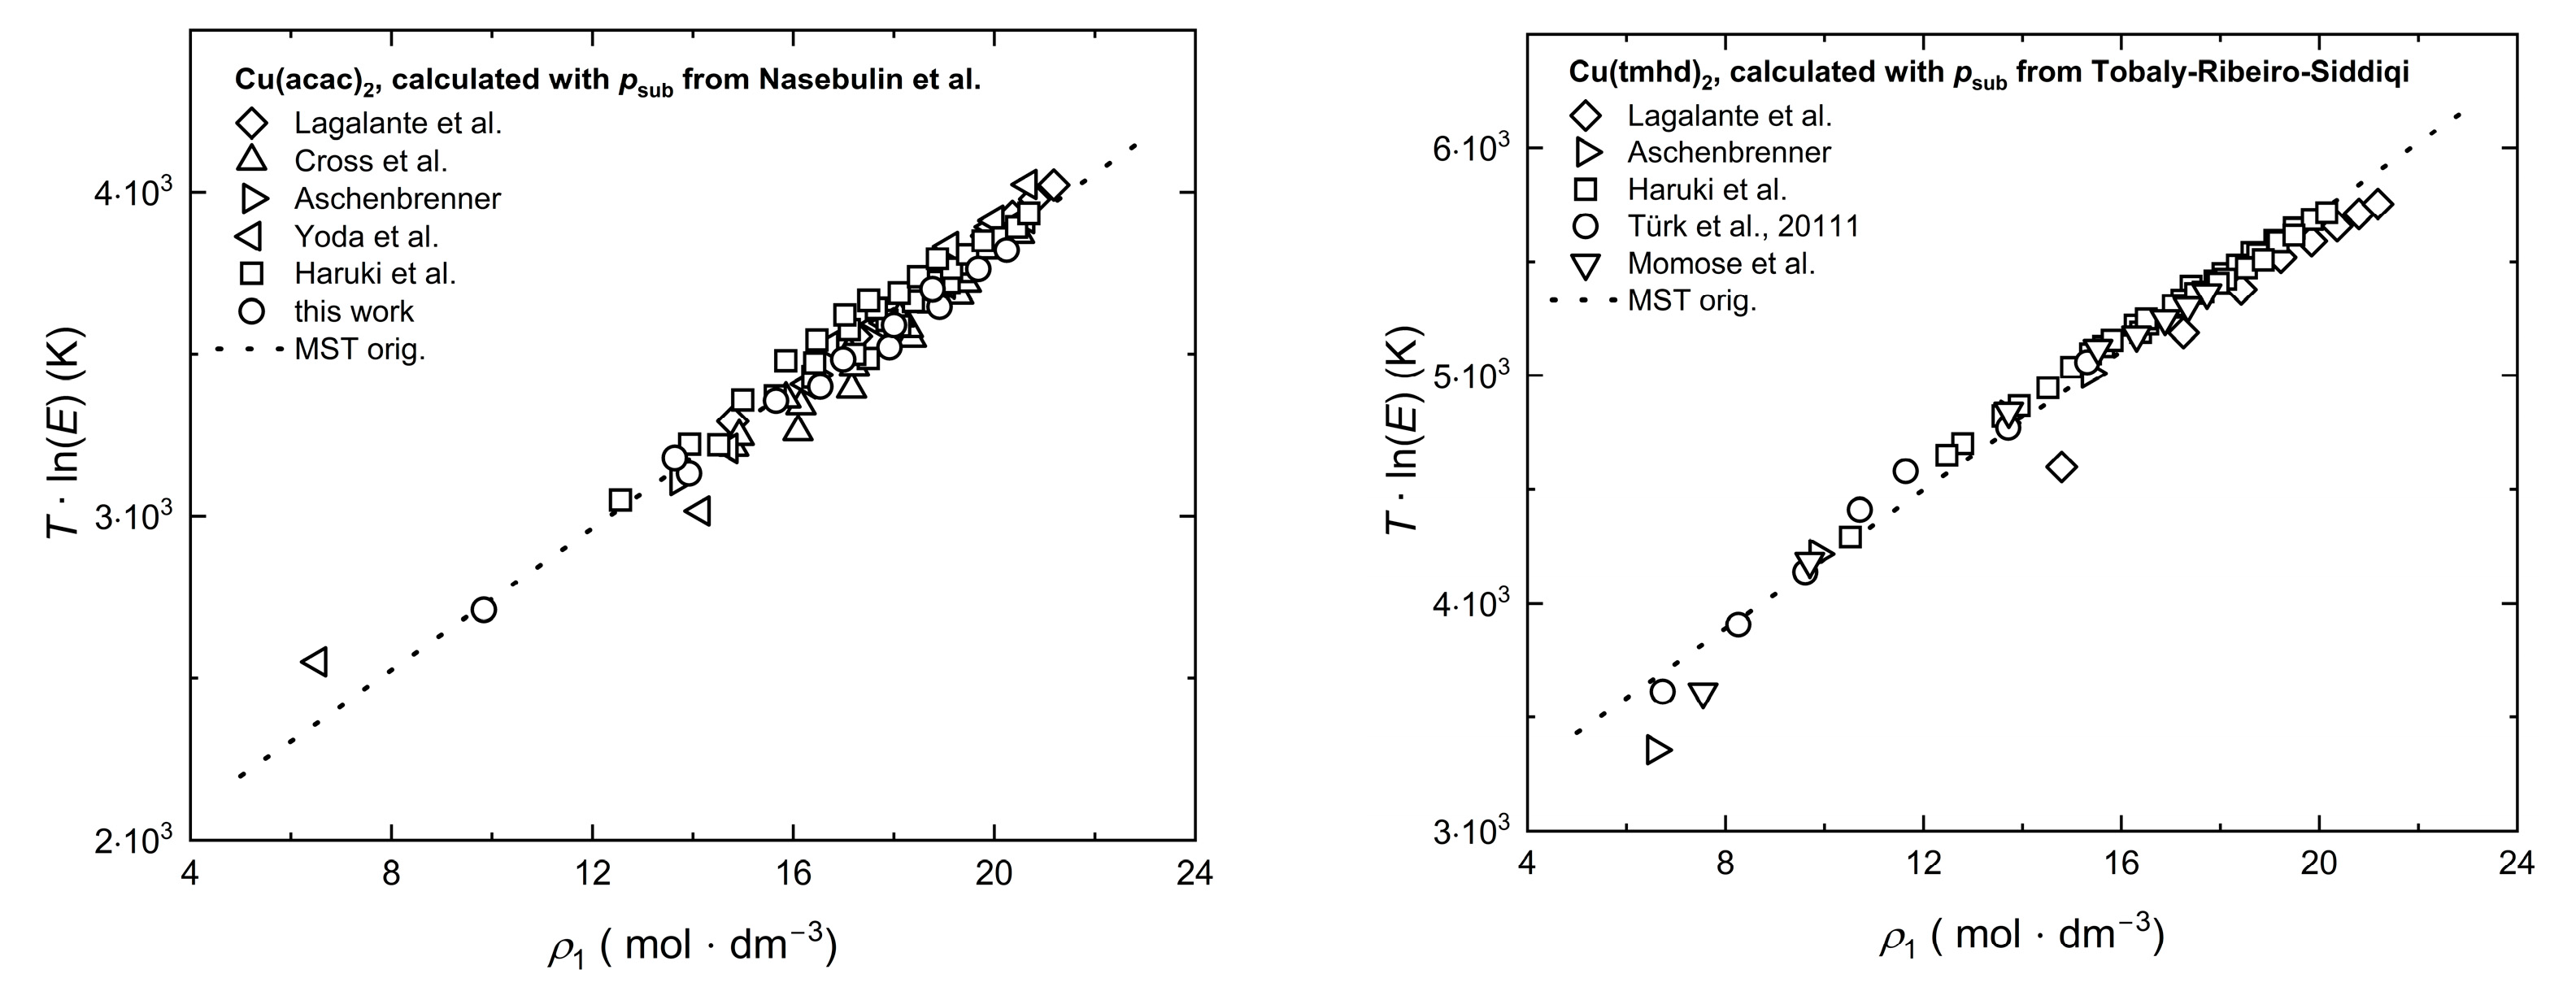
Figure 2 shows exemplary results for the consistency tests with MST mod. For the sake of completeness, the consistency tests with Chrastil, KJ ext., Bartle ext., and MST orig. are depicted in Figure A1, Figure A2, Figure A3 and Figure A4 in Appendix B. From these figures, the model approach and the experimental solubility data confirm the consistency of the experimental solubility data across all temperatures.
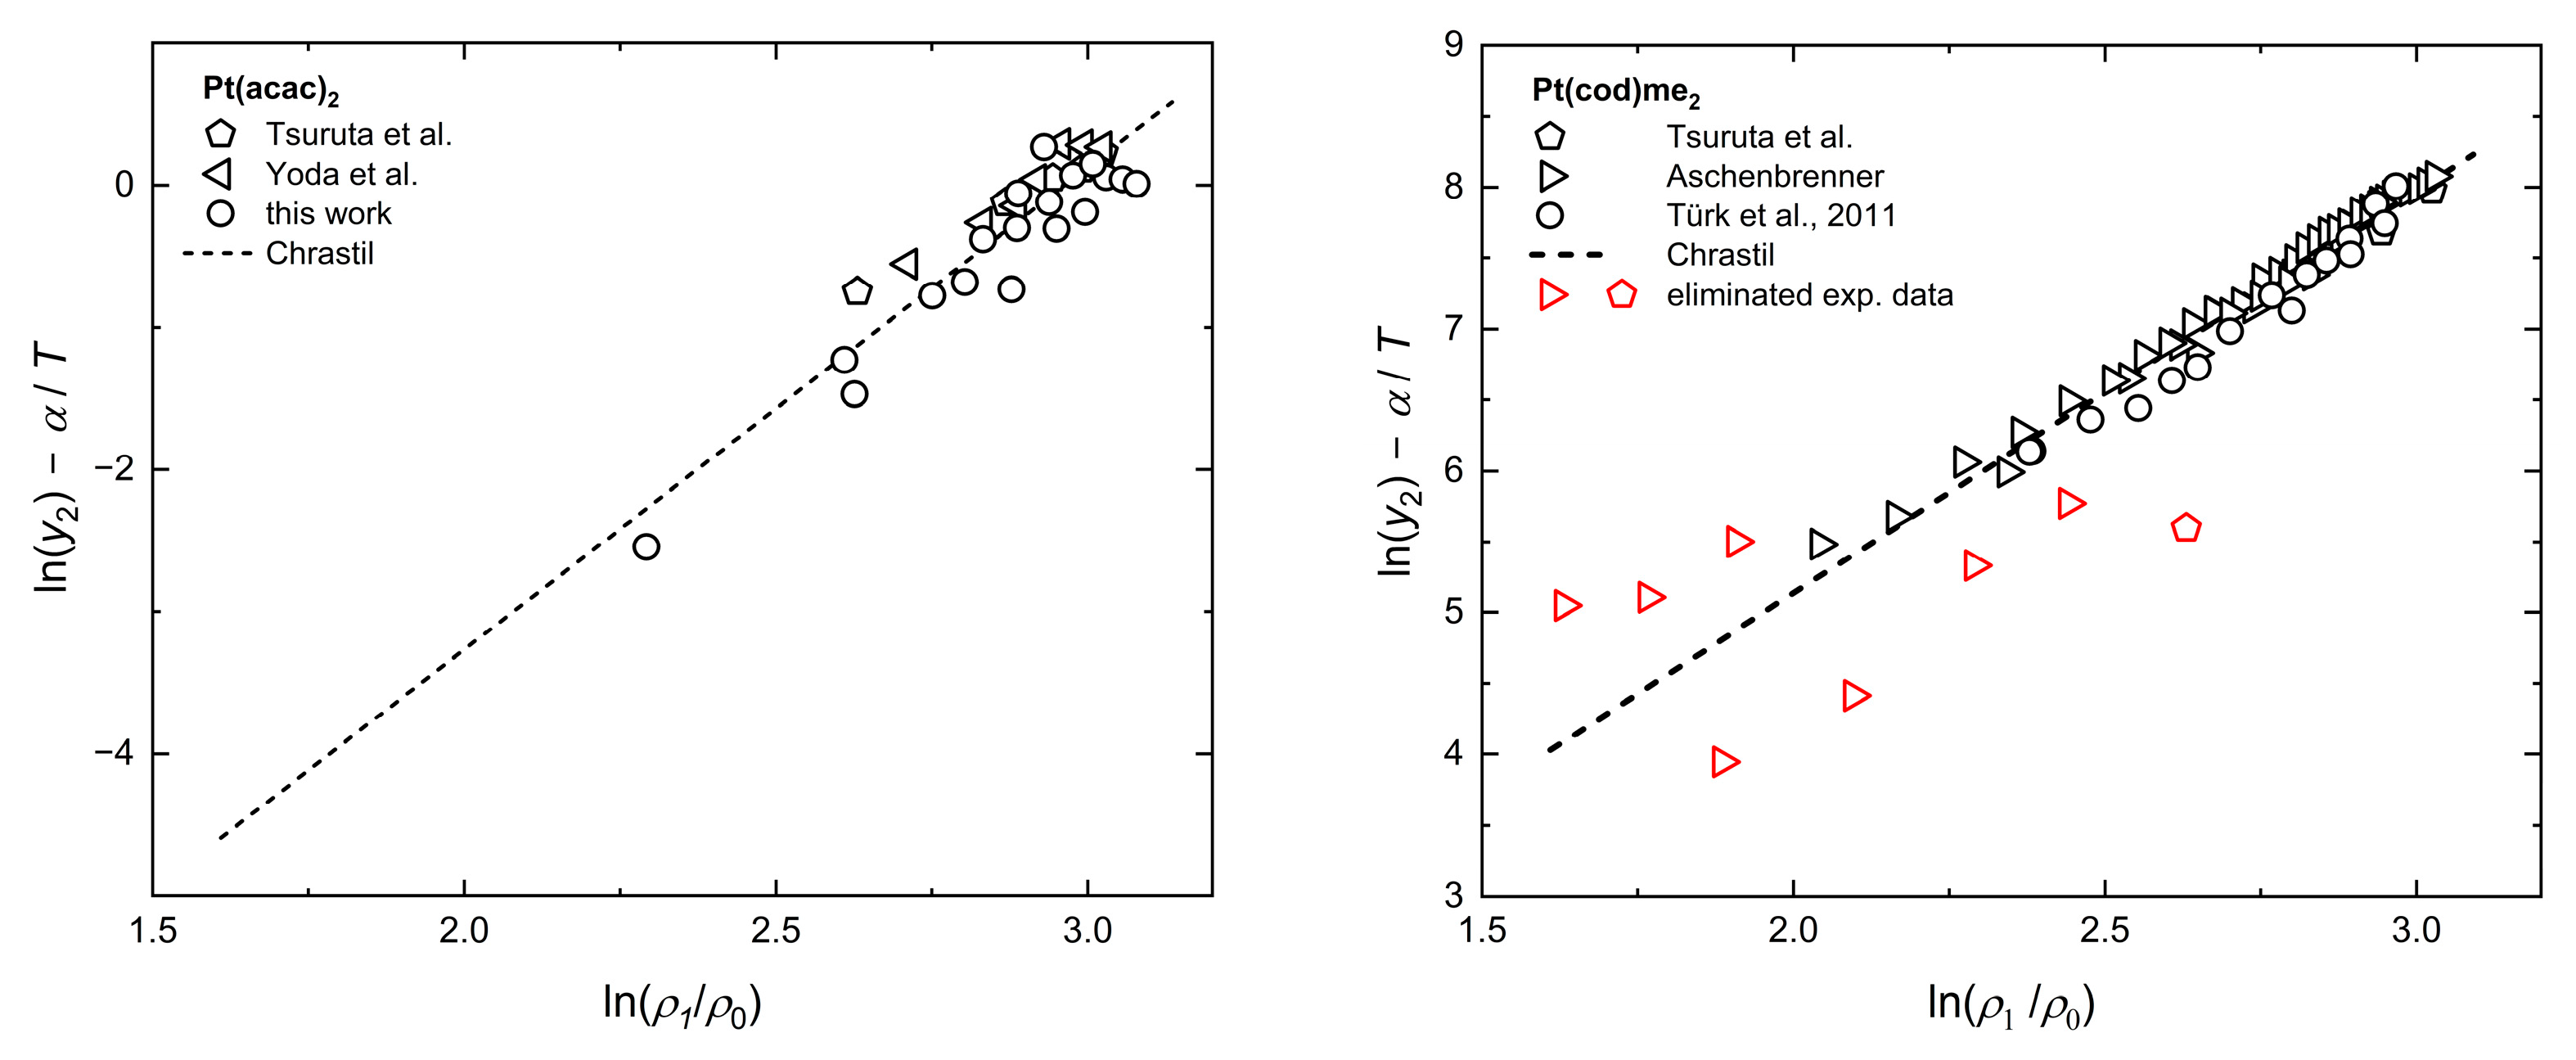
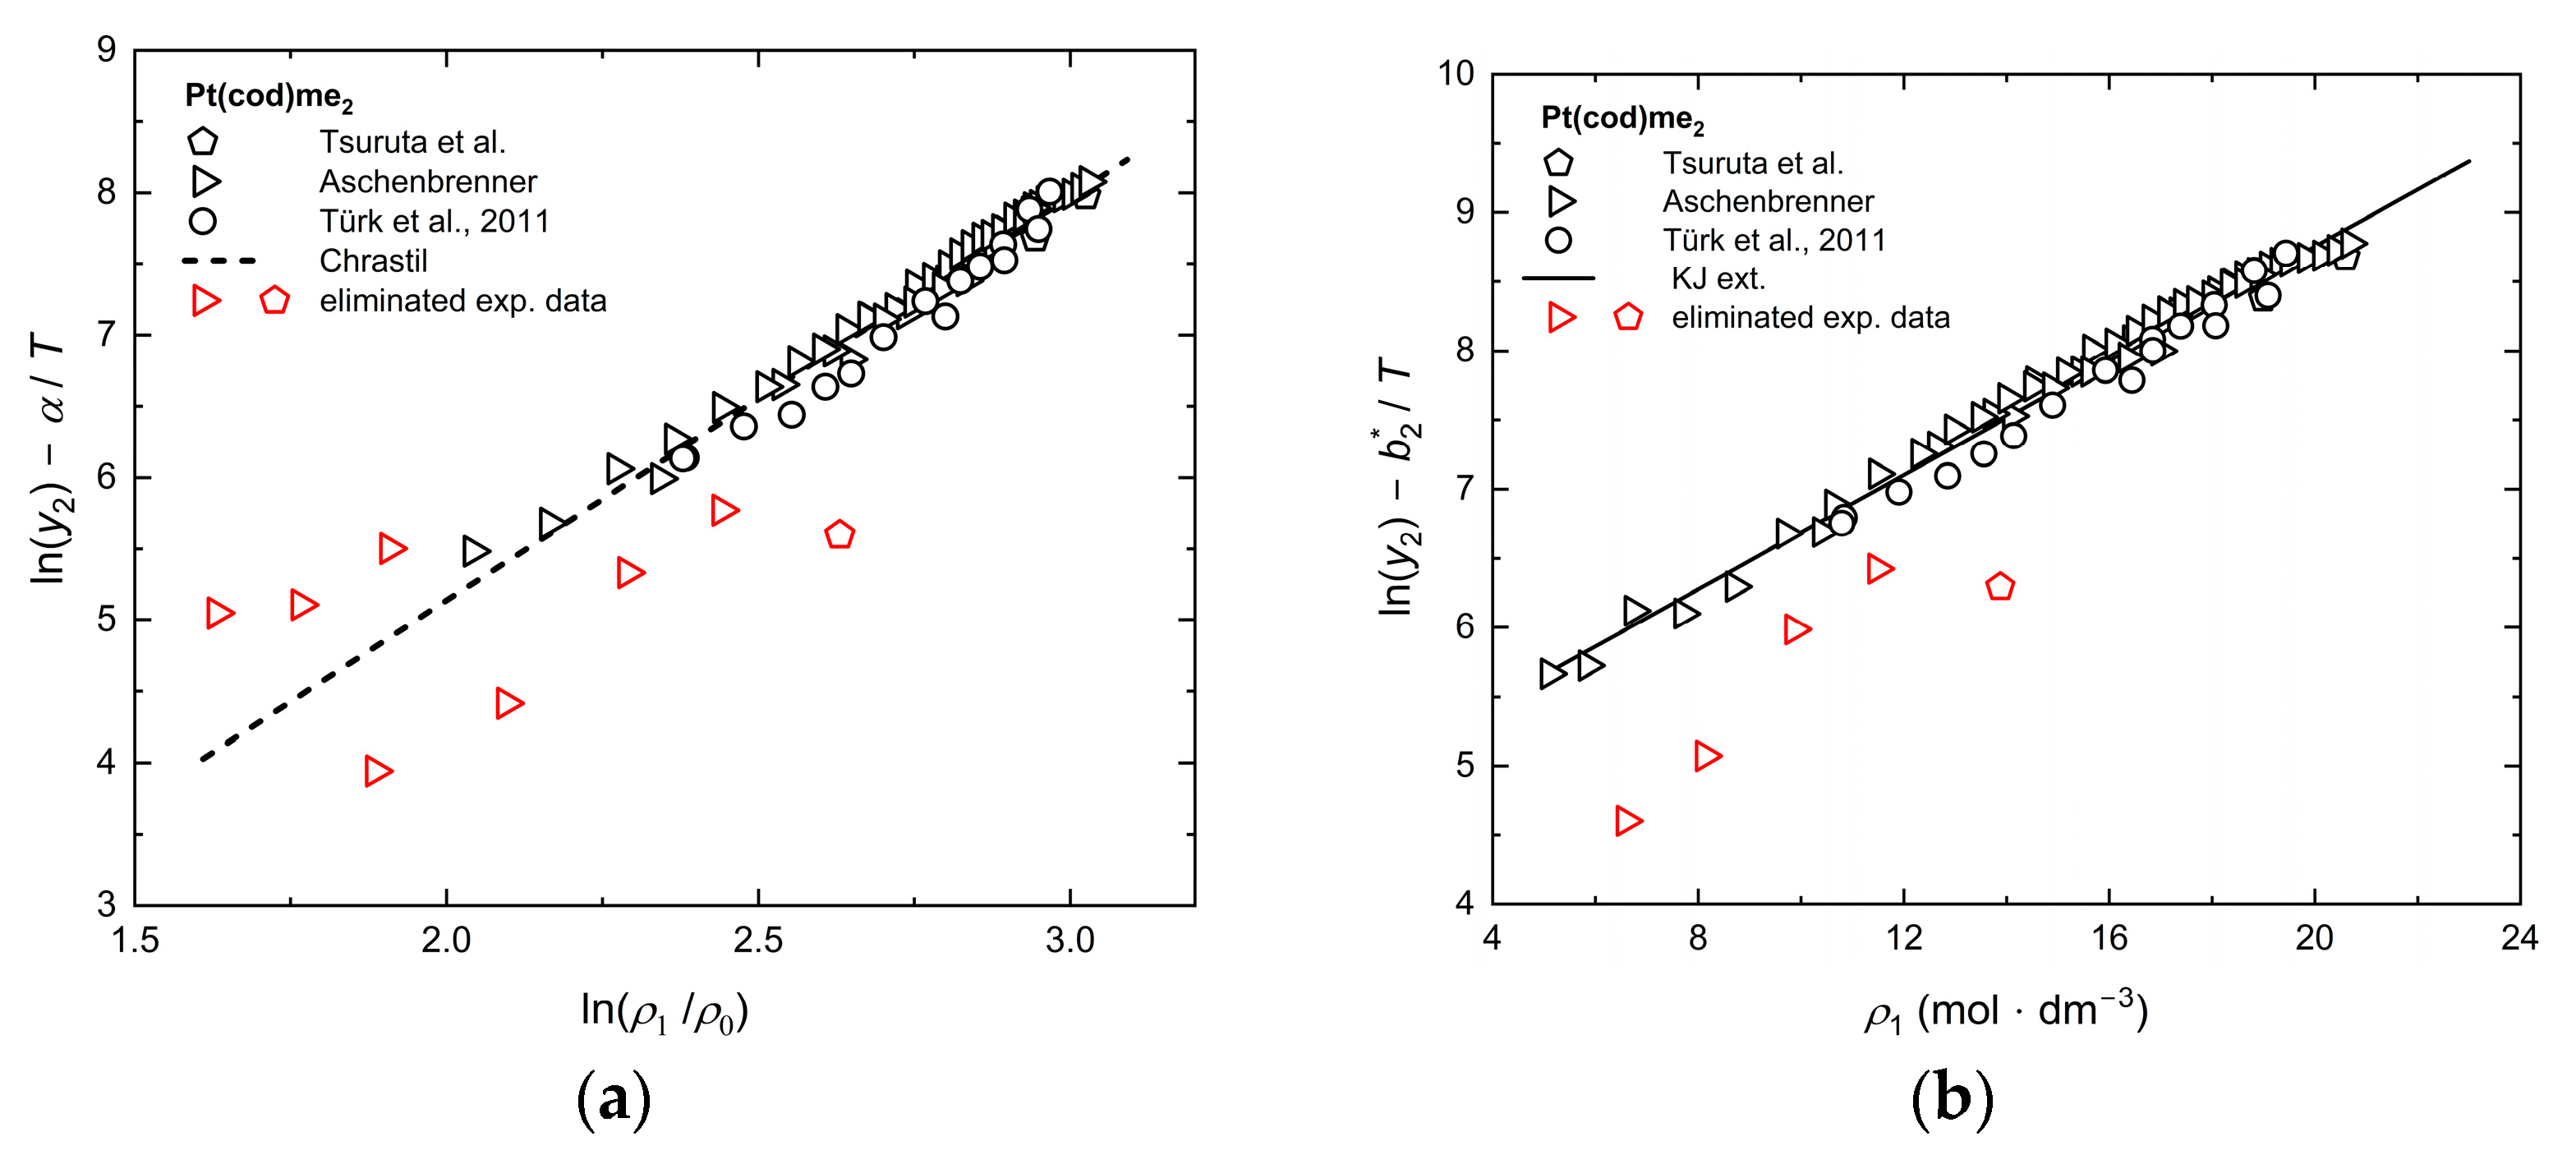
As shown in Figure 3 for the Chrastil (a) and KJ ext. (b) models, significant deviations from the linear trend were observed for some solubility data from Aschenbrenner [45] and Tsuruta et al. [50] for Pt(cod)me2 in scCO2. Therefore, the data at 333 K and 10 MPa, 11 MPa, 12 MPa, and 13 MPa, as well as at 313 K and 9.8 MPa, were excluded for fitting the model parameters of KJ ext., and additionally, the data at 353 K and 10 MPa and 11 MPa and 12 MPa were excluded for fitting the Chrastil model. This improved the R a d j 2 value for the KJ ext. approach from 0.93 to 0.98, and for Chrastil, from 0.90 to 0.97.
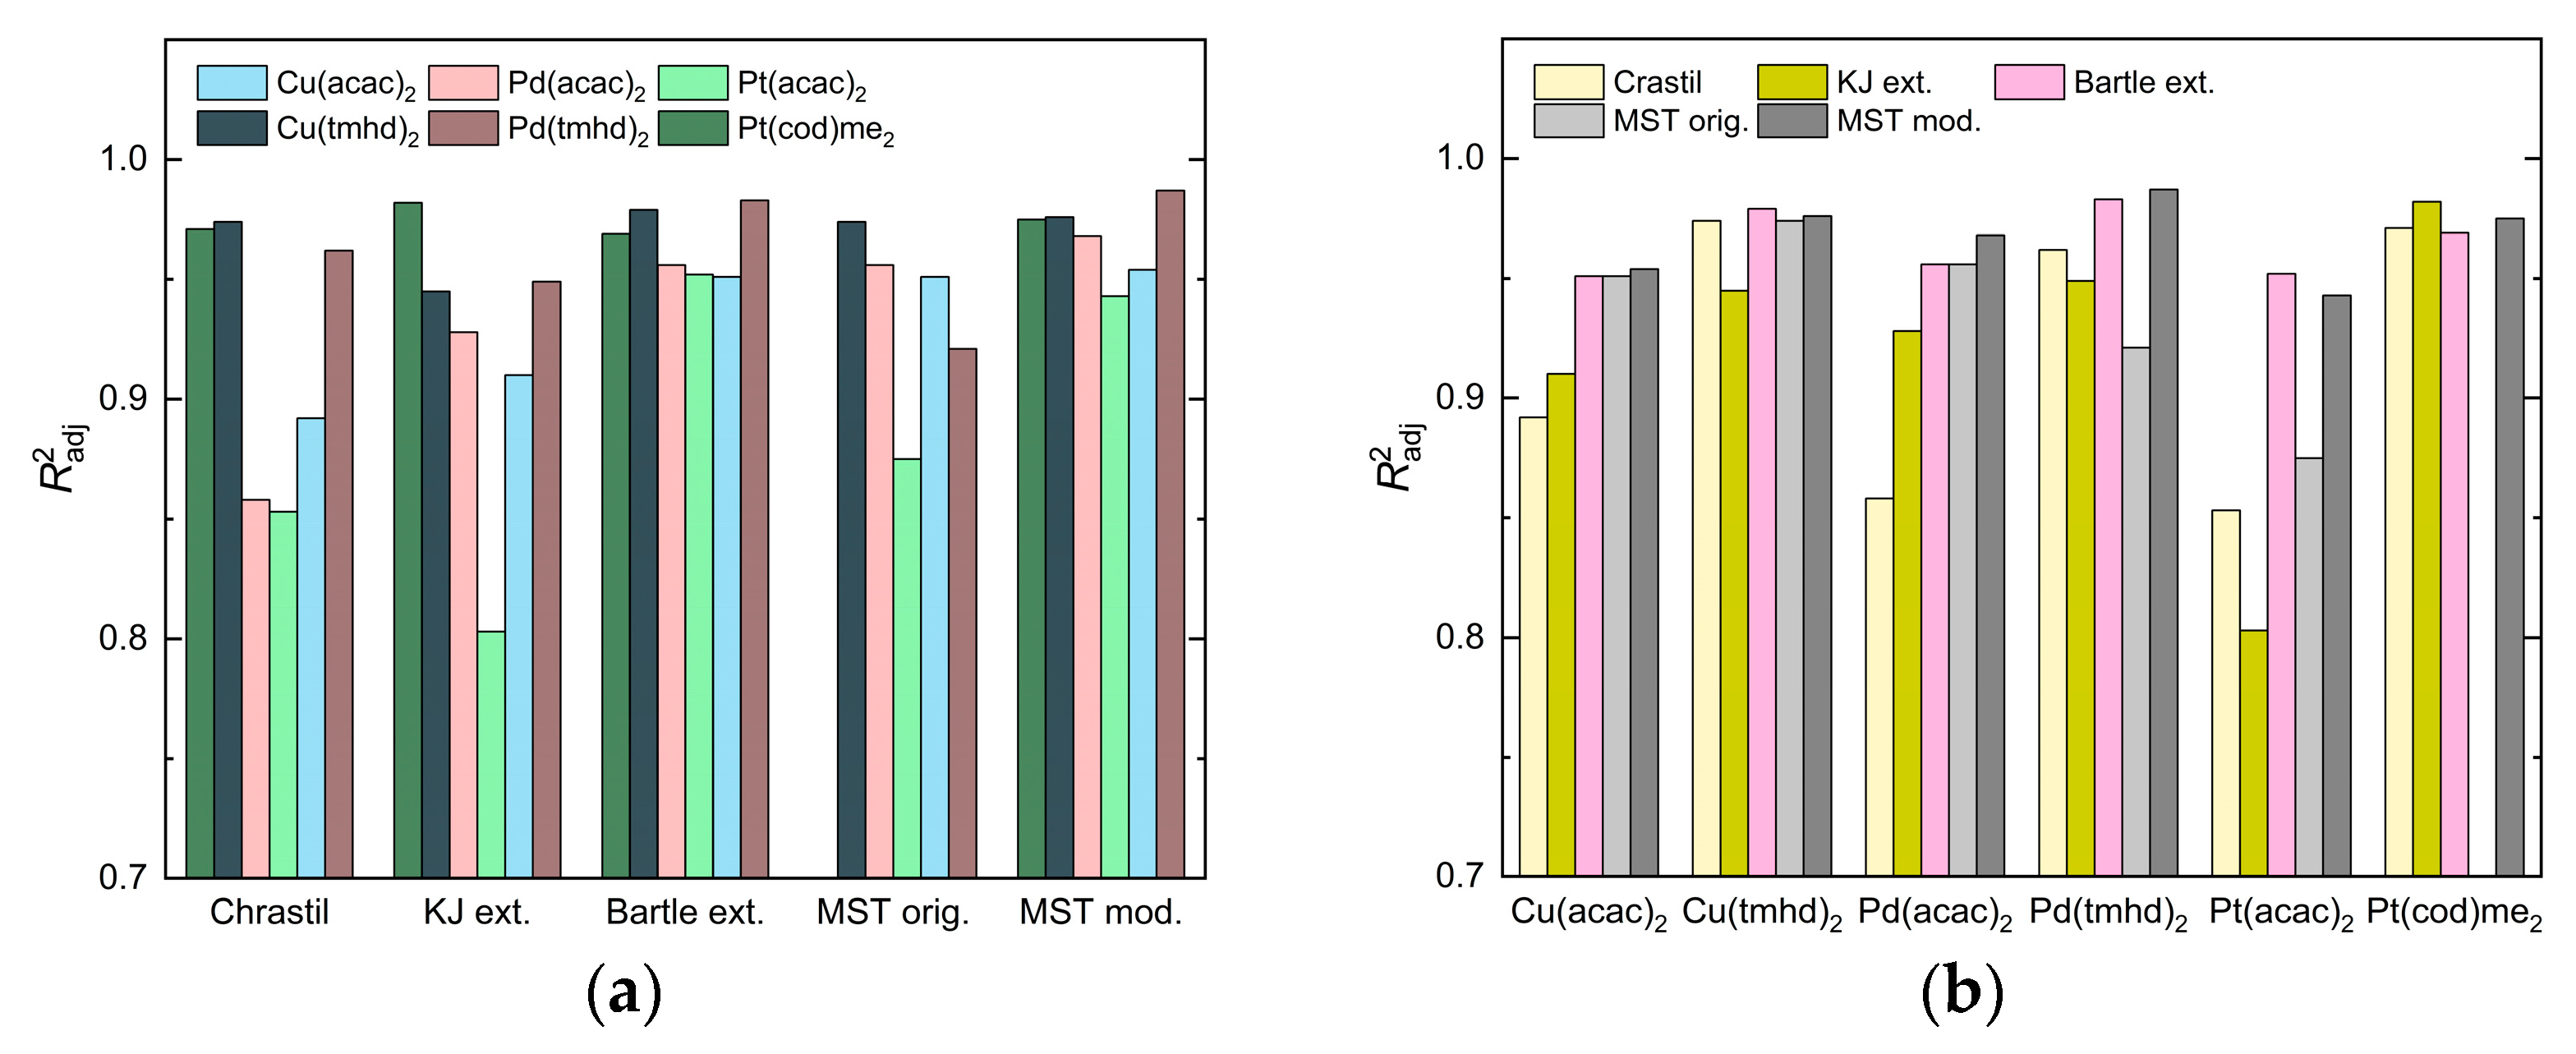
Table 5 and Figure 4 shows that the R a d j 2 values range from 0.85 to 0.97 for Chrastil, from 0.80 to 0.98 for KJ ext., from 0.95 to 0.98 for Bartle ext., from 0.88 to 0.97 for MST orig., and from 0.94 to 0.99 for MST mod. Thus, the best fit of the respective model parameters was achieved with Bartle ext. and MST mod. Among the different precursors examined, the best fit was received for Cu(tmhd)2 and Pd(tmhd)2 when applying the Bartle ext. and MST mod. approaches. For the three (acac)2 precursors, the Chrastil approach yields the lowest R a d j 2 values (<0.9), while the highest R a d j 2 values were obtained for Cu(tmhd)2, Pd(tmhd)2, and Pt(cod)me2 (>0.96).

2.5. Correlation of Experimental Solubility Data

The results for modeling the solubility behavior of the various precursors in scCO2 with Equations (1)–(4) and (7) are summarized in Table 6 along with the A A R D values and are depicted in Figure 5. This shows that the mean overall A A R D values are 15.0% for Chrastil, 16.4% for KJ ext., 17.6% for Bartle ext., 22.3% for MST orig., and 17.0% for MST mod. Looking at the individual precursors, the mean overall A A R D values are 14.6%, 20.6%, 24.1%, 11.5%, 22.1%, and 12.8% for Cu(acac)2, Cu(tmhd)2, Pd(acac)2, Pd(tmhd)2, Pt(acac)2, and Pt(cod)me2, respectively.
In order to interpret these results with regard to the required system ( ρ , T , p ) and solid ( p 2 , s u b ) properties in more detail, the following must be taken into account: in the case of Chrastil and KJ ext., only the density and temperature data are required, i.e., y 2 = f ρ ,   T , while for Bartle ext. and MST mod., in addition to the density and temperature, the pressure is required, i.e., y 2 = f ρ , T , p . Moreover, for MST orig., the sublimation pressure is needed, i.e., y 2 = f ρ , T , p ,   p 2 , s u b .
In summary, it can be said that the Chrastil and KJ ext. models show better agreement between the experimental and calculated solubility data than the Bartle ext., MST mod., and MST orig. models. It should also be noted that, as pointed out by Kautz et al. in detail, the introduction of a fourth adjustable parameter does not significantly improve the correlation [25]. In addition, the quality of the data representation seems to decrease when, as in the case of Bartle ext. and MST mod., the pressure is included. Thus, Chrastil’s simple model leads to the best results and remains, therefore, a reliable model for describing the solubility of such precursors in scCO2.
Since the measured and controlled property in technical processes is pressure rather than density, it is important to have information regarding the influence of pressure and temperature on solubility y 2 . The correlation results obtained with the Chrastil and KJ ext. models are depicted in Figure 6, which shows solubility y 2 as a function of pressure at different temperatures for the three (acac)2 precursors.
Cross et al. showed that the PR EoS, in combination with the van der Waals-1 mixing rules, is able to correlate the Cu(acac)2 solubility data in the range from 308 to 328 K and a CO2 density up to 0.9 g · c m 3 (=20 m o l · d m 3 , respectively) well if k i j is modeled as a temperature-dependent interaction coefficient [40].
Upper used the PR EoS together with the van der Waals-1 mixing rules to correlate the solubility of Pt(cod)me2 in scCO2, and the obtained A A R D values were 6.4% at 313 K, 12.7% at 333 K, and 21.4% at 353 K. However, significantly greater deviations were observed when using the Redlich–Kwong–Soave EoS [26].
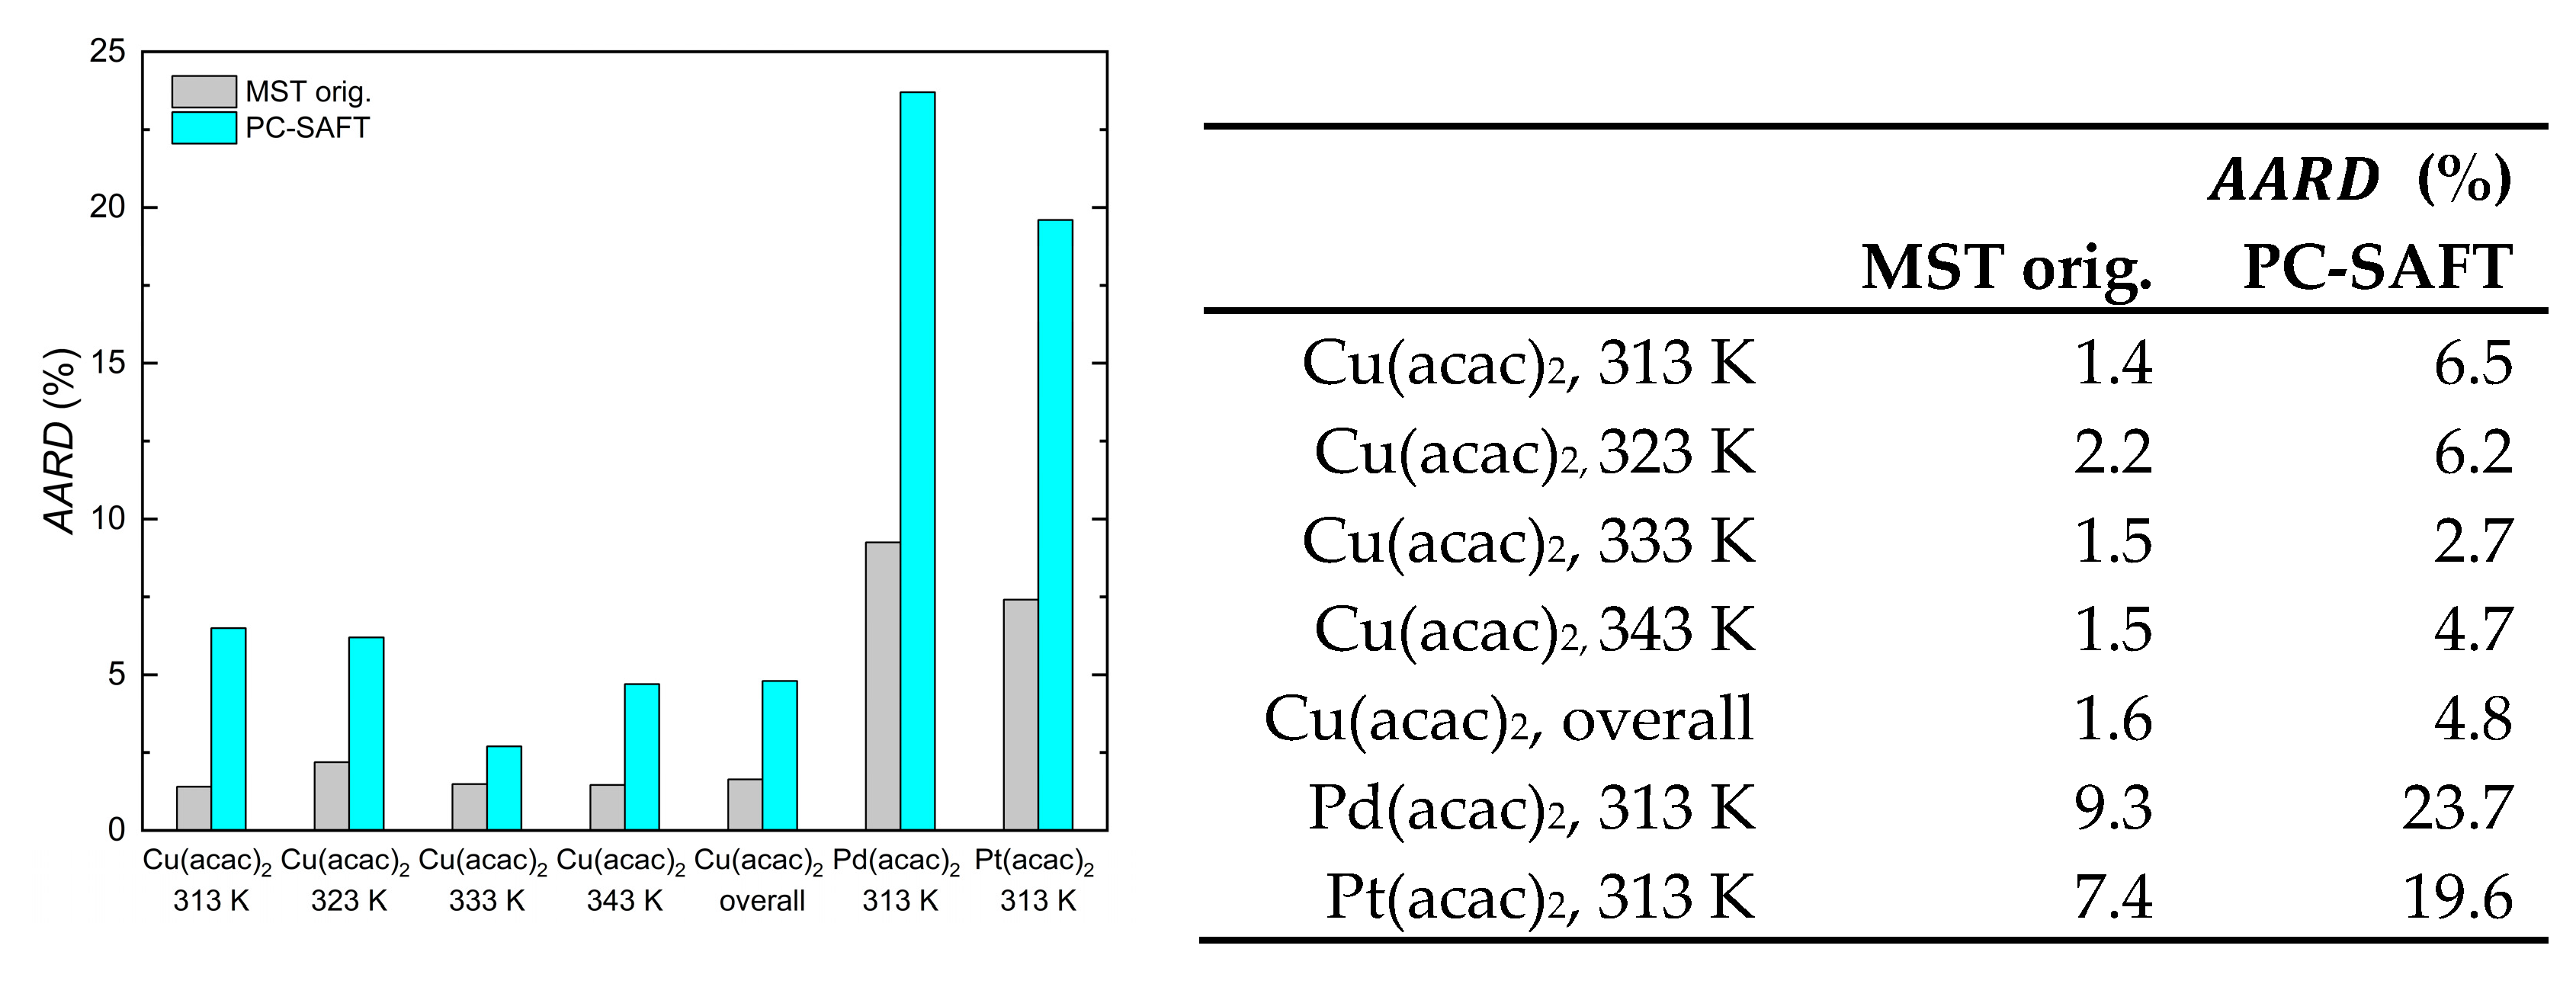
Ushiki and coworkers applied the PC-SAFT EoS for modeling the solubility of, among others, six (acac)x precursors in scCO2 [14,30], published in the literature for Cu(acac)2, Pd(acac)2, and Pt(acac)2 [46,47]. The pure component parameters (i.e., the segment diameter, segment number, and dispersion energy) for the different precursors were determined by fitting experimental solubility data in organic solvents. Thereby, the binary interaction parameter k i j was set to zero. The pure component parameters determined in this way were then used to calculate the solubility of the precursors in scCO2 for each isotherm and compared with the experimental data. Thereby, it must be noted that for Cu(acac)2 as well as Pd(acac)2 and Pt(acac)2, the individual k i j values were adjusted isothermally [14,30]. In contrast to the results for the Cu(acac)2, Pd(acac)2, and Pt(acac)2 given in Table 6, the A A R D values for MST orig., given below, were obtained by isothermal fitting in order to compare them directly with the PC-SAFT results from Ushiki et al.
In the case of PC-SAFT, A A R D values of 4.8% for Cu(acac)2, 24% for Pd(acac)2, and 20% for Pt(acac)2 were achieved. The detailed comparison of the different A A R D values obtained from calculating the solubility data, either with the MST orig. model or the PC-SAFT EoS, is illustrated in Figure 7 and demonstrates that significantly better results were achieved with the MST orig. model. In short, the A A R D values are up to three times lower when the MST orig. model is used instead of the PC-SAFT EoS.

2.6. Estimation of Dissolution, Sublimation, and Solvation Enthalpies

As noted in Section 2.1.2, the Chrastil and Bartle et al. models include an energy term that is the coefficient of temperature term. The dissolution enthalpy ( Δ h d i s s ) is defined as the sum of solvation enthalpy ( Δ h s o l v ) and sublimation enthalpy ( Δ h s u b ). According to Chrastil, the enthalpy of dissolution can be estimated from the parameter α in the Chrastil model by the following relationship: Δ h d i s s = α · R 0 , where R 0 is the universal gas constant. Furthermore, as suggested by Bartle et al., the enthalpy of sublimation can be estimated from the parameter a 2 in the Bartle ext. model by Δ h s u b   = a 2 · R 0 . Finally, the enthalpy of solvation can then be calculated from the difference between the dissolution enthalpy and the sublimation enthalpy. The estimated values of these three enthalpies for the precursors investigated are summarized in Table 7. From these data, the following trends are observed for Δ h d i s s and Δ h s u b : Cu(tmhd)2 > Pt(cod)me2 > Pd(acac)2 > Cu(acac)2 > Pd(tmhd)2 > Pt(acac)2. For the absolute values of Δ h s o l v holds: Pd(cod)me2 > Pd(acac)2 > Cu(acac)2 = Cu(tmhd)2 > Pt(acac)2 > Pd(tmhd)2. However, the enthalpic properties derived should not be accepted unconditionally but should, at best, be seen as a rough estimate [25].
In general, from the data given in Table 7, it follows that precursor sublimation and solvation were endothermic and exothermic processes, respectively. Furthermore, the calculated solvation enthalpy indicates the presence of non-negligible intermolecular interactions between the precursors and CO2 molecules in the binary system.

3. Materials and Experimental Methods

3.1. Materials

In this paper, experimental determined solubility data for the metal precursors Cu(acac)2, Pd(acac)2, and Pt(acac)2 in scCO2 are reported. Detailed specifications of the substances investigated are listed in Table 8. The precursors were used as received. Usually, the experiments were performed at temperatures ranging from 313 to 353 K and pressures ranging from 10 to 40 MPa, respectively.

3.2. Experimental

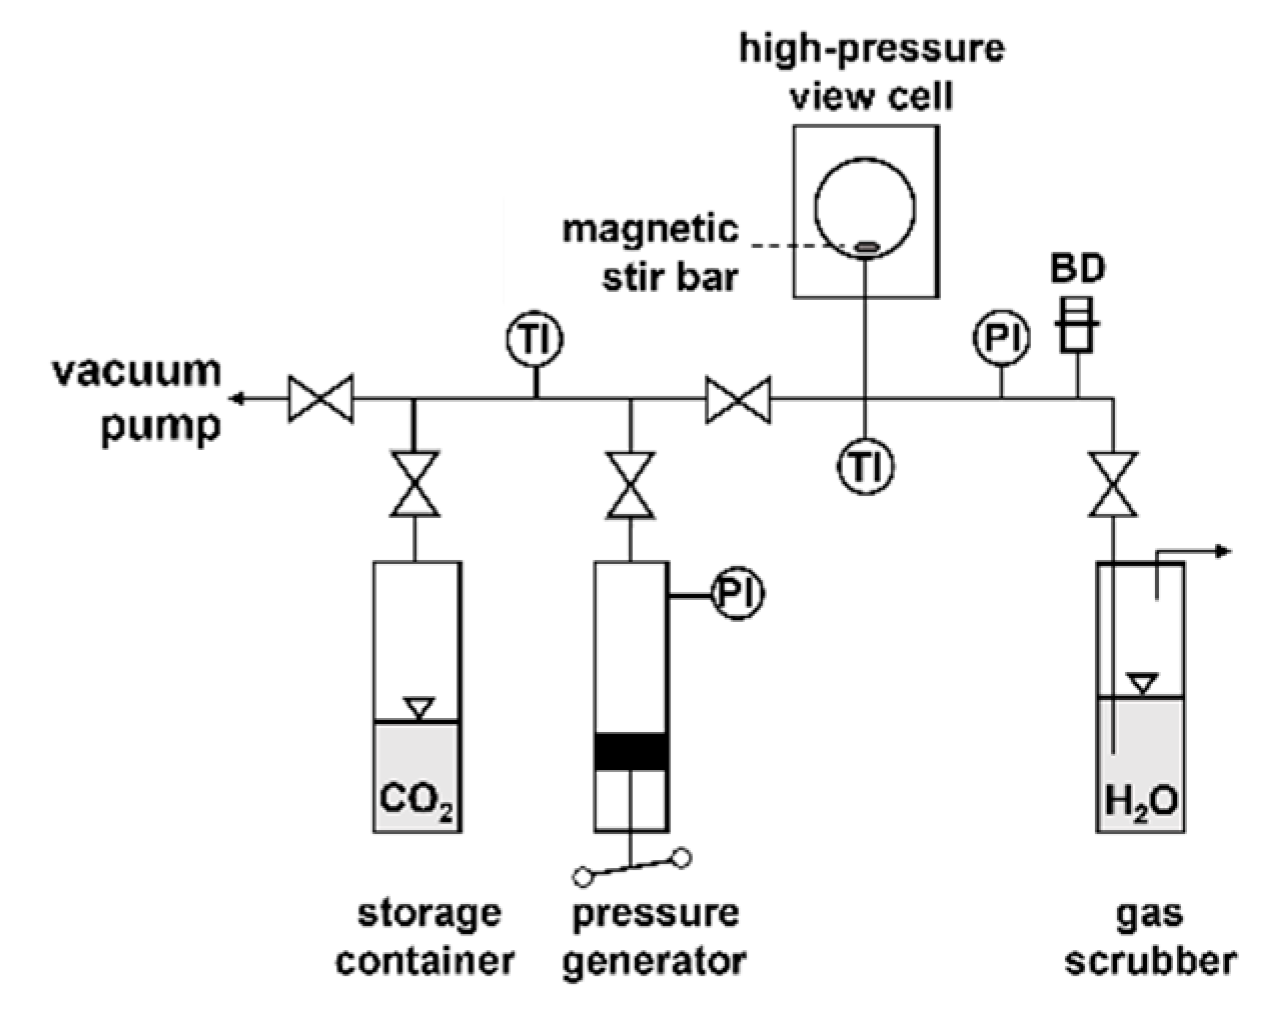
The solubilities of the different precursors in scCO2 were determined using a static method [51] coupled with the gravimetric analysis described by Sherman et al. in detail [52]. As a rule, a considerable excess of precursor was weighed into an open stainless steel sample container using a precision scale (Mettler Toledo, Gießen, Germany; type XS 105 DU, ±0.02 mg) and loaded into the high-pressure view cell (SITEC-Sieber Engineering, Maur (Zurich), Switzerland; type 740.2027). Afterward, the view cell was evacuated, and with 2 silicone heating jackets (LCS Isotherm, Frankfurt a. M., Germany; 30 VAC, 60 Watt), heated to the target temperature using a temperature controller (Eurotherm, Limburg an der Lahn, Germany; type 2116). As soon as the target temperature was reached, the desired CO2 pressure was adjusted by a pressure generator (SITEC-Sieber Engineering, type 750.1100). For improved mixing of the supercritical mixture, a magnetic stir bar was placed inside the view cell. These conditions were held for 20 h to dissolve the precursor in scCO2. Thereafter, the view cell was slowly depressurized ( Δ p / Δ t < 0.3 M P a · m i n 1 ), opened, and the sample container was reweighed. The difference between the initial and final mass of the precursor thus gave the amount of precursor dissolved in scCO2. The amount of CO2 filled into the view cell was determined by weighing the CO2 storage container with a scale (Mettler Toledo, PM 6100, ±0.02 g) before and after filling CO2 into the view cell. The uncertainty in solubility y 2 = y 2 , m a x y 2 , m i n was calculated with the y 2 , m a x and y 2 , m i n determined with the uncertainties in mass determination (see above), using the respective precursor and CO2 masses.
The temperature in the high-pressure view cell was measured with a thermocouple (Thermocoax, Caligne, France; type K—NiCrNi) combined with a temperature indicator (Eurotherm, type 2116), which was calibrated beforehand against a Pt-25 thermometer (Anton Paar GmbH, Graz, Austria; type MKT-25, ±0.001 K) provided with a National Bureau of Standards certificate. The accuracy of the temperature measurement was within the total limit of ±0.2 K.
A piezoresistive pressure transmitter (WIKA GmbH, Klingenberg, Germany; type S10) combined with a pressure indicator (WIKA GmbH, type Tronic Line), which were calibrated beforehand against a high-precision standard dead-weight gauge (Desgranges & Hout, DH Budenberg Huntington Beach, CA, USA; 5203 S, ±0.01 %), was used to measure the system pressure. The total uncertainty of the pressure measurement was within ±0.02 MPa. The uncertainties in the density ( Δ ρ 1 / ρ 1 ) resulting from the measurement uncertainties for temperature and pressure are listed in Table 1, Table 2 and Table 3. The uncertainty in density ρ 1 = ρ 1 , m a x ρ 1 , m i n was calculated with ρ 1 , m a x and ρ 1 , m i n using the temperature and pressure uncertainties given above (Figure 8).

4. Conclusions

The solubilities of Cu(acac)2, Pd(acac)2, and Pt(acac)2 in scCO2 were measured at temperatures ranging from 313 to 353 K and pressures from 10 to 40 MPa. As a result, the solubility of the different (acac)2 precursors in scCO2 ranges from y 2 = 9·10−6 to 1.2·10−4  m o l · m o l 1 and increases as follows: Cu(acac)2 < Pt(acac)2 < Pd(acac)2. These data, together with the solubility data for Cu(tmhd)2, Pd(tmhd)2, and Pt(cod)me2 in CO2, partly reported earlier, and numerous data from the literature were correlated using semi-empirical density-based models, namely Chrastil, KJ ext., Bartle ext., and Méndez–Santiago–Teja mod. (MST) with three model parameters and the original MST model with two model parameters. Based on the A A R D values, the order for the ability to correlate the solubility is: Chrastil > KJ ext. > MST mod. > Bartle ext. > MST orig.
Thus, Chrastil’s three-parameter model shows the best results, considering the fact that only density and temperature data are required for parameter adjustment. In addition, the quality of the data representation seems to decrease when, as in the case of Bartle ext. and MST mod., the pressure is included. From an engineering point of view, the simple density-based models provide sufficiently accurate results in the correlation of the experimental solubility data. Furthermore, the density-based models provided a significantly (by a factor of three) better fit of the solubility data than the PC-SAFT EoS. Finally, based on the Chrastil and Bartle ext. models, the dissolution, sublimation, and solvation enthalpies of the metal precursors investigated were derived.

Author Contributions

Conceptualization, M.T.; methodology, M.C. and M.T.; software, M.C.; validation, M.C. and M.T.; formal analysis, M.T.; investigation, M.C.; data storage, M.C.; writing—original draft preparation, M.C. and M.T.; writing—review and editing, M.C. and M.T.; supervision, M.T.; funding acquisition, M.T. All authors have read and agreed to the published version of the manuscript.

Funding

This research was funded primarily by the Deutsche Forschungsgemeinschaft (DFG) Project-ID 426888090—SFB 1441, project C1, which the authors gratefully acknowledge.

Institutional Review Board Statement

Not applicable.

Informed Consent Statement

Not applicable.

Data Availability Statement

The data that support the findings of this study are available from the corresponding author upon reasonable request.

Acknowledgments

We would like to thank Manuel Hohm for his support in the use of the Bartle ext. and KJ ext. models.

Conflicts of Interest

The authors declare that they have no known competing financial interests or personal relationships that could have appeared to influence the work reported in this paper.

Abbreviations

The following abbreviations are used in this manuscript:
Abbreviationunit
A A R D % average absolute relative deviation
acac acetylacetonate
calc calculated
CAS Chemical Abstracts Service
cod cyclooctadiene
Δ h s o l v k J · m o l 1 solvation enthalpy
Δ h s u b k J · m o l 1 sublimation enthalpy
Δ h d i s s k J · m o l 1 dissolution enthalpy
E enhancement factor
EoS equation of state
exp experimental
ext. extended
GCM group contribution method
K number of adjustable parameters in the correlation model
KJ Kumar–Johnston
M g · m o l 1 molar mass
m gmass
me methyl
mod. modified
MST Méndez–Santiago–Teja
N number of data points
n 1 m o l e mole CO2
n 2 m o l e mole precursor
NP nanoparticle
orig. original
p M P a pressure
p 0 P a = 1   P a , Equation (6)
p # M P a = 1   M P a , Equation (7)
p r e f M P a = 0.1   M P a , Equation (3)
p 2 , s u b P a sublimation pressure of the solid
PC-SAFT perturbed-chain statistical associating fluid theory
PR Peng–Robinson
R 0 J · m o l 1 · K 1 universal   gas   constant   ( = 8.314   J · m o l 1 · K 1 )
R 2 squared correlation coefficient
R a d j 2 adjusted squared correlation coefficient
ρ 0 m o l · d m 3 = 1   m o l · d m 3
ρ 1 m o l · d m 3 density of CO2
ρ c m o l · d m 3 = 10.5   m o l · d m 3
ρ r e f m o l · d m 3 = 15.90   m o l · d m 3 , Equation (3)
sc supercritical
SCF supercritical fluid
SFRD supercritical fluid reactive deposition
T K temperature
t m i n time
tmhd tetramethyl-3,5-heptandione
y 2 m o l · m o l 1 precursor solubility
Parameters…
α ,   β ,   γ parameters of the Chrastil model, Equation (1)
b 0   , b 1   , b 2   parameters of the KJ ext. model, Equation (2)
a 0 ,   a 1 ,   a 2 parameters of the Bartle ext. model, Equation (3)
A , B parameters of the MST orig. model, Equation (4)
a ,   b parameters of the Clausius-Clapeyron equation, Equation (6)
A , B ,   C parameters of the MST mod. model, Equation (7)

Appendix A. Sublimation Pressures

Parameters of the Clausius–Clapeyron equation for the different sublimation pressures used in the present investigation, together with the temperature range over which the data were determined, are listed in Table A1 [37,41,48,53,54,55,56].
Table A1. Parameters for Equation (6) and temperature range over which the data were determined.
T Range a b (K) Ref.
Cu(acac)2Nasebulin353–477 K24.5−9603[37]
Cu(tmhd)2Tobaly, Ribeiro, Siddiqi362–452 K37.7−14,392[41,53,54]
Pd(acac)2Morozova347–453 K33.6−13,425[55]
Pd(tmhd)2Igumenov348–398 K27.9−15,106[56]
Pt(acac)2Morozova332–453 K31.7−12,737[55]
Pt(cod)me2Hierso333–353 K17.2−5441[48]

Appendix B. Tests of Consistency with Chrastil, KJ Ext., Bartle Ext., and MST Orig.

Figure A1. Consistency test for the solubility of different precursors in scCO2 using the Chrastil model [34,35,40,44,45,46,47,49,50].
Molecules 30 01660 g0a1aMolecules 30 01660 g0a1b
Figure A2. Consistency test for the solubility of different precursors in scCO2 using the KJ ext. model [34,35,40,44,45,46,47,49,50].
Molecules 30 01660 g0a2
Figure A3. Consistency test for the solubility of different precursors in scCO2 using the Bartle ext. model [34,35,40,44,45,46,47,49,50].
Molecules 30 01660 g0a3
Figure A4. Consistency test for the solubility of different precursors in scCO2 using the MST orig. model [34,35,40,44,45,46,47,49,50].
Molecules 30 01660 g0a4aMolecules 30 01660 g0a4b

References

  1. Cansell, F.; Aymonier, C. Design of functional nanostructured materials using supercritical fluids. J. Supercrit. Fluids 2009, 47, 508–516. [Google Scholar] [CrossRef]
  2. Türk, M.; Erkey, C. Synthesis of supported nanoparticles in supercritical fluids by supercritical fluid reactive deposition: Current state, further perspectives and needs. J. Supercrit. Fluids 2018, 134, 176–183. [Google Scholar] [CrossRef]
  3. Incera Garrido, G.; Patcas, F.C.; Upper, G.; Türk, M.; Yilmaz, S.; Kraushaar-Czarnetzki, B. Supercritical deposition of Pt on SnO2-coated Al2O3 foams: Phase behaviour and catalytic performance. Appl. Catal. A Gen. 2008, 338, 58–65. [Google Scholar] [CrossRef]
  4. Reiser, S.; Shaban, M.; Weber, A.; Türk, M. CO2 assisted deposition of R/S-ibuprofen on different porous carrier materials: Influence of carrier properties on loading and dissolution behavior. J. CO2 Util. 2018, 25, 216–225. [Google Scholar] [CrossRef]
  5. Crone, M.; Trinkies, L.L.; Dittmeyer, R.; Türk, M. Deposition of Pd, Pt, and PdPt nanoparticles on TiO2 powder using supercritical fluid reactive deposition: Application in the direct synthesis of H2O2. Molecules 2024, 29, 2142. [Google Scholar] [CrossRef]
  6. Yousefzadeh, H.; Akgün, I.S.; Barim, S.B.; Sari, T.B.; Eris, G.; Unzunlar, E.; Bozbag, S.E.; Erkey, C. Supercritical fluid reactive deposition: A process intensification technique for synthesis of nanostructured materials. Chem. Eng. Process 2022, 176, 108934. [Google Scholar] [CrossRef]
  7. Crone, M.; Türk, M. Adsorption of precursors on substrates in the presence of scCO2 for the synthesis of supported metallic nanoparticles: Experiments and modeling. Fluids 2023, 8, 121. [Google Scholar] [CrossRef]
  8. Reddy, T.A.; Garlapati, C. Dimensionless empirical model to correlate pharmaceutical compound solubility in supercritical carbon dioxide. Chem. Eng. Technol. 2019, 42, 2621–2630. [Google Scholar] [CrossRef]
  9. Knez, Z.; Cör, D.; Knez Hrncic, M. Solubility of solids in sub- and supercritical fluids: A review 2010–2017. J. Chem. Eng. Data 2018, 63, 860–884. [Google Scholar] [CrossRef]
  10. Chrastil, J. Solubility of solids and liquids in supercritical gases. J. Phys. Chem. 1982, 86, 3016–3021. [Google Scholar] [CrossRef]
  11. Kumar, S.K.; Johnston, K.P. Modelling the solubility of solids in supercritical fluids with density as the independent variable. J. Supercrit. Fluids 1988, 1, 15–22. [Google Scholar] [CrossRef]
  12. Bartle, K.D.; Clifford, A.A.; Jafar, S.A.; Shilstone, G.F. Solubilities of solids and liquids of low volatility in supercritical carbon dioxide. Phys. Chem. Ref. Data 1991, 20, 713–756. [Google Scholar] [CrossRef]
  13. Méndez-Santiago, J.; Teja, A.S. The Solubility of solids in supercritical fluids. Fluid Phase Equilib. 1999, 158–160, 501–510. [Google Scholar] [CrossRef]
  14. Ushiki, I.; Sato, Y.; Takishima, S.; Inomata, H. Thermodynamic modeling of the solubility of acetylacetonate-type metal precursors in supercritical carbon dioxide using the PC-SAFT equation of state. J. Chem. Eng. Jpn. 2019, 52, 243–252. [Google Scholar] [CrossRef]
  15. Ziger, D.H.; Eckert, C.A. Correlation and prediction of solid-supercritical fluid phase equilibriums. Ind. Eng. Chem. Process Des. Dev. 1983, 22, 582–588. [Google Scholar] [CrossRef]
  16. Harvey, A.H. Supercritical solubility of solids from near-critical dilute-mixture theory. J. Phys. Chem. 1990, 94, 8403–8406. [Google Scholar] [CrossRef]
  17. Türk, M.; Crone, M.; Kraska, T.H. A comparison between models based on equations of state and density-based models for describing the solubility of solutes in CO2. J. Supercrit. Fluids 2010, 55, 462–471. [Google Scholar] [CrossRef]
  18. Stiver, W. Chrastil revisited for supercritical carbon dioxide. J. Supercrit. Fluids 2021, 177, 105348. [Google Scholar] [CrossRef]
  19. Adachi, Y.; Lu, B.C.-Y. Supercritical fluid extraction with carbon dioxide and ethylene. Fluid Phase Equilibr. 1983, 14, 147–156. [Google Scholar] [CrossRef]
  20. Del Valle, J.M.; Aguilera, J.M. An improved equation for predicting the solubility of vegetable oils in supercritical CO2. Ind. Eng. Chem. Res. 1988, 27, 1551–1553. [Google Scholar] [CrossRef]
  21. Sparks, D.L.; Hernandez, R.; Estévez, L.A. Evaluation of density-based models for the solubility of solids in supercritical carbon dioxide and formulation of a new model. Chem. Eng. Sci. 2008, 63, 4292–4301. [Google Scholar] [CrossRef]
  22. Skerget, M.; Knez, Z.; Knez-Hrncic, M. Solubility of solids in sub- and supercritical fluids: A Review. J. Chem. Eng. Data 2011, 56, 694–719. [Google Scholar] [CrossRef]
  23. Miller, D.J.; Hawthorne, S.B.; Clifford, A.A.; Zhu, S. Solubility of polycyclic aromatic hydrocarbons in supercritical carbon dioxide from 313 to 523 K and pressures from 100 to 450 bar. J. Chem. Eng. Data 1996, 41, 779–786. [Google Scholar] [CrossRef]
  24. National Institute of Standards and Technology (NIST). Available online: http://webbook.nist.gov/ (accessed on 1 July 2024).
  25. Kautz, C.B.; Schneider, G.M.; Shim, J.-J.; Wagner, B.; Tuma, D. Solubilities of a 1,4-bis(alkylamino)-9,10-anthraquinone series in compressed carbon dioxide. J. Chem. Eng. Data 2008, 53, 2356–2371. [Google Scholar] [CrossRef]
  26. Upper, G. Reaktivabscheidung von Metallen Aus Überkritischen Fluiden zur Herstellung von Funktionsoptimierten Katalysatoren. Ph.D. Thesis, Fakultät für Chemieingenieurwesen und Verfahrenstechnik, Universität Karlsruhe (TH), Karlsruhe, Germany, 2009. [Google Scholar] [CrossRef]
  27. Peng, D.Y.; Robinson, D.B. A new two-constant equation of state. Ind. Eng. Chem. Res. 1976, 15, 59–64. [Google Scholar] [CrossRef]
  28. Lopez-Echeverry, J.S.; Reif-Acherman, S.; Araujo-Lopez, E. Peng-Robinson equation of state: 40 years through cubics. Fluid Phase Equilib. 2017, 447, 39–71. [Google Scholar] [CrossRef]
  29. Skerget, M.; Novak-Pintaric, Z.; Knez, Z.; Kravanja, Z. Estimation of solid solubilities in supercritical carbon dioxide: Peng–Robinson adjustable binary parameters in the near critical region. Fluid Phase Equilib. 2002, 203, 111–132. [Google Scholar] [CrossRef]
  30. Ushiki, I.; Fujimitsu, R.; Takishima, S. Predicting the solubilities of metal acetylacetonates in supercritical CO2: Thermodynamic approach using PC-SAFT. J. Supercrit. Fluids 2020, 164, 104909. [Google Scholar] [CrossRef]
  31. Kleiner, M.; Tumakaka, F.; Sadowski, G. Thermodynamic Modeling of Complex Systems. In Molecular Thermodynamics of Complex Systems; Lu, X., Hu, Y., Eds.; Springer: Berlin/Heidelberg, Germany, 2009; Volume 131, pp. 76–108. [Google Scholar] [CrossRef]
  32. Gross, J.; Sadowski, G. Perturbed-chain SAFT: An equation of state based on a perturbation theory for chain molecules. Ind. Eng. Chem. Res. 2001, 40, 1244–1260. [Google Scholar] [CrossRef]
  33. Siebertz, K.; van Bebber, D.; Hochkirchen, T.H. Statistische Versuchsplanung, 2nd ed.; Springer-Verlag GmbH Deutschland: Berlin/Heidelberg, Germany, 2017; ISBN 978-3-662-55742-6. [Google Scholar]
  34. Türk, M.; Crone, M.; Upper, G. Effect of gas pressure on the phase behaviour of organometallic compounds. J. Supercrit. Fluids 2011, 58, 1–6. [Google Scholar] [CrossRef]
  35. Wolf, A. Bestimmung der Löslichkeit von Metallchelaten in Überkritischem Kohlendioxid. Ph.D. Thesis, Universität-Gesamthochschule Siegen, Siegen, Germany, 1999. Available online: https://nbn-resolving.org/urn:nbn:de:hbz:467-1708.
  36. Teoh, W.H.; Mammucari, R.; Foster, N.R. Solubility of organometallic complexes in supercritical carbon dioxide: A review. J. Organomet. Chem. 2013, 724, 102–116. [Google Scholar] [CrossRef]
  37. Nasebulin, A.G.; Ahonen, P.P.; Richard, O.; Altman, I.S. Copper and copper oxide nanoparticle formation by chemical vapor nucleation from copper(II)acetylacetonate. J. Nanopart. Res. 2001, 3, 385–400. [Google Scholar] [CrossRef]
  38. Siddiqi, M.A.; Siddiqui, R.A.; Atakan, B. Thermal stability, sublimation pressures, and diffusion coefficients of anthracene, pyrene, and some metal b-diketonates. J. Chem. Eng. Data 2009, 54, 2795–2802. [Google Scholar] [CrossRef]
  39. Teghil, R.; Ferro, D.; Benecivenni, L.; Pelino, M. A thermodynamic study of the sublimation processes of aluminum and copper acetylacetonates. Thermochim. Acta 1981, 44, 213–222. [Google Scholar] [CrossRef]
  40. Cross, W., Jr.; Akgerman, A.; Erkey, C. Determination of metal-chelate complex solubilities in supercritical carbon dioxide. Ind. Eng. Chem. Res. 1996, 35, 1765–1770. [Google Scholar] [CrossRef]
  41. Ribeiro da Silva, M.A.V.; Monte, M.J.S.; Huinink, J. Vapour pressures and standard molar enthalpies of sublimation of seven crystalline copper (II) b-diketonates. The mean molar (Cu—O) bond-dissociation enthalpies. J. Chem. Thermodyn. 1995, 27, 175–190. [Google Scholar] [CrossRef]
  42. Colominas, C.; Lau, K.H.; Hildenbrand, D.L.; Crouch-Baker, S.; Sanjurjo, A. Vapor pressures of the copper and yttrium b-diketonate MOCVD precursors. J. Chem. Eng. Data 2001, 46, 446–450. [Google Scholar] [CrossRef]
  43. Minkina, V.G. Initial compounds for obtaining high-temperature superconducting films by the CVD-method. Russian Chem. Bull. 1993, 42, 1460–1466. [Google Scholar] [CrossRef]
  44. Lagalante, A.F.; Hansen, B.N.; Bruno, T.J.; Sievers, R.E. Solubilities of copper (II) and chromium (II) b-diketonates in supercritical carbon dioxide. Inorg. Chem. 1995, 34, 5781–5785. [Google Scholar] [CrossRef]
  45. Aschenbrenner, O. Untersuchungen zu Phasengleichgewichten und Transportvorgängen gelöster Metallverbindungen in überkritischem Kohlendioxid. Ph.D. Thesis, Fakultät für Chemieingenieurwesen und Verfahrenstechnik, Universität Karlsruhe (TH), Karlsruhe, Germany, 2007. [Google Scholar] [CrossRef]
  46. Yoda, S.; Mizuno, Y.; Furuya, T.; Takebayashi, Y.; Otake, K.; Tsuji, T.; Hiaki, T. Solubility measurements of noble metal acetylacetonates in supercritical carbon dioxide by high performance liquid chromatography (HPLC). J. Supercrit. Fluids 2008, 44, 139–147. [Google Scholar] [CrossRef]
  47. Haruki, M.; Kobayashi, F.; Kihara, S.-i.; Takishima, S. Solubility of b-diketonate complexes of copper (II) and cobalt (II) in supercritical carbon dioxide. J. Chem. Eng. Data 2011, 56, 2230–2235. [Google Scholar] [CrossRef]
  48. Hierso, J.-C.; Serp, P.; Feurer, R.; Kalck, P. MOCVD of rhodium, palladium and platinum complexes on fluidized divided substrates: Novel process for one-step preparation of noble-metal catalysts. Appl. Organomet. Chem. 1998, 12, 161–172. [Google Scholar] [CrossRef]
  49. Momose, T.; Kondo, A.; Kamiya, T.; Yamada, H.; Ohara, J.; Kitamura, Y.; Uchida, H.; Shimogaki, Y.; Sugiyama, M. Solubility of bis-(2,2,6,6-tetramethyl-3,5-heptanedionato) copper (II) in mixed supercritical CO2 and H2 systems for application in supercritical fluid deposition of Cu. J. Supercrit. Fluids 2015, 105, 193–200. [Google Scholar] [CrossRef]
  50. Tsuruta, N.; Yoda, S.; Hasegawa, A.; Sugeta, T.; Takebayashi, Y.; Tsuji, T.; Otake, K. Solubility measurement of noble-metal-chelates in supercritical CO2. In Proceedings of the 6th International Symposium on Supercritical Fluids, Versailles, France, 28–30 April 2003; Available online: https://supercriticalfluidsociety.net/wp-content/VERSAILLES/Versailles/Papers/PTs6.pdf.
  51. Galia, A.; Argentino, A.; Scialdone, O.; Filardo, G. A new simple static method for the determination of solubilities of condensed compounds in supercritical fluids. J. Supercrit. Fluids 2002, 24, 7–17. [Google Scholar] [CrossRef]
  52. Sherman, G.; Shenoy, S.; Weiss, R.A.; Erkey, C. A static method coupled with gravimetric analysis for the determination of solubilities of solids in supercritical carbon dioxide. Ind. Eng. Chem. Res. 2000, 39, 846–848. [Google Scholar] [CrossRef]
  53. Tobaly, P.; Lanchec, G. Vapour pressure and enthalpy of sublimation of a series of organometallic complexes: Cu(DPM)2, Y(DPM)3, Ba(DPM)2 and some derivatives. J. Chem. Thermodyn. 1993, 25, 503–510. [Google Scholar] [CrossRef]
  54. Siddiqi, M.A.; Siddiqui, R.A.; Atakan, B. Thermal stability, vapor pressures, and diffusion coefficients of some metal 2,2,6,6-tetramethyl-3,5-heptandionate [M(tmhd)n] compounds. J. Chem. Eng. Data 2010, 55, 2149–2154. [Google Scholar] [CrossRef]
  55. Morozova, N.B.; Zharkova, G.I.; Semyannikov, P.P.; Sysoev, S.V.; Igumenov, I.K.; Fedotova, N.E.; Gelfond, N.V. Vapor pressure of precursors for CVD on the base of platinum group metals. J Phys. IV France 2001, 11, 3–609. [Google Scholar] [CrossRef]
  56. Igumenov, I.K.; Zharkova, G.I.; Baidina, I.A.; Stabnikov, P.A.; Semyannikov, P.P.; Morozova, N.B.; Gelfond, N.V. Systematical investigations of new Pd (II) precursors for the MO CVD processes. In Proceedings of the Fifteenth European Conference on Chemical Vapor Deposition 2005-09 (EUROCVD-15), Bochum, Germany, 6–9 September 2005; The Electrochemical Society, Inc.: Pennington, NJ, USA, 2005. [Google Scholar]
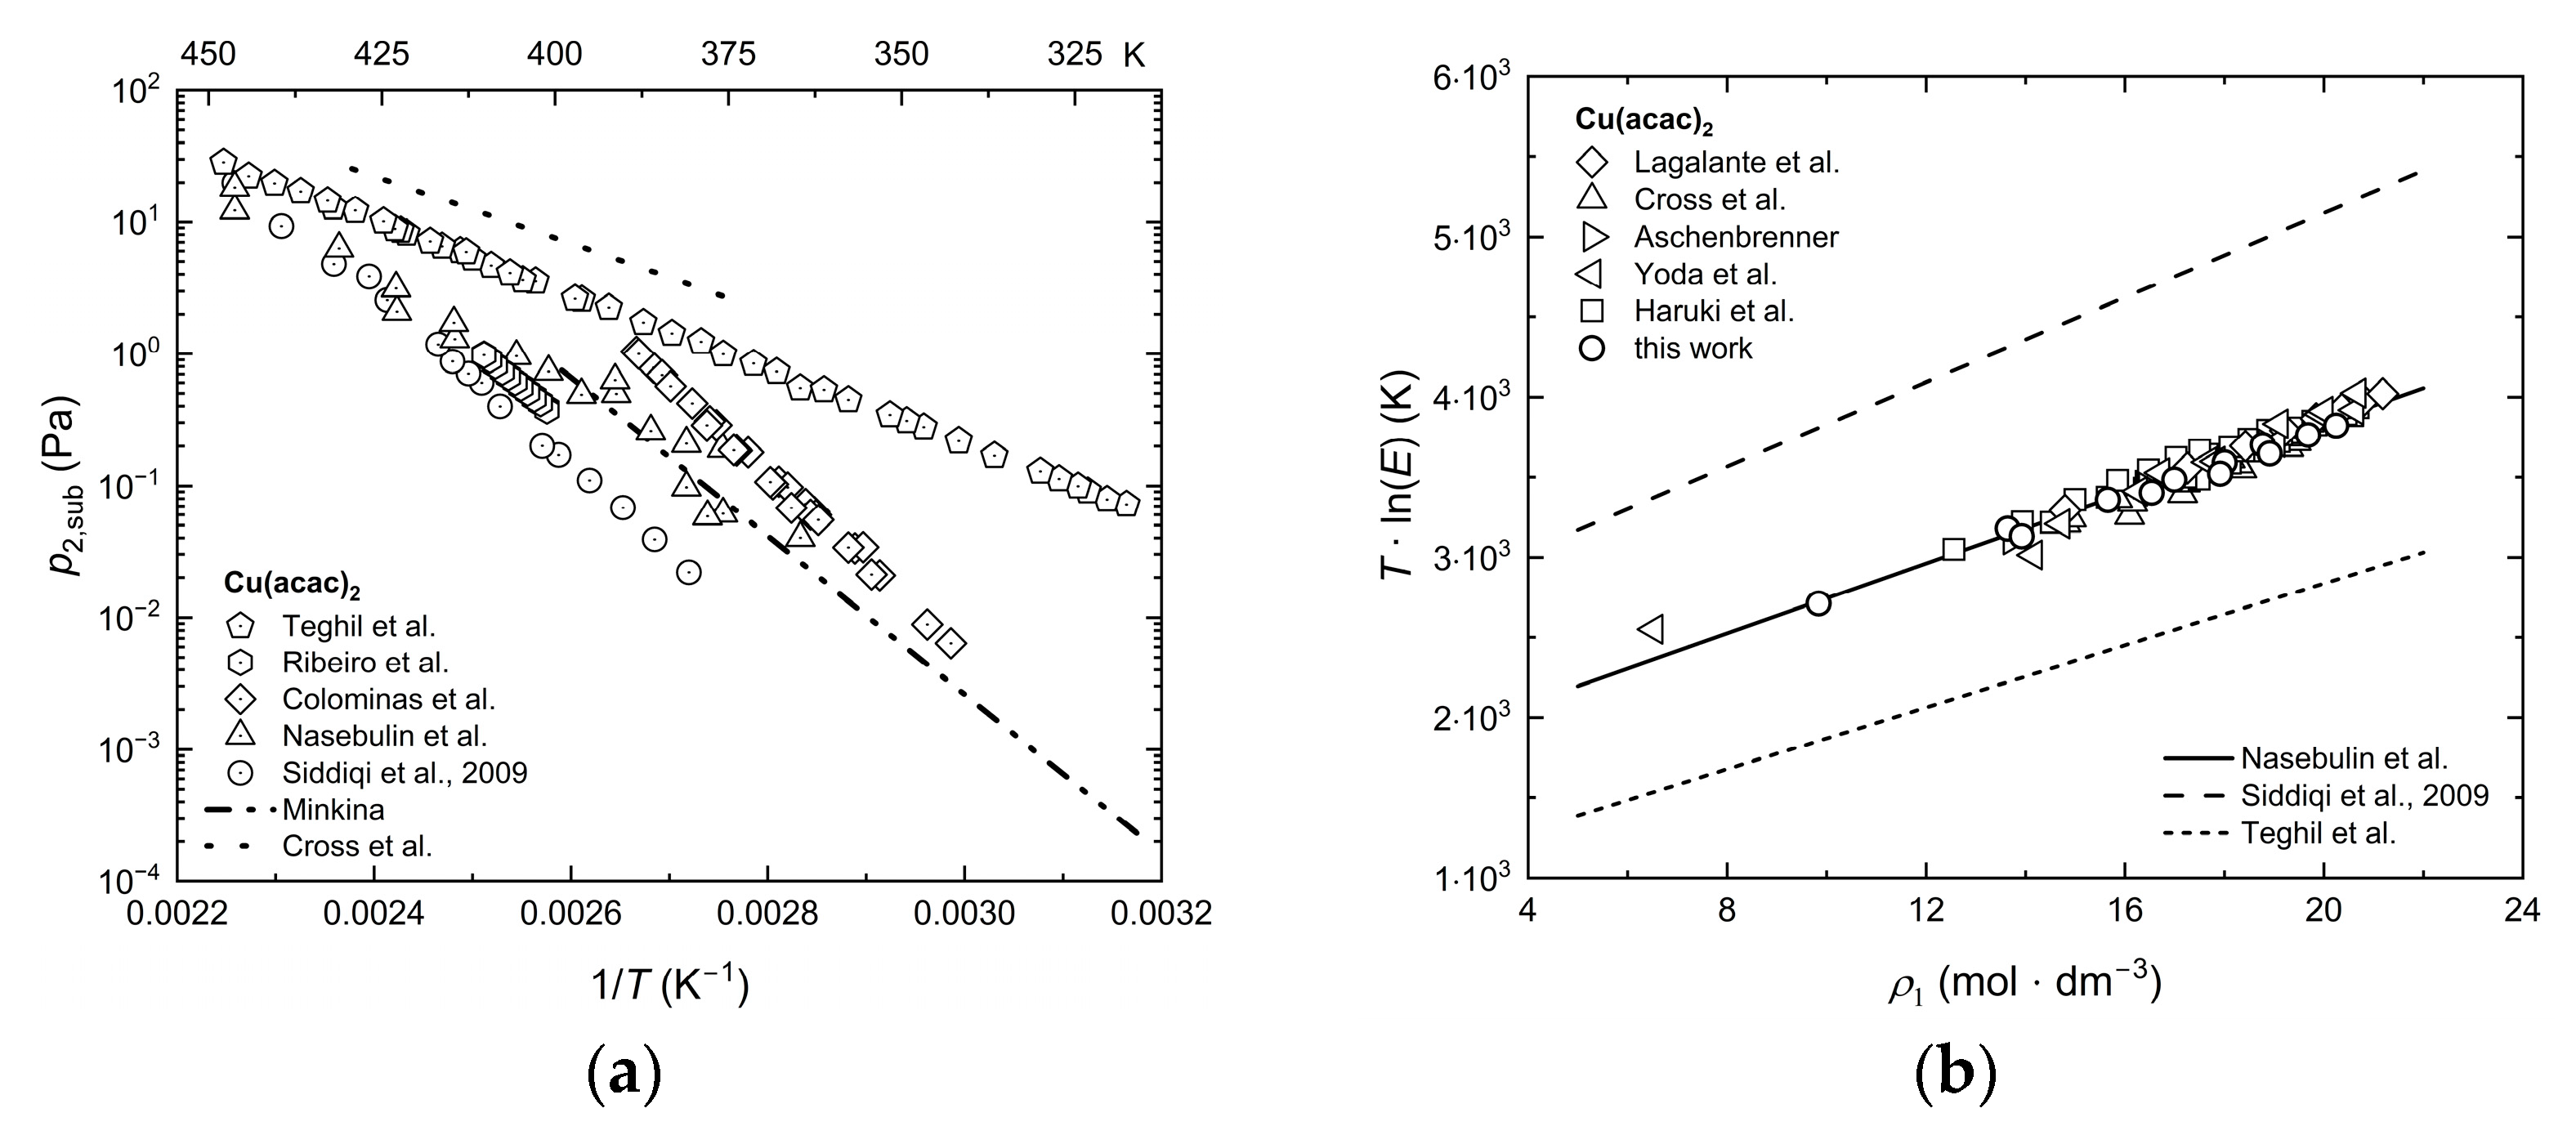
Figure 1. For the CO2/Cu(acac)2 system: (a) experimental sublimation pressure data available in the literature [37,38,39,40,41,42,43]; (b) T · l n E vs. CO2 density [37,39,40,44,45,46,47].
Molecules 30 01660 g001
Figure 2. Consistency test for the solubility of different precursors in scCO2 using the MST mod. model [34,35,40,44,45,46,47,49,50].
Molecules 30 01660 g002aMolecules 30 01660 g002b
Figure 3. Consistency test (a) with the Chrastil model and (b) with the KJ ext. model [34,45,50]. The red symbols identify experimental data points that failed the thermodynamic consistency test and were, therefore, eliminated.
Molecules 30 01660 g003
Figure 4. Comparison of the R a d j 2 values calculated for the density-based approaches: (a) plotted over these approaches and (b) plotted over the precursors investigated.
Molecules 30 01660 g004
Figure 5. Comparison of the A A R D values between different density-based approaches used in this investigation: (a) plotted over these approaches and (b) plotted over the precursors investigated.
Molecules 30 01660 g005
Figure 6. Experimental solubility data for Cu(acac)2, Pd(acac)2, and Pt(acac)2 [44,45,46,47,50], (a) calculated with Chrastil and (b) calculated with KJ ext.
Molecules 30 01660 g006
Figure 7. Comparison of the A A R D values calculated for each isotherm with MST orig. and PC-SAFT EoS for Cu(acac)2 [30], Pd(acac)2, and Pt(acac)2 [14].
Molecules 30 01660 g007
Figure 8. Scheme of the experimental setup (PI = pressure indicator, TI = temperature indicator, and BD = bursting disk).
Molecules 30 01660 g008
Table 1. Experimental solubility data of Cu(acac)2 in scCO2. The CO2 density was taken from the NIST Chemistry WebBook [24]; y 2 was calculated according to Equation (14).
T (K) p (MPa) ρ 1   ( m o l · d m 3 ) Δ ρ 1 / ρ 1 (%) y 2   ( m o l · m o l 1 ) Δ y 2   ( m o l · m o l 1 )
333.115.2313.920.871.05·10−5±2.48·10−6
333.120.2516.540.431.78·10−5±2.26·10−6
333.125.1617.910.302.05·10−5±2.12·10−6
333.130.3318.910.232.47·10−5±2.03·10−6
333.135.5219.680.192.99·10−5±2.05·10−6
333.140.1320.240.173.16·10−5±2.02·10−6
353.215.149.841.019.66·10−6±3.34·10−6
353.220.2813.640.572.71·10−5±2.79·10−6
353.225.2115.660.373.62·10−5±2.63·10−6
353.230.2316.990.284.32·10−5±2.54·10−6
353.235.4618.000.224.98·10−5±2.50·10−6
353.240.5018.770.195.96·10−5±2.55·10−6
Table 2. Experimental solubility data of Pd(acac)2 in scCO2. The CO2 density was taken from the NIST Chemistry WebBook [24]; y 2 was calculated according to Equation (14).
T (K) p (MPa) ρ 1   ( m o l · d m 3 ) Δ ρ 1 / ρ 1 (%) y 2   ( m o l · m o l 1 ) Δ y 2   ( m o l · m o l 1 )
313.110.0814.431.708.95·10−6±1.71·10−6
313.112.6216.680.661.54·10−5±1.55·10−6
313.115.1217.770.452.16·10−5±1.54·10−6
313.120.1019.100.302.58·10−5±1.48·10−6
313.125.0019.990.232.52·10−5±1.38·10−6
313.130.0120.680.192.30·10−5±1.30·10−6
333.110.076.681.644.17·10−6±3.18·10−6
333.112.5810.871.669.65·10−6±2.15·10−6
333.115.1013.820.892.04·10−5±1.92·10−6
333.120.0416.470.434.16·10−5±1.87·10−6
333.125.0617.900.305.32·10−5±1.86·10−6
333.129.8918.840.245.57·10−5±1.76·10−6
353.210.145.141.019.13·10−6±4.21·10−6
353.212.537.241.081.46·10−5±3.16·10−6
353.215.029.721.021.96·10−5±2.52·10−6
353.220.0613.520.594.58·10−5±2.42·10−6
353.125.0515.610.387.83·10−5±2.46·10−6
353.329.8316.890.289.92·10−5±2.52·10−6
Table 3. Experimental solubility data of Pt(acac)2 in scCO2. The CO2 density was taken from the NIST Chemistry WebBook [24]; y 2 was calculated according to Equation (14).
T (K) p (MPa) ρ 1   ( m o l · d m 3 ) Δ ρ 1 / ρ 1 (%) y 2   ( m o l · m o l 1 ) Δ y 2   ( m o l · m o l 1 )
313.215.1517.780.451.37·10−5±1.42·10−6
313.220.1319.110.292.10·10−5±1.43·10−6
313.225.1520.000.232.36·10−5±1.40·10−6
313.230.1620.690.193.02·10−5±1.44·10−6
313.235.0221.240.172.98·10−5±1.39·10−6
313.240.0621.730.152.88·10−5±1.34·10−6
333.115.1013.820.891.23·10−5±1.76·10−6
333.120.1216.490.432.70·10−5±1.73·10−6
333.125.2617.940.293.95·10−5±1.77·10−6
333.130.1618.880.234.74·10−5±1.79·10−6
333.135.0819.620.205.73·10−5±1.86·10−6
333.140.1920.250.176.20·10−5±1.85·10−6
353.215.209.901.007.34·10−6±2.21·10−6
353.220.1913.600.582.73·10−5±2.04·10−6
353.225.2015.650.374.30·10−5±2.05·10−6
353.330.2216.980.286.39·10−5±2.21·10−6
353.235.2617.970.228.80·10−5±2.44·10−6
353.240.1618.730.191.22·10−4±2.82·10−6
Table 4. Overview over own and published solubility data for Cu(acac)2, Cu(tmhd)2, Pd(acac)2, Pd(tmhd)2, Pt(acac)2, and Pt(cod)me2 in scCO2.
Isotherms N T (K) p (MPa)Ref.
Cu(acac)2883range: 308–353range: 8–40[overall]
1831310–35[44]
315308, 318, 32810–30[40]
1333315–30[45]
1133138–30[46]
432313, 323, 333, 34314–30[47]
212333, 35315–40[this work]
Cu(tmhd)2662range: 313–373range: 10–35[overall]
1831310–35[44]
1433310–18[45]
435313, 323, 333, 34312–30[47]
1733310–17[34]
48313, 333, 353, 37311–15[49]
Pd(acac)2339range: 313–353range: 10–30[overall]
1331310–30[50]
1333315–30[45]
11531310–30[46]
318313, 333, 35310–30[this work]
Pd(tmhd)2318323–34315–40[35]
Pt(acac)2330313–353range: 10–40[overall]
1531310–30[50]
1731310–29[46]
318313, 333, 35315–40[this work]
Pt(cod)me2374range: 313–353range: 9–32[overall]
1331310–30[50]
354313, 333, 3539–30[45]
317313, 333, 35313–32[34]
Table 5. Values were obtained by fitting the individual model parameters of Chrastil, KJ ext., Bartle ext., MST orig., and MST mod. to the experimental solubility data. R a d j 2 has been calculated according to Equation (12).
Chrastil β γ α  (K) R a d j 2
Cu(acac)2−6.713.03−41760.892
Cu(tmhd)23.084.82−77290.974
Pd(acac)2−4.312.61−43480.858
Pd(tmhd)2−5.283.42−39680.962
Pt(acac)2−10.053.39−32770.853
Pt(cod)me2 (a)−0.542.84−46140.971
KJ ext. b 0 b 1   ( d m 3 · m o l 1 ) b 2   (K) R a d j 2
Cu(acac)2−0.880.22−44860.910
Cu(tmhd)211.500.37−80880.945
Pd(acac)20.490.23−47790.928
Pd(tmhd)20.890.21−40080.949
Pt(acac)2−4.140.21−32330.803
Pt(cod)me2 (a)4.630.21−48320.982
Bartle ext. a 0 a 1   ( d m 3 · m o l 1 ) a 2   (K) R a d j 2
Cu(acac)213.750.35−64610.951
Cu(tmhd)228.450.47−100160.979
Pd(acac)215.850.34−69110.956
Pd(tmhd)215.380.36−59560.983
Pt(acac)210.890.36−53900.952
Pt(cod)me220.880.35−74000.969
MST orig. (b) A B   ( d m 3 · m o l 1 ) R a d j 2
Cu(acac)21649109.50.951
Cu(tmhd)22668152.50.974
Pd(acac)22421129.40.956
Pd(tmhd)22789135.20.921
Pt(acac)21919146.60.875
Pt(cod)me2
MST mod. A   (K) B   ( K · d m 3 · m o l 1 ) C R a d j 2
Cu(acac)2−8325111.511.720.954
Cu(tmhd)2−12413155.825.860.976
Pd(acac)2−8755114.813.550.968
Pd(tmhd)2−8135119.713.890.987
Pt(acac)2−7400118.18.970.943
Pt(cod)me2−9273117.418.560.975
(a) Parameters determined after the consistency test (see Figure 3). (b) Associated Clausius–Clapeyron parameters of Equation (6) are listed in Table A1 in Appendix A.
Table 6. Summary of modeling the solubility y 2 in scCO2 using different models. The A A R D values have been calculated according to Equation (13).
N A A R D (%)Ref.
ChrastilKJ Ext.Bartle Ext.MST Orig.MST Mod.
Cu(acac)28314.313.115.715.014.8[overall]
813.412.214.911.413.9[44]
1518.013.021.023.420.5[40]
312.59.39.26.48.4[45]
1322.418.921.821.020.8[46]
328.58.29.811.39.6[47]
1217.821.920.412.316.9[this work]
Cu(tmhd)26215.626.619.321.220.5[overall]
844.157.145.860.651.6[44]
420.460.844.747.244.6[45]
359.716.511.910.811.0[47]
711.324.613.916.715.1[34]
814.224.516.718.024.0[49]
Pd(acac)23926.620.323.728.621.1[overall]
333.029.525.612.524.7[50]
316.110.014.730.89.8[45]
1533.124.528.726.325.7[46]
1821.816.920.732.918.6[this work]
Pd(tmhd)2188.09.08.524.47.7[35]
Pt(acac)23018.721.216.535.418.6[overall]
512.813.612.333.212.4[50]
717.218.314.336.614.5[46]
1820.924.518.635.521.8[this work]
Pt(cod)me2748.7 (c)8.9 (c)17.915.8[overall]
310.5 (c)20.1 (c)71.965.3[50]
546.6 (c)7.7 (c)15.713.7[45]
1714.4 (c)11.4 (c)15.413.7[34]
(c)  A A R D values determined after the test of consistency (see Figure 3).
Table 7. Estimated dissolution ( Δ h d i s s ), sublimation ( Δ h s u b ), and solvation ( Δ h s o l v ) enthalpies for the precursors investigated.
Δ h d i s s (Chrastil)
( k J · m o l 1 )
Δ h s u b (Bartle Ext.)
( k J · m o l 1 )
Δ h s o l v
( k J · m o l 1 )
Cu(acac)234.753.7−19.0
Cu(tmhd)264.383.3−19.0
Pd(acac)236.157.5−21.4
Pd(tmhd)233.049.5−16.5
Pt(acac)227.244.8−17.6
Pt(cod)me238.461.5−23.1
Table 8. Specifications of the substances used for the solubility measurements.
CAS M   ( g · m o l 1 )Purity (%)Supplier
Cu(acac)213395-16-9261.7898abcr GmbH (d)
Pd(acac)214024-61-4304.6499abcr GmbH (d)
Pt(acac)215170-57-7393.2998abcr GmbH (d)
CO2124-38-944.0199.995Air Liquide (e)
(d) Karlsruhe, Germany; (e) Düsseldorf, Germany.
Disclaimer/Publisher’s Note: The statements, opinions and data contained in all publications are solely those of the individual author(s) and contributor(s) and not of MDPI and/or the editor(s). MDPI and/or the editor(s) disclaim responsibility for any injury to people or property resulting from any ideas, methods, instructions or products referred to in the content.