
Multi-Component Characterization and Quality Evaluation Strategy of Sarcandrae Herba by Combining Dual-Column Tandem HPLC Fingerprint and UPLC-Q-TOF-MS/MS

 ,
,
Abstract
:1. Introduction
2. Results and Discussion
2.1. Optimization of Fingerprinting Method
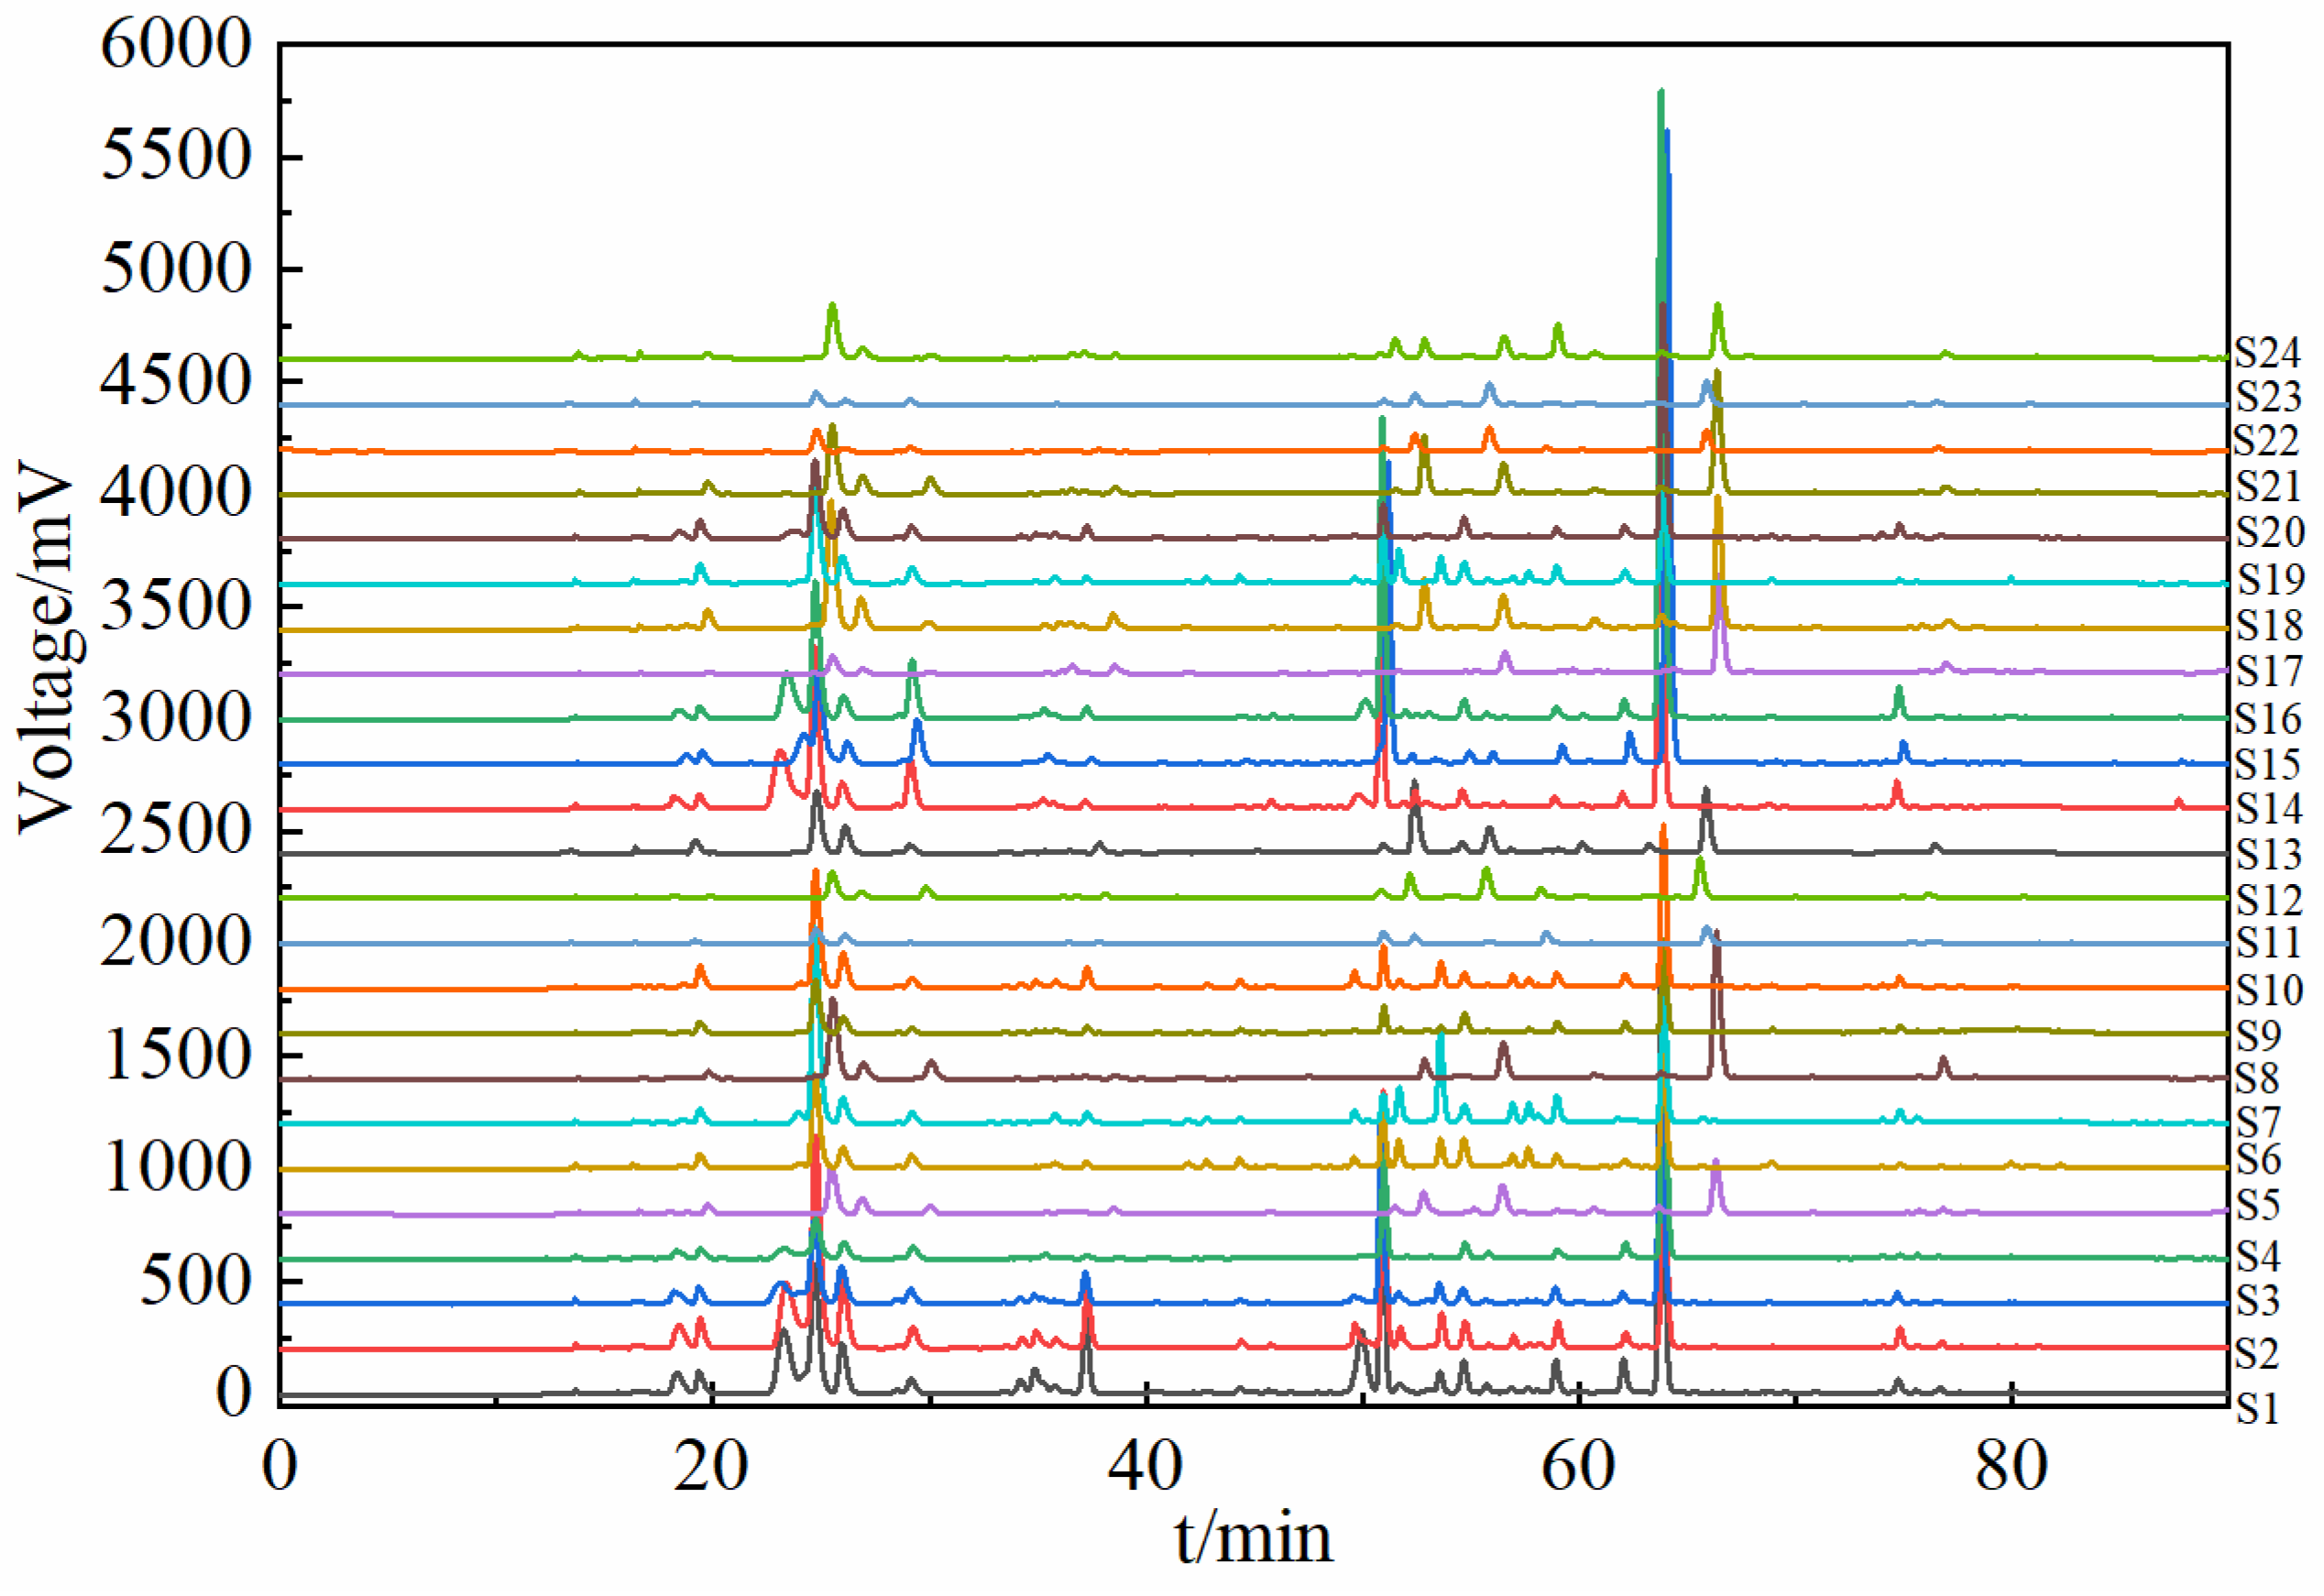
2.2. Common Components in SH Medicinal Herbs from 24 Different Origins
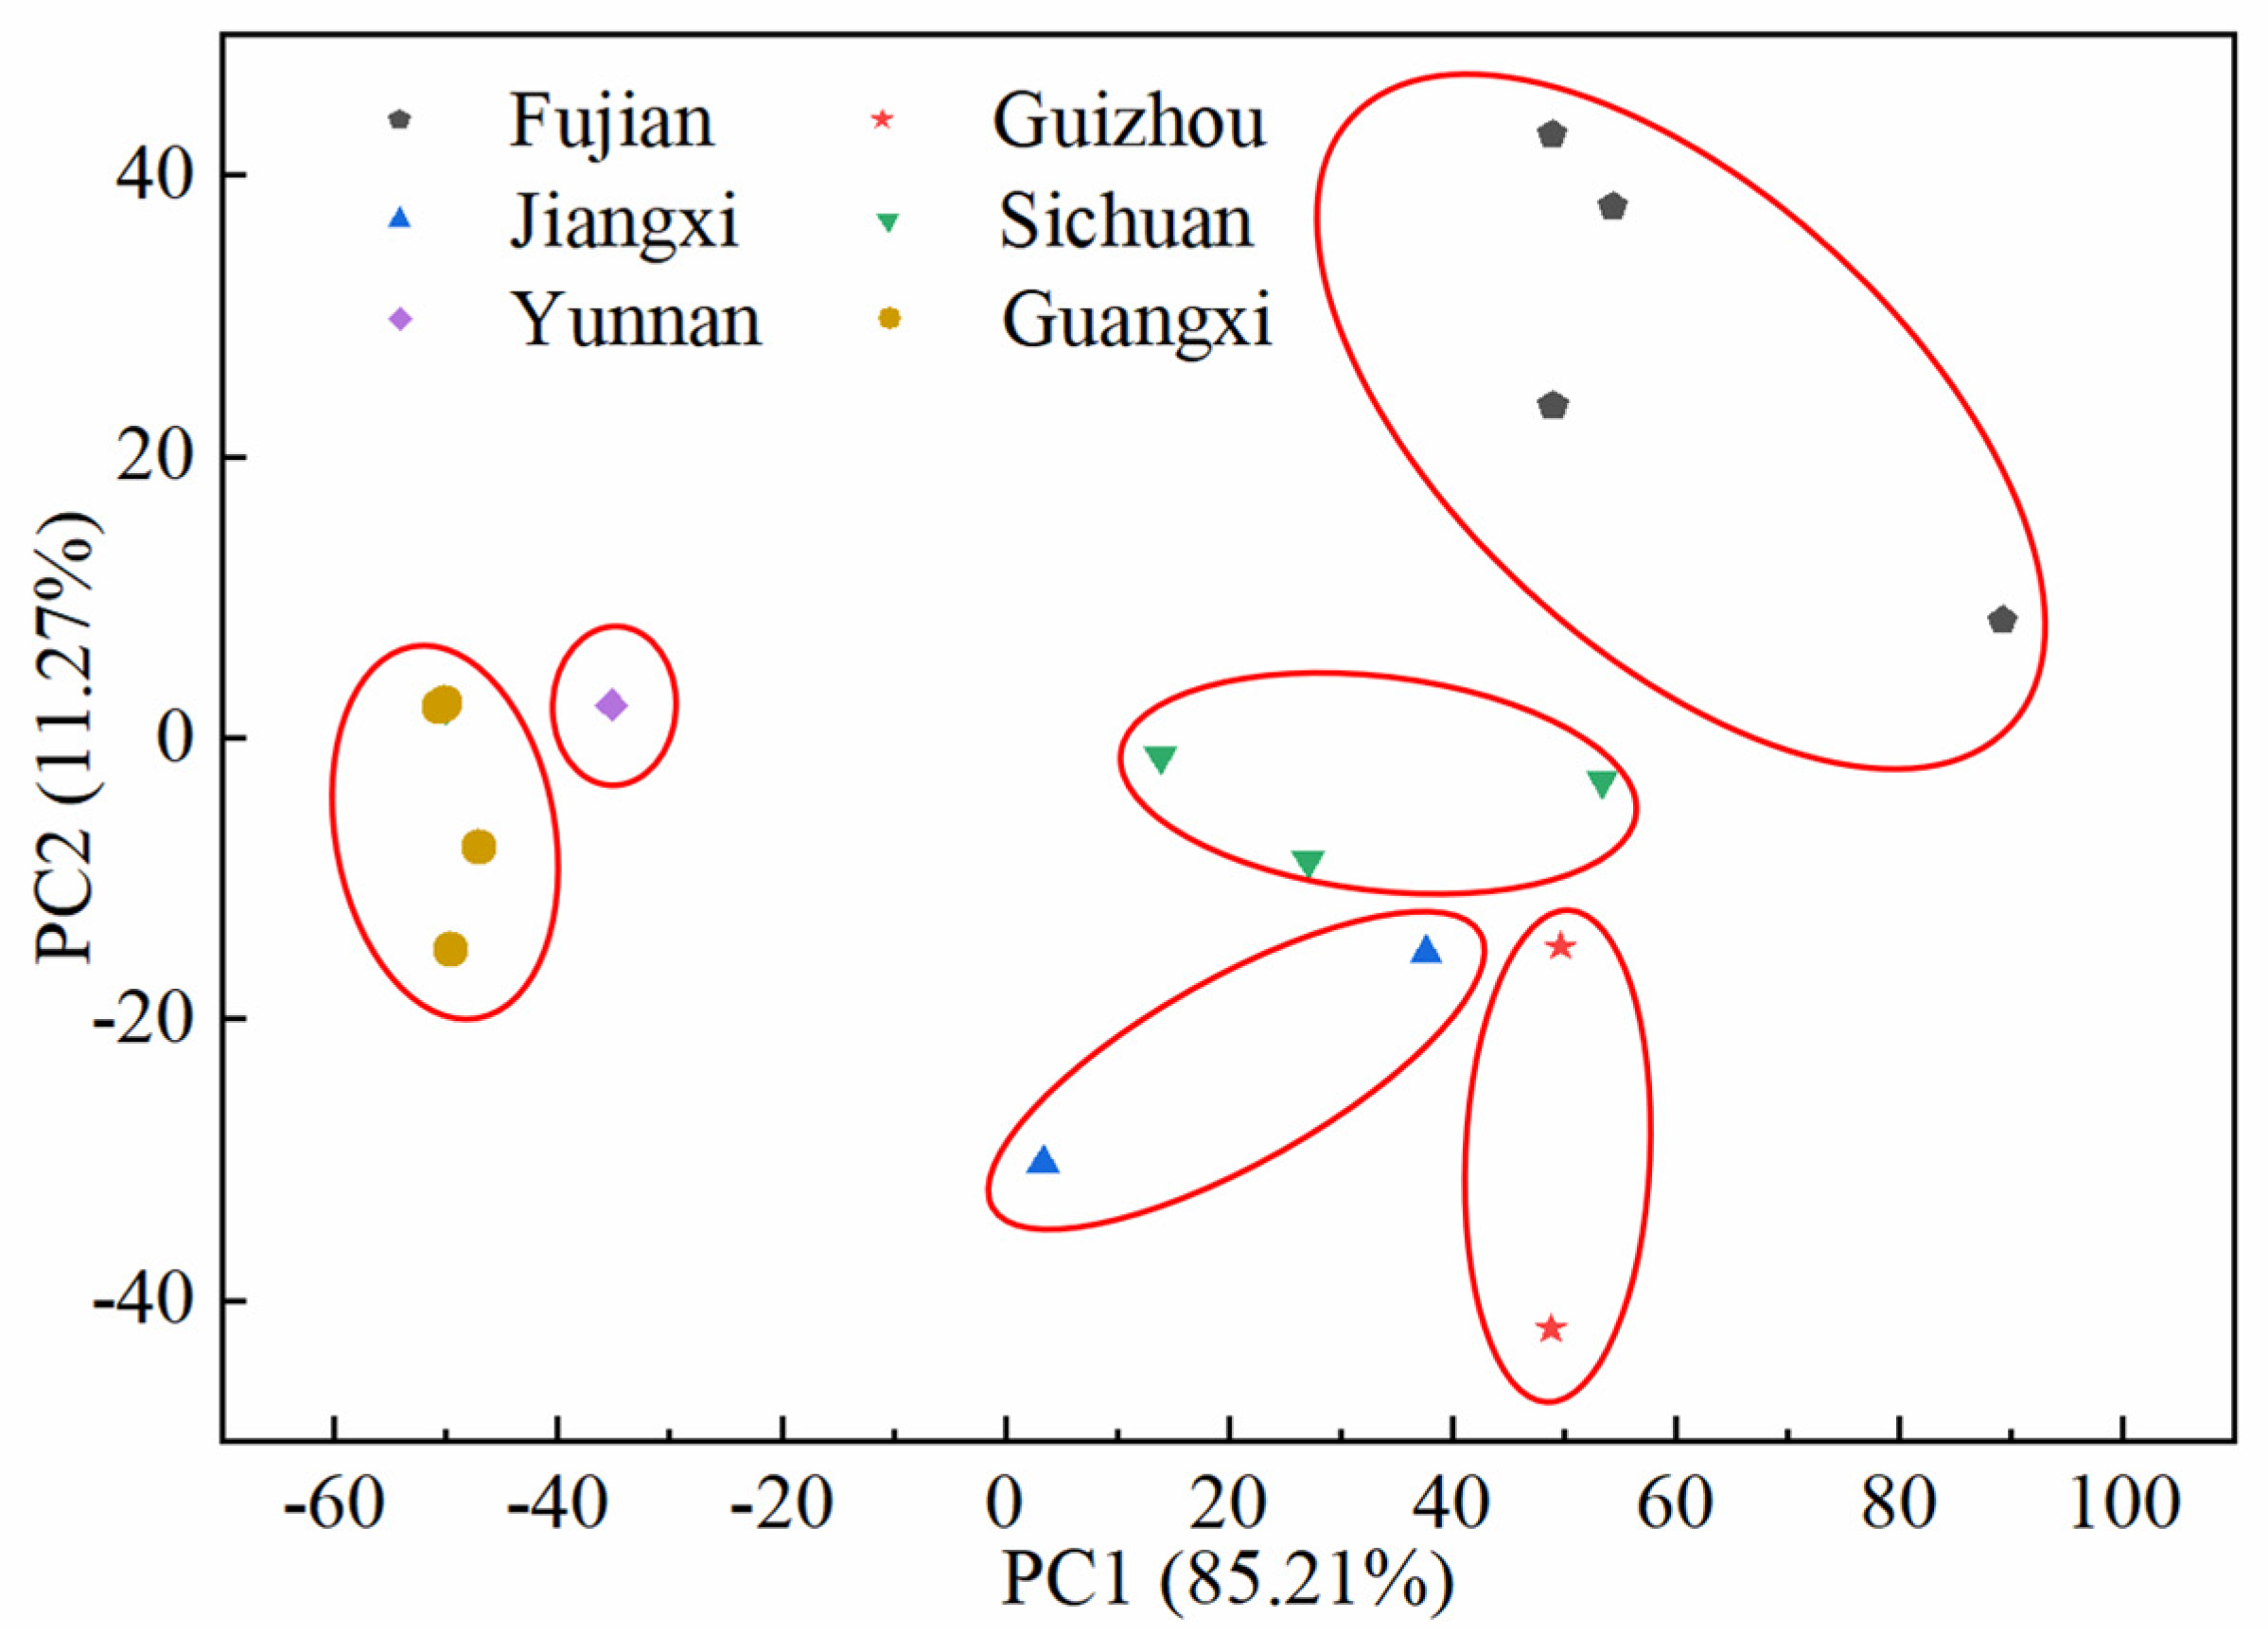
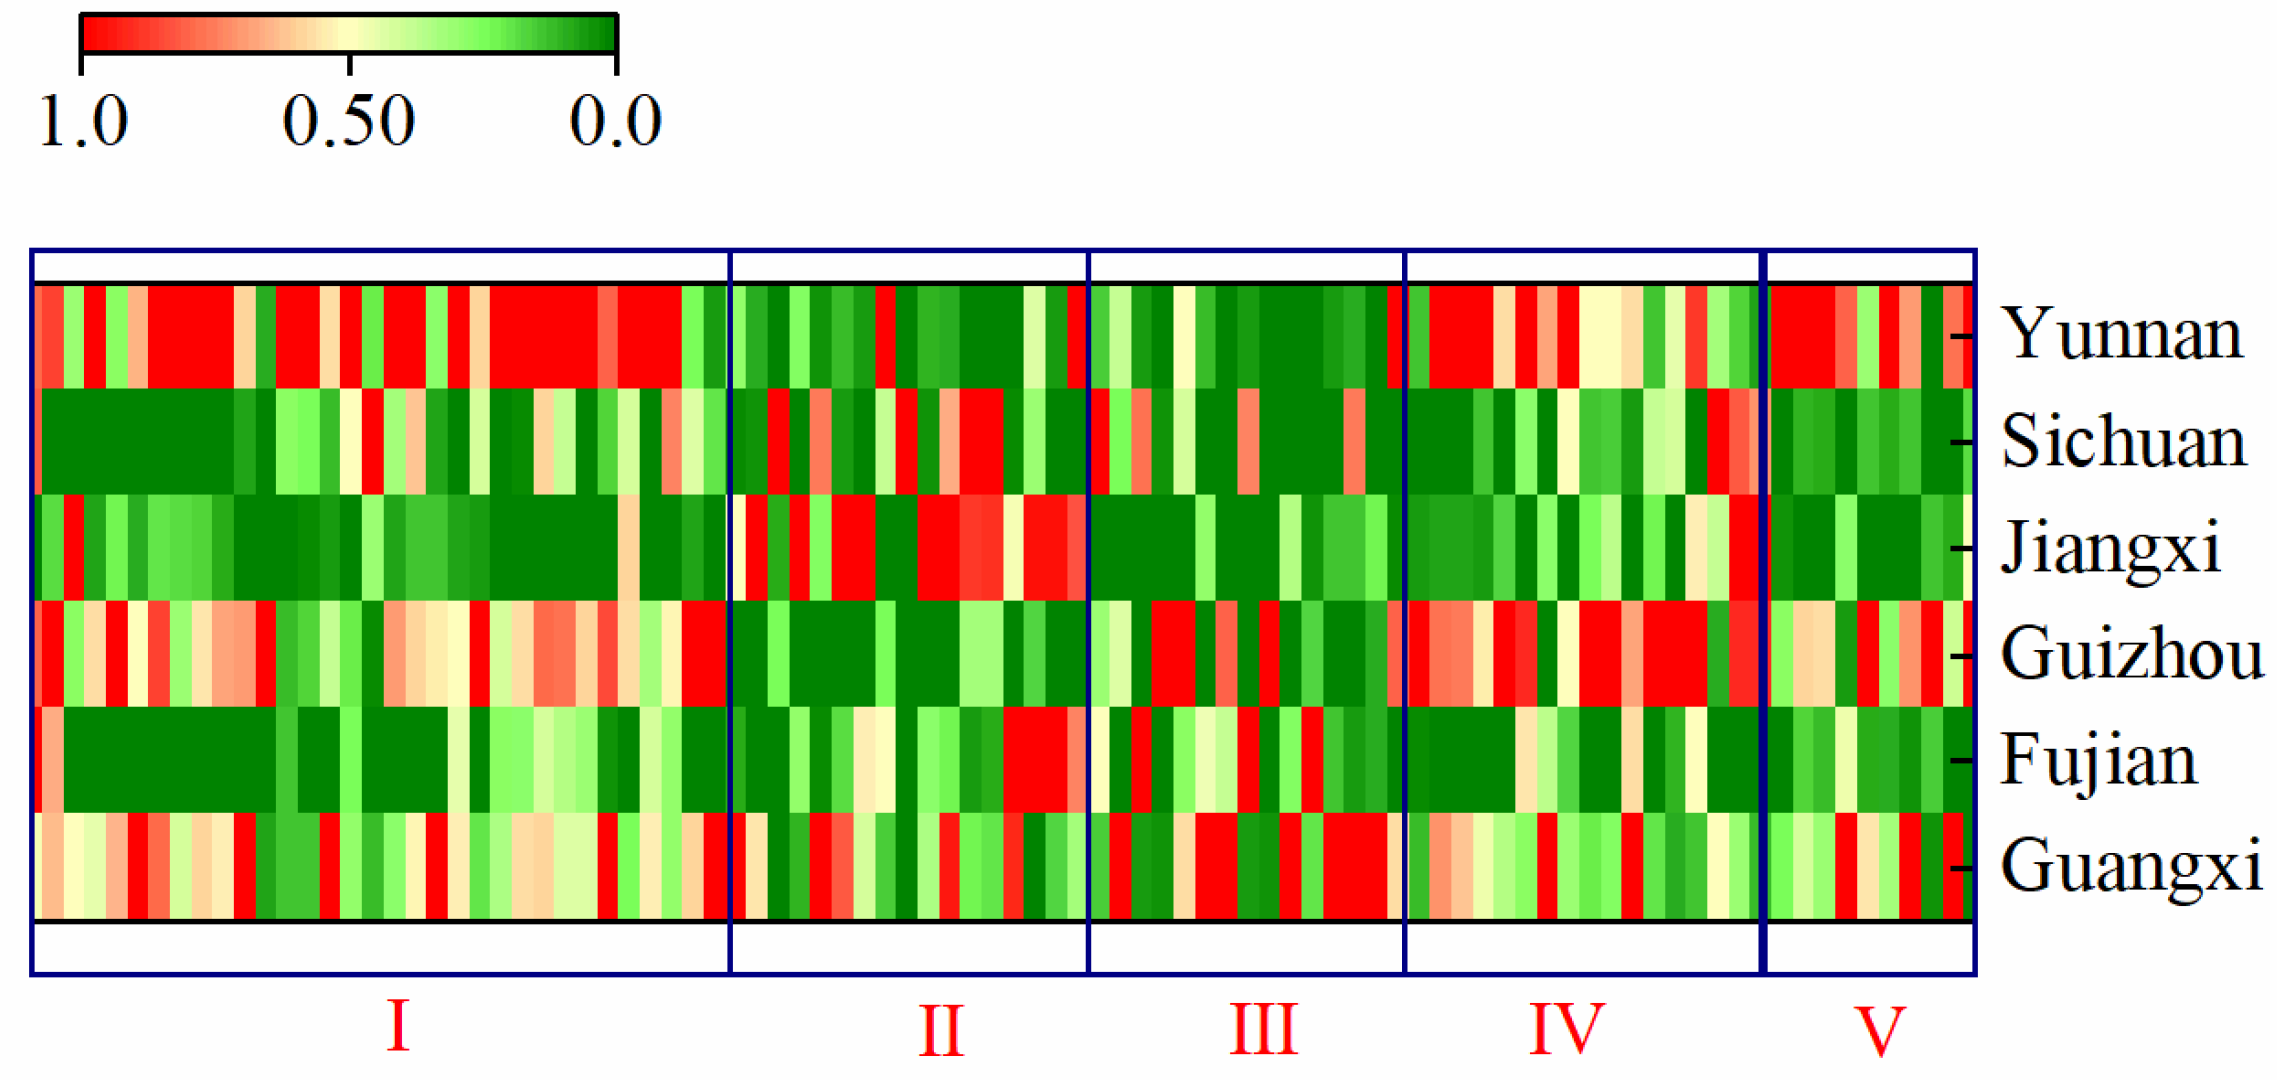
2.3. Fingerprint-Based Origin Identification of SH Herbs
2.4. MS-Based Analysis of the Material Basis of SH Herbs
3. Materials and Methods
3.1. Sources and Preparation of Samples
3.2. Chemicals and Reagents
3.3. Standard Solutions
3.4. Analytical Conditions for Fingerprinting
3.5. Parameters for MS Analysis
4. Conclusions
Author Contributions
Funding
Institutional Review Board Statement
Informed Consent Statement
Data Availability Statement
Conflicts of Interest
References
- Wang, Y.-Y.; Li, Q.-R.; Chi, J.; Li, J.-X.; Kong, L.-Y.; Luo, J. Sesquiterpenoids from the leaves of Sarcandra glabra. Chin. J. Nat. Med. 2022, 20, 215–220. [Google Scholar] [CrossRef] [PubMed]
- Chu, J.-N.; Krishnan, P.; Lim, K.-H. A comprehensive review on the chemical constituents, sesquiterpenoid biosynthesis and biological activities of Sarcandra glabra. Nat. Prod. Bioprospecting 2023, 13, 53. [Google Scholar] [CrossRef] [PubMed]
- Yang, X. Bioactive Material Basis of Medicinal Plants in Genus Sarcandra. Mod. Chin. Med. 2017, 19, 155–164. [Google Scholar]
- Sun, Y.; Li, Y.; Cui, L.; Li, Q.; Wang, S.; Chen, Z.; Kong, L.-Y.; Luo, J. Anti-Inflammatory Lindenane Sesquiterpenoid Dimers from the Roots of Sarcandra glabra. J. Agric. Food Chem. 2023, 71, 14000–14012. [Google Scholar] [CrossRef]
- Tsai, Y.-C.; Chen, S.-H.; Lin, L.-C.; Fu, S.-L. Anti-inflammatory Principles from Sarcandra glabra. J. Agric. Food Chem. 2017, 65, 6497–6505. [Google Scholar] [CrossRef]
- Niu, X.; Xing, W.; Li, W.; Fan, T.; Hu, H.; Li, Y. Isofraxidin exhibited anti-inflammatory effects in vivo and inhibited TNF-α production in LPS-induced mouse peritoneal macrophages in vitro via the MAPK pathway. Int. Immunopharmacol. 2012, 14, 164–171. [Google Scholar] [CrossRef]
- Liu, J.-X.; Zhang, Y.; Hu, Q.-P.; Li, J.-Q.; Liu, Y.-T.; Wu, Q.-G.; Wu, J.-G.; Lai, X.-P.; Zhang, Z.-D.; Li, X.; et al. Anti-inflammatory effects of rosmarinic acid-4-O-β-D-glucoside in reducing acute lung injury in mice infected with influenza virus. Antivir. Res. 2017, 144, 34–43. [Google Scholar] [CrossRef]
- Pan, L.; Zhang, D.K.; Lin, J.Z.; Han, X.; Ke, X.M.; Han, L.; Yang, M.; Liu, H.N. Optimized model for formulation prescription of traditional Chinese medicine buccal tablets based on temporal dominant description of sensations combined with multivariate statistical analysis:an example of Compound Caoshanhu Buccal Tablets. China J. Chin. Mater. Medica 2019, 44, 3035–3041. [Google Scholar]
- Wu, M.; Shen, A.; Chen, Y.; Liu, L.; Li, L.; Sankararaman, S.; Chen, H.; Guan, B.; Zhan, Z.; Nan, S.; et al. Xinhuang Tablets Improve Intestinal Barrier Function via Regulating Epithelial Tight Junctions in Dextran Sulfate Sodium-Induced Ulcerative Colitis Mice. J. Med. Food 2021, 24, 33–39. [Google Scholar] [CrossRef]
- Cheng, Q.; Peng, S.; Li, F.; Cui, P.; Zhao, C.; Yan, X.; Suo, T.; Wang, C.; He, Y.; Li, Z. Quality Distinguish of Red Ginseng from Different Origins by HPLC–ELSD/PDA Combined with HPSEC–MALLS–RID, Focus on the Sugar-Markers. Separations 2021, 8, 198. [Google Scholar] [CrossRef]
- Zhao, Q.; Yu, Y.; Cui, P.; Hao, N.; Liu, C.; Miao, P.; Li, Z. Laser-induced breakdown spectroscopy (LIBS) for the detection of exogenous contamination of metal elements in lily bulbs. Spectrochim. Acta A Mol. Biomol. Spectrosc. 2022, 287 Pt 1, 122053. [Google Scholar] [CrossRef] [PubMed]
- Commission, C.P. Pharmacopoeia of the People’s Republic of China; China Medical Science Press: Beijing, China, 2020. [Google Scholar]
- Liu, C.-X.; Liu, L.; Guo, D.-A. Quality marker of TCMs: Concept and applications. Phytomedicine 2018, 44, 85–86. [Google Scholar] [CrossRef] [PubMed]
- Dueñas, M.E.; Peltier-Heap, R.E.; Leveridge, M.; Annan, R.S.; Büttner, F.H.; Trost, M. Advances in high-throughput mass spectrometry in drug discovery. EMBO Mol. Med. 2023, 15, e14850. [Google Scholar] [CrossRef]
- Yang, Y.; Guo, D.; Yang, S.; Hu, H.; Luo, X.; Wan, N. Analysis of Volatile Components and Antibacterial Activity of Silver Wormwood Essential Oils from Different Habitats by E-Nose Combined with GC-MS. Separations 2023, 10, 553. [Google Scholar] [CrossRef]
- Liu, X.; Jiang, W.; Su, M.; Sun, Y.; Liu, H.; Nie, L.; Zang, H. Quality evaluation of traditional Chinese medicines based on fingerprinting. J. Sep. Sci. 2020, 43, 6–17. [Google Scholar] [CrossRef]
- Cuadros-Rodríguez, L.; Ruiz-Samblás, C.; Valverde-Som, L.; Pérez-Castaño, E.; González-Casado, A. Chromatographic fingerprinting: An innovative approach for food ‘identitation’ and food authentication—A tutorial. Anal. Chim. Acta 2016, 909, 9–23. [Google Scholar] [CrossRef]
- Wang, F.; Qian, Z.; Liao, G.; Zeng, J.; Huang, D.; Liu, Q.; Xie, X. HPLC Coupled with Chemical Fingerprinting for Multi-Pattern Recognition for Identifying the Authenticity of Clematidis Armandii Caulis. JoVE 2022, 189, e64690. [Google Scholar]
- Jiménez-Carvelo, A.M.; González-Casado, A.; Pérez-Castaño, E.; Cuadros-Rodríguez, L. Fast-HPLC Fingerprinting to Discriminate Olive Oil from Other Edible Vegetable Oils by Multivariate Classification Methods. J. AOAC Int. 2019, 100, 345–350. [Google Scholar] [CrossRef] [PubMed]
- Fraige, K.; Pereira-Filho, E.R.; Carrilho, E. Fingerprinting of anthocyanins from grapes produced in Brazil using HPLC–DAD–MS and exploratory analysis by principal component analysis. Food Chem. 2014, 145, 395–403. [Google Scholar] [CrossRef]
- Si, X.; Yang, Y.; Cai, X.; Zheng, H.; Wang, H.; Liu, Z.; Li, Z.; Xu, Z. High efficient separation and determination of vitamin B3 by high performance liquid chromatography with dual columns tandem technology. J. Guizhou Norm. Univ. (Nat. Sci.) 2023, 41, 85–89. [Google Scholar]
- Deng, P.; Dong, W.; Huang, S.; Liu, X.; Liu, Y.; Chen, X.; Zhu, M. Establishment of HPLC-MS fingerprint for Sarcandrae herba. Chin. Tradit. Pat. Med. 2020, 42, 3352–3355. [Google Scholar]
- Clifford, M.N.; Knight, S.; Kuhnert, N. Discriminating between the Six Isomers of Dicaffeoylquinic Acid by LC-MSn. J. Agric. Food Chem. 2005, 53, 3821–3832. [Google Scholar] [CrossRef] [PubMed]
- Nielsen, K.F.; Månsson, M.; Rank, C.; Frisvad, J.C.; Larsen, T.O. Dereplication of Microbial Natural Products by LC-DAD-TOFMS. J. Nat. Prod. 2011, 74, 2338–2348. [Google Scholar] [CrossRef] [PubMed]
- Wagner, C.; Sefkow, M.; Kopka, J. Construction and application of a mass spectral and retention time index database generated from plant GC/EI-TOF-MS metabolite profiles. Phytochemistry 2003, 62, 887–900. [Google Scholar] [CrossRef]
- Dugo, P.; Donato, P.; Cacciola, F.; Paola Germanò, M.; Rapisarda, A.; Mondello, L. Characterization of the polyphenolic fraction of Morus alba leaves extracts by HPLC coupled to a hybrid IT-TOF MS system. J. Sep. Sci. 2009, 32, 3627–3634. [Google Scholar] [CrossRef]
- Chen, J.; Wang, X.; Xin, X.; Zheng, Y.; Hou, F.; Li, C.; Guo, L.; Wang, L. Comprehensive comparison of two colour varieties of Perillae folium by UHPLC-Q-TOF/MS analysis combining with feature-based molecular networking. Food Chem. 2025, 463, 141293. [Google Scholar] [CrossRef]
- Wojdyło, A.; Oszmiański, J.; Bielicki, P. Polyphenolic Composition, Antioxidant Activity, and Polyphenol Oxidase (PPO) Activity of Quince (Cydonia oblonga Miller) Varieties. J. Agric. Food Chem. 2013, 61, 2762–2772. [Google Scholar] [CrossRef]
- Ou, B.; Hampsch-Woodill, M.; Prior, R.L. Development and Validation of an Improved Oxygen Radical Absorbance Capacity Assay Using Fluorescein as the Fluorescent Probe. J. Agric. Food Chem. 2001, 49, 4619–4626. [Google Scholar] [CrossRef]
- Huang, Q.; Wen, T.; Fang, T.; Lao, H.; Zhou, X.; Wei, T.; Luo, Y.; Xie, C.; Huang, Z.; Li, K. A comparative evaluation of the composition and antioxidant activity of free and bound polyphenols in sugarcane tips. Food Chem. 2025, 463, 141510. [Google Scholar] [CrossRef]
- Guo, J.; Zhang, S.-S.; Guo, S.; Hou, Y.; Bai, L.; Ho, C.-T.; Bai, N. A comprehensive analysis of the chemical composition of Fraxinus mandshurica roots based on HPLC-DAD-MS, GC-MS and UPLC-ESI-Q-TOF-MS. J. Pharm. Biomed. Anal. 2023, 233, 115449. [Google Scholar] [CrossRef]
- Clifford, M.N.; Johnston, K.L.; Knight, S.; Kuhnert, N. Hierarchical Scheme for LC-MSn Identification of Chlorogenic Acids. J. Agric. Food Chem. 2003, 51, 2900–2911. [Google Scholar] [CrossRef] [PubMed]
- Kim, Y.; Pyeon, J.; Lee, J.-Y.; Kim, E.-M.; La, I.-J.; Lee, O.-H.; Kim, K.; Sung, J.; Kim, Y. Chemical fingerprint analysis of fermented Morinda citrifolia L. (Noni) juice by UHPLC Q-TOF/MS combined with chemometric analysis. Appl. Biol. Chem. 2024, 67, 59. [Google Scholar] [CrossRef]
- Milinčić, D.D.; Vidović, B.B.; Gašić, U.M.; Milenković, M.; Kostić, A.Ž.; Stanojević, S.P.; Ilić, T.; Pešić, M.B. A systematic UHPLC Q-ToF MS approach for the characterization of bioactive compounds from freeze-dried red goji berries (L. barbarum L.) grown in Serbia: Phenolic compounds and phenylamides. Food Chem. 2024, 456, 140044. [Google Scholar] [CrossRef]
- Wu, M.-R.; Tang, L.-H.; Chen, Y.-Y.; Shu, L.-X.; Xu, Y.-Y.; Yao, Y.-Q.; Li, Y.-B. Systematic characterization of the chemical constituents in vitro and in vivo of Qianghuo by UPLC-Q-TOF-MS/MS. Fitoterapia 2024, 172, 105758. [Google Scholar] [CrossRef]
- Zhu, M.; Wei, P.; Peng, Q.; Qin, S.; Zhou, Y.; Zhang, R.; Zhu, C.; Zhang, L. Simultaneous qualitative and quantitative evaluation of Toddalia asiatica root by using HPLC-DAD and UPLC-QTOF-MS/MS. Phytochem. Anal. 2019, 30, 164–181. [Google Scholar] [CrossRef]
- Li, S.-N.; Bing, Y.-F.; Wu, S.; Luo, L.-T.; Sun, Z.-W.; Li, W.-L.; Qu, Z.-Y.; Zou, X. Discovery and verification of anti-inflammatory-related quality markers in the aerial part of Bupleurum scorzonerifolium by UPLC-Q-TOF-MS/MS and in RAW 264.7 cells and a zebrafish model. Phytochem. Anal. 2024, 35, 336–349. [Google Scholar] [CrossRef]
- Li, R.; Liu, S.-k.; Song, W.; Wang, Y.; Li, Y.-j.; Qiao, X.; Liang, H.; Ye, M. Chemical analysis of the Tibetan herbal medicine Carduus acanthoides by UPLC/DAD/qTOF-MS and simultaneous determination of nine major compounds. Anal. Methods 2014, 6, 7181–7189. [Google Scholar] [CrossRef]
- Xu, Y.; Cai, H.; Cao, G.; Duan, Y.; Pei, K.; Tu, S.; Zhou, J.; Xie, L.; Sun, D.; Zhao, J.; et al. Profiling and analysis of multiple constituents in Baizhu Shaoyao San before and after processing by stir-frying using UHPLC/Q-TOF-MS/MS coupled with multivariate statistical analysis. J. Chromatogr. B 2018, 1083, 110–123. [Google Scholar] [CrossRef]
- Hsieh, C.-Y.; Chang, S.-T. Antioxidant Activities and Xanthine Oxidase Inhibitory Effects of Phenolic Phytochemicals from Acacia confusa Twigs and Branches. J. Agric. Food Chem. 2010, 58, 1578–1583. [Google Scholar] [CrossRef]
- Clifford, M.N.; Zheng, W.; Kuhnert, N. Profiling the chlorogenic acids of aster by HPLC–MSn. Phytochem. Anal. Int. J. Plant Chem. Biochem. Tech. 2006, 17, 384–393. [Google Scholar] [CrossRef]
- Rodríguez-Medina, I.C.; Beltrán-Debón, R.; Molina, V.M.; Alonso-Villaverde, C.; Joven, J.; Menéndez, J.A.; Segura-Carretero, A.; Fernández-Gutiérrez, A. Direct characterization of aqueous extract of Hibiscus sabdariffa using HPLC with diode array detection coupled to ESI and ion trap MS. J. Sep. Sci. 2009, 32, 3441–3448. [Google Scholar] [CrossRef] [PubMed]
- Hu, X.; Chen, L.; Shi, S.; Cai, P.; Liang, X.; Zhang, S. Antioxidant capacity and phenolic compounds of Lonicerae macranthoides by HPLC–DAD–QTOF-MS/MS. J. Pharm. Biomed. Anal. 2016, 124, 254–260. [Google Scholar] [CrossRef]
- Zhou, Y.; Fung-Kei Choi, F.; He, Z.Z.; Song, J.-Z.; Qiao, C.-F.; Liu, X.; Ding, L.-S.; Gesang, S.-L.; Xu, H.-X. Optimisation of ultra-performance LC conditions using response surface methodology for rapid separation and quantitative determination of phenolic compounds in Artemisia minor. J. Sep. Sci. 2010, 33, 3675–3682. [Google Scholar] [CrossRef] [PubMed]
- Talaty, N.; Takáts, Z.; Cooks, R.G. Rapid in situ detection of alkaloids in plant tissue under ambient conditions using desorption electrospray ionization. Analyst 2005, 130, 1624–1633. [Google Scholar] [CrossRef]
- Li, X.; Zhang, Y.; Zeng, X.; Yang, L.; Deng, Y. Chemical profiling of bioactive constituents in Sarcandra glabra and its preparations using ultra-high-pressure liquid chromatography coupled with LTQ Orbitrap mass spectrometry. Rapid Commun. Mass Spectrom. 2011, 25, 2439–2447. [Google Scholar] [CrossRef]
- Bourgou, S.; Bettaieb Rebey, I.; Mkadmini, K.; Isoda, H.; Ksouri, R.; Ksouri, W.M. LC-ESI-TOF-MS and GC-MS profiling of Artemisia herba-alba and evaluation of its bioactive properties. Food Res. Int. 2017, 99, 702–712. [Google Scholar] [CrossRef]
- Zhen, B.-X.; Cai, Q.; Li, F. Chemical components and protective effects of Atractylodes japonica Koidz. ex Kitam against acetic acid-induced gastric ulcer in rats. World J. Gastroenterol. 2023, 29, 5848. [Google Scholar] [CrossRef]
- Engström, M.T.; Pälijärvi, M.; Salminen, J.-P. Rapid Fingerprint Analysis of Plant Extracts for Ellagitannins, Gallic Acid, and Quinic Acid Derivatives and Quercetin-, Kaempferol- and Myricetin-Based Flavonol Glycosides by UPLC-QqQ-MS/MS. J. Agric. Food Chem. 2015, 63, 4068–4079. [Google Scholar] [CrossRef]
- Farag, M.A.; Sakna, S.T.; El-fiky, N.M.; Shabana, M.M.; Wessjohann, L.A. Phytochemical, antioxidant and antidiabetic evaluation of eight Bauhinia L. species from Egypt using UHPLC–PDA–qTOF-MS and chemometrics. Phytochemistry 2015, 119, 41–50. [Google Scholar] [CrossRef]
- Zhang, J.; Wang, Y.; Wulu, J.; Jin, W.; Yang, Q.; Zhang, Z. Two Erigeron species comparison based on their ingredient profile by UPLC-PDA-QTOF-MS/MS and discriminant analysis. Rapid Commun. Mass Spectrom. 2025, 39, e9929. [Google Scholar] [CrossRef]
- Lin, P.; Dai, Y.; Yao, Z.; Qin, Z.; He, L.; Wang, Q.; Wei, Z.; Zhang, Y.; Yao, X. Metabolic profiles and pharmacokinetics of Qingre Xiaoyanning capsule, a traditional Chinese medicine prescription of Sarcandrae Herba, in rats by UHPLC coupled with quadrupole time-of-flight tandem mass spectrometry. J. Sep. Sci. 2019, 42, 784–796. [Google Scholar] [CrossRef] [PubMed]
- Hokkanen, J.; Mattila, S.; Jaakola, L.; Pirttilä, A.M.; Tolonen, A. Identification of Phenolic Compounds from Lingonberry (Vaccinium vitis-idaea L.), Bilberry (Vaccinium myrtillus L.) and Hybrid Bilberry (Vaccinium x intermedium Ruthe L.) Leaves. J. Agric. Food Chem. 2009, 57, 9437–9447. [Google Scholar] [CrossRef] [PubMed]
- Zhu, J.; Yi, X.; Zhang, J.; Chen, S.; Wu, Y. Chemical profiling and antioxidant evaluation of Yangxinshi Tablet by HPLC–ESI-Q-TOF-MS/MS combined with DPPH assay. J. Chromatogr. B 2017, 1060, 262–271. [Google Scholar] [CrossRef]
- Zhou, H.; Liang, J.; Lv, D.; Hu, Y.; Zhu, Y.; Si, J.; Wu, S. Characterization of phenolics of Sarcandra glabra by non-targeted high-performance liquid chromatography fingerprinting and following targeted electrospray ionisation tandem mass spectrometry/time-of-flight mass spectrometry analyses. Food Chem. 2013, 138, 2390–2398. [Google Scholar] [CrossRef]
- Zhu, Z.; Zhang, H.; Zhao, L.; Dong, X.; Li, X.; Chai, Y.; Zhang, G. Rapid separation and identification of phenolic and diterpenoid constituents from Radix Salvia miltiorrhizae by high-performance liquid chromatography diode-array detection, electrospray ionization time-of-flight mass spectrometry and electrospray ionization quadrupole ion trap mass spectrometry. Rapid Commun. Mass Spectrom. 2007, 21, 1855–1865. [Google Scholar]
- Ramabulana, A.-T.; Steenkamp, P.; Madala, N.; Dubery, I.A. Profiling of chlorogenic acids from Bidens pilosa and differentiation of closely related positional isomers with the aid of UHPLC-QTOF-MS/MS-based in-source collision-induced dissociation. Metabolites 2020, 10, 178. [Google Scholar] [CrossRef]
- Feng, S.; Deng, G.; Liu, H.; Shi, H.; Li, P.; Li, X.; Chen, T.; Zhou, L.; Yuan, M.; Ding, C. Extraction and identification of polyphenol from Camellia oleifera leaves using tailor-made deep eutectic solvents based on COSMO-RS design. Food Chem. 2024, 444, 138473. [Google Scholar] [CrossRef]
- Luo, Q.; Dai, K.; Ma, A. Study on the chemical constituents of Sarcandra glabra by HPLC-ESI-MS/MS. J. Chin. Med. Mater. 2009, 32, 526–529. [Google Scholar]
- Lee, Y.H.; Kim, B.; Kim, S.; Kim, M.-S.; Kim, H.; Hwang, S.-R.; Kim, K.; Lee, J.H. Characterization of metabolite profiles from the leaves of green perilla (Perilla frutescens) by ultra high performance liquid chromatography coupled with electrospray ionization quadrupole time-of-flight mass spectrometry and screening for their antioxidant properties. J. Food Drug Anal. 2017, 25, 776–788. [Google Scholar]
- Jang, H.-J.; Lim, H.-J.; Park, E.-J.; Lee, S.-J.; Lee, S.; Lee, S.W.; Rho, M.-C. STAT3-inhibitory activity of sesquiterpenoids and diterpenoids from Curcuma phaeocaulis. Bioorganic Chem. 2019, 93, 103267. [Google Scholar] [CrossRef]
- Marinaccio, L.; Gentile, G.; Llorent-Martínez, E.J.; Zengin, G.; Masci, D.; Flamminii, F.; Stefanucci, A.; Mollica, A. Valorization of grape pomace extracts against cranberry, elderberry, rose hip berry, goji berry and raisin extracts: Phytochemical profile and in vitro biological activity. Food Chem. 2025, 463, 141323. [Google Scholar] [CrossRef] [PubMed]
- Tan, T.; Luo, Y.; Zhong, C.-C.; Xu, X.; Feng, Y. Comprehensive profiling and characterization of coumarins from roots, stems, leaves, branches, and seeds of Chimonanthus nitens Oliv. using ultra-performance liquid chromatography/quadrupole-time-of-flight mass spectrometry combined with modified mass defect filter. J. Pharm. Biomed. Anal. 2017, 141, 140–148. [Google Scholar] [PubMed]
- Liu, H.; Tsim, K.W.K.; Chou, G.-X.; Wang, J.-M.; Ji, L.-L.; Wang, Z.-T. Phenolic Compounds from the Rhizomes of Dioscorea bulbifera. Chem. Biodivers. 2011, 8, 2110–2116. [Google Scholar] [CrossRef] [PubMed]
- Gan, Y.; Yang, T.; Gu, W.; Guo, L.; Qiu, R.; Wang, S.; Zhang, Y.; Tang, M.; Yang, Z. Using HS-GC-MS and flash GC e-nose in combination with chemometric analysis and machine learning algorithms to identify the varieties, geographical origins and production modes of Atractylodes lancea. Ind. Crops Prod. 2024, 209, 117955. [Google Scholar] [CrossRef]
- Mena, P.; Calani, L.; Dall’ Asta, C.; Galaverna, G.; García-Viguera, C.; Bruni, R.; Crozier, A.; Del Rio, D. Rapid and Comprehensive Evaluation of (Poly)phenolic Compounds in Pomegranate (Punica granatum L.) Juice by UHPLC-MSn. Molecules 2012, 17, 14821–14840. [Google Scholar] [CrossRef]
- Akbari, S.; Abdurahman, N.H.; Yunus, R.M.; Alsaggaf, A.H.A.; Ahmed, N. LC-QTOF-MS analysis of phenolics and saponins extracted from Aloe vera leaves via microwave technology in optimal condition. S. Afr. J. Bot. 2021, 139, 362–373. [Google Scholar] [CrossRef]
- Xu, C.; Xiao, Y.; Sun, S.; Liu, S. Extraction and analysis of volatile components from flue-cured tobacco flower. Acta Tabacaria Sin. 2014, 20, 23–27. [Google Scholar]
- Tesso, H.; König, W.A.; Son, P.T.; Giang, P.M. Composition of the essential oil of flowers of Chloranthus spicatus (Thunb.) Makino. Flavour Fragr. J. 2006, 21, 592–597. [Google Scholar] [CrossRef]
- Ozel, M.Z.; Gogus, F.; Lewis, A.C. Subcritical water extraction of essential oils from Thymbra spicata. Food Chem. 2003, 82, 381–386. [Google Scholar] [CrossRef]
- Zhang, S.; Li, Y.; Chen, G.; Wang, X.; Wu, B. Sarcandra glabra (Thunb.) Nakai alleviates DSS-induced ulcerative colitis by promoting restitution, restoring barrier function, and modulating IL-17/Notch1/FoxP3 pathway in intestinal cells. J. Ethnopharmacol. 2024, 328, 118131. [Google Scholar] [CrossRef]
- Zeng, Y.; Liu, J.; Zhang, Q.; Qin, X.; Li, Z.; Sun, G.; Jin, S. The Traditional Uses, Phytochemistry and Pharmacology of Sarcandra glabra (Thunb.) Nakai, a Chinese Herb With Potential for Development: Review. Front. Pharmacol. 2021, 12, 652926. [Google Scholar] [CrossRef] [PubMed]
- Liu, J.; Li, X.; Lin, J.; Li, Y.; Wang, T.; Jiang, Q.; Chen, D. Sarcandra glabra (Caoshanhu) protects mesenchymal stem cells from oxidative stress: A bioevaluation and mechanistic chemistry. BMC Complement. Altern. Med. 2016, 16, 423. [Google Scholar] [CrossRef] [PubMed]
- Liu, T.-Y.; Chen, S.-B. Sarcandra glabra combined with lycopene protect rats from lipopolysaccharide induced acute lung injury via reducing inflammatory response. Biomed. Pharmacother. 2016, 84, 34–41. [Google Scholar] [CrossRef] [PubMed]
- Su, X.; Liu, B.; Gong, F.; Yin, J.; Sun, Q.; Gao, Y.; Lv, Z.; Wang, X. Isofraxidin attenuates IL-1β-induced inflammatory response in human nucleus pulposus cells. J. Cell. Biochem. 2019, 120, 13302–13309. [Google Scholar] [CrossRef]


| No. | RT (min) | Compound | Formula | Mode | m/z | Error (10−6) | Basis | Comment |
|---|---|---|---|---|---|---|---|---|
| 1 | 1.10 | Quinic acid | C7H12O6 | −H | 191.0565 | 2.2 | [23] | organic acid |
| 2 | 1.40 | Shikimic acid | C7H10O5 | −H | 173.0459 | 2.0 | [24] | organic acid |
| 3 | 2.28 | Gallic Acid | C7H6O5 | −H | 169.0149 | 3.8 | [24] | organic acid |
| 4 | 5.12 | Neochlorogenic acid | C16H18O9 | −H | 353.0867 | −3.2 | RS [25] | organic acid |
| 5 | 5.48 | p-Coumaric acid | C9H8O3 | −H | 163.0409 | 4.8 | [26] | organic acid |
| 6 | 5.92 | Esculin | C15H16O9 | +H | 341.0870 | 0.8 | [27] | coumarin |
| 7 | 7.19 | 1-p-Coumaroylquinic acid | C16H18O8 | −H | 337.0922 | −2.1 | [28] | organic acid |
| 8 | 7.80 | Catechin | C15H14O6 | −H | 289.0720 | 1.0 | [29] | polyphenol |
| 9 | 7.90 | 7-Hydroxycoumarin | C9H6O3 | +H | 163.0389 | −0.5 | [30] | coumarin |
| 10 | 7.95 | Scopolin | C16H18O9 | +H | 355.1022 | −0.5 | [31] | coumarin |
| 11 | 8.03 | Chlorogenic acid | C16H18O9 | −H | 353.0867 | −3.0 | RS [32] | organic acid |
| 12 | 8.23 | Esculetin | C9H6O4 | +H | 179.0336 | −1.4 | [33] | coumarin |
| 13 | 8.88 | Caffeic acid | C9H8O4 | −H | 179.0356 | 3.4 | RS [23] | organic acid |
| 14 | 8.90 | 3-Feruloylquinic acid | C17H20O9 | −H | 367.1021 | −3.6 | [34] | organic acid |
| 15 | 8.99 | 4-Hydroxycoumarin | C9H6O3 | +H | 163.0389 | −0.2 | [33] | coumarin |
| 16 | 9.16 | 4-Caffeoylquinic acid | C16H18O9 | −H | 353.0867 | −3.1 | RS [23] | organic acid |
| 17 | 9.49 | Fraxin | C16H18O10 | +H | 371.0981 | 2.3 | [35] | coumarin |
| 18 | 9.82 | 8-Hydroxy-6-methoxycoumarin | C10H8O4 | +H | 193.0493 | −1.1 | [36] | coumarin |
| 19 | 10.12 | Fraxetin | C10H8O5 | +H | 209.0441 | −1.5 | RS [37] | coumarin |
| 20 | 10.28 | Eleutheroside B1 | C17H20O10 | −H | 383.0966 | −4.6 | RS [38] | coumarin |
| 21 | 10.28 | Fraxidin | C11H10O5 | −H | 221.0460 | 2.1 | [39] | coumarin |
| 22 | 10.68 | Catechin 3-O-α-L-rhamnopyranoside | C21H24O10 | −H | 435.1295 | −0.4 | [40] | polyphenol |
| 23 | 10.68 | Epicatechin | C15H14O6 | −H | 289.0720 | 0.6 | [40] | polyphenol |
| 24 | 11.20 | Benzyl alcohol xylopyranosyl-(1-6)-glucopyranoside | C18H26O10 | −H | 401.1434 | −4.8 | other | |
| 25 | 11.30 | Coumarin | C9H6O2 | +H | 147.0440 | −0.5 | [27] | coumarin |
| 26 | 11.46 | 5-p-Coumaroylquinic acid | C16H18O8 | −H | 337.0918 | −3.2 | [41] | organic acid |
| 27 | 11.53 | 1-Caffeoylquinic acid | C16H18O9 | −H | 353.0881 | 0.8 | [23] | organic acid |
| 28 | 11.60 | 5-O-Caffeoylshikimic acid | C16H16O8 | −H | 335.0763 | −2.8 | [42] | organic acid |
| 29 | 11.93 | 3-O-Caffeoylshikimic acid | C16H16O8 | −H | 335.0767 | −1.5 | [43] | organic acid |
| 30 | 12.20 | 4-p-Coumaroylquinic acid | C16H18O8 | −H | 337.0921 | −2.5 | [41] | organic acid |
| 31 | 12.35 | Fraxidin-8-O-β-D-glucopyranoside | C17H20O10 | −H | 383.0985 | 0.2 | [44] | coumarin |
| 32 | 12.61 | Kaempferol 3,7-diglucoside | C27H30O16 | −H | 609.1463 | 0.3 | [26] | flavones |
| 33 | 12.78 | 4-O-Caffeoylshikimic acid | C16H16O8 | −H | 335.0766 | −1.9 | [43] | organic acid |
| 34 | 13.48 | Ferulic acid | C10H10O4 | −H | 193.0511 | 4.8 | [34] | organic acid |
| 35 | 13.73 | 5-Feruloylquinic acid | C17H20O9 | −H | 367.1020 | −4.1 | [41] | organic acid |
| 36 | 14.09 | 4-Feruloylquinic acid | C17H20O9 | −H | 367.1022 | −3.4 | [41] | organic acid |
| 37 | 15.05 | Scopoletin | C10H8O4 | +H | 193.0494 | −0.8 | [45] | coumarin |
| 38 | 15.24 | 3-p-Coumaroylquinic acid | C16H18O8 | −H | 337.0917 | −3.5 | [41] | organic acid |
| 39 | 15.35 | Sarcaglaboside G | C21H30O9 | +H | 427.1965 | 0.7 | [46] | sesquiterpenoids |
| 40 | 17.03 | Isofraxidin | C11H10O5 | −H | 221.0458 | 1.2 | RS [47] | coumarin |
| 41 | 17.12 | 8β,9α-Dihydroxyeudesman-4(15), 7(11)-dien-8α,12-olide | C15H20O4 | +H | 265.1433 | −0.5 | [48] | sesquiterpenoids |
| 42 | 18.44 | Liriope Muscari baily saponins C | C21H20O11 | −H | 447.0929 | −1.0 | [49] | flavones |
| 43 | 19.29 | Neoastilbin | C21H22O11 | −H | 449.1066 | −5.2 | RS [50] | flavones |
| 44 | 19.58 | Rutin | C27H30O16 | −H | 609.1465 | 0.6 | RS [51] | flavones |
| 45 | 19.72 | Quercetin-7-O-β-D-glucopyranoside | C21H20O12 | −H | 463.0868 | −3.0 | [49] | flavones |
| 46 | 19.79 | 8β,9α-Dihydroxylindan-4(5), 7(11)-dien-8α,12-olide | C15H18O4 | +H | 263.1277 | −0.5 | [52] | sesquiterpenoids |
| 47 | 19.81 | Quercetin-3-O-glucuronide | C21H18O13 | −H | 477.0654 | −4.4 | RS [53] | flavones |
| 48 | 20.15 | Isoquercitrin | C21H20O12 | −H | 463.0883 | 0.2 | [49] | flavones |
| 49 | 20.23 | Chloranoside B | C21H28O9 | +H | 425.1810 | 0.9 | sesquiterpenoids | |
| 50 | 20.47 | Astilbin | C21H22O11 | −H | 449.1069 | −4.5 | RS [50] | flavones |
| 51 | 20.53 | Urolignoside | C26H34O11 | +H | 567.2084 | 2.0 | [54] | other |
| 52 | 21.08 | 1α,8α,9α-Trihydroxyeudesman-3(4),7(11)-dien-8β,12-olide | C15H20O5 | +H | 281.1381 | −0.8 | sesquiterpenoids | |
| 53 | 21.88 | Atractylenolide IV | C15H22O4 | +H | 267.1591 | 0.0 | [39] | sesquiterpenoids |
| 54 | 22.21 | Scoparone | C11H10O4 | +H | 207.0650 | −0.8 | [37] | coumarin |
| 55 | 22.68 | Rosmarinic acid 4-O-β-D-glucoside | C24H26O13 | −H | 521.1302 | 0.3 | [55] | organic acid |
| 56 | 22.89 | Kaempferol 3-O-rutinoside | C27H30O15 | −H | 593.1517 | 0.9 | [33] | flavones |
| 57 | 23.08 | Methyl caffeate | C10H10O4 | −H | 193.0512 | 3.1 | [56] | organic acid |
| 58 | 23.24 | 4,5-Dicaffeoylquinic acid | C25H24O12 | −H | 515.1175 | −3.9 | [23] | organic acid |
| 59 | 23.37 | Luteolin 7-O-glucuronide | C21H18O12 | −H | 461.0710 | −3.4 | RS [27] | flavones |
| 60 | 23.52 | Astragalin | C21H20O11 | −H | 447.0935 | 0.4 | [49] | flavones |
| 61 | 23.68 | 3,5-Dicaffeoylquinic acid | C25H24O12 | −H | 515.1172 | −4.5 | [23] | organic acid |
| 62 | 24.89 | Sarcaglaboside A | C21H30O8 | +H | 411.2010 | −1.0 | [46] | sesquiterpenoids |
| 63 | 24.97 | Glabraoside A | C30H30O13 | −H | 597.1620 | 1.0 | [46] | other |
| 64 | 26.27 | Rosmarinic acid | C18H16O8 | −H | 359.0776 | 0.9 | RS [55] | organic acid |
| 65 | 26.27 | Salvianic acid A | C9H10O5 | −H | 197.0464 | 4.3 | [56] | organic acid |
| 66 | 26.56 | 3,4-Dicaffeoylquinic acid | C25H24O12 | −H | 515.1173 | −4.2 | [23] | organic acid |
| 67 | 27.49 | 3-p-Coumaroyl-5-caffeoylquinic acid | C25H24O11 | −H | 499.1250 | 0.8 | [57] | organic acid |
| 68 | 27.50 | Phloridzin | C21H24O10 | −H | 435.1295 | −0.3 | [58] | flavones |
| 69 | 28.49 | Chloranoside A | C21H28O9 | +H | 425.1806 | −0.1 | [46] | sesquiterpenoids |
| 70 | 29.35 | N-trans-Feruloyltyramine | C18H19NO4 | −H | 312.1238 | −1.1 | [42] | organic acid |
| 71 | 30.42 | 4-Caffeoyl-5-p-coumaroylquinic acid | C25H24O11 | −H | 499.1217 | −5.9 | [57] | organic acid |
| 72 | 31.78 | Quercetin | C15H10O7 | −H | 301.0347 | −2.2 | RS [49] | flavones |
| 73 | 32.09 | Istanbulin A | C15H20O4 | +H | 265.1432 | −1.0 | [59] | sesquiterpenoids |
| 74 | 32.32 | Methyl rosmarinate | C19H18O8 | −H | 373.0919 | −2.8 | [60] | organic acid |
| 75 | 33.60 | Sarcandralactone B | C15H20O3 | +H | 249.1483 | −0.7 | [61] | sesquiterpenoids |
| 76 | 35.07 | 1,4-Dioxaspiro[4.4]nonane-6-heptanoic acid, 8-(acetyloxy)-7-carboxy-, 6-methyl ester | C18H28O8 | −H | 371.1714 | 0.8 | [58] | other |
| 77 | 36.43 | Naringenin | C15H12O5 | −H | 271.0610 | −0.8 | [62] | flavones |
| 78 | 37.25 | 3, 3′-diisofraxidin | C22H18O10 | +H | 443.0971 | −0.5 | [27] | coumarin |
| 79 | 37.37 | Arteminorin A | C22H18O10 | −H | 441.0828 | 0.1 | [63] | coumarin |
| 80 | 37.95 | Kaempferol | C15H10O6 | −H | 285.0400 | −1.7 | RS [49] | flavones |
| 81 | 38.71 | 3,7-Dihydroxy-2,4-dimethoxyphenanthrene | C16H14O4 | −H | 269.0827 | 3.0 | [64] | other |
| 82 | 40.52 | Shizukanolide | C15H18O3 | +H | 247.1327 | −0.6 | [65] | sesquiterpenoids |
| 83 | 41.85 | Pinocembrine | C15H12O4 | −H | 255.0669 | 2.5 | [66] | flavones |
| 84 | 42.55 | Atractylenolide I | C15H18O2 | +H | 231.1378 | −0.9 | [39] | sesquiterpenoids |
| 85 | 42.55 | Atractylenolide III | C15H20O3 | +H | 249.1484 | −0.5 | [39] | sesquiterpenoids |
| 86 | 43.57 | Nudol | C16H14O4 | −H | 269.0830 | 3.9 | [67] | phenanthrene |
| 87 | 43.92 | Shizukanolide A | C15H18O2 | +H | 231.1377 | −0.9 | [68] | sesquiterpenoids |
| 88 | 44.54 | Atractylenolide II | C15H20O2 | +H | 233.1533 | −1.3 | RS [39] | sesquiterpenoids |
| 89 | 45.29 | Chloranthalactone A | C15H16O2 | +H | 229.1222 | −0.7 | [69] | sesquiterpenoids |
| 90 | 46.86 | Spathulenol | C15H24O | +H | 221.1896 | −1.6 | [70] | sesquiterpenoids |
| 91 | 49.02 | Linolenic acid | C18H30O2 | −H | 277.2186 | 4.5 | RS [60] | organic acid |
| 92 | 50.17 | Linoleic acid | C18H32O2 | −H | 279.2341 | 4.0 | RS [60] | organic acid |
| Numbers | Similarity | Numbers | Similarity |
|---|---|---|---|
| S1 | 0.971 | S13 | 0.916 |
| S2 | 0.922 | S14 | 0.991 |
| S3 | 0.933 | S15 | 0.882 |
| S4 | 0.970 | S16 | 0.936 |
| S5 | 0.947 | S17 | 0.957 |
| S6 | 0.957 | S18 | 0.945 |
| S7 | 0.815 | S19 | 0.992 |
| S8 | 0.960 | S20 | 0.842 |
| S9 | 0.975 | S21 | 0.903 |
| S10 | 0.951 | S22 | 0.970 |
| S11 | 0.863 | S23 | 0.848 |
| S12 | 0.900 | S24 | 0.881 |
| Numbers | Source | Numbers | Source |
|---|---|---|---|
| S1 | Yongfu Town, Zhangping City, Longyan City, Fujian Province | S13 | Xingan County, Ji’an City, Jiangxi Province |
| S2 | Pucheng County, Nanping City, Fujian Province | S14 | Hongya County, Meishan City, Sichuan Province |
| S3 | Tuorong County, Ningde City, Fujian Province | S15 | Panzhihua City, Sichuan Province |
| S4 | Yong’an City, Sanming City, Fujian Province | S16 | Laochang Township, Ya’an City, Sichuan Province |
| S5 | Nanjing County, Zhangzhou City, Fujian Province | S17 | Si Jing Township, Ya’an City, Sichuan Province, China |
| S6 | Liping County, Qiandongnan Prefecture, Guizhou Province | S18 | Wenshan Zhuang and Miao Autonomous Prefecture, Yunnan Province |
| S7 | Sandu County, Qiannan Prefecture, Guizhou Province | S19 | Tiandeng County, Chongzuo City, Guangxi Zhuang Autonomous Region |
| S8 | Shibing County, Qiandongnan Miao and Dong Autonomous Prefecture, Guizhou Province | S20 | Guilin City, Guangxi Zhuang Autonomous Region |
| S9 | Chongyi County, Ganzhou City, Jiangxi Province | S21 | Lingchuan County, Guilin City, Guangxi Zhuang Autonomous Region |
| S10 | Dayu County, Ganzhou City, Jiangxi Province | S22 | Ziyuan County, Guilin City, Guangxi Zhuang Autonomous Region |
| S11 | Quannan County, Ganzhou City, Jiangxi Province | S23 | Babu District, Hezhou City, Guangxi Zhuang Autonomous Region |
| S12 | Anfu County, Ji’an City, Jiangxi Province | S24 | Liuzhou City, Guangxi Zhuang Autonomous Region |
Disclaimer/Publisher’s Note: The statements, opinions and data contained in all publications are solely those of the individual author(s) and contributor(s) and not of MDPI and/or the editor(s). MDPI and/or the editor(s) disclaim responsibility for any injury to people or property resulting from any ideas, methods, instructions or products referred to in the content. |
© 2025 by the authors. Licensee MDPI, Basel, Switzerland. This article is an open access article distributed under the terms and conditions of the Creative Commons Attribution (CC BY) license (https://creativecommons.org/licenses/by/4.0/).
Share and Cite
Zhong, Z.; Deng, P.; Luo, X.; Zhu, W.; Cui, P.; Li, Z.; Xiao, Z.; Shen, Y.; Wu, X. Multi-Component Characterization and Quality Evaluation Strategy of Sarcandrae Herba by Combining Dual-Column Tandem HPLC Fingerprint and UPLC-Q-TOF-MS/MS. Molecules 2025, 30, 1825. https://doi.org/10.3390/molecules30081825
Zhong Z, Deng P, Luo X, Zhu W, Cui P, Li Z, Xiao Z, Shen Y, Wu X. Multi-Component Characterization and Quality Evaluation Strategy of Sarcandrae Herba by Combining Dual-Column Tandem HPLC Fingerprint and UPLC-Q-TOF-MS/MS. Molecules. 2025; 30(8):1825. https://doi.org/10.3390/molecules30081825
Chicago/Turabian StyleZhong, Zhijian, Pan Deng, Xiaorong Luo, Weifeng Zhu, Pengdi Cui, Zhe Li, Zhiqiang Xiao, Yu Shen, and Xinyu Wu. 2025. "Multi-Component Characterization and Quality Evaluation Strategy of Sarcandrae Herba by Combining Dual-Column Tandem HPLC Fingerprint and UPLC-Q-TOF-MS/MS" Molecules 30, no. 8: 1825. https://doi.org/10.3390/molecules30081825
APA StyleZhong, Z., Deng, P., Luo, X., Zhu, W., Cui, P., Li, Z., Xiao, Z., Shen, Y., & Wu, X. (2025). Multi-Component Characterization and Quality Evaluation Strategy of Sarcandrae Herba by Combining Dual-Column Tandem HPLC Fingerprint and UPLC-Q-TOF-MS/MS. Molecules, 30(8), 1825. https://doi.org/10.3390/molecules30081825