Article

The SR Splicing Factors: Providing Perspectives on Their Evolution, Expression, Alternative Splicing, and Function in Populus trichocarpa

1
State Key Laboratory of Subtropical Silviculture, School of Forestry and Biotechnology, Zhejiang Agriculture and Forestry University, Hangzhou 311300, China
2
Institute of Tropical Biosciences and Biotechnology, Chinese Academy of Tropical Agricultural Sciences, Haikou 571101, China
3
Key Laboratory of Nutrition, Metabolism and Food Safety, Shanghai Institute of Nutrition and Health (SINH), Chinese Academy of Sciences (CAS), Shanghai 200032, China
*
Authors to whom correspondence should be addressed.
Contributed equally to this work.
Int. J. Mol. Sci. 2021, 22(21), 11369; https://doi.org/10.3390/ijms222111369
Submission received: 24 September 2021 / Revised: 15 October 2021 / Accepted: 18 October 2021 / Published: 21 October 2021
(This article belongs to the Special Issue Mechanism and Regulation of Pre-mRNA Splicing)

Abstract

:
Serine/arginine-rich (SR) proteins are important splicing factors in plant development and abiotic/hormone-related stresses. However, evidence that SR proteins contribute to the process in woody plants has been lacking. Using phylogenetics, gene synteny, transgenic experiments, and RNA-seq analysis, we identified 24 PtSR genes and explored their evolution, expression, and function in Popolus trichocarpa. The PtSR genes were divided into six subfamilies, generated by at least two events of genome triplication and duplication. Notably, they were constitutively expressed in roots, stems, and leaves, demonstrating their fundamental role in P. trichocarpa. Additionally, most PtSR genes (~83%) responded to at least one stress (cold, drought, salt, SA, MeJA, or ABA), and, especially, cold stress induced a dramatic perturbation in the expression and/or alternative splicing (AS) of 18 PtSR genes (~75%). Evidentially, the overexpression of PtSCL30 in Arabidopsis decreased freezing tolerance, which probably resulted from AS changes of the genes (e.g., ICE2 and COR15A) critical for cold tolerance. Moreover, the transgenic plants were salt-hypersensitive at the germination stage. These indicate that PtSCL30 may act as a negative regulator under cold and salt stress. Altogether, this study sheds light on the evolution, expression, and AS of PtSR genes, and the functional mechanisms of PtSCL30 in woody plants.

1. Introduction

Alternative splicing (AS) is an important mechanism in the regulation of gene expression in eukaryotes, which enhances transcriptome and proteome diversity [1,2]. Over 95% of human protein-coding genes can be alternatively spliced to produce multiple transcripts, such as KCNMA1 can produce more than 500 mRNA isoforms [3,4]. In plants, about 83% and 73% of intron-containing genes undergo AS in Arabidopsis thaliana and Oryza sativa, respectively [5,6]. There are mainly five different types of AS events, including exon-skipping (ES), intron retention (IR), mutually exclusive exons (MXE), alternative 5′ splice site (A5SS) and 3′ splice site selection (A3SS) [7]. IR is a major mode of AS in plants, whereas ES is a predominant mode in animals [8,9,10]. The importance of AS has been clearly manifested by the genetic hereditary diseases caused by splicing defects [11,12].
Due to a sessile life form, plants need unique adaptive developmental and physiological strategies to cope with environmental perturbations. AS is emerging as an important process affecting plant development and tolerance to biotic and abiotic stresses. AS can regulate transcriptome and proteome plasticity to respond rapidly to environmental stresses by adjusting the abundance of the functional transcripts of the stress-related genes, such as protein kinases, transcription factors, splicing regulators, and pathogen-resistance genes [13]. For example, hundreds of genes, such as novel cold-responsive transcription factors and splicing factor/RNA-binding proteins, showed rapid AS changes in response to cold (called ‘early AS’ genes) [14]. More than 6,000 genes were reported to undergo changes of AS patterns under salt stress [15,16]. In addition, AS is also involved in a range of other functions, such as photosynthesis, circadian clock, flowering time, and metabolism [17,18,19,20].
Pre-mRNA splicing processing is catalyzed by a spliceosome, a large flexible RNA-protein complex consisting of five small nuclear ribonucleoprotein particles (snRNPs) and numerous types of non-snRNP proteins [21,22]. Serine/arginine-rich (SR) proteins, the major regulators in the splicing of pre-mRNAs, are evolutionarily conserved splicing factors [23,24]. In plants, SR proteins were defined as one or two N-terminal RNA recognition motifs (RRMs) followed by a downstream RS domain of at least 50 amino acids with over 20% SR or RS dipeptide [25]. SR family proteins have been identified in many plant species, such as green algae, moss, and various flowering plants. The number of SR genes varies among different species; for example, there are 18 members in Arabidopsis, 22 in O. sativa, 21 in Dimocarpus longan Lour, 40 in Triticum aestivum, and 18 in Brachypodium distachyon [26,27,28,29]. Plant SR proteins can be classified into six subfamilies, including SR, SC, RSZ, RS, SCL, and RS2Z. The SR, SC, and RSZ subfamilies have orthologs in mammals, while the RS, SCL, and RS2Z subfamilies are unique to plants with novel structural features [25]. RS subgroup members have two RRM domains, and the second RRM domain lacks the SWQDLKD signature, which is a characteristic of SR-subfamily proteins. RS2Z subfamily members have two Zn-knuckles and one RS domain, followed by an SP-rich region. SCL-subfamily members have a single RRM domain followed by an RS domain, and possess a short N-terminal extension that contains multiple RS and SP dipeptides [30,31].
Plant SR genes are involved in various plant growth and development processes. The overexpression of AtSRp30 resulted in a delayed transition from the nutrition to reproductive periods, prolonged life cycle, and increased individual size [32]. The loss of Arabidopsis SC35/SCL proteins led to multiple effects on plant morphology and development, such as serrated leaves and later flowering [33]. Additionally, plant SR genes can be alternatively spliced, and their splicing patterns are affected by various developmental and environmental signals. For example, the overexpression of RSZ36 and SRp33b can change the splicing patterns of RSZ36 and SRp32 in rice, respectively [34]. High temperatures may increase the expression of the active isoforms of SR30 but reduce the active isoform of SR34 in Arabidopsis [35]. Moreover, SR genes may allow functional redundancy in the processes of plant growth and development. In Arabidopsis, the sc35-scl quintuple mutant (scl28 scl30 scl30a scl33 sc35) exhibited the obvious phenotypes of serrated rosette leaves and late-flowering, while no obvious morphological alterations were observed in the double or triple mutants [33].
Populus trichocarpa is a model species of woody plants in which to study the repertoire of biological processes in trees [36]. However, no systematic analysis and functional characterization of the SR gene family has been reported in this woody plant. In this study, we identified the PtSR-family genes of P. trichocarpa and performed comprehensive analyses of the identified PtSR genes. In addition to their evolution, we also investigated the expression profiles and AS events of PtSR genes in different tissues and under various stresses. Moreover, we demonstrated the function of a plant-specific SR gene PtSCL30 through the overexpression in Arabidopsis and RNA-seq analyses. Our results provide a resource for SR genes with respect to their evolution, expression, and alternative splicing in P. trichocarpa, contributing to the knowledge of RNA-splicing in trees’ development and responses to environmental stresses.

2. Results

2.1. Identification of PtSR Family Genes and Their Characteristics

Firstly, we searched for the homologs of Arabidopsis SR proteins in P. trichocarpa genome by the BLASTP program [37]. Taking account of the definition of the RS domain, which has at least 50 amino acids sharing over 20% RS content by consecutive RS or SR dipeptides in plants [25], we screened the homologs to obtain a total of 24 PtSR proteins. We then assessed the basic characteristics of the 24 PtSR proteins; for example, their molecular weights (MWs) ranged from 20.46 to 34.56 kDa, with an average value of 29.3 kDa (Table S1). Of note, all the proteins had an extremely high isoelectric point (pI) between 9.9 and 11.6, and, consequently, were highly cationic at neutral or acid pH. This is supported by the fact that SR proteins can bind the negatively charged RNA in nuclei [38]. Additionally, based on the grand average of hydropathy (GRAVY) values, all the proteins were predicted to be hydrophilic between −1.772 and −0.881, supporting the soluble nature of PtSR proteins. Detailed characteristics of the assessed PtSR-family genes are presented in Table S1.

2.2. Phylogenetic and Architectural Analysis of PtSR Family Genes

Since SR genes have been widely studied in Arabidopsis, we selected SR genes from Arabidopsis as a reference and constructed a phylogenetic tree based on the full-length alignment of the SR proteins in the species Arabidopsis and P. trichocarpa (Figure 1A). PtSR proteins were classified into the six known subfamilies, SR, SC, RSZ, RS, SCL, and RS2Z. This result agreed well with those from Arabidopsis [39], indicating that the SR gene family was highly conserved, at least in the dicots. As compared to animals, ~50% of PtSR genes were plant-specifically evolved SR genes, including the previously reported RS, SCL, and RS2Z subfamilies [25].
Gene exon/intron structure diversity is one of the possible mechanisms for explaining the evolution of multiple gene families, to which end, we further analyzed the structures of the PtSR genes (Figure 1B). Observably, the PtSR genes were interrupted by multiple introns, ranging between 4 and 13, and, expectedly, the clustered PtSR genes showed similar exon–intron structures and shared a recent common ancestor. In detail, the same subfamily had a very similar number of introns (Figure 1B). For example, the SR-subfamily genes had the most introns, ranging between 12 and 13, while the RS2Z-subfamily genes had the same number (six) of introns. This showed that the subfamilies of the SR-family genes were highly conserved after their divergence from their nearby subfamilies.
In the case of PtSR-protein domains, we retrieved the conserved protein domains based on the annotated domains from the Pfam database [40]. Two types of homolog-based domains were finally identified, including the RRM and zf-CCHC domains (Figure 1C). Expectedly, all the PtSR proteins had at least one RRM and RS domain. Meanwhile, some differences were also found between the subfamilies, such as the one and two zf-CCHC domains, respectively, in the RSZ and RS2Z subfamilies. Finally, and noteworthy, among the six subfamilies in P. trichocarpa, SCL was the largest, followed by SR; whereas, in Arabidopsis, three subfamilies, SCL, SR, and RS, were very close in number (Figure 1D). Next, we mapped the detailed expansion of these subfamilies.

2.3. The Expansion History of the PtSR Gene Family in P. trichocarpa

To investigate the evolution of PtSR gene family, we determined their chromosomal distributions and gene-duplication types. The PtSR genes were distributed unequally to P. trichocarpa chromosomes (the outer circle in Figure 2A). Three PtSR genes (PtRSZ22, PtSCL25 and PtRS2Z32) were located on chromosome (Chr) 6, followed by two PtSR genes on Chrs 2, 5, 8, 10, 14 and 16, respectively. Of note, except for the SCL-subfamily genes (e.g., PtSCL28 and PtSCL30) being located in the same chromosomes, genes from the same PtSR subfamily were mainly distributed to different chromosomes, declining the possibility of generating PtSR genes by tandem or proximal duplications.
To determinate molecular mechanisms generating the PtSR-family genes, we traced their expansion history and found a total of 16 collinear gene blocks, including 21 PtSR genes (the inner color lines in Figure 2A). This finding showed that the whole- and/or segmental-genome duplication pattern was the dominant molecular mechanism generating the PtSR genes. To date the events of the 16 collinearity gene blocks, we calculated the synonymous substitution rate (Ks) of the duplicated gene pairs (Table S2) and found the blocks could be mainly classified into two categories (Figure 2B). The first category included six gene pairs (shown in blue lines and dots in Figure 2A,B), and their Ks values varied between 1.5649 and 2.1702 (Figure 2B, Table S2), which were around the whole-genome triplication event (i.e., γ) in the recent common ancestor of P. trichocarpa and Arabidopsis [41]. The other category included ten gene pairs (shown in red lines and dots in Figure 2A,B), and their Ks values varied between 0.2164 and 0.6339 (Figure 2B, Table S2), and were concentrated around the most recent whole-genome duplication event of P. trichocarpa [42]. This recent duplication event was successful in replicating the genes of the SCL and SR subfamilies (Figure 2), explaining well the existing larger number of the two subfamilies in P. trichocarpa than in Arabidopsis (Figure 1D). Together, the two categories demonstrated at least two expansion stages of the SR gene family through genome polyploidization, which provided the dominant molecular mechanism producing the existing PtSR genes in P. trichocarpa.
Accompanied by the duplications of SR genes, their flanking promoters were also copied. Next, we investigated the enriched functions and the promoter cis-acting elements of the PtSR genes.

2.4. GO Term Enrichment and Promoter Cis-element Analysis of PtSR Genes

We performed GO term-enrichment analysis of PtSR genes to investigate the molecular functions and biological processes that PtSR genes might participate in. The result showed that PtSR genes could participate in various biological processes, such as spliceosome assembly, RNA splicing, mRNA export, the regulation of metabolic processes, the response to stress, and the regulation of gene expression (Figure 3A). This indicated that PtSR genes not only act as splicing factors for RNA-splicing and metabolism processes at the post-transcriptional level, but also might be involved in the diverse and complicated regulation of gene expression at the transcriptional level.
To identify the cis-acting elements in the promoters of PtSR genes, we analyzed the 2-kb sequences upstream of the translation-start sites of PtSR genes in PlantCARE [43] (Figure 3B). Firstly, there were well-known housekeeping cis-acting elements in the promoters of all the PtSR genes, such as TATA-box and CAAT-box. Also, some cis-acting elements were enriched in response to phytohormones, such as abscisic acid (ABA), methyl jasmonate (MeJA), salicylic acid (SA), and gibberellin (GA). Furthermore, the cis-acting elements were also enriched in response to abiotic stresses, such as low-temperature, drought, defense and stress, and anaerobic induction (Figure 3B, Table S3). The housekeeping and hormone/abiotic-responded cis-elements, together, demonstrated that PtSR genes are probably expressed in constitutive regulation, but also in response to hormone/abiotic stresses, and we next studied their expressions in P. trichocarpa tissues and under hormone/abiotic stresses.

2.5. Constitutive and Abundant Expression Patterns of PtSR Genes in P. trichocarpa

To investigate the expression profiles of PtSR genes, we analyzed the expression levels of PtSR genes by RNA-seq data in P. trichocarpa tissues including roots, stems, and leaves. According to RNA-seq data, we found that PtSR genes mainly exhibited constitutive expression profiles in all of the three tissues (Figure 4A), and the relative expression levels of PtSR genes were significantly higher than the background-expressed genes (Figure 4B). Of note, many SR genes showed an observably higher expression than the well-known housekeeping gene (Figure 4A). The results together suggested that PtSRs were constitutively and abundantly expressed in different tissues of P. trichocarpa.

2.6. Perturbation in PtSR Gene Expressions by Hormones and Abiotic Stresses

As described above, the cis-element analysis indicated that PtSR genes might also be involved in abiotic and hormone stresses. In this section, we analyzed the expression profiles of PtSR genes under hormone treatments (SA, MeJA, and ABA) and abiotic stresses (cold, drought, and salt). Of the 24 PtSR genes, 17 (~70%) were differentially expressed under at least one of the six stresses. In the hormone treatments, PtRSZ22a was significantly induced by ABA, PtSR30 and PtSR30a were respondent to SA, and PtSR30a and PtRS2Z32 responsed to MeJA (Figure 5A). Among them, PtSR30a was induced by both hormones. In contrast, 12 (50%) of the PtSR genes were differentially regulated under cold treatment, including one down-regulated versus eleven up-regulated ones (Figure 5). We found that PtSR genes showed different responses at different time points of cold stress. Some PtSR genes were significantly up-regulated at 7 d of cold stress, such as PtSR34, PtSR35a, PtSC35, and PtRS40. Moreover, PtRSZ22a, PtSCL28a, PtSCL30, and PtRS2Z32 were significantly up-regulated at both time points. Under drought stress, we found that only PtSCL25 was differentially expressed. Under salt treatment, eight PtSR genes were differentially expressed (Figure 5A). Except that PtRSZ22a was down-regulated, seven PtSR genes including PtSR30, PtSR30a, PtRSZ21, PtSCL25, PtSCL26, PtSCL28a, and PtRSZ32 were up-regulated uniquely at 7 d salt treatment. Considering that PtSR genes were generally upregulated by abiotic/hormone stresses, we suggested an enhancing splicing role of PtSR genes under these stresses, especially cold conditions.

2.7. Conserved Alternative Splicing of PtSR Genes in P. trichocarpa Tissues and Their Perturbance by Hormones and Abiotic Stresses

The SR pre-mRNAs themselves can also be alternatively spliced in different plant tissues and in response to diverse stress treatments [44]. In order to determine either tissue- and/or stress-specific AS of PtSR genes, we performed a detailed analysis of splicing variants in P. trichocarpa tissues (e.g., roots, stems, and leaves) under various stresses (e.g., cold, drought, salt, SA, MeJA, and ABA) by RT-PCR (Figure 6). By AS, over 45 transcripts were produced from the 24 PtSR genes, resulting in nearly two-fold increased complexity of the SR family genes (Table S6). In detail, some PtSR genes showed only one transcript, while the others underwent AS events to generate multiple transcripts and there were stress-specific, e.g., cold-induced AS of PtSCL33 (Figure 6). Excepting that some transcripts were produced by excluding parts of exon regions, most of the alternative transcripts were produced by IR events. Moreover, the PtSR genes with conserved exon/intron structures generally showed conserved AS events, such as inPtSCL25 and PtSCL26 (Figure 6). Among the roots, stems, and leaves, the AS genes showed a conserved AS regulation (Figure 6) as well as the conserved expression patterns described above (Figure 4).
Compared to normal condition, abiotic stresses could alter their AS variants (Figure 6). Of the abiotic stresses, cold significantly altered the AS outcomes of seven PtSR genes (i.e., PtSCL33, PtSCL26, PtSCL25, PtSR30, PtSR30a, PtSR34a, and PtRS41), together likely contributing to an increase of the long transcripts (Figure 6). For example, the abundance of THE basic transcript of PtSR34a (the short transcript) decreased gradually with the prolongation of treatment time, and the long transcript became more abundant after 7 d of cold treatment. Moreover, a novel long transcript of PtSCL33 appeared after 24 h cold treatment, and this transcript became more abundant than the basic one after 7 d of cold treatment (Figure 6). In contrast, drought and salt stresses, together, altered only five PtSRs’ AS patterns (i.e., PtSCL26, PtSCL25, PtSR30, PtSR30a, and PtRS41), likely contributing to an increase in the short transcripts. For example, the short transcript abundance of PtSCL26 was low, while its abundance increased under drought and salt stresses, especially after 7 d of salt treatment. Another example is that the long transcript of PtSCL25 disappeared under 7 d of drought and 7 d of salt stress, whereas the short transcript continually accumulated. Under hormone treatments, some PtSR genes (e.g., PtSR30a, PtSR34a, PtSR35, and PtRS41) altered their AS patterns, and the alterations were mainly reflected in the changes in abundances and the disappearance of some transcripts (Figure 6). For example, the long transcript of PtSR30a disappeared after the hormone treatments. Moreover, and of importance, we noticed that different plant development stages also affected the AS patterns of PtSR genes, such as PtSR34 and PtSR35 in the CK controls of different sampling times (Figure 6).
Together, the findings showed a conserved AS regulation as well as their conserved expression patterns among the three tissues, implying the conserved housekeeping roles of PtSR genes in the normal growth of P. trichocarpa tissues. In contrast, the abiotic/hormone stresses induced a perturbation of AS regulation as well as its expression, and especially, cold resulted in the most changes of AS patterns by IR events, increasing the long transcripts of PtSR genes, which might play crucial roles in the cold response. We next exemplified a cold-affected PtSR gene to explore the molecular mechanism and functions of PtSR genes.

2.8. Overexpression of PtSCL30 Decreased the Freezing Tolerance of Arabidopsis

To further explore the function of PtSCL30, we transformed PtSCL30 into Arabidopsis and obtained fourteen 35S::PtSCL30 overexpression (OE) lines, which were confirmed by RT-PCR and qRT-PCR (Figure S1). Finally, three independent stable homozygous 35S::PtSCL30 overexpression lines (OE2, OE10, and OE16) were selected for further analysis. As described above, PtSCL30 was significantly upregulated by cold stress, we further investigated the freezing tolerance of 35S::PtSCL30 OE lines. Under normal conditions (22 °C), no significant difference was observed between the wild-type plants Col-0 and 35S::PtSCL30 OE lines. However, after freezing treatment (−7 °C), most of the 35S::PtSCL30 OE lines exhibited freezing-sensitive phenotypes (Figure 7A), and meanwhile, the survival rates of 35S::PtSCL30 OE lines were significantly lower than Col-0 (Figure 7B). Our results suggested that the overexpression of PtSCL30 decreased the freezing tolerance of Arabidopsis and the underlying molecular mechanism is examined in the next section.

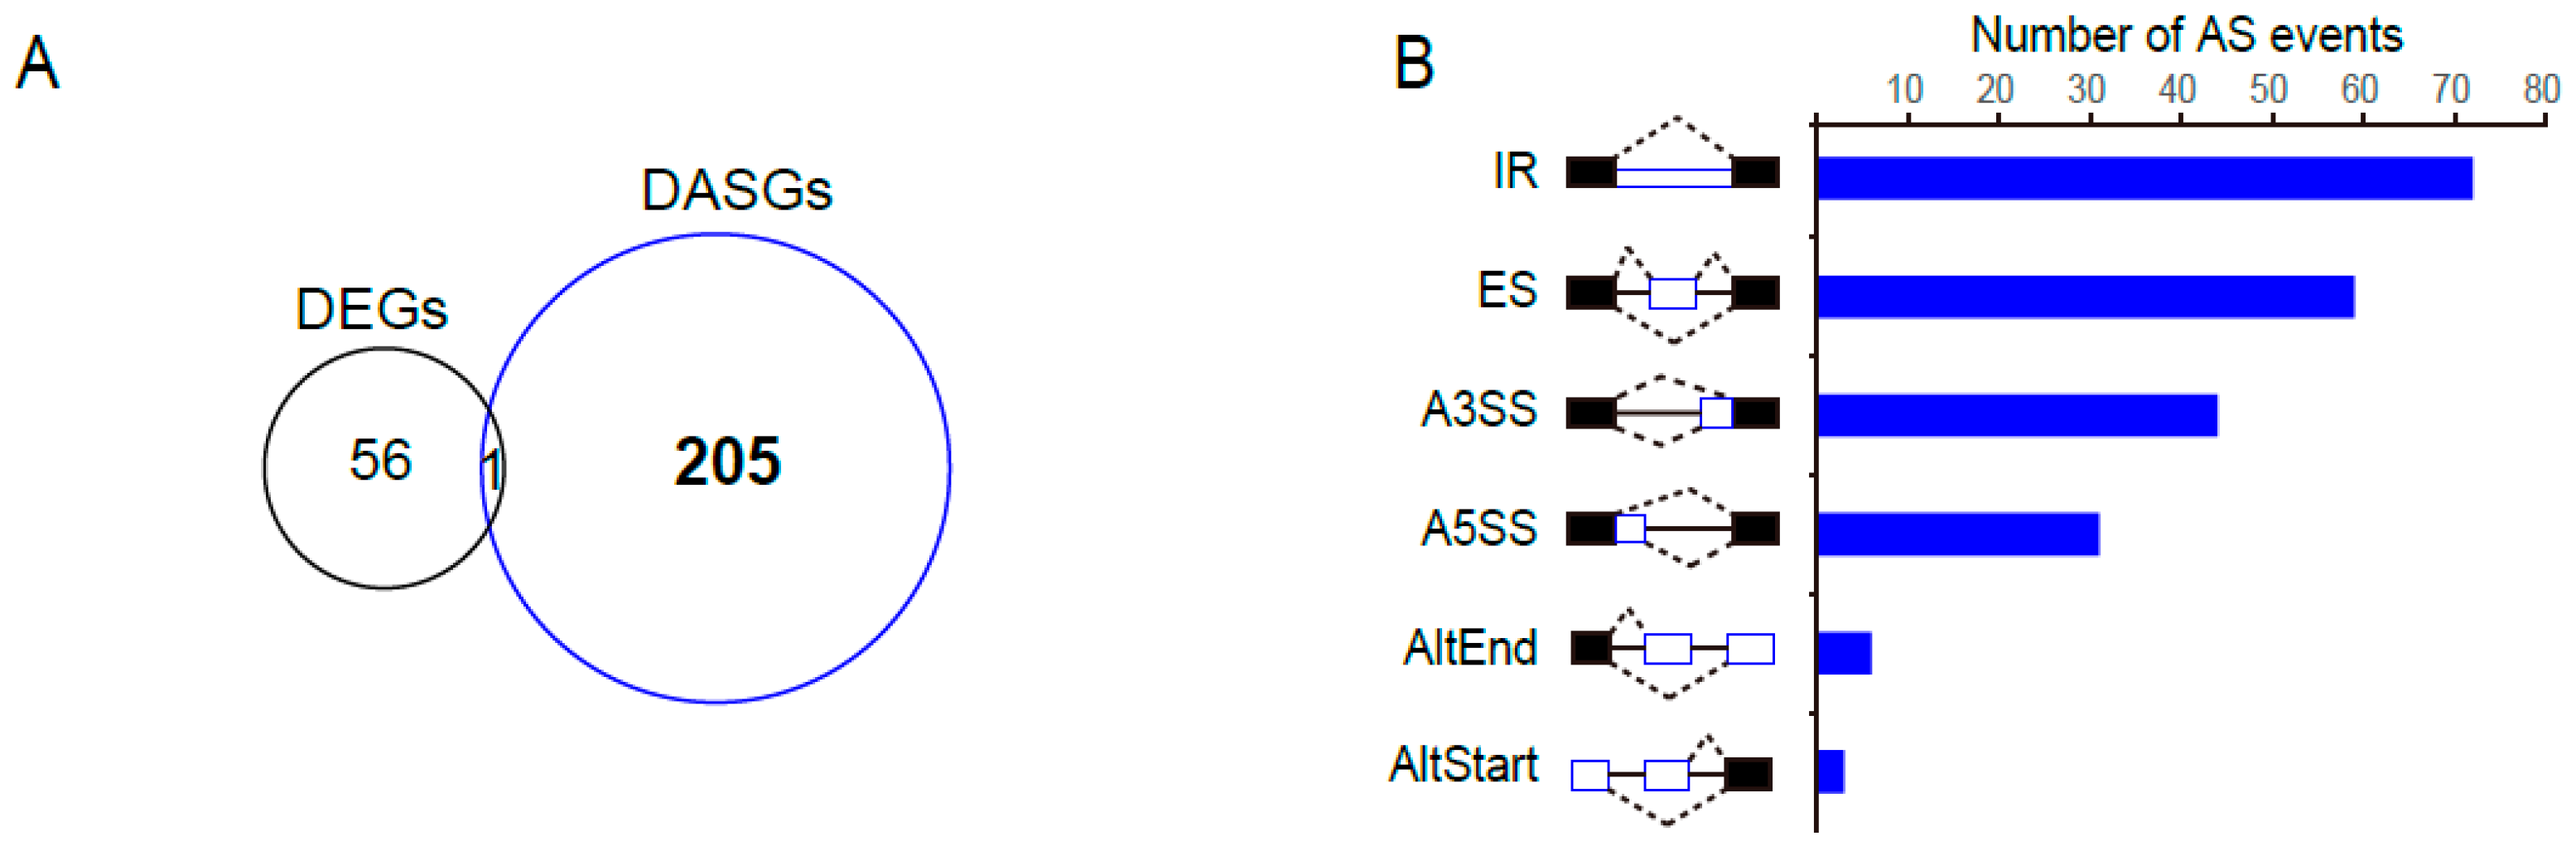
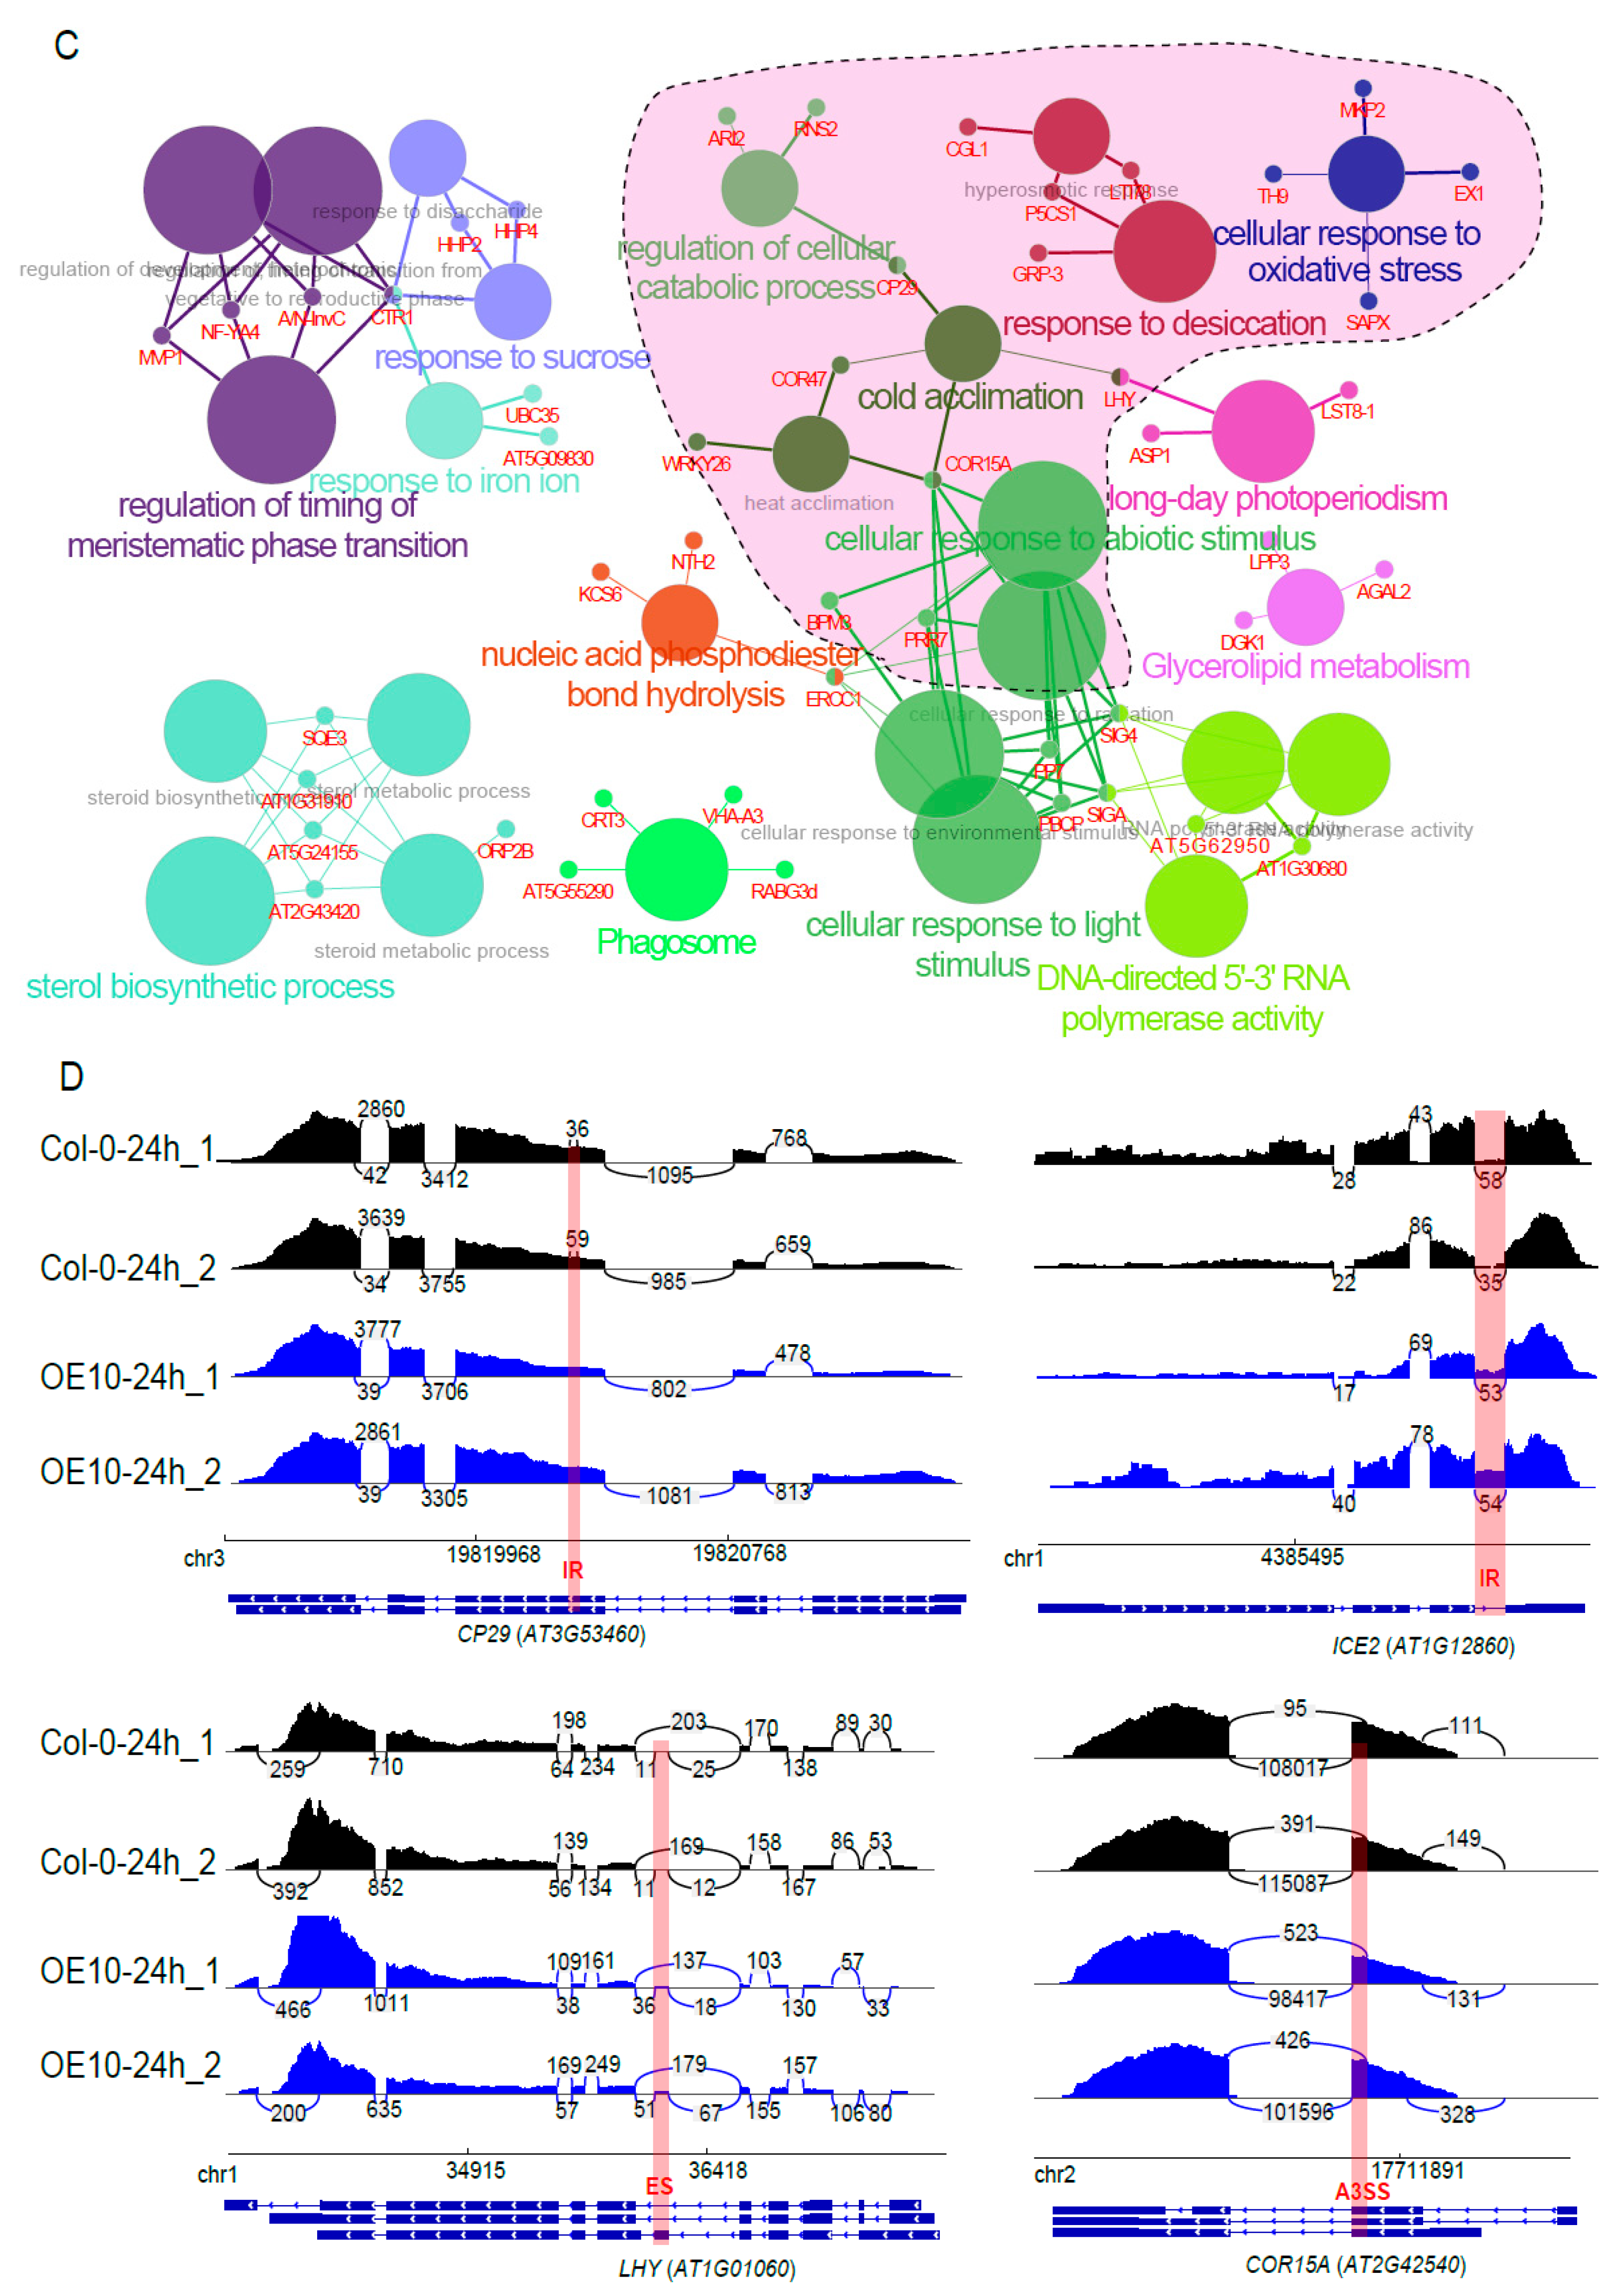
2.9. PtSCL30 Overexpression Affected the Alternative Splicing of Hundreds of Genes, including Cold-Responsive Genes

We applied high-throughput sequencing to analyze the alteration of transcriptomes between three-week old 35S::PtSCL30 OE line (OE10) and wild-type plant (Col-0) under cold stress. Compared to Col-0, we identified 57 DEGs and 206 DASGs in OE10 (Figure 8A). Observably, the overlap of DEGs and DASGs was very limited, showing an independent regulation of gene expression and alternative splicing induced by PtSCL30 overexpression. However, the number of DASGs was much higher than that of DEGs, indicating that PtSCL30 might mainly act as a splicing factor to regulate gene splicing under cold stress. We further assessed the AS types of these DASGs occurring in OE10. Of the types, IR was the largest one, followed by ES (Figure 8B). Furthermore, we performed GO enrichment analysis for the PtSCL30-affected DASGs (Figure 8C). The results showed that DASGs could participate in regulating of the timing of the meristematic phase transition, response to sucrose, sterol biosynthetic process, response to desiccation, cellular response to oxidative stress, regulation of cellular catabolic process, cold acclimation, and so on (Figure 8C); the strikingly PtSCL30-affected network involved in abiotic stress is indicated in red shadow, also in Figure 8C. Of the DASGs, we presented four examples that had been reported to play critical roles in the process of the cold response [45], including CP29 (AT3G53460), ICE2 (AT1G12860), LHY (AT1G01060), and COR15A (AT2G42540) (Figure 8D). These cold-responsive genes were differentially regulated in AS under cold stress in PtSCL30 overexpression as compared with Col-0. In addition to cold response, we noticed that PtSCL30 can regulate the alternative splicing of genes in response to oxidative and desiccation stresses (Figure 8C). To further explore its role, we examined the phenotypes of 35S::PtSCL30 OE lines under salt and drought stresses.

2.10. PtSCL30 Overexpression Were Hypersensitive to Salt Stress

At the germination stage, the 35S::PtSCL30 OE lines were more sensitive to salt stress than Col-0 (Figure 9A) and the germination rate and cotyledon-greening rate of the 35S::PtSCL30 OE lines were dramatically lower than for Col-0 (Figure 9B–D), although the difference of root length was not significant (Figure 9E,F). For drought stress, we analyzed the fresh weight and root length of plants after 7 d of vertical growth in 1/2 MS-mannitol medium with mannitol (0 mM, 100 mM, and 200 mM), and found only a subtle difference between Col-0 and 35S::PtSCL30 OE lines (Figure 9G–I). These results suggested that 35S::PtSCL30 OE lines were hypersensitive to salt stress at germination stage, whereas the function of PtSCL30 might be limited in the drought stress.

3. Discussion

SR proteins are well-known splicing factors that play important roles in both the assembly of spliceosomes and the regulation of alternative splicing. In plants, SR family genes have been widely studied in the model plant Arabidopsis. SR34 (previously named SR1) was the first SR gene identified in Arabidopsis [46]. Then, the SR gene family of Arabidopsis has been extensively studied, including gene family analysis, variable splicing under stress and hormone treatments, functions of individual SR genes, and interaction between SR genes and other splicing factors [47,48,49]. In addition, the SR-related genes such as SR45 were also found deepening [50,51].
In this study, we totally identified 24 PtSR genes in P. trichocarpa and performed comprehensive analyses on their evolution, expression, and functions. In the same fashion as the model plant Arabidopsis, PtSR genes can also be divided into six subfamilies, demonstrating an ancient origin and the probable conserved functions of the SR genes in plants, as members within the same subfamily had similar gene structures and shared conserved motifs, implying that PtSR genes in the same subfamily may be functionally redundant. Plants generally have more SR proteins than do animals, which may be due to multiple paralogous gene pairs produced by the expansion of the plant SR family within several rounds of genome replication. PtSR genes were distributed unequally on P. trichocarpa chromosomes, with 16 collinear gene blocks, indicating that whole/segmental-genome duplication plays an important role in expanding PtSR family genes.
Environmental stresses adversely affect plant growth and productivity, and plants have to evolve multiple biochemical and molecular mechanisms in response to various stresses for survival. Notably, plant SR proteins could function as central coordinators of responses to environmental changes. Stress signals can affect both the phosphorylation status and subcellular localization of some SR proteins [52]. Therefore, SR genes can participate in multiple abiotic stress and phytohormonal responses. In Arabidopsis, the sr34b mutant was sensitive to cadmium by regulating the IRON-REGULATED TRANSPORTER 1 (IRT1) gene [53]. The sr40 and sr41 mutants displayed salt and ABA hypersensitivity [54]. The overexpression of MeSR34 enhanced the tolerance to salt stress in transgenic Arabidopsis through maintaining ROS homeostasis and affecting the CBL-CIPK pathway [55]. We found that 70% of the PtSR genes were significantly differentially expressed under hormone and abiotic stress treatments in P. trichocarpa, while cold was the most obvious abiotic stress that affected the expression of PtSR genes. In addition, the results of qRT-PCR were not always consistent with the cis-elements analysis of the promoter region. For example, no stress responsive cis-element was found in the promoter region of PtRS2Z32 (Table S3), but qRT-PCR results suggested that PtRS2Z32 was induced by cold, salt and MeJA treatments. This strongly indicates that there may be some unrevealed stress responsive cis-elements in regulating of the response to stress in P. trichocarpa. It also may be due to the regulation of PtSR gene on other stress-responsive genes.
Alternative splicing (AS) is an important mechanism in the regulation of gene expression, and this post-transcriptional process greatly enhances transcriptome and proteome complexity. Of note, SR genes can also be alternatively spliced, and participate in diverse life progresses of plants. For example, 45 transcripts were found from 18 MeSR genes under normal conditions, while 55 transcripts were identified under salt treatment [55]. In Arabidopsis, about 95 transcripts were produced from only 15 SR genes, thereby increasing the complexity of the SR gene-family transcriptome by six-fold [47]. In this study, we found that ~42% of the PtSR genes could be alternatively spliced in tissues and/or under abiotic/hormone stresses, and 45 transcripts were produced from the 24 PtSR genes. Under abiotic/hormone stress treatments, the AS patterns of some PtSR genes were altered, implying that the alteration of AS variants of PtSR genes may be related to the splicing-site selection or splicing-assembly changes in responses to stress. Moreover, no AS event of the RSZ subfamily genes was found in different tissues or under various stresses, which may be related to the fundamental roles of this subfamily of genes.
Different isoforms of a gene that undergo alternative splicing may play antagonistic roles in plant-growth and defense responses. For example, PtrWND1B could produce two transcripts (PtrWND1B-s and PtrWND1B-l) that played antagonistic roles in fiber cell-wall thickening [56]. In this study, about 42% PtSR genes changed their AS patterns under phytohormonal and abiotic stresses. There were significant differences in the number and abundance of PtSR transcripts expressed under different stresses or different treatment time points. Long transcripts of PtSR genes greatly accumulated under cold stress, suggesting that PtSR genes may play important roles in the response to cold.
It has been reported that SR genes participate in the alternative splicing of other genes and play important roles in stress responses. However, little is known about the function of SR genes in P. trichocarpa. We therefore investigated the role of PtSCL30 in response to stress. We found that the overexpression of PtSCL30 decreased the freezing tolerance of Arabidopsis, and the 35S::PtSCL30 OE lines were hypersensitive to salt stress at the germination stage. These results indicate that PtSCL30 may act as a negative regulator in cold and salt response by affecting the alternative splicing of the relevant genes. However, this is in contradiction with the positive role of the RS domains of AtSRL1 and AtRCY1 in the tolerance to salt stress [57]. This is likely because the overexpression of full-length (including the RRM and RS domains) or only the RS domains from SR genes would result in different stress phenotypes by inducing different gene-splicing outcomes. To further explore the genes that were regulated by the overexpression of PtSCL30 in response to cold, we analyzed the RNA-seq results of the Col-0 and 35S::PtSCL30 OE lines (OE10) under cold-stress (4 °C) treatment for 24 h. PtSCL30 not only affected the expression of Arabidopsis genes, but also mainly acted as a splicing factor to regulate the alternative splicing of some Arabidopsis genes, such as cold-related genes (CP29, ICE2, LHY, and COR15A), which may result in the freezing-sensitive phenotype of the 35S::PtSCL30 lines under cold treatment.
Our results indicate that PtSR genes may participate in multiple aspects of plant growth and development through their responses to various environmental conditions. Therefore, investigating the molecular mechanisms of different transcripts of PtSR genes in response to stresses may be important in analyzing the functions of PtSR genes, and it may also provide new insights into further functional elucidation of SR genes in woody plants.

4. Materials and Methods

4.1. Identification and Basic Features of PtSR Family Genes

The genomic sequences, coding sequences (CDS), protein sequences, and gene annotations of P. trichocarpa and Arabidopsis, respectively, were downloaded from Phytozome v13.1 [58] and TAIR10 [59]. To identify PtSR genes in P. trichocarpa, we aligned Arabidopsis SR proteins against P. trichocarpa proteins to retrieve RRM-containing homologs, and, based on the definition of the RS domain [25], we obtained a total of 24 PtSR-coding genes in P. trichocarpa. Their theoretical protein isoelectric points (pI), hydrophobicities, and the grand average of hydropathicities (GRAVY) were obtained using the ProtParam tool provided by ExPASy [60].

4.2. Phylogenetic Analysis, Domain Identification, and Architecture Visualization of PtSR Genes

The SR proteins of Arabidopsis and P. trichocarpa were aligned by MAFFT v7.427 [61] to construct a phylogenetic tree by the maximum likelihood (ML) method in IQ-TREE v1.6.10 [62]. The best-fit protein-substitution model was selected upon Bayesian information criteria (BIC) in Model Finder [63]. Based on the definition of the RS domain in plants [25], we developed a PERL script to obtain the location information of the RS domain. To investigate other possible conserved functional domains within SR proteins, we downloaded the hidden Markov models (HMMs) of the proteins’ domains from the Pfam database v31.0 and used hmmscan [64] to search PtSR proteins against the HMMs with an E-value cutoff of 1 × 10⁻⁵. Accordingly, we obtained the location information of coding exons and protein domains of the PtSR family, and visualized their gene exon–intron and protein-domain architectures with TBtools v1.0971 [65].

4.3. Chromosomal Localization and Expansion History of PtSR Genes

The chromosome locations of the PtSR genes were extracted from P. trichocarpa gene annotations. To reveal the expansion history of PtSR genes, we used MCScanX [66] to trace the duplications of PtSR genes. Then, the synteny analysis results were visualized using the Circos program implemented in TBtools v1.0971 [65]. In dating whole-genome duplication (WGD)/segmental duplication events, we used MCScanX [66] to search for collinear gene pairs in the genome of P. trichocarpa or between the genomes of P. trichocarpa and Arabidopsis. Then, the synonymous substitution rate (Ks) value of each pair of collinear genes was calculated using the YN method in KaKs_Calculator 2.0 [67].

4.4. GO-Term Enrichment and Promoter Cis-Element Analysis of PtSR Genes

We firstly assigned GO terms for PtSR genes using eggnog-mapper v2 [68] and performed the GO enrichment analysis using TBtools v1.0971 [65]. Bubble-plot representations of enriched GO terms were generated by an R script. Additionally, we extracted the 2-kb sequences upstream of the translation start site of PtSR genes and then predicted their regulatory cis-elements in PlantCARE [43].

4.5. Expression Profile Analysis of PtSR Genes

P. trichocarpa transcriptome datasets of root, stem, and leaf tissues were downloaded from the NCBI Sequence Read Archive (SRA) (accession ID: ERP021848) [69]. To obtain the expressions of PtSR genes in the tissues, we employed hisat2 [70] to map the reads on the corresponding genome and stringtie [71] to calculate the transcripts-per-million-reads (TPM values) of P. trichocarpa-expressed genes, including PtSR genes. We then extracted the TPM values of PtSR genes in the three tissues and regarded the other expressed genes as background ones. Accordingly, we used R programming to plot a heatmap of the expressions of PtSR genes and a boxplot comparing the difference in expression between the PtSR genes and the background genes, wherein the P value was calculated by the Wilcoxon test.

4.6. Quantitative RT-PCR (qRT-PCR) Analysis

Total RNA was extracted using RNAprep Pure Plant Kit (Polysaccharides & Polyphenolics-rich, TIANGEN, Beijing, China), and the extracted RNA was used as a template for first-strand cDNA synthesis by the PrimeScript™ RT reagent Kit (TaKaRa, Japan) with gDNA Eraser. qRT-PCR was performed using a CFX96 Real-time PCR Detection System with ChamQ SYBR Color qPCR Master Mix (Vazyme, Nanjing, China). The primer sequences for qRT-PCR were designed using Pimer3 (Table S4). PCR reactions were performed under the following conditions: 95 °C for 3 min, which was followed by 40 cycles of 95 °C for 10 s, 58 °C for 30 s and 72 °C for 30 s. The relative expression level of each gene was analyzed using the 2−∆∆CT method [72]. The constitutively expressed Histone3 genes of HIS-1 (Potri.002G026800) and HIS-2 (Potri.005G072300) in P. trichocarpa were used as the optimal reference gene for normalization. Each sample was analyzed in triplicate.

4.7. Alternative Splicing (AS) Pattern Analysis of PtSR Genes

In order to analyze the AS patterns of PtSR genes in different tissues and various abiotic/hormone stresses, two-month old potted cultivations of P. trichocarpa seedlings, cultured in an artificial climate chamber at 25 °C and a photoperiod of 16/8 h light/dark cycle, were then treated under ABA (100 μM), SA (5 mM), MeJA (1 mM), cold (4 °C), drought (20% PEG6000), and salt (200 mM), respectively. For the hormone treatments, an aqueous solution of each hormone was sprayed on the leaves of the treated plants, and the fourth fully expanded leaves were collected after 24 h (h). For cold treatment, P. trichocarpa seedlings were cultured in an artificial climate chamber at 4 °C for a 16/8 h light/dark cycle over 7 days (d), and each fourth, fully expanded leaf was collected. For drought and salt treatments, aqueous solution of PEG6000 and NaCl were separately poured onto the soil, and the fourth, fully expanded leaf of each treated P. trichocarpa seedling was collected after the 24-h and 7-d treatments, respectively. Comprehensive analyses of the splicing patterns of PtSR genes were performed by RT-PCR. Gene-specific primers corresponding to the first and last exon (or second exon and penultimate exon) of each gene were adopted (Table S5). The amplified products were resolved in 1.2–1.5% agarose gels, and the lines, in different sizes, were purified with the SanPrep Column DNA Gel Extraction Kit (Sangon Biotech). The alternatively spliced PCR products of PtSR genes were cloned into PMDTM-19 as vectors for sequencing.

4.8. Plasmid Construction and Plant Transformation

An 822-bp fragment of PtSCL30 coding sequence was amplified with the PtSCL30-KpnIF primer GGGGTACCATGAGGAGATATAGTCCACCACACT and PtSCL30-XbaIR primer GCTCTAGATCTAGCATGCCTTGGTGACAA. Then, the amplified fragment was cloned into a pCAMBIA1300-sGFP vector between the KpnI and XbaI sites to construct the overexpression vector of PtSCL30. Next, the constructed pCAMBIA1300-PtSCL30 plasmid was transferred into Agrobacterium tumefaciens GV3101-competent cells, and the transformed Agrobacterium was used for plant transformation. The floral-dip method was used for the heterologous transformation of PtSCL30 into Arabidopsis.

4.9. Abiotic Tolerance and Seed Germination Assays

Three-week old wild-type plant Col-0 and three 35S::PtSCL30-overexpression lines (OE2, OE10, and OE16), grown in soil under a long-day photoperiod (16 h/8 h light/dark cycle) were used for the freezing-tolerance assay, as described by Jia et al. [73]. Briefly, the program was set at 4 °C for 10 min and 0 °C for 20 min and by decreased by 1 °C/h to the desired temperatures. After freezing treatment, the plants were grown at 4 °C in dark for 12 h, and then were warmed to 22 °C for an additional 3 d. The phenotype of each line was observed, and the survival rate of the lines was also counted. The sensitivity of seed germination to salt stress was assayed on 1/2 Murashige and Skoog (MS) agar plates supplemented with different concentrations of NaCl (0 mM, 150 mM, and 175 mM). Seeds were incubated at 4 °C for 48 h, and radicle emergence was used as an indication of seed germination. For salt and drought resistance assay on plates, Col-0 and 35S::PtSCL30 overexpression lines were firstly germinated on 1/2 MS media under normal conditions, and one-week old seedlings with similar root length were transferred to 1/2 MS agar plates containing various concentrations of NaCl or mannitol.

4.10. High-Throughput mRNA Sequencing and Analysis

For RNA sequencing (RNA-seq), three-week old seedlings of wild-type Arabidopsis (Col-0) and an 35S::PtSCL30 overexpression line (OE10), grown in soil at 22 °C, were treated at 4 °C for 24 h. Leaves of each line were collected, and total RNA was isolated by using the TRIzol reagent (Invitrogen, Carlsbad, CA, USA) following the manufacturer’s procedure. Then, the isolated RNA was quantified using a NanoDrop ND-1000 (NanoDrop, Wilmington, DE, USA), and the RNA integrity was assessed by Agilent 2100 (Agilent Technologies, Palo Alto, CA, USA). Finally, the isolated RNA was sent to Lianchuan Biotechnology Co., Ltd. (Hangzhou, China) to generate a cDNA library, and the constructed RNA-seq libraries were sequenced on an Illumina Hiseq 4000.
For RNA-seq analysis, the clean reads were aligned to the Arabidopsis genome and the reference transcripts (TAIR10) using hisat2-2.1.0 [70]. The gene expression was calculated using StringTie v2.0.3 [71]. Both the edgeR and DESeq2 programs [74,75] were employed to predict differentially expressed genes (DEGs), which satisfied the three criteria: the sum of the expression values (TMM) ≥ 5, log2 fold changes > 1 or < −1, and false discovery rate (FDR) < 0.05 between the compared samples. CASH [76] was finally used to detect the differentially AS genes (adjusted p value < 0.05) between the compared samples.

5. Conclusions

In this study, we identified 24 PtSR genes and their evolutionary history in P. trichocarpa, revealed their conservation and divergence of expression and AS in tissues and under abiotic/hormone stresses, and exemplified a cold-affected gene, PtSCL30, to explore its molecular mechanism and functions. The PtSR genes were divided into six subgroups, and they were distributed unequally on P. trichocarpa chromosomes with 16 collinearity gene blocks, which were generated by two expansion events of genome triplication and duplication before and after the divergence of P. trichocarpa from Arabidopsis. The protein domain architecture analysis showed that PtSR proteins were evolutionarily conserved splicing factors, and correspondingly, that PtSR genes were almost constitutively and abundantly expressed, and some were coupled with conserved AS in roots, stems, and leaves. Besides this, the expression levels of PtSR genes were significantly higher than the genomic background genes of P. trichocarpa. The constitutive and abundant expression and AS of PtSR genes strongly suggested the conserved and fundamental roles of PtSR genes in different tissues of P. trichocarpa in normal growth. The majority (~83%) of PtSR genes also responded to at least one of abiotic/hormone stresses (e.g., cold, drought, salt, SA, MeJA, or ABA), and, of these, cold stress led to a dramatic perturbation in the expression and/or AS profiles of 18 PtSR genes (~75%). In contrast to the static expression in normal growth, perturbation under abiotic/hormone stresses, especially cold stress, suggested the potential regulatory roles of PtSR genes in responses to stress. In support of this, the overexpression of cold-upregulated PtSCL30 in Arabidopsis decreased the plants’ freezing tolerance, probably through AS changes of the critical cold-responsive genes (e.g., ICE2 and COR15A) induced by PtSCL30 overexpression. Together taking account that the transgenic plants were salt-hypersensitive at the germination stage, we have suggested PtSCL30 functions as negative regulators in cold and salt stresses. These results would help decipher the screening and functional analyses of PtSR genes and may provide a foundation for further functional elucidation of SR genes in woody plants.

Supplementary Materials

The following are available online at https://www.mdpi.com/article/10.3390/ijms222111369/s1.

Author Contributions

W.W. and Y.F. designed the study. X.Z. implemented the experiments, and summarized the experimental results, and wrote the manuscript. L.T., L.G. and X.Y. carried out bioinformatics analysis and diagrams. Y.S. provided quantitative data. S.L., Y.F., S.W. and W.W. finally revised and embellished the manuscript. All authors have read and agreed to the published version of the manuscript.

Funding

This work was supported by the National Natural Science Foundation of China (grant number 31871233).

Institutional Review Board Statement

Not applicable.

Informed Consent Statement

Not applicable.

Data Availability Statement

The data that supports the findings of this study are available in the Supplemental data at IJMS online. The transcriptome data of the Col-0 and 35S::PtSCL30 overexpression lines (OE10) under cold stress have been deposited at the NCBI (PRJNA760989) and CNSA (CNP0002192).

Acknowledgments

We thank Fuqiang Cui, Hua Liu, Cheng Jiang and the members from Wu’s laboratory in Zhejiang A and F University for suggestions to improve the manuscript.

Conflicts of Interest

The authors declare no conflict of interest.

Abbreviations

SRserine/arginine-rich
ASalternative splicing
GOgene ontology
snRNPsmall nuclear ribonucleoprotein particle
CDScoding sequences
GFFgenomic structure information
pIprotein isoelectric point
MLmaximum likelihood
HMMhidden Markov model
Kssynonymous substitutions rate
EFenrichment factor
MWmolecular weight
ZFzinc finger
WGDwhole-genome duplication
ABAabscisic acid
MeJAmethyl jasmonate
SAsalicylic acid
GAgibberellin
MSMurashige and Skoog
DEGsdifferentially expressed genes
DASGsdifferentially alternatively spliced genes

References

  1. Reddy, A.S. Plant serine/arginine-rich proteins and their role in pre-mRNA splicing. Trends Plant Sci. 2004, 9, 541–547. [Google Scholar] [CrossRef]
  2. Reddy, A.S.; Marquez, Y.; Kalyna, M.; Barta, A. Complexity of the alternative splicing landscape in plants. Plant Cell 2013, 25, 3657–3683. [Google Scholar] [CrossRef] [Green Version]
  3. Wang, E.T.; Sandberg, R.; Luo, S.; Khrebtukova, I.; Zhang, L.; Mayr, C.; Kingsmore, S.F.; Schroth, G.P.; Burge, C.B. Alternative isoform regulation in human tissue transcriptomes. Nature 2008, 456, 470–476. [Google Scholar] [CrossRef] [PubMed] [Green Version]
  4. Nilsen, T.W.; Graveley, B.R. Expansion of the eukaryotic proteome by alternative splicing. Nature 2010, 463, 457–463. [Google Scholar] [CrossRef] [PubMed] [Green Version]
  5. Zhu, F.Y.; Chen, M.X.; Ye, N.H.; Shi, L.; Ma, K.L.; Yang, J.F.; Cao, Y.Y.; Zhang, Y.; Yoshida, T.; Fernie, A.R.; et al. Proteogenomic analysis reveals alternative splicing and translation as part of the abscisic acid response in Arabidopsis seedlings. Plant J. 2017, 91, 518–533. [Google Scholar] [CrossRef] [PubMed] [Green Version]
  6. Chen, M.X.; Zhu, F.Y.; Gao, B.; Ma, K.L.; Zhang, Y.; Fernie, A.R.; Chen, X.; Dai, L.; Ye, N.H.; Zhang, X.; et al. Full-Length Transcript-Based Proteogenomics of Rice Improves Its Genome and Proteome Annotation. Plant Physiol. 2020, 182, 1510–1526. [Google Scholar] [CrossRef] [PubMed]
  7. Matlin, A.J.; Clark, F.; Smith, C.W. Understanding alternative splicing: Towards a cellular code. Nat. Rev. Mol. Cell Biol. 2005, 6, 386–398. [Google Scholar] [CrossRef] [PubMed]
  8. Ner-Gaon, H.; Halachmi, R.; Savaldi-Goldstein, S.; Rubin, E.; Ophir, R.; Fluhr, R. Intron retention is a major phenomenon in alternative splicing in Arabidopsis. Plant J. 2004, 39, 877–885. [Google Scholar] [CrossRef] [PubMed]
  9. Pan, Q.; Shai, O.; Lee, L.J.; Frey, B.J.; Blencowe, B.J. Deep surveying of alternative splicing complexity in the human transcriptome by high-throughput sequencing. Nat. Genet. 2008, 40, 1413–1415. [Google Scholar] [CrossRef] [PubMed]
  10. Shen, Y.; Zhou, Z.; Wang, Z.; Li, W.; Fang, C.; Wu, M.; Ma, Y.; Liu, T.; Kong, L.A.; Peng, D.L.; et al. Global dissection of alternative splicing in paleopolyploid soybean. Plant Cell 2014, 26, 996–1008. [Google Scholar] [CrossRef] [PubMed] [Green Version]
  11. Kornblihtt, A.R.; Schor, I.E.; Allo, M.; Dujardin, G.; Petrillo, E.; Munoz, M.J. Alternative splicing: A pivotal step between eukaryotic transcription and translation. Nat. Rev. Mol. Cell Biol. 2013, 14, 153–165. [Google Scholar] [CrossRef]
  12. Kim, H.K.; Pham, M.H.C.; Ko, K.S.; Rhee, B.D.; Han, J. Alternative splicing isoforms in health and disease. Pflugers Arch. 2018, 470, 995–1016. [Google Scholar] [CrossRef]
  13. Mastrangelo, A.M.; Marone, D.; Laido, G.; De Leonardis, A.M.; De Vita, P. Alternative splicing: Enhancing ability to cope with stress via transcriptome plasticity. Plant Sci. 2012, 185–186, 40–49. [Google Scholar] [CrossRef] [PubMed]
  14. Calixto, C.P.G.; Guo, W.; James, A.B.; Tzioutziou, N.A.; Entizne, J.C.; Panter, P.E.; Knight, H.; Nimmo, H.G.; Zhang, R.; Brown, J.W.S. Rapid and Dynamic Alternative Splicing Impacts the Arabidopsis Cold Response Transcriptome. Plant Cell 2018, 30, 1424–1444. [Google Scholar] [CrossRef] [PubMed] [Green Version]
  15. Feng, J.; Li, J.; Gao, Z.; Lu, Y.; Yu, J.; Zheng, Q.; Yan, S.; Zhang, W.; He, H.; Ma, L.; et al. SKIP Confers Osmotic Tolerance during Salt Stress by Controlling Alternative Gene Splicing in Arabidopsis. Mol. Plant 2015, 8, 1038–1052. [Google Scholar] [CrossRef] [PubMed] [Green Version]
  16. Jiang, J.; Liu, X.; Liu, C.; Liu, G.; Li, S.; Wang, L. Integrating Omics and Alternative Splicing Reveals Insights into Grape Response to High Temperature. Plant Physiol. 2017, 173, 1502–1518. [Google Scholar] [CrossRef] [Green Version]
  17. Reddy, A.S. Alternative splicing of pre-messenger RNAs in plants in the genomic era. Annu. Rev. Plant Biol. 2007, 58, 267–294. [Google Scholar] [CrossRef] [Green Version]
  18. Sanchez, S.E.; Petrillo, E.; Beckwith, E.J.; Zhang, X.; Rugnone, M.L.; Hernando, C.E.; Cuevas, J.C.; Godoy Herz, M.A.; Depetris-Chauvin, A.; Simpson, C.G.; et al. A methyl transferase links the circadian clock to the regulation of alternative splicing. Nature 2010, 468, 112–116. [Google Scholar] [CrossRef] [Green Version]
  19. Cui, Z.; Tong, A.; Huo, Y.; Yan, Z.; Yang, W.; Yang, X.; Wang, X.X. SKIP controls flowering time via the alternative splicing of SEF pre-mRNA in Arabidopsis. BMC Biol. 2017, 15, 80. [Google Scholar] [CrossRef] [Green Version]
  20. Martin-Trillo, M.; Grandio, E.G.; Serra, F.; Marcel, F.; Rodriguez-Buey, M.L.; Schmitz, G.; Theres, K.; Bendahmane, A.; Dopazo, H.; Cubas, P. Role of tomato BRANCHED1-like genes in the control of shoot branching. Plant J. 2011, 67, 701–714. [Google Scholar] [CrossRef]
  21. Will, C.L.; Luhrmann, R. Spliceosome structure and function. Cold Spring Harb. Perspect. Biol. 2011, 3, a003707. [Google Scholar] [CrossRef] [PubMed] [Green Version]
  22. Kelemen, O.; Convertini, P.; Zhang, Z.; Wen, Y.; Shen, M.; Falaleeva, M.; Stamm, S. Function of alternative splicing. Gene 2013, 514, 1–30. [Google Scholar] [CrossRef] [PubMed] [Green Version]
  23. Long, J.C.; Caceres, J.F. The SR protein family of splicing factors: Master regulators of gene expression. Biochem. J. 2009, 417, 15–27. [Google Scholar] [CrossRef] [Green Version]
  24. Luo, C.; Cheng, Y.; Liu, Y.; Chen, L.; Liu, L.; Wei, N.; Xie, Z.; Wu, W.; Feng, Y. SRSF2 Regulates Alternative Splicing to Drive Hepatocellular Carcinoma Development. Cancer Res. 2017, 77, 1168–1178. [Google Scholar] [CrossRef] [PubMed] [Green Version]
  25. Barta, A.; Kalyna, M.; Reddy, A.S. Implementing a rational and consistent nomenclature for serine/arginine-rich protein splicing factors (SR proteins) in plants. Plant Cell 2010, 22, 2926–2929. [Google Scholar] [CrossRef] [PubMed]
  26. Iida, K.; Go, M. Survey of conserved alternative splicing events of mRNAs encoding SR proteins in land plants. Mol. Biol. Evol. 2006, 23, 1085–1094. [Google Scholar] [CrossRef] [PubMed] [Green Version]
  27. Butt, H.; Piatek, A.; Li, L.; Reddy, A.S.N.; Mahfouz, M.M. Multiplex CRISPR Mutagenesis of the Serine/Arginine-Rich (SR) Gene Family in Rice. Genes 2019, 10, 596. [Google Scholar] [CrossRef] [PubMed] [Green Version]
  28. Chen, X.; Huang, S.; Jiang, M.; Chen, Y.; XuHan, X.; Zhang, Z.; Lin, Y.; Lai, Z. Genome-wide identification and expression analysis of the SR gene family in longan (Dimocarpus longan Lour.). PLoS ONE 2020, 15, e0238032. [Google Scholar] [CrossRef] [PubMed]
  29. Chen, S.; Li, J.; Liu, Y.; Li, H. Genome-Wide Analysis of Serine/Arginine-Rich Protein Family in Wheat and Brachypodium distachyon. Plants 2019, 8, 188. [Google Scholar] [CrossRef] [PubMed] [Green Version]
  30. Barta, A.; Kalyna, M.; Lorkovic, Z.J. Plant SR proteins and their functions. Curr. Top. Microbiol. Immunol. 2008, 326, 83–102. [Google Scholar]
  31. Morton, M.; AlTamimi, N.; Butt, H.; Reddy, A.S.N.; Mahfouz, M. Serine/Arginine-rich protein family of splicing regulators: New approaches to study splice isoform functions. Plant Sci. 2019, 283, 127–134. [Google Scholar] [CrossRef]
  32. Lopato, S.; Kalyna, M.; Dorner, S.; Kobayashi, R.; Krainer, A.R.; Barta, A. atSRp30, one of two SF2/ASF-like proteins from Arabidopsis thaliana, regulates splicing of specific plant genes. Genes Dev. 1999, 13, 987–1001. [Google Scholar] [CrossRef] [PubMed] [Green Version]
  33. Yan, Q.; Xia, X.; Sun, Z.; Fang, Y. Depletion of Arabidopsis SC35 and SC35-like serine/arginine-rich proteins affects the transcription and splicing of a subset of genes. PLoS Genet. 2017, 13, e1006663. [Google Scholar] [CrossRef] [PubMed]
  34. Isshiki, M.; Tsumoto, A.; Shimamoto, K. The serine/arginine-rich protein family in rice plays important roles in constitutive and alternative splicing of pre-mRNA. Plant Cell 2006, 18, 146–158. [Google Scholar] [CrossRef] [PubMed] [Green Version]
  35. Filichkin, S.A.; Priest, H.D.; Givan, S.A.; Shen, R.; Bryant, D.W.; Fox, S.E.; Wong, W.K.; Mockler, T.C. Genome-wide mapping of alternative splicing in Arabidopsis thaliana. Genome Res. 2010, 20, 45–58. [Google Scholar] [CrossRef] [Green Version]
  36. Jansson, S.; Douglas, C.J. Populus: A model system for plant biology. Annu. Rev. Plant Biol. 2007, 58, 435–458. [Google Scholar] [CrossRef]
  37. Camacho, C.; Coulouris, G.; Avagyan, V.; Ma, N.; Papadopoulos, J.; Bealer, K.; Madden, T.L. BLAST+: Architecture and applications. BMC Bioinform. 2009, 10, 421. [Google Scholar] [CrossRef] [Green Version]
  38. Reddy, A.S.; Shad Ali, G. Plant serine/arginine-rich proteins: Roles in precursor messenger RNA splicing, plant development, and stress responses. Wiley Interdiscip. Rev. RNA 2011, 2, 875–889. [Google Scholar] [CrossRef]
  39. Duque, P. A role for SR proteins in plant stress responses. Plant Signal. Behav. 2011, 6, 49–54. [Google Scholar] [CrossRef] [Green Version]
  40. El-Gebali, S.; Mistry, J.; Bateman, A.; Eddy, S.R.; Luciani, A.; Potter, S.C.; Qureshi, M.; Richardson, L.J.; Salazar, G.A.; Smart, A.; et al. The Pfam protein families database in 2019. Nucleic Acids Res. 2019, 47, D427–D432. [Google Scholar] [CrossRef]
  41. Ren, R.; Wang, H.; Guo, C.; Zhang, N.; Zeng, L.; Chen, Y.; Ma, H.; Qi, J. Widespread Whole Genome Duplications Contribute to Genome Complexity and Species Diversity in Angiosperms. Mol. Plant 2018, 11, 414–428. [Google Scholar] [CrossRef] [PubMed] [Green Version]
  42. Tuskan, G.A.; Difazio, S.; Jansson, S.; Bohlmann, J.; Grigoriev, I.; Hellsten, U.; Putnam, N.; Ralph, S.; Rombauts, S.; Salamov, A.; et al. The genome of black cottonwood, Populus trichocarpa (Torr. & Gray). Science 2006, 313, 1596–1604. [Google Scholar] [PubMed] [Green Version]
  43. Lescot, M.; Déhais, P.; Thijs, G.; Marchal, K.; Moreau, Y.; Van de Peer, Y.; Rouzé, P.; Rombauts, S. PlantCARE, a database of plant cis-acting regulatory elements and a portal to tools for in silico analysis of promoter sequences. Nucleic Acids Res. 2002, 30, 325–327. [Google Scholar] [CrossRef]
  44. Rauch, H.B.; Patrick, T.L.; Klusman, K.M.; Battistuzzi, F.U.; Mei, W.; Brendel, V.P.; Lal, S.K. Discovery and expression analysis of alternative splicing events conserved among plant SR proteins. Mol. Biol. Evol. 2014, 31, 605–613. [Google Scholar] [CrossRef] [PubMed] [Green Version]
  45. Shi, Y.; Ding, Y.; Yang, S. Molecular Regulation of CBF Signaling in Cold Acclimation. Trends Plant Sci. 2018, 23, 623–637. [Google Scholar] [CrossRef] [PubMed]
  46. Lazar, G.; Schaal, T.; Maniatis, T.; Goodman, H.M. Identification of a plant serine-arginine-rich protein similar to the mammalian splicing factor SF2/ASF. Proc. Natl. Acad. Sci. USA 1995, 92, 7672–7676. [Google Scholar] [CrossRef] [PubMed] [Green Version]
  47. Palusa, S.G.; Ali, G.S.; Reddy, A.S. Alternative splicing of pre-mRNAs of Arabidopsis serine/arginine-rich proteins: Regulation by hormones and stresses. Plant J. 2007, 49, 1091–1107. [Google Scholar] [CrossRef]
  48. Tanabe, N.; Yoshimura, K.; Kimura, A.; Yabuta, Y.; Shigeoka, S. Differential expression of alternatively spliced mRNAs of Arabidopsis SR protein homologs, atSR30 and atSR45a, in response to environmental stress. Plant Cell Physiol. 2007, 48, 1036–1049. [Google Scholar] [CrossRef] [Green Version]
  49. Cruz, T.M.; Carvalho, R.F.; Richardson, D.N.; Duque, P. Abscisic acid (ABA) regulation of Arabidopsis SR protein gene expression. Int. J. Mol. Sci. 2014, 15, 17541–17564. [Google Scholar] [CrossRef] [Green Version]
  50. Day, I.S.; Golovkin, M.; Palusa, S.G.; Link, A.; Ali, G.S.; Thomas, J.; Richardson, D.N.; Reddy, A.S. Interactions of SR45, an SR-like protein, with spliceosomal proteins and an intronic sequence: Insights into regulated splicing. Plant J. 2012, 71, 936–947. [Google Scholar] [CrossRef]
  51. Albaqami, M.; Laluk, K.; Reddy, A.S.N. The Arabidopsis splicing regulator SR45 confers salt tolerance in a splice isoform-dependent manner. Plant Mol. Biol. 2019, 100, 379–390. [Google Scholar] [CrossRef]
  52. Rausin, G.; Tillemans, V.; Stankovic, N.; Hanikenne, M.; Motte, P. Dynamic nucleocytoplasmic shuttling of an Arabidopsis SR splicing factor: Role of the RNA-binding domains. Plant Physiol. 2010, 153, 273–284. [Google Scholar] [CrossRef] [Green Version]
  53. Zhang, W.; Du, B.; Liu, D.; Qi, X. Splicing factor SR34b mutation reduces cadmium tolerance in Arabidopsis by regulating iron-regulated transporter 1 gene. Biochem. Biophys. Res. Commun. 2014, 455, 312–317. [Google Scholar] [CrossRef]
  54. Chen, T.; Cui, P.; Chen, H.; Ali, S.; Zhang, S.; Xiong, L. A KH-domain RNA-binding protein interacts with FIERY2/CTD phosphatase-like 1 and splicing factors and is important for pre-mRNA splicing in Arabidopsis. PLoS Genet 2013, 9, e1003875. [Google Scholar] [CrossRef] [PubMed] [Green Version]
  55. Gu, J.; Ma, S.; Zhang, Y.; Wang, D.; Gao, S.; Zhang, Z.Y. Genome-Wide Identification of Cassava Serine/Arginine-Rich Proteins: Insights into Alternative Splicing of Pre-mRNAs and Response to Abiotic Stress. Plant Cell Physiol. 2020, 61, 178–191. [Google Scholar] [CrossRef] [PubMed]
  56. Zhao, Y.; Sun, J.; Xu, P.; Zhang, R.; Li, L. Intron-mediated alternative splicing of WOOD-ASSOCIATED NAC TRANSCRIPTION FACTOR1B regulates cell wall thickening during fiber development in Populus species. Plant Physiol. 2014, 164, 765–776. [Google Scholar] [CrossRef] [PubMed] [Green Version]
  57. Forment, J.; Naranjo, M.A.; Roldan, M.; Serrano, R.; Vicente, O. Expression of Arabidopsis SR-like splicing proteins confers salt tolerance to yeast and transgenic plants. Plant J. 2002, 30, 511–519. [Google Scholar] [CrossRef]
  58. Goodstein, D.M.; Shu, S.; Howson, R.; Neupane, R.; Hayes, R.D.; Fazo, J.; Mitros, T.; Dirks, W.; Hellsten, U.; Putnam, N.; et al. Phytozome: A comparative platform for green plant genomics. Nucleic Acids Res. 2012, 40, D1178–D1186. [Google Scholar] [CrossRef]
  59. Huala, E.; Dickerman, A.W.; Garcia-Hernandez, M.; Weems, D.; Reiser, L.; LaFond, F.; Hanley, D.; Kiphart, D.; Zhuang, M.; Huang, W.; et al. The Arabidopsis Information Resource (TAIR): A comprehensive database and web-based information retrieval, analysis, and visualization system for a model plant. Nucleic Acids Res. 2001, 29, 102–105. [Google Scholar] [CrossRef] [PubMed] [Green Version]
  60. Gasteiger, E.; Gattiker, A.; Hoogland, C.; Ivanyi, I.; Appel, R.D.; Bairoch, A. ExPASy: The proteomics server for in-depth protein knowledge and analysis. Nucleic Acids Res. 2003, 31, 3784–3788. [Google Scholar] [CrossRef] [Green Version]
  61. Katoh, K.; Standley, D.M. MAFFT multiple sequence alignment software version 7: Improvements in performance and usability. Mol. Biol. Evol. 2013, 30, 772–780. [Google Scholar] [CrossRef] [Green Version]
  62. Nguyen, L.T.; Schmidt, H.A.; von Haeseler, A.; Minh, B.Q. IQ-TREE: A fast and effective stochastic algorithm for estimating maximum-likelihood phylogenies. Mol. Biol. Evol. 2015, 32, 268–274. [Google Scholar] [CrossRef]
  63. Kalyaanamoorthy, S.; Minh, B.Q.; Wong, T.K.F.; von Haeseler, A.; Jermiin, L.S. ModelFinder: Fast model selection for accurate phylogenetic estimates. Nat. Methods 2017, 14, 587–589. [Google Scholar] [CrossRef] [Green Version]
  64. Finn, R.D.; Coggill, P.; Eberhardt, R.Y.; Eddy, S.R.; Mistry, J.; Mitchell, A.L.; Potter, S.C.; Punta, M.; Qureshi, M.; Sangrador-Vegas, A.; et al. The Pfam protein families database: Towards a more sustainable future. Nucleic Acids Res. 2016, 44, D279–D285. [Google Scholar] [CrossRef]
  65. Chen, C.; Chen, H.; Zhang, Y.; Thomas, H.R.; Frank, M.H.; He, Y.; Xia, R. TBtools: An Integrative Toolkit Developed for Interactive Analyses of Big Biological Data. Mol. Plant 2020, 13, 1194–1202. [Google Scholar] [CrossRef]
  66. Wang, Y.; Tang, H.; Debarry, J.D.; Tan, X.; Li, J.; Wang, X.; Lee, T.H.; Jin, H.; Marler, B.; Guo, H.; et al. MCScanX: A toolkit for detection and evolutionary analysis of gene synteny and collinearity. Nucleic Acids Res. 2012, 40, e49. [Google Scholar] [CrossRef] [Green Version]
  67. Wang, D.; Zhang, Y.; Zhang, Z.; Zhu, J.; Yu, J. KaKs_Calculator 2.0: A Toolkit Incorporating Gamma-Series Methods and Sliding Window Strategies. Genom. Proteom. Bioinform. 2010, 8, 77–80. [Google Scholar] [CrossRef] [Green Version]
  68. Huerta-Cepas, J.; Forslund, K.; Coelho, L.P.; Szklarczyk, D.; Jensen, L.J.; von Mering, C.; Bork, P. Fast Genome-Wide Functional Annotation through Orthology Assignment by eggNOG-Mapper. Mol. Biol. Evol. 2017, 34, 2115–2122. [Google Scholar] [CrossRef] [PubMed] [Green Version]
  69. Filichkin, S.A.; Hamilton, M.; Dharmawardhana, P.D.; Singh, S.K.; Sullivan, C.; Ben-Hur, A.; Reddy, A.S.N.; Jaiswal, P. Abiotic Stresses Modulate Landscape of Poplar Transcriptome via Alternative Splicing, Differential Intron Retention, and Isoform Ratio Switching. Front. Plant Sci. 2018, 9, 5. [Google Scholar] [CrossRef] [PubMed] [Green Version]
  70. Pertea, M.; Kim, D.; Pertea, G.M.; Leek, J.T.; Salzberg, S.L. Transcript-level expression analysis of RNA-seq experiments with HISAT, StringTie and Ballgown. Nat. Protoc. 2016, 11, 1650–1667. [Google Scholar] [CrossRef] [PubMed]
  71. Pertea, M.; Pertea, G.M.; Antonescu, C.M.; Chang, T.C.; Mendell, J.T.; Salzberg, S.L. StringTie enables improved reconstruction of a transcriptome from RNA-seq reads. Nat. Biotechnol. 2015, 33, 290–295. [Google Scholar] [CrossRef] [PubMed] [Green Version]
  72. Livak, K.J.; Schmittgen, T.D. Analysis of relative gene expression data using real-time quantitative PCR and the 2(-Delta Delta C(T)) Method. Methods 2001, 25, 402–408. [Google Scholar] [CrossRef] [PubMed]
  73. Jia, Y.; Ding, Y.; Shi, Y.; Zhang, X.; Gong, Z.; Yang, S. The cbfs triple mutants reveal the essential functions of CBFs in cold acclimation and allow the definition of CBF regulons in Arabidopsis. New Phytol. 2016, 212, 345–353. [Google Scholar] [CrossRef] [PubMed] [Green Version]
  74. Robinson, M.D.; McCarthy, D.J.; Smyth, G.K. edgeR: A Bioconductor package for differential expression analysis of digital gene expression data. Bioinformatics 2010, 26, 139–140. [Google Scholar] [CrossRef] [PubMed] [Green Version]
  75. Love, M.I.; Huber, W.; Anders, S. Moderated estimation of fold change and dispersion for RNA-seq data with DESeq2. Genome Biol. 2014, 15, 550. [Google Scholar] [CrossRef] [Green Version]
  76. Wu, W.; Zong, J.; Wei, N.; Cheng, J.; Zhou, X.; Cheng, Y.; Chen, D.; Guo, Q.; Zhang, B.; Feng, Y. CASH: A constructing comprehensive splice site method for detecting alternative splicing events. Brief. Bioinform. 2017, 19, 905–917. [Google Scholar] [CrossRef]
Figure 1. Phylogenetic relationships and exon/intron and domain architectures of SR-family genes in P. trichocarpa and Arabidopsis. Phylogenetics of SR genes. Multiple alignment of the Arabidopsis and P. trichocarpa SR proteins were performed by MAFFT to construct a maximum likelihood (ML) tree by IQ-TREE. (A) The ML tree was assessed by an ultrafast bootstrap with 5000 replicates, and bootstrap values greater than 50% are shown. The six clusters in shaded colors indicate the known conserved subfamilies (i.e., SCL, SC, RSZ, RS2Z, SR, and RS); (B) exon/intron structures of PtSR genes. UTR and CDS indicate the untranslated region and coding sequences, respectively; (C) protein domains of PtSR genes. The visualizations of exon/intron and protein-domain architectures were created by TBtools, using their gene- and protein-information datasets; (D) a heatmap showing the numbers of the six subfamilies of Arabidopsis and P. trichocarpa SR genes.
Ijms 22 11369 g001
Figure 2. Chromosomal distribution and expansion events of PtSR gene family. (A) The chromosomal distribution and collinearity gene blocks the containing PtSR genes. The outer circle indicates P. trichocarpa’s 19 chromosomes (Chr) and scaffolds (s), marked with a distribution of PtSR genes; the middle circle indicates gene density on the corresponding chromosomes; and the inner grey curves indicate gene collinearity blocks between and within chromosomes, where the close paralogous pairs of PtSR genes are marked in blue or red curves, according to their expansion events; (B) the frequency of Ks values of the collinearity of gene pairs within the P. trichocarpa genome and between the P. trichocarpa and Arabidopsis genomes. The blue circles indicate the PtSR gene pairs generated by genome triplication event (i.e., γ) before the divergence of P. trichocarpa and Arabidopsis, and the red circles indicate the PtSR gene pairs generated by the recent genome duplication of P. trichocarpa after the divergence from Arabidopsis. The collinearity of the PtSR gene pairs and their Ks values are provided in Table S2.
Ijms 22 11369 g002
Figure 3. GO term enrichment and promoter cis-element analysis of PtSR genes. (A) GO term enrichments of PtSR genes. The dot sizes represent the numbers of enriched genes and the colored bars represent the significant levels of GO term enrichment; (B) the numbers of PtSR genes containing various cis-acting elements. Purple, red, and blue bars represent the cis-acting elements in response to abiotic stresses, phytohormones, and the fundamental core elements in PtSR gene promoters, respectively.
Ijms 22 11369 g003
Figure 4. The expression profiles of PtSR genes in P. trichocarpa tissues. (A) A heatmap of the expression profiles of PtSR family genes in roots, stems, and leaves. Transcripts per million reads (TPM) was used to represent the expression of each gene and log2 transformed to generate the heatmap; (B) A boxplot showing expression differences between PtSR genes and background genes. Except for PtSR genes, the other genomic expressed genes were selected as background, and the differential level in expression between PtSR genes and the background was assessed by Wilcoxon test.
Ijms 22 11369 g004
Figure 5. The expression profiles of PtSR genes under hormones and abiotic stresses. (A) The expression profile of all 24 PtSR genes. The red-colored PtSR genes represent the genes that were differentially regulated by at least one of the six stresses, and an asterisk above the bars represents a significant difference between treatments and control (* p value < 0.01 and factor of change >2). Error bars represent the standard deviations of three biological replicates; (B) A boxplot showing expression differences of PtSR genes between the treatments and CK control. The differential significance between the treatment and control of each PtSR expression was shown on the corresponding treatment. Relative expression level of PtSR genes were normalized with Histone3 genes HIS-1 (Potri.002G026800) and HIS-2 (Potri.005G072300) under cold (4 °C), drought (20% PEG6000), salt (200 mM NaCl), SA (5 mM), MeJA (1 mM), and ABA (100 μM) treatments.
Ijms 22 11369 g005
Figure 6. The alternative splicing of PtSR genes in P. trichocarpa tissues and under hormones and abiotic stresses. The left panel indicates the phylogenetics of PtSR genes. The AS patterns of PtSR genes were determined in the tissues (root, stem, and leaf) under normal condition and in leaf tissue under different stress treatments, including cold (4 °C), drought (20% PEG6000), salt (200 mM NaCl), SA (5 mM), MeJA (1 mM), and ABA (100 μM). The red genes labels represent genes that underwent AS events in the tissues and/or under abiotic/hormone stresses. Asterisks represent a basic transcript of the PtSR gene. Primers used for investigating alternative splicing isoforms of PtSR genes were provided in Table S5.
Ijms 22 11369 g006
Figure 7. PtSCL30 is involved in the freezing stress response. (A) Freezing tolerance of PtSCL30 overexpression lines (OE2, OE10, and OE16) and wild-type plants (Col-0) after being exposed to −7 °C for 6 h; (B) the survival rate of Col-0 and 35S::PtSCL30 OE lines after being exposed to −7 °C for 6 h. Asterisks indicate significant differences between Col-0 and 35S::PtSCL30 OE lines (** p < 0.01).
Ijms 22 11369 g007
Figure 8. Overexpression of PtSCL30 changes the alternative splicing profiles of genes under cold stress. (A) The number of differentially expressed genes (DEGs) and alternatively spliced genes (DASGs) in 35S::PtSCL30 OE lines under cold stress; (B) the AS types and numbers induced by the overexpression of PtSCL30; (C) the GO-enriched network and the relevant DASGs. The big circles indicate the GO terms and the small circles represent the DASGs. The gene network involved in abiotic stress, including cold stress, is shown in red shadow; (D) four examples of DASGs after the overexpression of PtSCL30 under cold stress from RNA-seq data. The RNA-seq coverage (black or blue) and junction reads (on the arcs) for the samples are shown above the reference genes. The differential AS loci are marked in red shadow with their AS type.
Ijms 22 11369 g008aIjms 22 11369 g008b
Figure 9. Salt and drought tolerance of PtSCL30 transgenic plants. (A) Seed germination assay of Col-0 and 35S::PtSCL30 OE lines growing in 1/2 MS medium supplemented with NaCl; (B,C) Germination rate of Col-0 and 35S::PtSCL30 OE lines under salt treatments; (D) cotyledon-greening rate of Col-0 and 35S::PtSCL30 OE lines under salt treatments; (E) salt tolerance assay of Col-0 and 35S::PtSCL30 OE lines growing in 1/2 MS medium supplemented with NaCl; (F) root length of Col-0 and 35S::PtSCL30 OE lines under salt treatments; (G) drought tolerance assay of Col-0 and 35S::PtSCL30 OE lines growing in 1/2 MS medium supplemented with mannitol; (H) root length of Col-0 and 35S::PtSCL30 OE lines under drought treatments; (I) fresh weight of Col-0 and 35S::PtSCL30 OE lines under drought treatments. Error bars indicate the standard deviation. Asterisks indicate significant different levels between Col-0 and 35S::PtSCL30 OE lines (* p < 0.05 and ** p < 0.01).
Ijms 22 11369 g009
Publisher’s Note: MDPI stays neutral with regard to jurisdictional claims in published maps and institutional affiliations.

