
A Comparison of Brain-State Dynamics across Common Anesthetic Agents in Male Sprague-Dawley Rats


Abstract
:1. Introduction
2. Results
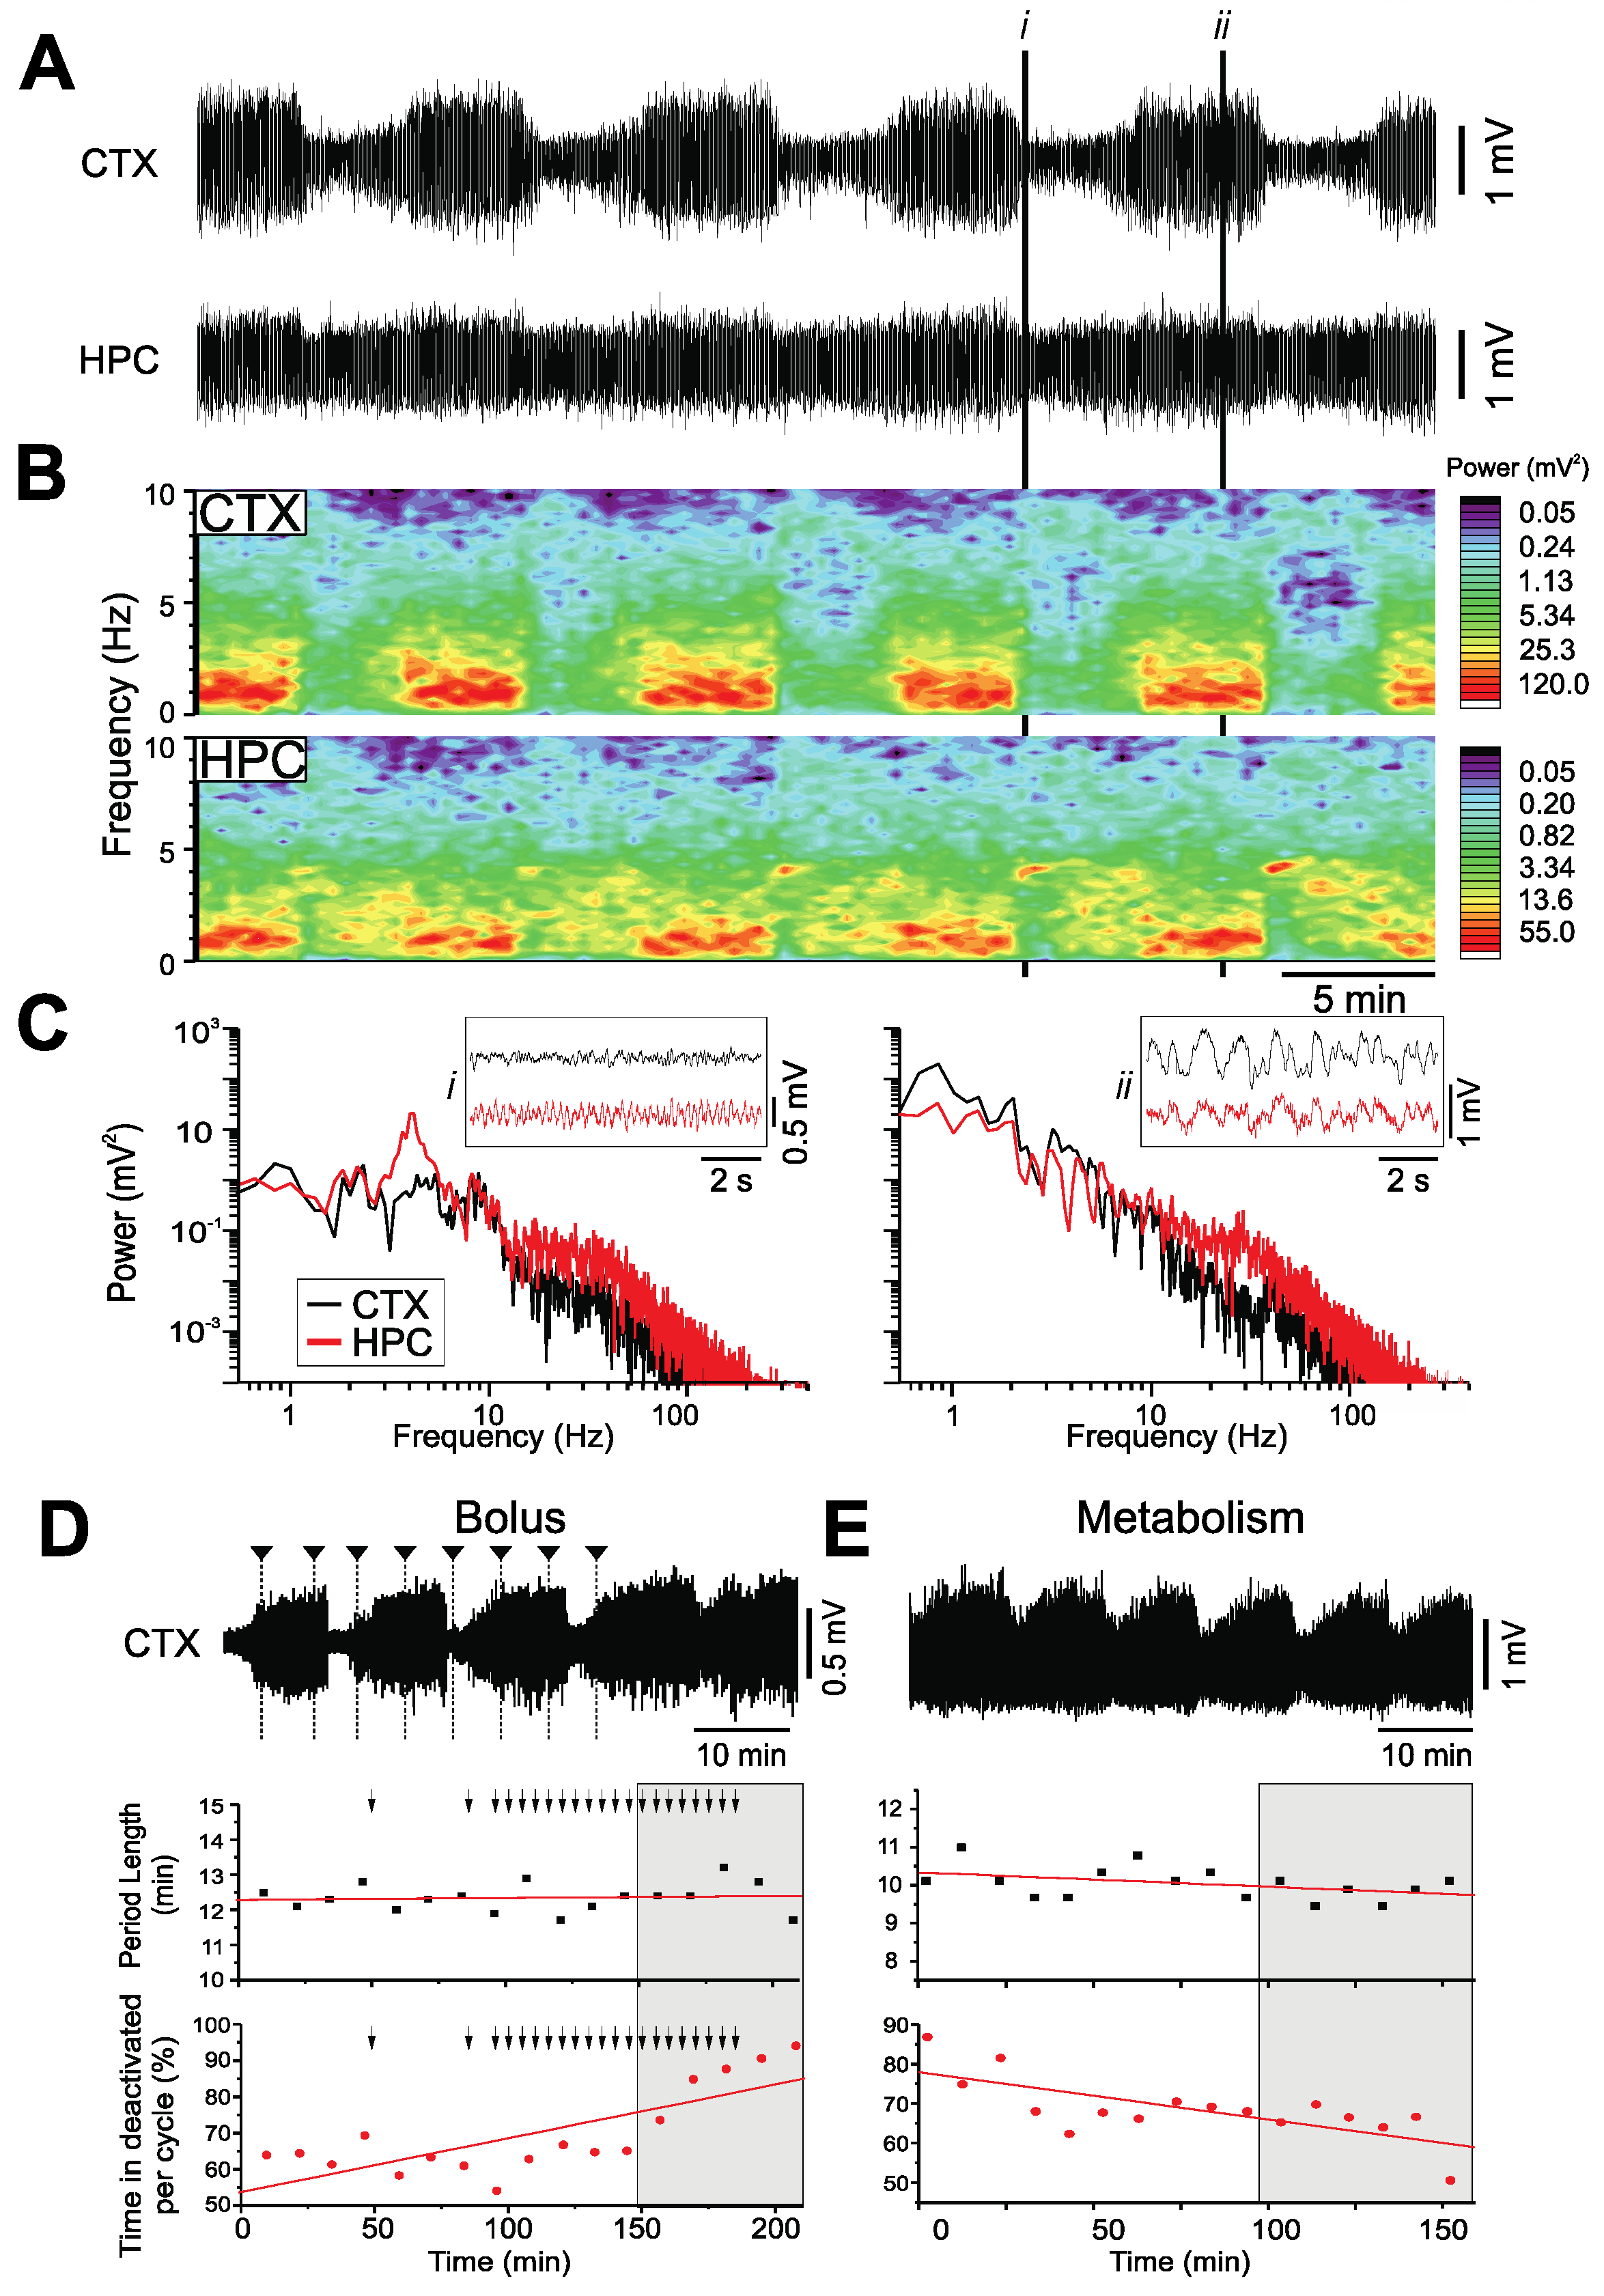
2.1. Urethane
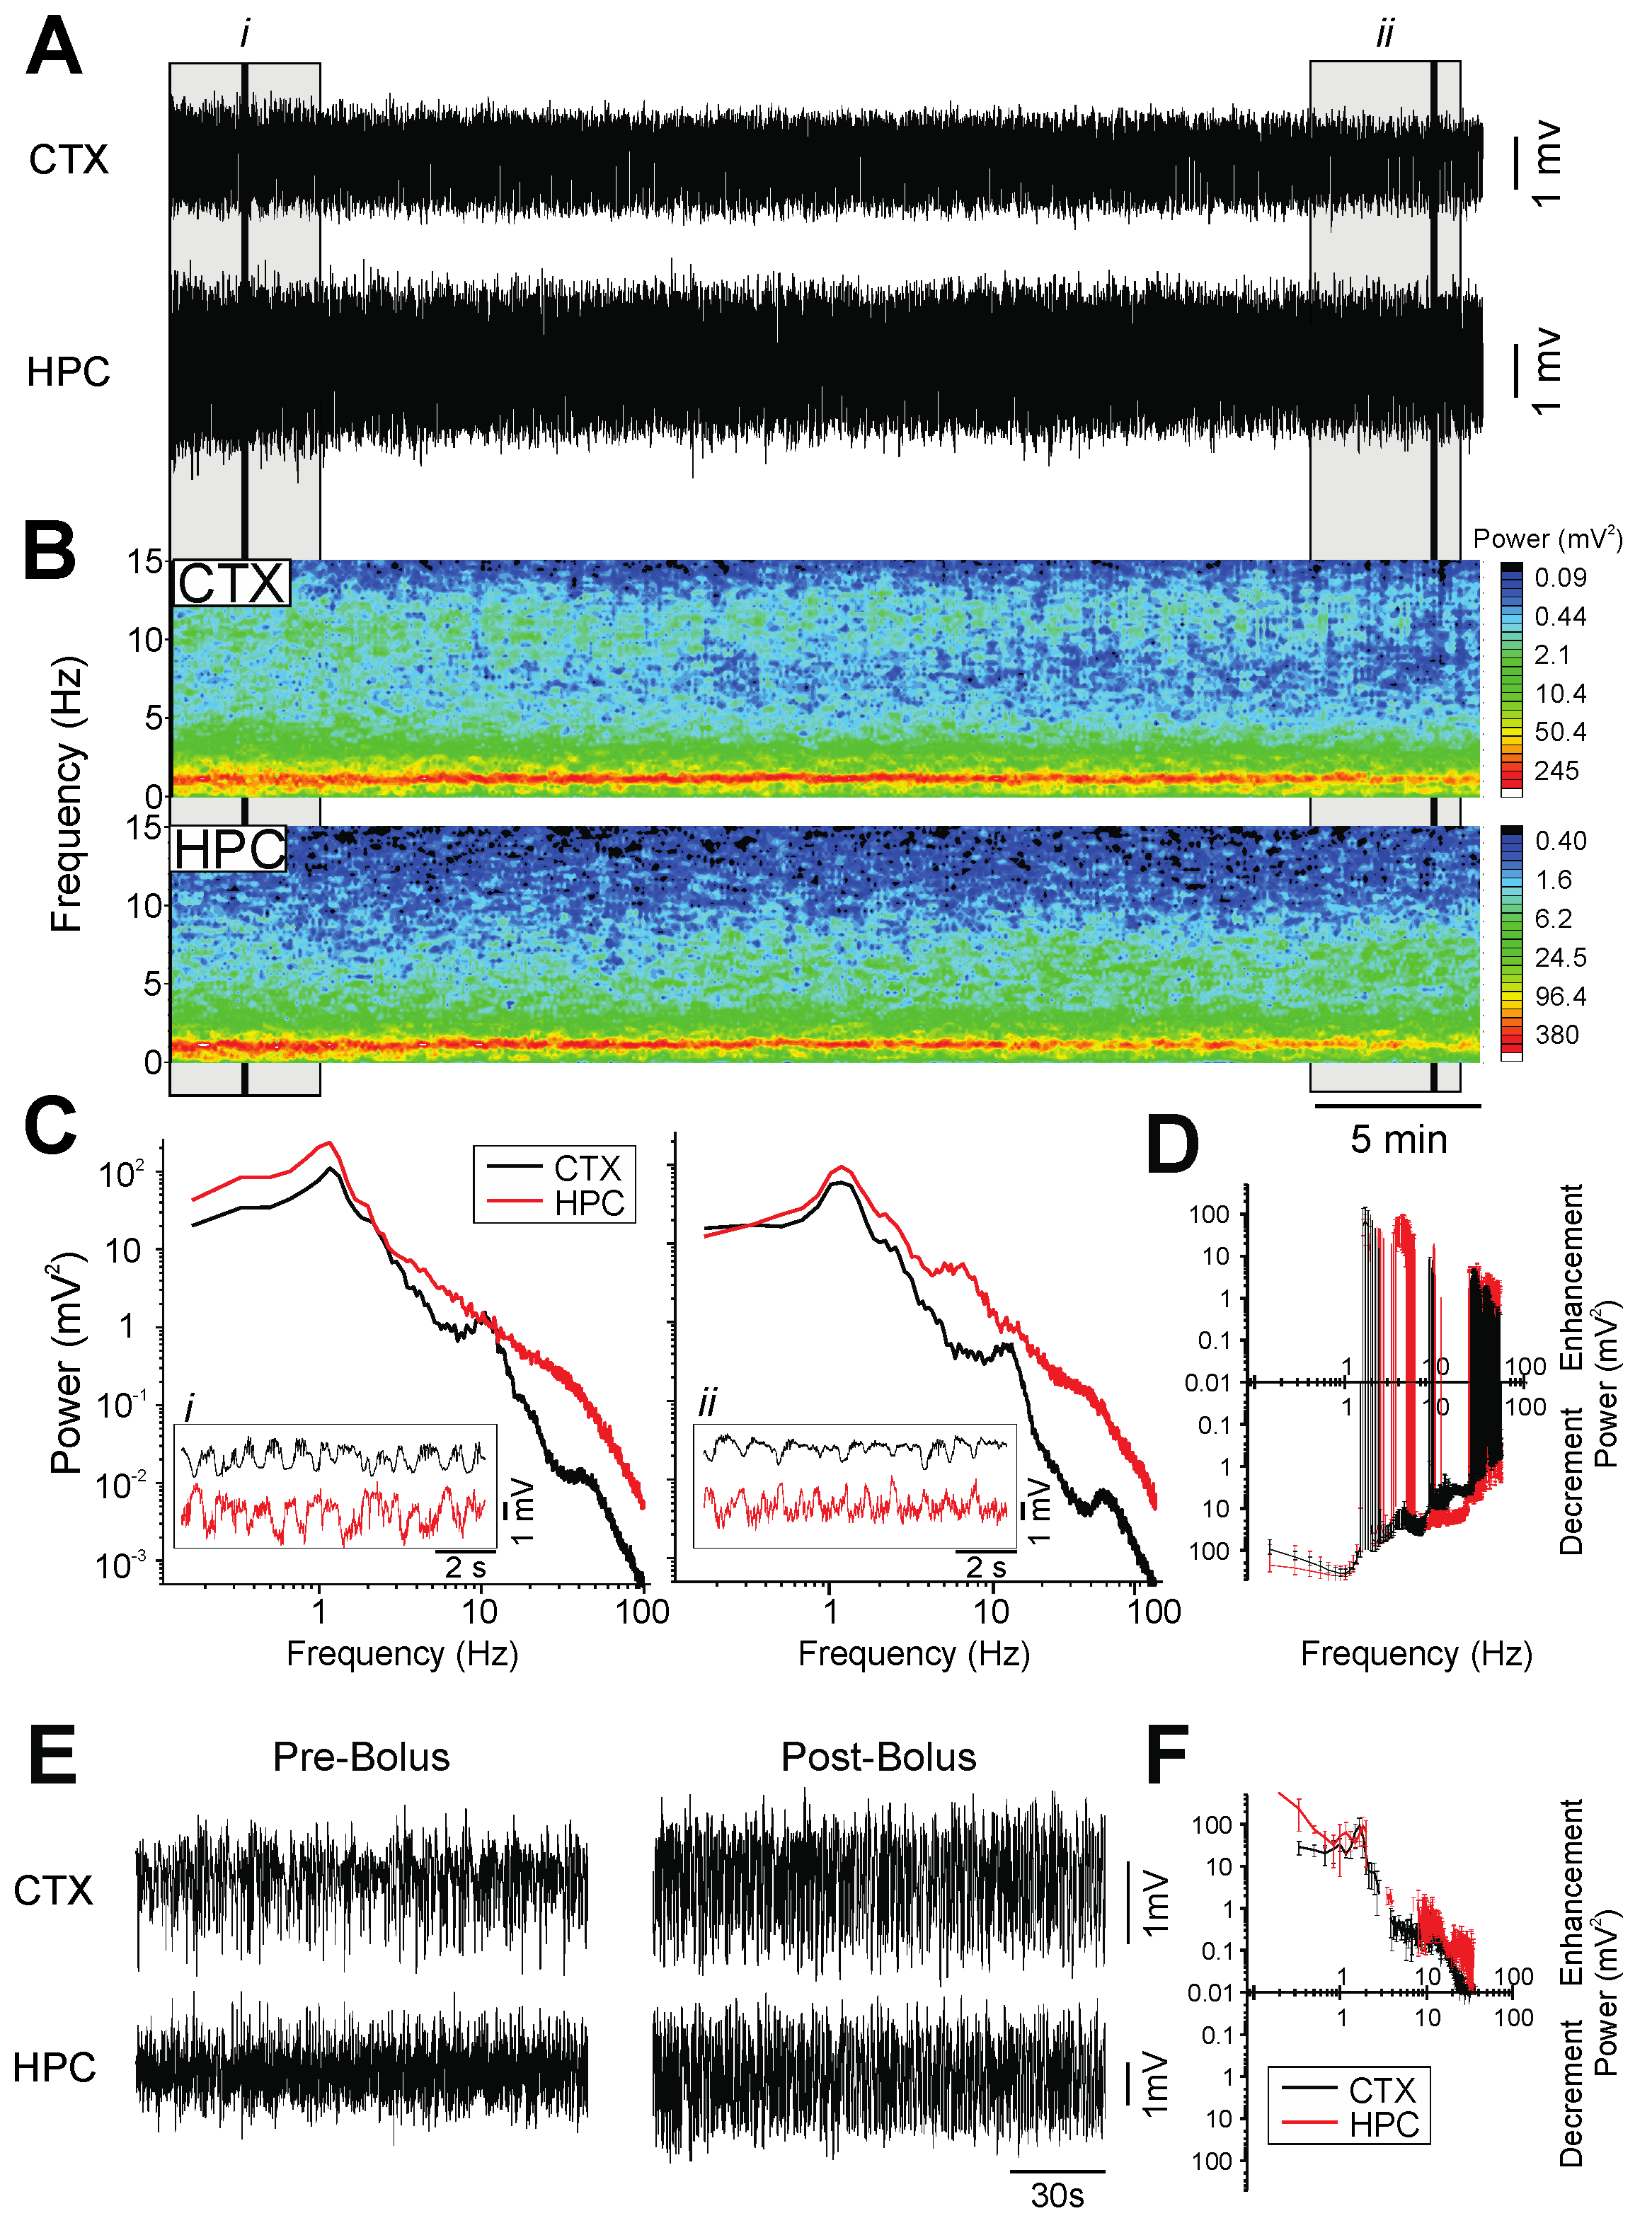
2.2. Ketamine-Xylazine
2.3. Pentobarbital
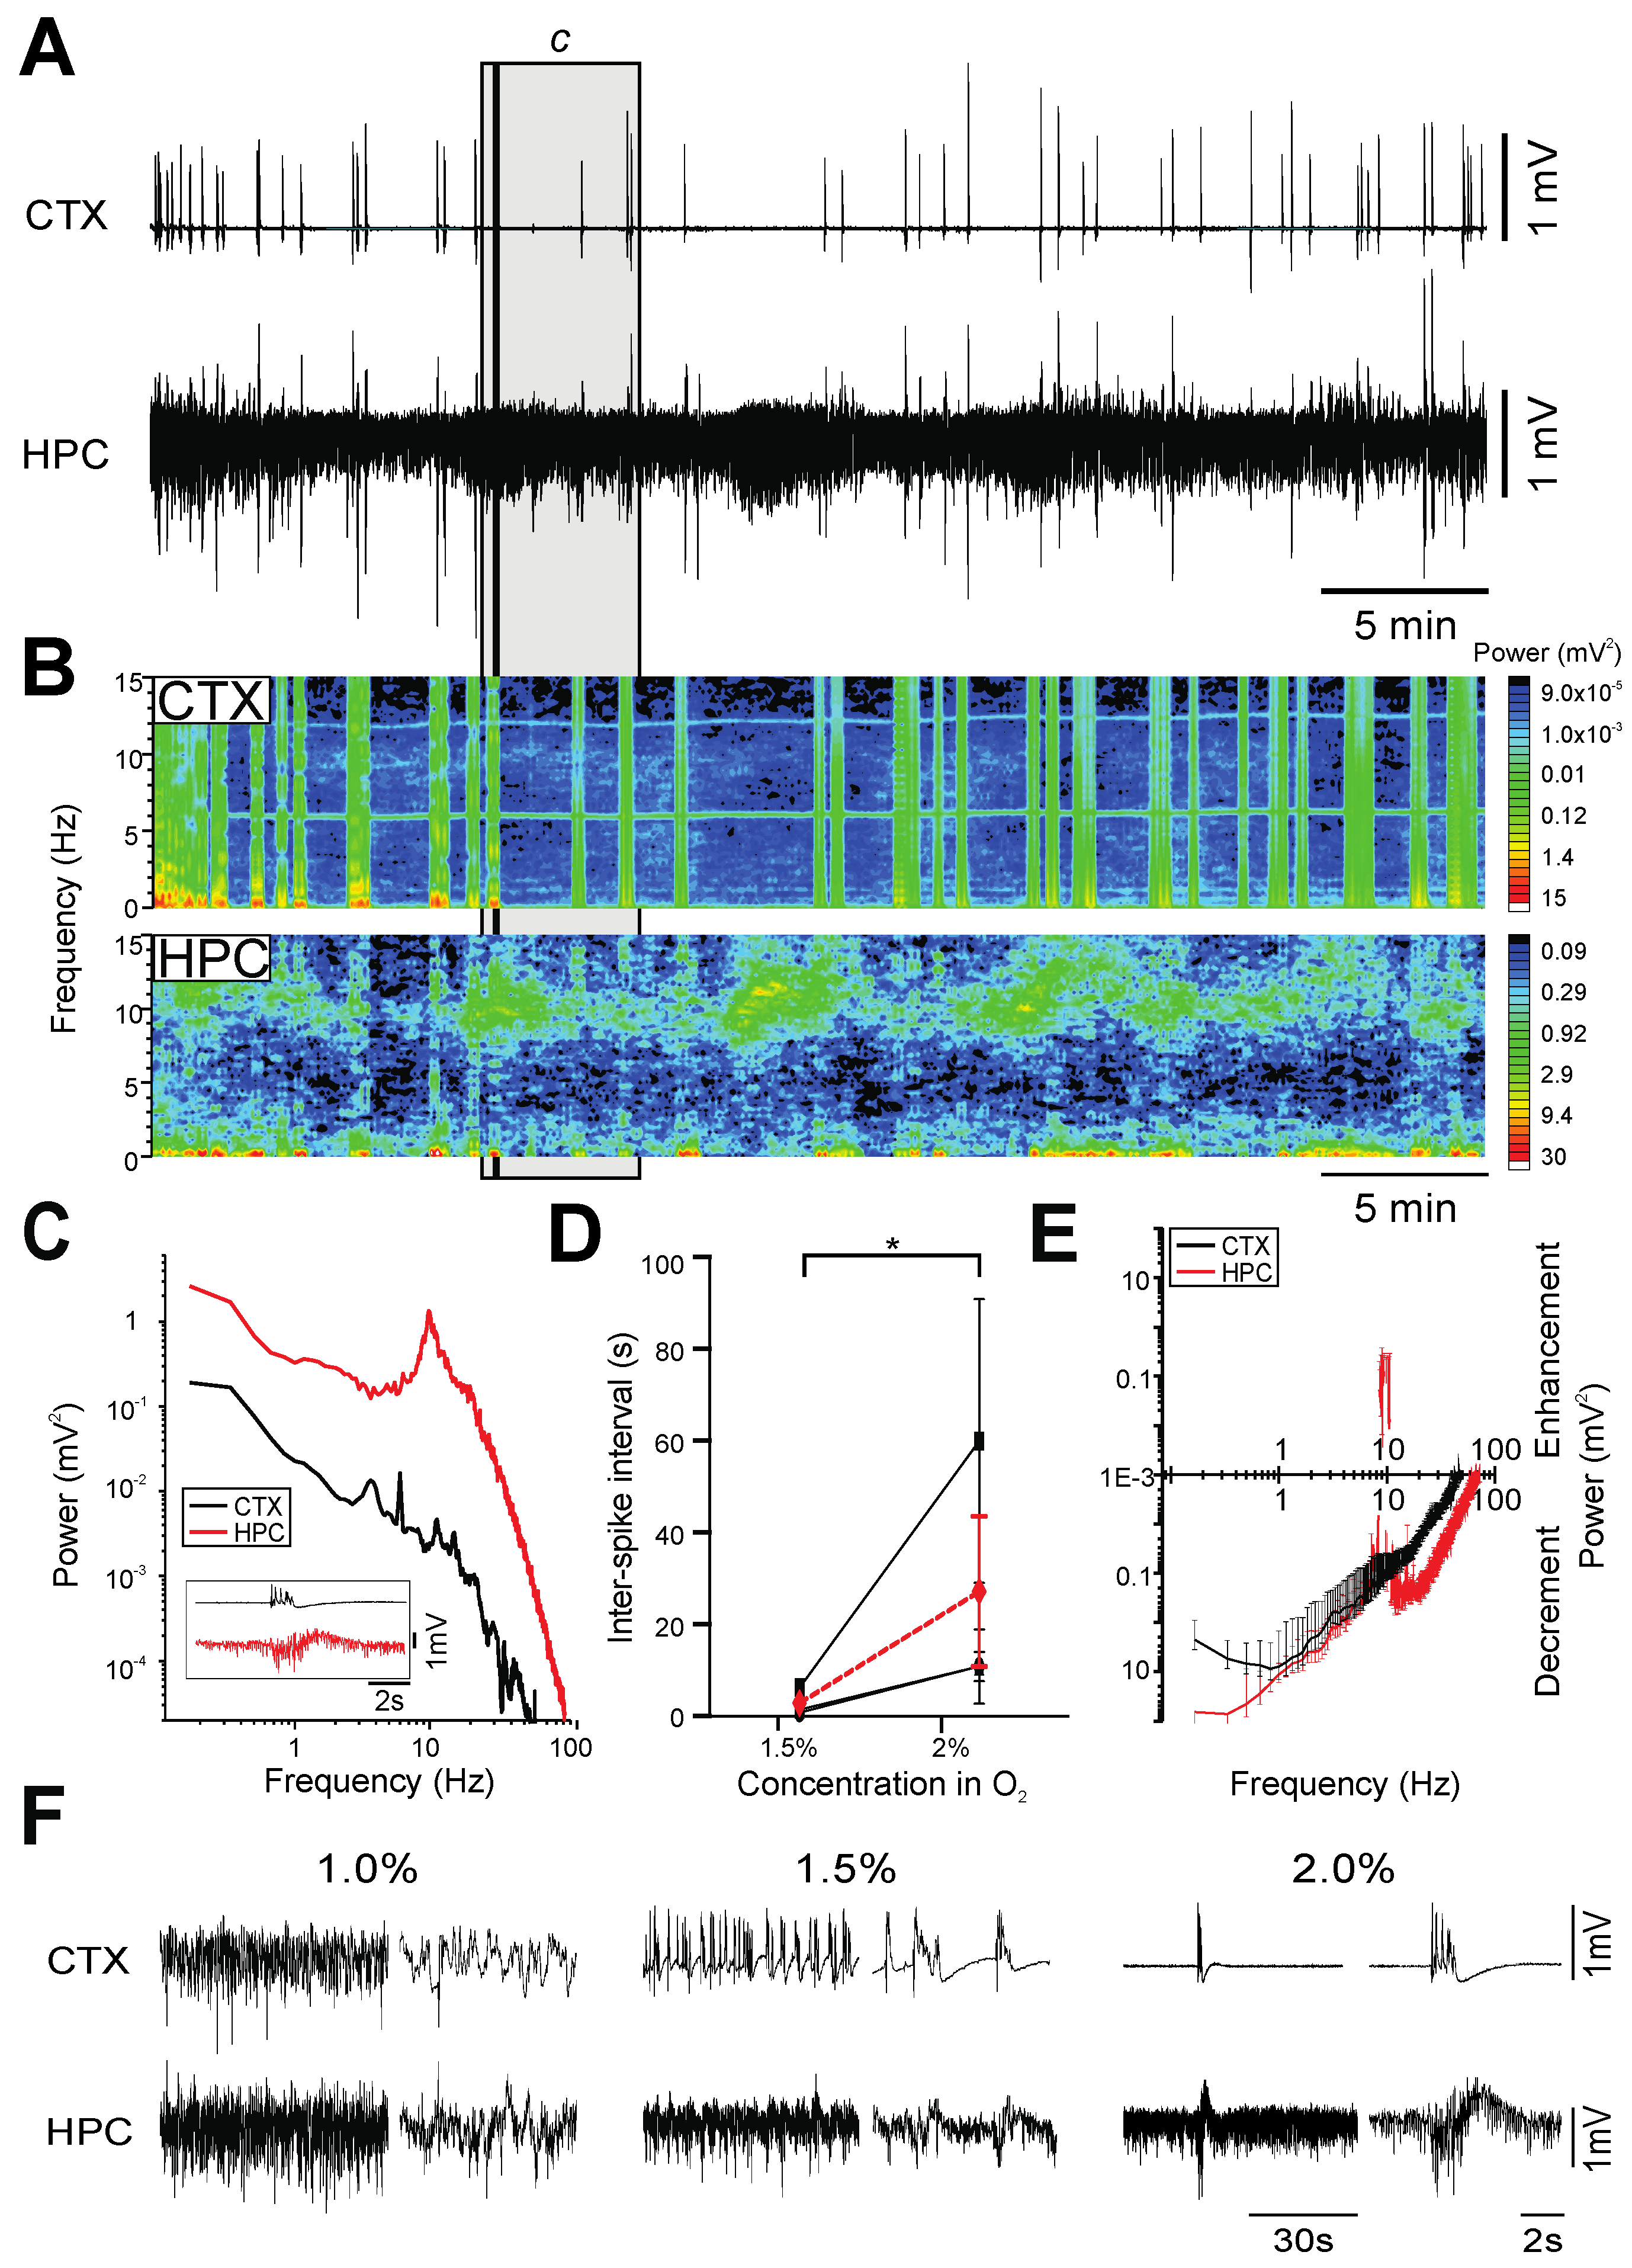
2.4. Isoflurane
2.5. Propofol
2.6. Chloral Hydrate
3. Discussion
- Burst-suppression, which is a brain state characterized by short periods of high-amplitude, high-frequency bursts interspersed with longer periods of isoelectric activity, and is typically associated with brain damage, hypothermia or coma [5]. This pattern of EEG activity was observed during PTB [31], ISO [32], and PRO [30] anesthesia.
- A unitary state of synchronized, slow-oscillatory activity similar to the rhythmic on-off (up/down) field fluctuations observed during nREM sleep [33] was observed during KET-XYL anesthesia.
- Spontaneous, cyclical alternations between activated and deactivated brain states analogous to the REM/nREM cycle during natural sleep, in terms of both electrographic features and dynamics, was observed during both urethane [21] and CH anesthesia.
3.1. Anesthesia as a Model for the Brain States Associated with Altered States of Consciousness
3.2. Anesthesia and Sleep
3.3. Pharmacological Mechanisms Influencing Brain State
4. Materials and Methods
4.1. Subjects
4.2. Surgery and Anesthesia
4.3. Stereotaxic and Recording Procedures
4.4. Experimental Design
4.5. Statistical Analyses
5. Conclusions
Author Contributions
Funding
Institutional Review Board Statement
Informed Consent Statement
Data Availability Statement
Acknowledgments
Conflicts of Interest
References
- Ward-Flanagan, R.; Dickson, C.T. Neurobiological Parallels, Overlaps, and Divergences of Sleep and Anesthesia. In Handbook of Behavioral Neuroscience; Elsevier: Amsterdam, The Netherlands, 2019; Volume 30, pp. 223–236. [Google Scholar] [CrossRef]
- Purdon, P.L.; Sampson, A.; Pavone, K.J.; Brown, E.N. Clinical Electroencephalography for Anesthesiologists: Part I: Back-ground and Basic Signatures. Anesthesiology 2015, 123, 937–960. [Google Scholar] [CrossRef] [PubMed] [Green Version]
- Bonhomme, V.; Staquet, C.; Montupil, J.; Defresne, A.; Kirsch, M.; Martial, C.; Vanhaudenhuyse, A.; Chatelle, C.; Larroque, S.K.; Raimondo, F.; et al. General Anesthesia: A Probe to Explore Consciousness. Front. Syst. Neurosci. 2019, 13, 36. [Google Scholar] [CrossRef] [PubMed] [Green Version]
- Ferron, J.-F.; Kroeger, D.; Chever, O.; Amzica, F. Cortical inhibition during burst suppression induced with isoflurane anes-thesia. J. Neurosci. 2009, 29, 9850–9860. [Google Scholar] [CrossRef] [PubMed] [Green Version]
- Brown, E.N.; Lydic, R.; Schiff, N.D. General anesthesia, sleep, and coma. N. Eng. J. Med. 2010, 363, 2638–2650. [Google Scholar] [CrossRef] [PubMed] [Green Version]
- Flecknell, P. Chapter 5—Anaesthesia of Common Laboratory Species: Special Considerations. In Laboratory Animal Anaesthesia, 4th ed.; Flecknell, P., Ed.; Academic Press: Boston, MA, USA, 2016; pp. 193–256. [Google Scholar]
- Krasowski, M.D.; Koltchine, V.V.; Rick, C.E.; Ye, Q.; Finn, S.E.; Harrison, N.L. Propofol and Other Intravenous Anesthetics Have Sites of Action on the γ-Aminobutyric Acid Type A Receptor Distinct from That for Isoflurane. Mol. Pharmacol. 1998, 53, 530–538. [Google Scholar] [CrossRef] [Green Version]
- Aggarwal, A.; Brennan, C.; Shortal, B.; Contreras, D.; Kelz, M.B.; Proekt, A. Coherence of Visual-Evoked Gamma Oscillations Is Disrupted by Propofol but Preserved Under Equipotent Doses of Isoflurane. Front. Syst. Neurosci. 2019, 13, 19. [Google Scholar] [CrossRef]
- Franks, N.P. General anaesthesia: From molecular targets to neuronal pathways of sleep and arousal. Nat. Rev. Neurosci. 2008, 9, 370–386. [Google Scholar] [CrossRef]
- Piccitto, M.R. Recommendations for the Design and Analysis of In Vivo Electrophysiology Studies. J. Neurosci. 2018, 38, 5837–5839. [Google Scholar]
- Harrison, N.L.; Simmonds, M.A. Quantitative studies on some antagonists of N-methyl D-aspartate in slices of rat cerebral cortex. Br. J. Pharmacol. 1985, 84, 381–391. [Google Scholar] [CrossRef] [Green Version]
- Greene, S.A.; Thurmon, J.C. Xylazine—A review of its pharmacology and use in veterinary medicine. J. Veter. Pharmacol. Ther. 1988, 11, 295–313. [Google Scholar] [CrossRef]
- Akaike, N.; Tokutomi, N.; Ikemoto, Y. Augmentation of GABA-induced current in frog sensory neurons by pentobarbital. Am. J. Physiol. Physiol. 1990, 258, C452–C460. [Google Scholar] [CrossRef] [PubMed]
- Nakahiro, M.; Yeh, J.Z.; Brunner, E.; Narahashi, T. General anesthetics modulate GABA receptor channel complex in rat dorsal root ganglion neurons. FASEB J. 1989, 3, 1850–1854. [Google Scholar] [CrossRef] [PubMed]
- Hall, A.; Lieb, W.; Franks, N. Stereoselective and non-stereoselective actions of isoflurane on the GABAA receptor. Br. J. Pharmacol. 1994, 112, 906–910. [Google Scholar] [CrossRef] [PubMed] [Green Version]
- Hara, M.; Kai, Y.; Ikemoto, Y. Propofol Activates GABAA Receptor-Chloride Ionophore Complex in Dissociated Hippocampal Pyramidal Neurons of the Rat. Anesthesiology 1993, 79, 781–788. [Google Scholar] [CrossRef]
- Lovinger, D.M.; Zimmerman, S.A.; Levitin, M.; Jones, M.V.; Harrison, N.L. Trichloroethanol potentiates synaptic trans-mission mediated by gamma-aminobutyric acidA receptors in hippocampal neurons. J. Pharmacol. Exp. Ther. 1993, 264, 1097–1103. [Google Scholar]
- Sceniak, M.P.; MacIver, M.B. Cellular Actions of Urethane on Rat Visual Cortical Neurons In Vitro. J. Neurophysiol. 2006, 95, 3865–3874. [Google Scholar] [CrossRef] [Green Version]
- Hara, K.; Harris, R.A. The anesthetic mechanism of urethane: The effects on neurotransmitter-gated ion channels. Anesth. Analg. 2002, 94, 313–318. [Google Scholar] [CrossRef] [Green Version]
- Brown, E.N.; Purdon, P.L.; Van Dort, C.J. General Anesthesia and Altered States of Arousal: A Systems Neuroscience Analysis. Annu. Rev. Neurosci. 2011, 34, 601–628. [Google Scholar] [CrossRef] [Green Version]
- Clement, E.A.; Richard, A.; Thwaites, M.; Ailon, J.; Peters, S.; Dickson, C.T. Cyclic and Sleep-Like Spontaneous Alternations of Brain State Under Urethane Anaesthesia. PLoS ONE 2008, 3, e2004. [Google Scholar] [CrossRef]
- Wolansky, T.; Clement, E.A.; Peters, S.R.; Palczak, M.A.; Dickson, C.T. Hippocampal Slow Oscillation: A Novel EEG State and Its Coordination with Ongoing Neocortical Activity. J. Neurosci. 2006, 26, 6213–6229. [Google Scholar] [CrossRef] [Green Version]
- Pagliardini, S.; Funk, G.D.; Dickson, C.T. Breathing and brain state: Urethane anesthesia as a model for natural sleep. Respir. Physiol. Neurobiol. 2013, 188, 324–332. [Google Scholar] [CrossRef]
- Pagliardini, S.; Greer, J.J.; Funk, G.; Dickson, C. State-Dependent Modulation of Breathing in Urethane-Anesthetized Rats. J. Neurosci. 2012, 32, 11259–11270. [Google Scholar] [CrossRef]
- Whitten, T.A.; Martz, L.J.; Guico, A.; Gervais, N.; Dickson, C.T. Heat Synch: Inter- and Independence of Body-Temperature Fluctuations and Brain-State Alternations in Urethane-Anesthetized Rats. J. Neurophysiol. 2009, 102, 1647–1656. [Google Scholar] [CrossRef] [PubMed] [Green Version]
- Sharma, A.V.; Wolansky, T.; Dickson, C.T. A Comparison of Sleeplike Slow Oscillations in the Hippocampus Under Ketamine and Urethane Anesthesia. J. Neurophysiol. 2010, 104, 932–939. [Google Scholar] [CrossRef] [PubMed] [Green Version]
- Swank, R.L.; Watson, C.W. Effects of barbiturates and ether on spontaneous electrical activity of dog brain. J. Neurophysiol. 1949, 12, 137–160. [Google Scholar] [CrossRef] [PubMed]
- Derbyshire, A.J.; Rempel, B.; Forbes, A.; Lambert, E.F. The effects of anesthetics on action potentials in the cerebral cortex of the cat. Am. J. Physiol. Content 1936, 116, 577–596. [Google Scholar] [CrossRef] [Green Version]
- Flecknell, P. Chapter 3—Special Techniques. In Laboratory Animal Anaesthesia, 4th ed.; Flecknell, P., Ed.; Academic Press: Boston, MA, USA, 2016; pp. 109–140. [Google Scholar]
- Kenny, J.D.; Westover, M.B.; Ching, S.; Brown, E.N.; Solt, K. Propofol and sevoflurane induce distinct burst suppression patterns in rats. Front. Syst. Neurosci. 2014, 8, 237. [Google Scholar] [CrossRef] [PubMed] [Green Version]
- Ness, P.C. Pentobarbital and EEG Burst Suppression in Treatment of Status Epilepticus Refractory to Benzodiazepines and Phenytoin. Epilepsia 1990, 31, 61–67. [Google Scholar] [CrossRef] [PubMed]
- Adamantidis, A.; Zhang, F.; Aravanis, A.M.; Deisseroth, K.; De Lecea, L. Neural substrates of awakening probed with optogenetic control of hypocretin neurons. Nature 2007, 450, 420–424. [Google Scholar] [CrossRef] [PubMed]
- Sheroziya, M.; Timofeev, I. Global intracellular slow-wave dynamics of the thalamocortical system. J. Neurosci. 2014, 34, 8875–8893. [Google Scholar] [CrossRef] [PubMed] [Green Version]
- Silver, N.; Ward-Flanagan, R.; Dickson, C. Long-term stability of physiological signals within fluctuations of brain state under urethane anesthesia. PLoS ONE 2021, 16, e0258. [Google Scholar] [CrossRef] [PubMed]
- Yang, Y.; Lee, J.T.; Guidera, J.A.; Vlasov, K.Y.; Pei, J.; Brown, E.N.; Solt, K.; Shanechi, M.M. Developing a personalized closed-loop controller of medically-induced coma in a rodent model. J. Neural Eng. 2019, 16, 036022. [Google Scholar] [CrossRef] [PubMed]
- Selman, W.R.; Spetzler, R.F.; Roessmann, U.R.; Rosenblatt, J.I.; Crumrine, R.C. Barbiturate-induced coma therapy for focal cerebral ischemia: Effect after temporary and permanent MCA occlusion. J. Neurosurg. 1981, 55, 220–226. [Google Scholar] [CrossRef] [PubMed]
- Liu, X.; Zhu, X.-H.; Zhang, Y.; Chen, W. Neural Origin of Spontaneous Hemodynamic Fluctuations in Rats under Burst-Suppression Anesthesia Condition. Cereb. Cortex 2010, 21, 374–384. [Google Scholar] [CrossRef]
- Lewis, L.; Ching, S.; Weiner, V.S.; Peterfreund, R.A.; Eskandar, E.N.; Cash, S.S.; Brown, E.N.; Purdon, P.L. Local cortical dynamics of burst suppression in the anaesthetized brain. Brain 2013, 136, 2727–2737. [Google Scholar] [CrossRef]
- Zarhin, D.; Atsmon, R.; Ruggiero, A.; Baeloha, H.; Shoob, S.; Scharf, O.; Heim, L.R.; Buchbinder, N.; Shinikamin, O.; Shapira, I.; et al. Disrupted neural correlates of anesthesia and sleep reveal early circuit dysfunctions in Alzheimer models. Cell Rep. 2022, 38, 110268. [Google Scholar] [CrossRef]
- Brown, R.; Lam, A.D.; Gonzalez-Sulser, A.; Ying, A.; Jones, M.; Chou, R.C.-C.; Tzioras, M.; Jordan, C.Y.; Jedrasiak-Cape, I.; Hemonnot, A.-L.; et al. Circadian and Brain State Modulation of Network Hyperexcitability in Alzheimer’s Disease. Eneuro 2018, 5. [Google Scholar] [CrossRef] [Green Version]
- Kroeger, D.; Amzica, F. Hypersensitivity of the Anesthesia-Induced Comatose Brain. J. Neurosci. 2007, 27, 10597–10607. [Google Scholar] [CrossRef] [Green Version]
- Akrawi, W.P.; Drummond, J.C.; Kalkman, C.; Patel, P.M. A Comparison of the Electrophysiologic Characteristics of EEG Burst-Suppression as Produced by Isoflurane, Thiopental, Etomidate, and Propofol. J. Neurosurg. Anesthesiol. 1996, 8, 40–46. [Google Scholar] [CrossRef]
- Fleischmann, A.; Pilge, S.; Kiel, T.; Kratzer, S.; Schneider, G.; Kreuzer, M. Substance-Specific Differences in Human Electro-encephalographic Burst Suppression Patterns. Front. Hum. Neurosci. 2018, 12, 368. [Google Scholar] [CrossRef] [Green Version]
- Chauvette, S.; Crochet, S.; Volgushev, M.; Timofeev, I. Properties of Slow Oscillation during Slow-Wave Sleep and Anesthesia in Cats. J. Neurosci. 2011, 31, 14998–15008. [Google Scholar] [CrossRef] [PubMed]
- Gelegen, C.; Miracca, G.; Ran, M.Z.; Harding, E.; Ye, Z.; Yu, X.; Tossell, K.; Houston, C.M.; Yustos, R.; Hawkins, E.; et al. Excitatory Pathways from the Lateral Habenula Enable Propofol-Induced Sedation. Curr. Biol. 2018, 28, 580–587.e5. [Google Scholar] [CrossRef] [PubMed] [Green Version]
- Hemmings, H.C.; Riegelhaupt, P.M.; Kelz, M.B.; Solt, K.; Eckenhoff, R.G.; Orser, B.A.; Goldstein, P.A. Towards a Com-prehensive Understanding of Anesthetic Mechanisms of Action: A Decade of Discovery. Trends Pharmacol. Sci. 2019, 40, 464–481. [Google Scholar] [CrossRef] [PubMed]
- Jiang-Xie, L.-F.; Yin, L.; Zhao, S.; Prevosto, V.; Han, B.-X.; Dzirasa, K.; Wang, F. A Common Neuroendocrine Substrate for Diverse General Anesthetics and Sleep. Neuron 2019, 102, 1053–1065.e4. [Google Scholar] [CrossRef] [PubMed]
- Tung, A.; Szafran, M.J.; Bluhm, B.; Mendelson, W.B. Sleep Deprivation Potentiates the Onset and Duration of Loss of Righting Reflex Induced by Propofol and Isoflurane. Anesthesiology 2002, 97, 906–911. [Google Scholar] [CrossRef] [PubMed]
- Tung, A.; Bergmann, B.M.; Herrera, S.; Cao, D.; Mendelson, W.B. Recovery from Sleep Deprivation Occurs during Propofol Anesthesia. Anesthesiology 2004, 100, 1419–1426. [Google Scholar] [CrossRef] [Green Version]
- Pal, D.; Lipinski, W.J.; Walker, A.J.; Turner, A.M.; Mashour, G.A. State-specific effects of sevoflurane anesthesia on sleep homeostasis: Selective recovery of slow wave but not rapid eye movement sleep. Anesthesiology 2011, 114, 302–310. [Google Scholar] [CrossRef] [Green Version]
- Akeju, O.; Brown, E.N. Neural oscillations demonstrate that general anesthesia and sedative states are neurophysiologically distinct from sleep. Curr. Opin. Neurobiol. 2017, 44, 178–185. [Google Scholar] [CrossRef]
- Lincoln, D. Correlation of unit activity in the hypothalamus with EEG patterns associated with the sleep cycle. Exp. Neurol. 1969, 24, 1–18. [Google Scholar] [CrossRef]
- Robinson, T.E.; Kramis, R.; Vanderwolf, C. Two types of cerebral activation during active sleep: Relations to behavior. Brain Res. 1977, 124, 544–549. [Google Scholar] [CrossRef]
- Détári, L.; Vanderwolf, C. Activity of identified cortically projecting and other basal forebrain neurones during large slow waves and cortical activation in anaesthetized rats. Brain Res. 1987, 437, 1–8. [Google Scholar] [CrossRef]
- Maggi, C.A.; Meli, A. Suitability of urethane anesthesia for physiopharmacological investigations in various systems Part 1: General considerations. Experientia 1986, 42, 109–114. [Google Scholar] [CrossRef] [PubMed]
- Dringenberg, H.C.; Vanderwolf, C. Some general anesthetics reduce serotonergic neocortical activation and enhance the action of serotonergic antagonists. Brain Res. Bull. 1995, 36, 285–292. [Google Scholar] [CrossRef]
- Fieldi, K.J.; White, W.J.; Lang, C.M. Anaesthetic effects of chloral hydrate, pentobarbitone and urethane in adult male rats. Lab. Anim. 1993, 27, 258–269. [Google Scholar] [CrossRef] [PubMed]
- Flecknell, P. Chapter 2—Managing and Monitoring Anaesthesia. In Laboratory Animal Anaesthesial, 4th ed.; Flecknell, P., Ed.; Academic Press: Boston, MA, USA, 2016; pp. 77–108. [Google Scholar]
- Lian, X.; Lin, Y.; Luo, T.; Yuan, H.; Chen, Y. Comparison of dexmedetomidine with chloral hydrate as sedatives for pediatric patients: A systematic review and meta-analysis. Medicine 2020, 99, 31. [Google Scholar] [CrossRef]
- Garcia, P.S.; Kolesky, S.E.; Jenkins, A. General anesthetic actions on GABA(A) receptors. Curr. Neuropharmacol. 2010, 8, 2–9. [Google Scholar] [CrossRef]
- Butler, T.C. The metabolic fate of chloral hydrate. J. Pharmacol. Exp. Ther. 1948, 92, 49–58. [Google Scholar]
- Krasowski, M.D.; Harrison, N.L. The actions of ether, alcohol and alkane general anaesthetics on GABAA and glycine receptors and the effects of TM2 and TM3 mutations. Br. J. Pharmacol. 2000, 129, 731–743. [Google Scholar] [CrossRef] [Green Version]
- Nomeir, A.; Ioannou, Y.; Sanders, J.; Matthews, H. Comparative metabolism and disposition of ethyl carbamate (urethane) in male fischer 344 rats and male B6C3F1 mice. Toxicol. Appl. Pharmacol. 1989, 97, 203–215. [Google Scholar] [CrossRef]
- Sotomayor, R.E.; Collins, T.F.X. Mutagenicity, Metabolism, and DNA Interactions of Urethane. Toxicol. Ind. Health 1990, 6, 71–108. [Google Scholar] [CrossRef]
- Teppema, L.J.; Baby, S. Anesthetics and control of breathing. Respir. Physiol. Neurobiol. 2011, 177, 80–92. [Google Scholar] [CrossRef] [PubMed]
- Leung, L.S.; Luo, T.; Ma, J.; Herrick, I. Brain areas that influence general anesthesia. Prog. Neurobiol. 2014, 122, 24–44. [Google Scholar] [CrossRef] [PubMed]
- Brown, E.N.; Solt, K.; Purdon, P.L.; Akeju, O.; Eriksson, L.; Fleisher, L.; Wiener-Kronish, J.; Cohen, N.; Young, W. Monitoring brain state during general anesthesia and sedation. Mill. Anesth. 2014, 1, 1524–1540. [Google Scholar]
- Kelz, M.B.; Mashour, G.A. The Biology of General Anesthesia from Paramecium to Primate. Curr. Biol. 2019, 29, R1199–R1210. [Google Scholar] [CrossRef] [Green Version]


Publisher’s Note: MDPI stays neutral with regard to jurisdictional claims in published maps and institutional affiliations. |
© 2022 by the authors. Licensee MDPI, Basel, Switzerland. This article is an open access article distributed under the terms and conditions of the Creative Commons Attribution (CC BY) license (https://creativecommons.org/licenses/by/4.0/).
Share and Cite
Ward-Flanagan, R.; Lo, A.S.; Clement, E.A.; Dickson, C.T. A Comparison of Brain-State Dynamics across Common Anesthetic Agents in Male Sprague-Dawley Rats. Int. J. Mol. Sci. 2022, 23, 3608. https://doi.org/10.3390/ijms23073608
Ward-Flanagan R, Lo AS, Clement EA, Dickson CT. A Comparison of Brain-State Dynamics across Common Anesthetic Agents in Male Sprague-Dawley Rats. International Journal of Molecular Sciences. 2022; 23(7):3608. https://doi.org/10.3390/ijms23073608
Chicago/Turabian StyleWard-Flanagan, Rachel, Alto S. Lo, Elizabeth A. Clement, and Clayton T. Dickson. 2022. "A Comparison of Brain-State Dynamics across Common Anesthetic Agents in Male Sprague-Dawley Rats" International Journal of Molecular Sciences 23, no. 7: 3608. https://doi.org/10.3390/ijms23073608