
Size Matters: Rethinking Hertz Model Interpretation for Cell Mechanics Using AFM

Abstract
:1. Introduction
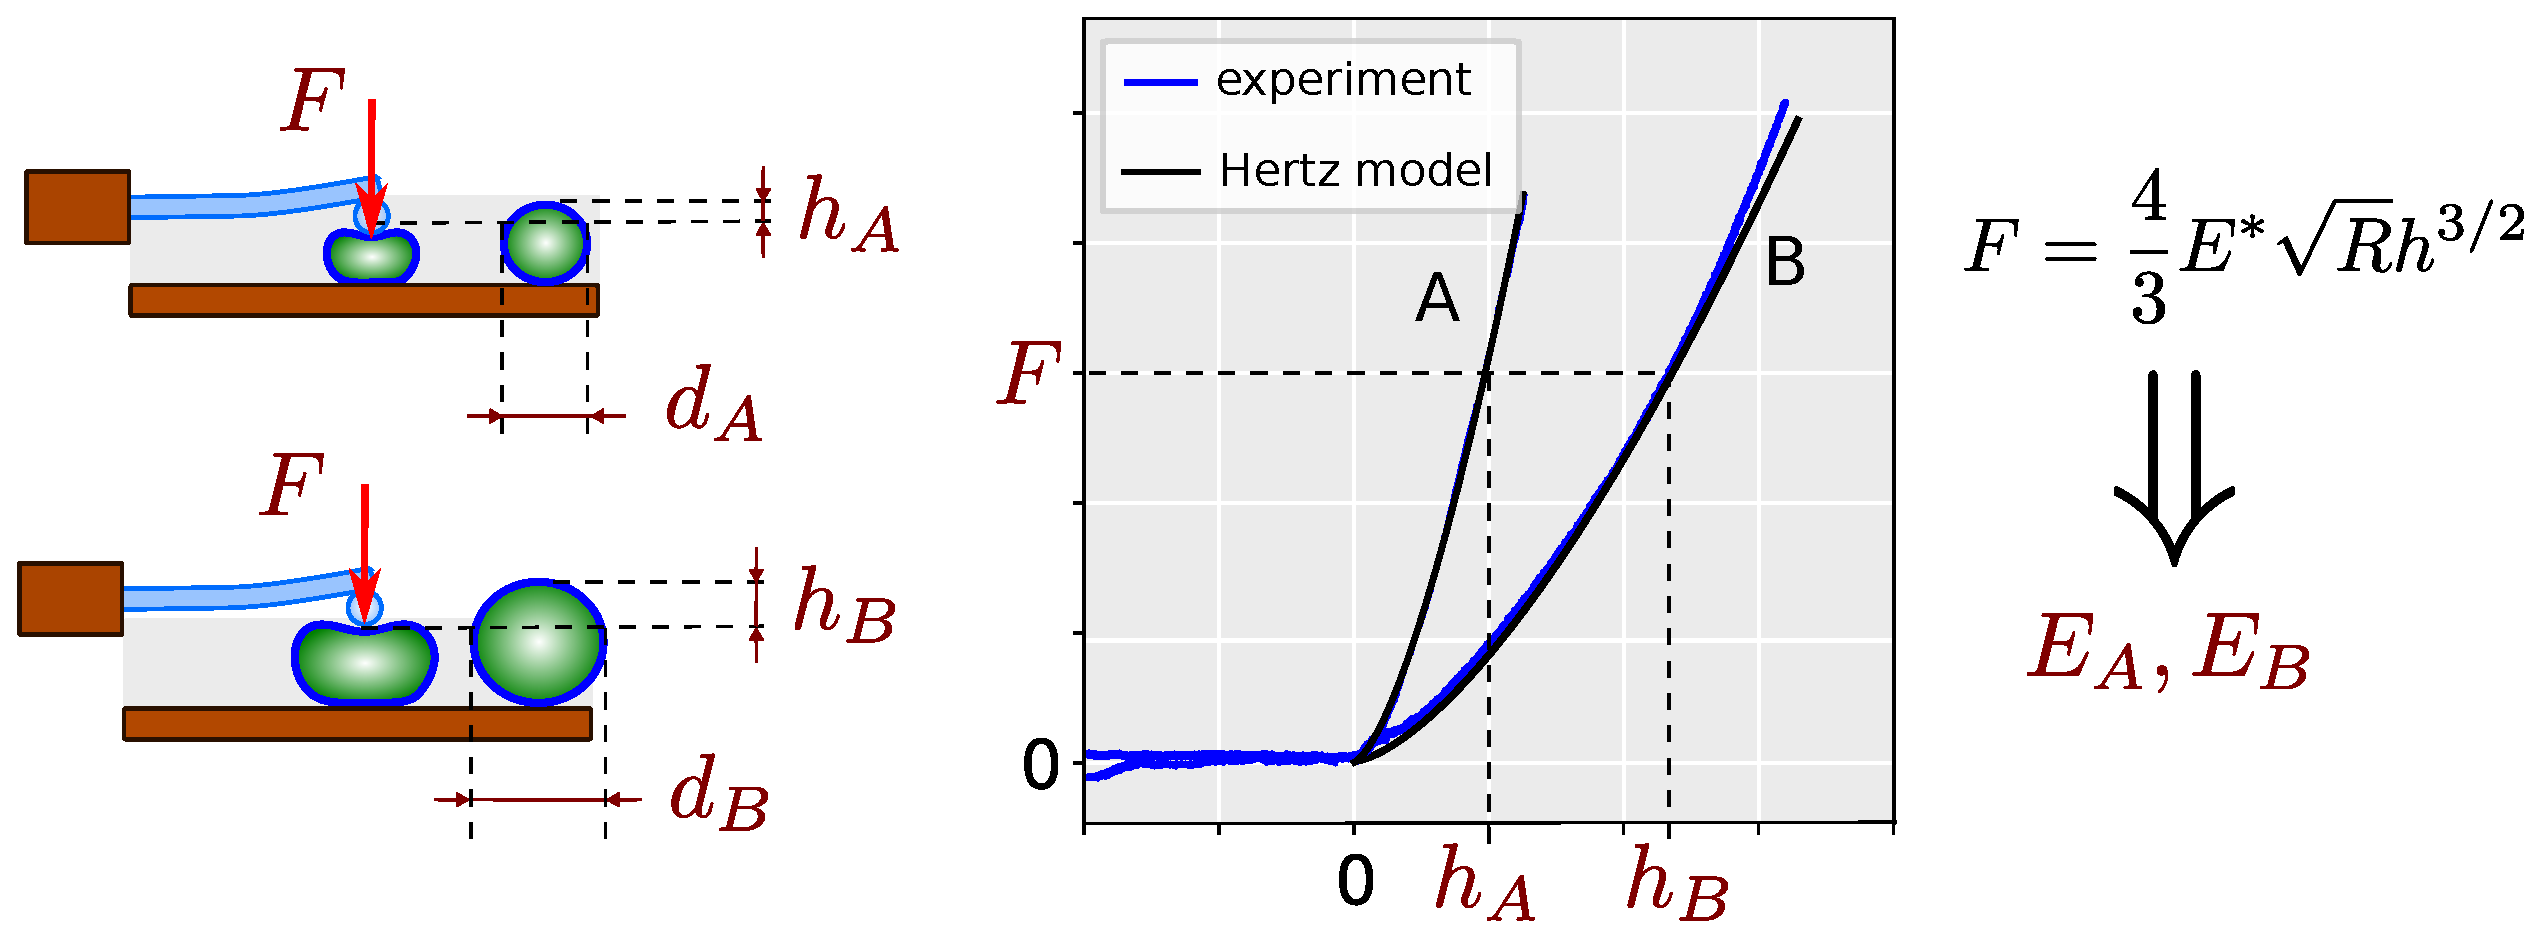
2. Results
3. Discussion
4. Materials and Methods
4.1. Liposomes Preparation
4.2. Liposomes Fixation
4.3. AFM Measurements
4.4. Data Processing
4.5. Statistical Analyses
5. Conclusions
Author Contributions
Funding
Data Availability Statement
Conflicts of Interest
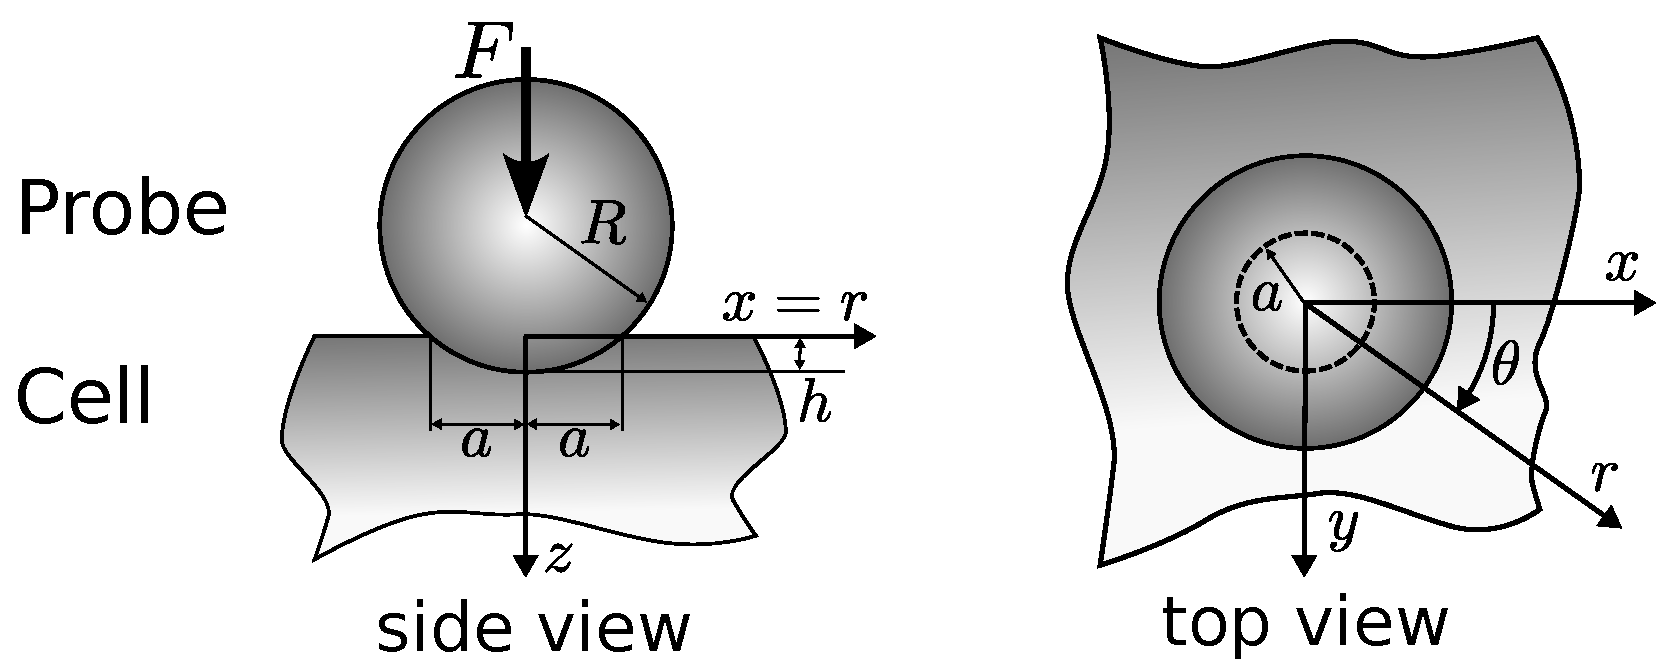
Appendix A. On Derivation of Hertz Contact Theory for AFM Measurements Evaluation
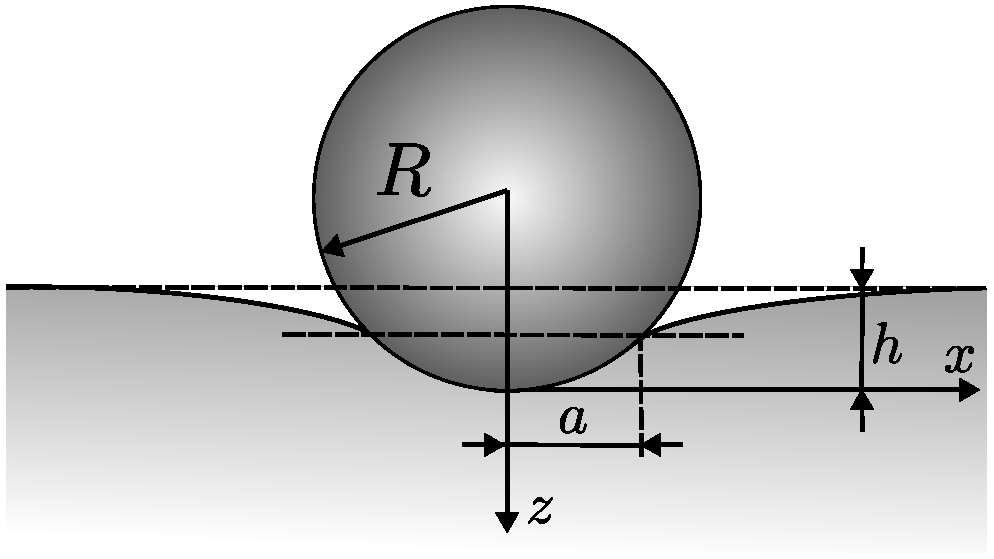
- The size of the cell is much larger than the size of the indenter, allowing the cell surface to be considered flat relative to the indenter.
- The spherical indenter is considered a rigid body, meaning it maintains its shape under loading.
- The cell in contact is considered homogeneous, meaning it possesses uniform qualities at different sites or consistent properties with increasing depth.
- The cell is isotropic, meaning it has identical properties in all directions.
- The displacements and stresses must satisfy the differential equations of equilibrium for elastic bodies, and the stresses must vanish at a great distance from the contact surface.
- The indenter and the cell are in frictionless contact.
- The surfaces of both the cell and the indenter have negligible roughness.
- At the surface of the bodies, the normal pressure is zero outside the contact area and equal and opposite inside the circle of contact.
- The distance between the surfaces of the two bodies is zero inside the circle of contact and greater than zero outside it.
- The weight of both the indenter and the cell is neglected.
Appendix A.1. Hertz Contact Theory—Conceptual Solution
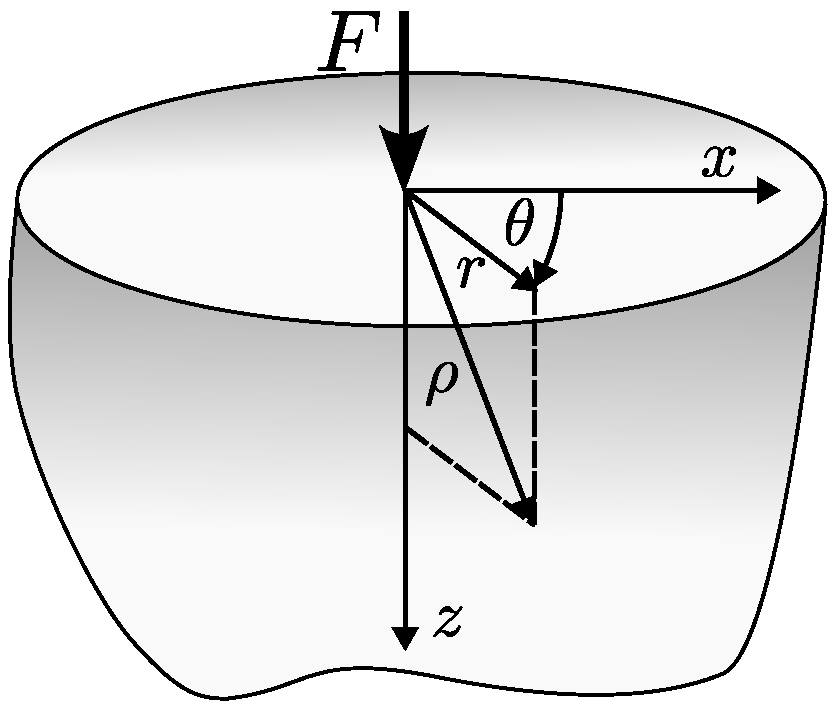
Appendix A.2. Boussinesq’s Problem
Appendix A.3. Hertz Contact Theory
References
- Dufrêne, Y.F.; Viljoen, A.; Mignolet, J.; Mathelié-Guinlet, M. AFM in Cellular and Molecular Microbiology. Cell. Microbiol. 2021, 23, e13324. [Google Scholar] [CrossRef]
- Binnig, G.; Quate, C.F.; Gerber, C. Atomic Force Microscope. Phys. Rev. Lett. 1986, 56, 930–933. [Google Scholar] [CrossRef]
- Alsteens, D.; Beaussart, A.; El-Kirat-Chatel, S.; Sullan, R.M.A.; Dufrêne, Y.F. Atomic Force Microscopy: A New Look at Pathogens. PLoS Pathog. 2013, 9, e1003516. [Google Scholar] [CrossRef]
- Moeendarbary, E.; Harris, A.R. Cell Mechanics: Principles, Practices, and Prospects. Wiley Interdiscip. Rev. Syst. Biol. Med. 2014, 6, 371–388. [Google Scholar] [CrossRef]
- Wu, P.H.; Aroush, D.R.B.; Asnacios, A.; Chen, W.C.; Dokukin, M.E.; Doss, B.L.; Durand-Smet, P.; Ekpenyong, A.; Guck, J.; Guz, N.V.; et al. A Comparison of Methods to Assess Cell Mechanical Properties. Nat. Methods 2018, 15, 491–498. [Google Scholar] [CrossRef]
- Li, M.; Dang, D.; Liu, L.; Xi, N.; Wang, Y. Atomic Force Microscopy in Characterizing Cell Mechanics for Biomedical Applications: A Review. IEEE Trans. Nanobiosci. 2017, 16, 523–540. [Google Scholar] [CrossRef] [PubMed]
- Li, M.; Xi, N.; Wang, Y.C.; Liu, L.Q. Atomic Force Microscopy for Revealing Micro/Nanoscale Mechanics in Tumor Metastasis: From Single Cells to Microenvironmental Cues. Acta Pharmacol. Sin. 2021, 42, 323–339. [Google Scholar] [CrossRef]
- Peña, B.; Adbel-Hafiz, M.; Cavasin, M.; Mestroni, L.; Sbaizero, O. Atomic Force Microscopy (AFM) Applications in Arrhythmogenic Cardiomyopathy. Int. J. Mol. Sci. 2022, 23, 3700. [Google Scholar] [CrossRef]
- Ohnesorge, F.M.; Hörber, J.K.; Häberle, W.; Czerny, C.P.; Smith, D.P.; Binnig, G. AFM Review Study on Pox Viruses and Living Cells. Biophys. J. 1997, 73, 2183–2194. [Google Scholar] [CrossRef] [PubMed]
- Efremov, Y.M.; Suter, D.M.; Timashev, P.S.; Raman, A. 3D Nanomechanical Mapping of Subcellular and Sub-Nuclear Structures of Living Cells by Multi-Harmonic AFM with Long-Tip Microcantilevers. Sci. Rep. 2022, 12, 529. [Google Scholar] [CrossRef] [PubMed]
- Lim, C.T.; Zhou, E.H.; Quek, S.T. Mechanical Models for Living Cells—A Review. J. Biomech. 2006, 39, 195–216. [Google Scholar] [CrossRef]
- Guz, N.; Dokukin, M.; Kalaparthi, V.; Sokolov, I. If Cell Mechanics Can Be Described by Elastic Modulus: Study of Different Models and Probes Used in Indentation Experiments. Biophys. J. 2014, 107, 564–575. [Google Scholar] [CrossRef]
- Liu, B.; Zhang, L.; Gao, H. Poisson Ratio Can Play a Crucial Role in Mechanical Properties of Biocomposites. Mech. Mater. 2006, 38, 1128–1142. [Google Scholar] [CrossRef]
- Dokukin, M.E.; Sokolov, I. On the Measurements of Rigidity Modulus of Soft Materials in Nanoindentation Experiments at Small Depth. Macromolecules 2012, 45, 4277–4288. [Google Scholar] [CrossRef]
- Kontomaris, S.V.; Malamou, A.; Stylianou, A. The Hertzian Theory in AFM Nanoindentation Experiments Regarding Biological Samples: Overcoming Limitations in Data Processing. Micron 2022, 155, 103228. [Google Scholar] [CrossRef] [PubMed]
- Sen, S.; Subramanian, S.; Discher, D.E. Indentation and Adhesive Probing of a Cell Membrane with AFM: Theoretical Model and Experiments. Biophys. J. 2005, 89, 3203–3213. [Google Scholar] [CrossRef] [PubMed]
- Pharr, G.M.; Oliver, W.C.; Brotzen, F.R. On the Generality of the Relationship among Contact Stiffness, Contact Area, and Elastic Modulus during Indentation. J. Mater. Res. 1992, 7, 613–617. [Google Scholar] [CrossRef]
- Kontomaris, S.V.; Malamou, A. Hertz Model or Oliver & Pharr Analysis? Tutorial Regarding AFM Nanoindentation Experiments on Biological Samples. Mater. Res. Express 2020, 7, 033001. [Google Scholar] [CrossRef]
- Timoshenko, S.; Goodier, J.N. Theory of Elasticity; McGraw-Hill: New York, NY, USA, 1951. [Google Scholar]
- Lekka, M.; Laidler, P. Applicability of AFM in Cancer Detection. Nat. Nanotechnol. 2009, 4, 72. [Google Scholar] [CrossRef] [PubMed]
- Kontomaris, S.V.; Stylianou, A.; Malamou, A.; Stylianopoulos, T. A Discussion Regarding the Approximation of Cylindrical and Spherical Shaped Samples as Half Spaces in AFM Nanoindentation Experiments. Mater. Res. Express 2018, 5, 085402. [Google Scholar] [CrossRef]
- Tsugawa, S.; Yamasaki, Y.; Horiguchi, S.; Zhang, T.; Muto, T.; Nakaso, Y.; Ito, K.; Takebayashi, R.; Okano, K.; Akita, E.; et al. Elastic Shell Theory for Plant Cell Wall Stiffness Reveals Contributions of Cell Wall Elasticity and Turgor Pressure in AFM Measurement. Sci. Rep. 2022, 12, 13044. [Google Scholar] [CrossRef] [PubMed]
- Overbeck, A.; Günther, S.; Kampen, I.; Kwade, A. Compression Testing and Modeling of Spherical Cells – Comparison of Yeast and Algae. Chem. Eng. Technol. 2017, 40, 1158–1164. [Google Scholar] [CrossRef]
- Thomas, G.; Burnham, N.A.; Camesano, T.A.; Wen, Q. Measuring the Mechanical Properties of Living Cells Using Atomic Force Microscopy. J. Vis. Exp. JOVE 2013, 76, 50497. [Google Scholar] [CrossRef]
- Delorme, N.; Fery, A. Direct Method to Study Membrane Rigidity of Small Vesicles Based on Atomic Force Microscope Force Spectroscopy. Phys. Rev. E 2006, 74, 030901. [Google Scholar] [CrossRef]
- Delorme, N.; Dubois, M.; Garnier, S.; Laschewsky, A.; Weinkamer, R.; Zemb, T.; Fery, A. Surface Immobilization and Mechanical Properties of Catanionic Hollow Faceted Polyhedrons. J. Phys. Chem. B 2006, 110, 1752–1758. [Google Scholar] [CrossRef]
- Reissner, E. Stress Strain Relations in the Theory of Thin Elastic Shells. J. Math. Phys. 1952, 31, 109–119. [Google Scholar] [CrossRef]
- Otto, O.; Rosendahl, P.; Mietke, A.; Golfier, S.; Herold, C.; Klaue, D.; Girardo, S.; Pagliara, S.; Ekpenyong, A.; Jacobi, A.; et al. Real-Time Deformability Cytometry: On-the-fly Cell Mechanical Phenotyping. Nat. Methods 2015, 12, 199–202. [Google Scholar] [CrossRef] [PubMed]
- Ren, K.; Gao, J.; Han, D. AFM Force Relaxation Curve Reveals That the Decrease of Membrane Tension Is the Essential Reason for the Softening of Cancer Cells. Front. Cell Dev. Biol. 2021, 9, 663021. [Google Scholar] [CrossRef]
- Xie, K.; Yang, Y.; Jiang, H. Controlling Cellular Volume via Mechanical and Physical Properties of Substrate. Biophys. J. 2018, 114, 675–687. [Google Scholar] [CrossRef]
- Nehls, S.; Nöding, H.; Karsch, S.; Ries, F.; Janshoff, A. Stiffness of MDCK II Cells Depends on Confluency and Cell Size. Biophys. J. 2019, 116, 2204–2211. [Google Scholar] [CrossRef]
- Efremov, Y.M.; Velay-Lizancos, M.; Weaver, C.J.; Athamneh, A.I.; Zavattieri, P.D.; Suter, D.M.; Raman, A. Anisotropy vs Isotropy in Living Cell Indentation with AFM. Sci. Rep. 2019, 9, 5757. [Google Scholar] [CrossRef] [PubMed]
- Reed, J.; Troke, J.J.; Schmit, J.; Han, S.; Teitell, M.A.; Gimzewski, J.K. Live Cell Interferometry Reveals Cellular Dynamism During Force Propagation. ACS Nano 2008, 2, 841–846. [Google Scholar] [CrossRef] [PubMed]
- Rajagopal, V.; Holmes, W.R.; Lee, P.V.S. Computational Modeling of Single-Cell Mechanics and Cytoskeletal Mechanobiology. Wires Syst. Biol. Med. 2018, 10, e1407. [Google Scholar] [CrossRef] [PubMed]
- Lopes dos Santos, R.; Campillo, C. Studying Actin-Induced Cell Shape Changes Using Giant Unilamellar Vesicles and Reconstituted Actin Networks. Biochem. Soc. Trans. 2022, 50, 1527–1539. [Google Scholar] [CrossRef] [PubMed]
- Cowman, M.K.; Schmidt, T.A.; Raghavan, P.; Stecco, A. Viscoelastic Properties of Hyaluronan in Physiological Conditions. F1000Research 2015, 4, 622. [Google Scholar] [CrossRef] [PubMed]
- Xie, J.; Najafi, J.; Le Borgne, R.; Verbavatz, J.M.; Durieu, C.; Sallé, J.; Minc, N. Contribution of Cytoplasm Viscoelastic Properties to Mitotic Spindle Positioning. Proc. Natl. Acad. Sci. USA 2022, 119, e2115593119. [Google Scholar] [CrossRef]
- Rebenda, D.; Vrbka, M.; Čípek, P.; Toropitsyn, E.; Nečas, D.; Pravda, M.; Hartl, M. On the Dependence of Rheology of Hyaluronic Acid Solutions and Frictional Behavior of Articular Cartilage. Materials 2020, 13, 2659. [Google Scholar] [CrossRef]
- Wang, K.; Sun, X.H.; Zhang, Y.; Zhang, T.; Zheng, Y.; Wei, Y.C.; Zhao, P.; Chen, D.Y.; Wu, H.A.; Wang, W.H.; et al. Characterization of Cytoplasmic Viscosity of Hundreds of Single Tumour Cells Based on Micropipette Aspiration. R. Soc. Open Sci. 2019, 6, 181707. [Google Scholar] [CrossRef]
- Hilšer, P.; Suchánková, A.; Mendová, K.; Filipič, K.E.; Daniel, M.; Vrbka, M. A New Insight into More Effective Viscosupplementation Based on the Synergy of Hyaluronic Acid and Phospholipids for Cartilage Friction Reduction. Biotribology 2021, 25, 100166. [Google Scholar] [CrossRef]
- Ungai-Salánki, R.; Csippa, B.; Gerecsei, T.; Péter, B.; Horvath, R.; Szabó, B. Nanonewton Scale Adhesion Force Measurements on Biotinylated Microbeads with a Robotic Micropipette. J. Colloid Interface Sci. 2021, 602, 291–299. [Google Scholar] [CrossRef]
- Wang, M.; Liu, Z.; Zhan, W. Janus Liposomes: Gel-Assisted Formation and Bioaffinity-Directed Clustering. Langmuir 2018, 34, 7509–7518. [Google Scholar] [CrossRef] [PubMed]
- Ruozi, B.; Tosi, G.; Leo, E.; Vandelli, M.A. Application of Atomic Force Microscopy to Characterize Liposomes as Drug and Gene Carriers. Talanta 2007, 73, 12–22. [Google Scholar] [CrossRef] [PubMed]
- Vorselen, D.; Piontek, M.C.; Roos, W.H.; Wuite, G.J.L. Mechanical Characterization of Liposomes and Extracellular Vesicles, a Protocol. Front. Mol. Biosci. 2020, 7, 139. [Google Scholar] [CrossRef] [PubMed]
- Bates, D.; Mächler, M.; Bolker, B.; Walker, S. Fitting Linear Mixed-Effects Models Using Lme4. J. Stat. Softw. 2015, 67, 1–48. [Google Scholar] [CrossRef]
- Marcotti, S.; Reilly, G.C.; Lacroix, D. Effect of Cell Sample Size in Atomic Force Microscopy Nanoindentation. J. Mech. Behav. Biomed. Mater. 2019, 94, 259–266. [Google Scholar] [CrossRef] [PubMed]
- Cross, S.E.; Jin, Y.S.; Rao, J.; Gimzewski, J.K. Applicability of AFM in Cancer Detection. Nat. Nanotechnol. 2009, 4, 72–73. [Google Scholar] [CrossRef]
- Fischer-Cripps, A.C. Introduction to Contact Mechanics, 2nd ed.; Mechanical Engineering Series; Springer: New York, NY, USA, 2011. [Google Scholar]
- Ciulli, E.; Betti, A.; Forte, P. The Applicability of the Hertzian Formulas to Point Contacts of Spheres and Spherical Caps. Lubricants 2022, 10, 233. [Google Scholar] [CrossRef]
- Johnson, K.L. One Hundred Years of Hertz Contact. Proc. Inst. Mech. Eng. 1982, 196, 363–378. [Google Scholar] [CrossRef]
- Johnson, K.L. Contact Mechanics; Cambridge University Press: Cambridge, UK, 2004. [Google Scholar]
- Popov, V.L. Contact Mechanics and Friction; Springer: Berlin/Heidelberg, Germany, 2017. [Google Scholar] [CrossRef]
- Hertz, H. Ueber die Berührung fester elastischer Körper. J. für Die Reine Und Angew. Math. 1882, 92, 156–171. [Google Scholar]
- Podio-Guidugli, P.; Favata, A. The Boussinesq Problem. In Elasticity for Geotechnicians: A Modern Exposition of Kelvin, Boussinesq, Flamant, Cerruti, Melan, and Mindlin Problems; Podio-Guidugli, P., Favata, A., Eds.; Springer International Publishing: Cham, Switzerland, 2014; pp. 79–114. [Google Scholar] [CrossRef]
- Selvadurai, A.P.S. On Boussinesq’s Problem for a Cracked Halfspace. J. Eng. Math. 2017, 107, 269–282. [Google Scholar] [CrossRef]
- Selvadurai, A.P.S. On Boussinesq’s Problem. Int. J. Eng. Sci. 2001, 39, 317–322. [Google Scholar] [CrossRef]
- Landau, L.D.; Lifšic, E.M. Theory of Elastic, 3rd ed.; Course of Theoretical Physics; Elsevier Butterworth Heinemann: Amsterdam, The Netherlands, 2009. [Google Scholar]
Disclaimer/Publisher’s Note: The statements, opinions and data contained in all publications are solely those of the individual author(s) and contributor(s) and not of MDPI and/or the editor(s). MDPI and/or the editor(s) disclaim responsibility for any injury to people or property resulting from any ideas, methods, instructions or products referred to in the content. |
© 2024 by the authors. Licensee MDPI, Basel, Switzerland. This article is an open access article distributed under the terms and conditions of the Creative Commons Attribution (CC BY) license (https://creativecommons.org/licenses/by/4.0/).
Share and Cite
Mendová, K.; Otáhal, M.; Drab, M.; Daniel, M. Size Matters: Rethinking Hertz Model Interpretation for Cell Mechanics Using AFM. Int. J. Mol. Sci. 2024, 25, 7186. https://doi.org/10.3390/ijms25137186
Mendová K, Otáhal M, Drab M, Daniel M. Size Matters: Rethinking Hertz Model Interpretation for Cell Mechanics Using AFM. International Journal of Molecular Sciences. 2024; 25(13):7186. https://doi.org/10.3390/ijms25137186
Chicago/Turabian StyleMendová, Katarína, Martin Otáhal, Mitja Drab, and Matej Daniel. 2024. "Size Matters: Rethinking Hertz Model Interpretation for Cell Mechanics Using AFM" International Journal of Molecular Sciences 25, no. 13: 7186. https://doi.org/10.3390/ijms25137186