
CRISPR/Cas-Mediated Knockdown of PD-L1 and KRAS in Lung Cancer Cells
 , , ,
, , ,  and
and 
Abstract
1. Introduction
2. Results
2.1. PD-L1 KD Mediated by CRISPR/Cas9 Reduced Cell Viability and Increased Cell Sensitivity to Paclitaxel
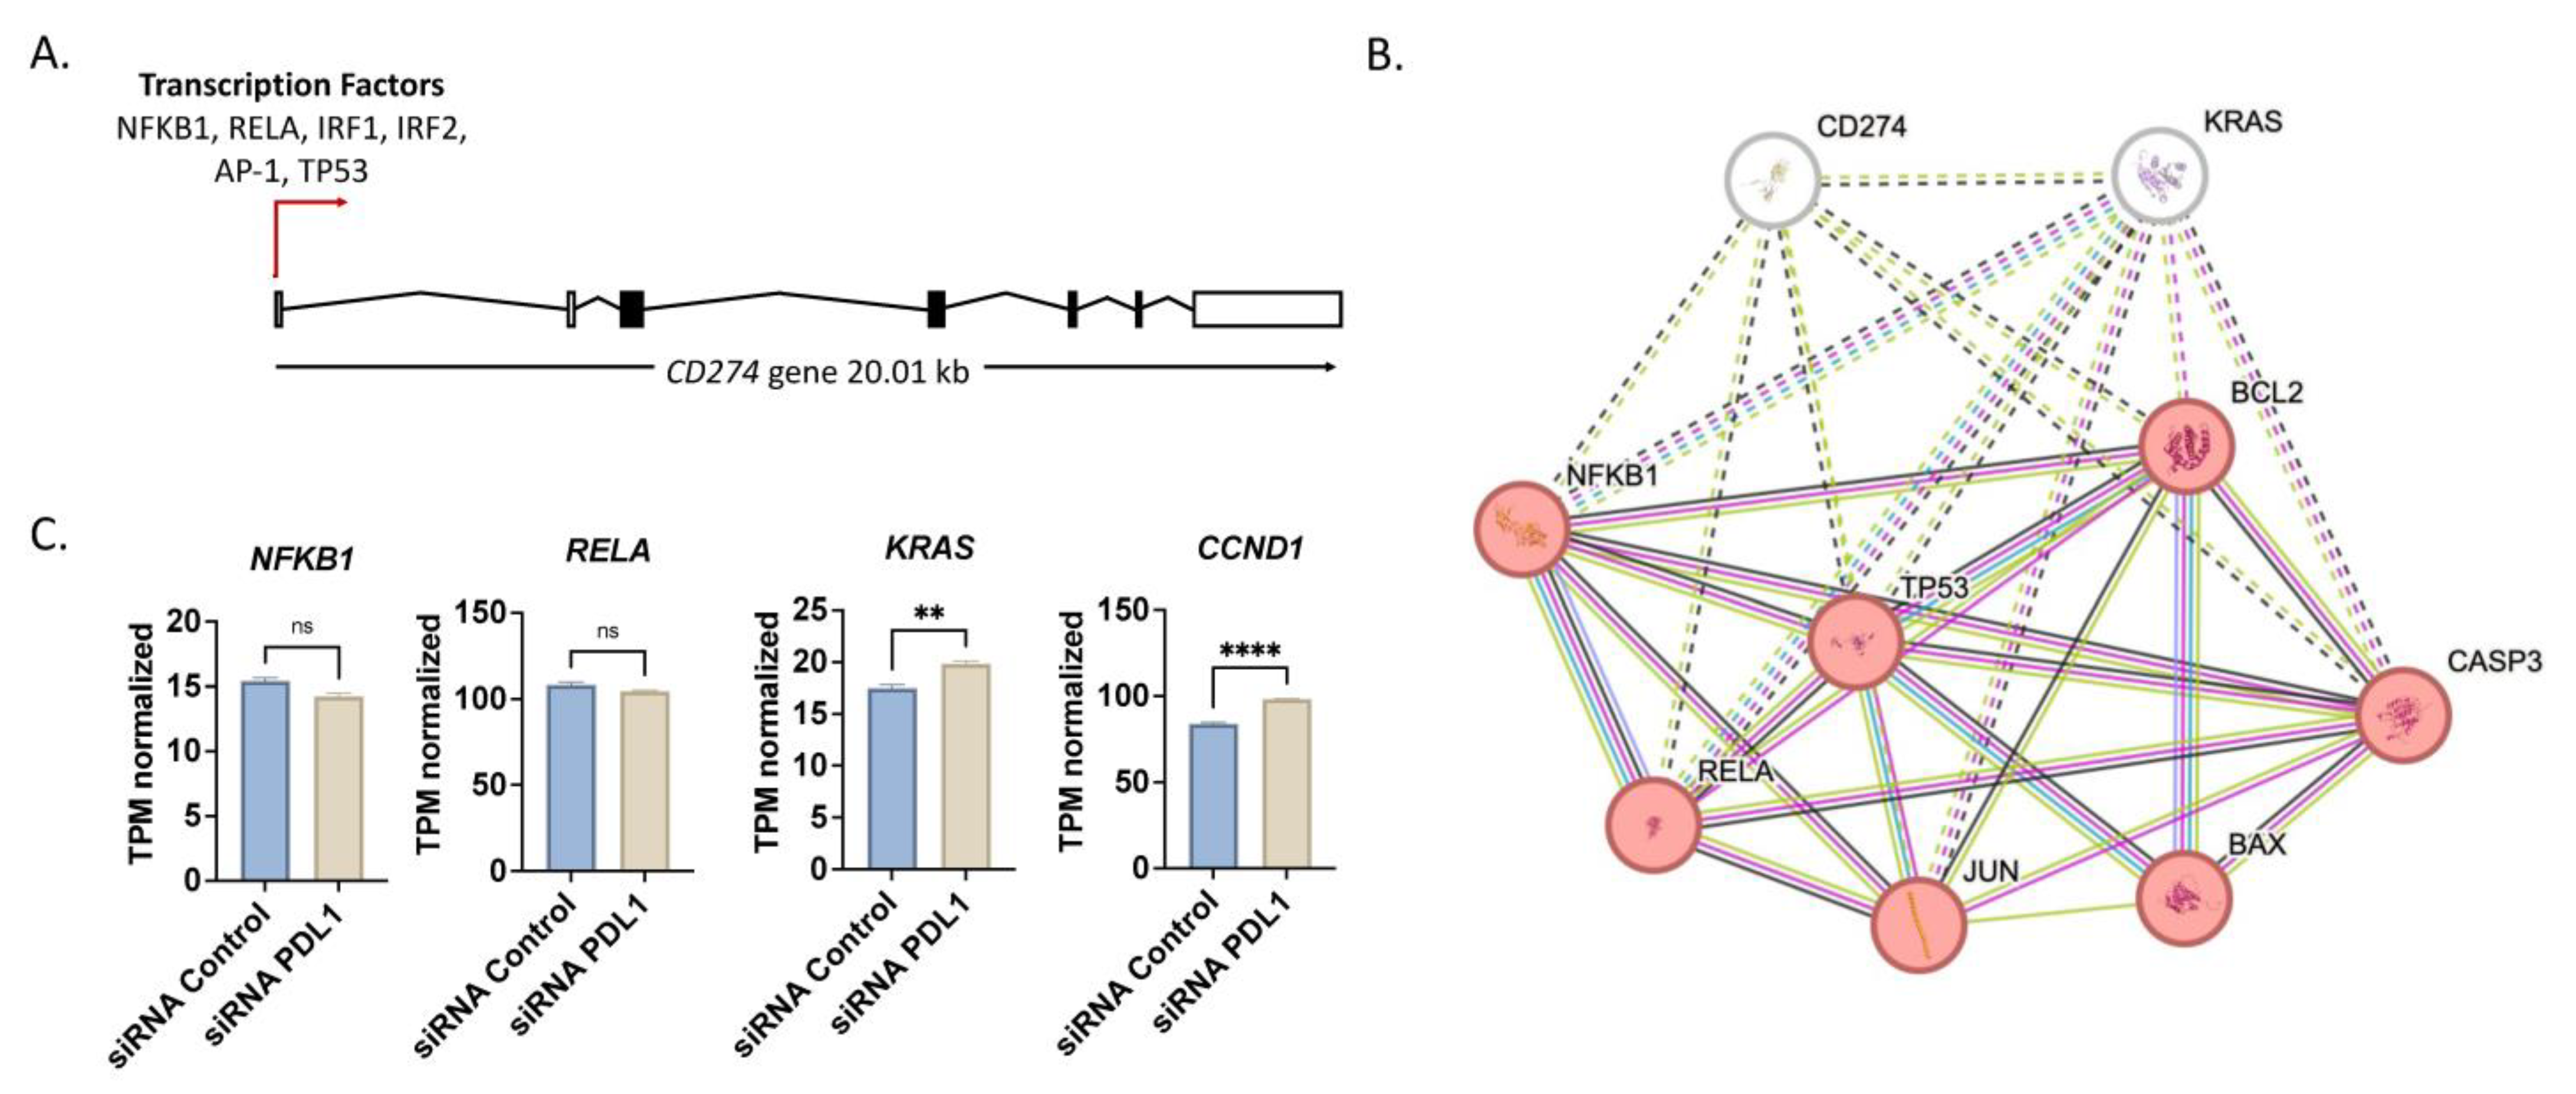
2.2. Expression Profile of Lung Cancer Cells upon PD-L1 and KRAS Knockdown
2.3. Dual Knockdown of PD-L1 and KRAS Induced Apoptosis and Caused Cell Cycle Arrest
2.4. PD-L1 Knockdown Impaired Migratory Capacity of A549 Cells
2.5. Dual Knockdown of PD-L1 and KRAS Improved Cytotoxicity of Paclitaxel Even in Cells with Wildtype KRAS
3. Discussion
4. Materials and Methods
4.1. Cell Culture
4.2. Bacterial Transformation Plasmid Purification
4.2.1. Preparation of E. coli Competent Cells
4.2.2. Transformation in E. coli Competent Cell
4.2.3. Plasmid Preparation
4.3. Silencing of PD-L1 and KRAS
4.3.1. CRISPR-Cas9 System
4.3.2. Plasmid Transfection
4.4. Analysis of Gene Expression by Quantitative Real-Time Polymerase Chain Reaction (qRT-PCR)
4.5. Cytotoxicity Assay by MTT
4.6. Expression Analysis by Western Blotting
4.7. Migration Assay by Wound-Healing Scratch Assay
4.8. Apoptosis Detection Using Flow Cytometer
4.9. Cell Cycle Analysis Using FUCCI Assay
4.10. Coculture of A549 with Lymphocytes
4.11. Statistical Analysis
5. Conclusions
Author Contributions
Funding
Data Availability Statement
Acknowledgments
Conflicts of Interest
References
- Wu, Y.; Chen, W.; Xu, Z.P.; Gu, W. PD-L1 distribution and perspective for cancer immunotherapy—blockade, knockdown, or inhibition. Front. Immunol. 2019, 10, 2022. [Google Scholar] [CrossRef] [PubMed]
- Yigit, R.; Massuger, L.F.A.G.; Figdor, C.G.; Torensma, R. Ovarian cancer creates a suppressive microenvironment to escape immune elimination. Gynecol. Oncol. 2010, 117, 366–372. [Google Scholar] [CrossRef]
- Salmaninejad, A.; Valilou, S.F.; Shabgah, A.G.; Aslani, S.; Alimardani, M.; Pasdar, A.; Sahebkar, A. PD-1/PD-L1 pathway: Basic biology role in cancer immunotherapy. J. Cell. Physiol. 2019, 234, 16824–16837. [Google Scholar] [CrossRef]
- Han, Y.; Liu, D.; Li, L. PD-1/PD-L1 pathway: Current researches in cancer. Am. J. Cancer Res. 2020, 10, 727. [Google Scholar]
- Alsaab, H.O.; Sau, S.; Alzhrani, R.; Tatiparti, K.; Bhise, K.; Kashaw, S.K.; Iyer, A.K. PD-1 and PD-L1 checkpoint signaling inhibition for cancer immunotherapy: Mechanism, combinations, and clinical outcome. Front. Pharmacol. 2017, 8, 561. [Google Scholar] [CrossRef] [PubMed]
- Robert, C. A decade of immune-checkpoint inhibitors in cancer therapy. Nat. Commun. 2020, 11, 3801. [Google Scholar] [CrossRef]
- Liao, Y.; Chen, L.; Feng, Y.; Shen, J.; Gao, Y.; Cote, G.; Choy, E.; Harmon, D.; Mankin, H.; Hornicek, F.; et al. Targeting programmed cell death ligand 1 by CRISPR/Cas9 in osteosarcoma cells. Oncotarget 2017, 8, 30276. [Google Scholar] [CrossRef] [PubMed]
- Deng, J.; Jiang, W.; Liu, L.; Zhan, W.; Wu, Y.; Xu, X. Research progress on the intrinsic non-immune function of PD-L1 in tumors (Review). Oncol. Lett. 2023, 25, 1–13. [Google Scholar] [CrossRef]
- Tao, L.; Miao, R.; Mekhail, T.; Sun, J.; Meng, L.; Fang, C.; Guan, J.; Jain, A.; Du, Y.; Allen, A.; et al. Prognostic Value of KRAS Mutation Subtypes and PD-L1 Expression in Patients With Lung Adenocarcinoma. Clin. Lung Cancer 2021, 22, e506–e511. [Google Scholar] [CrossRef]
- Heeb, L.V.; Taskoparan, B.; Katsoulas, A.; Beffinger, M.; Clavien, P.-A.; Kobold, S.; Gupta, A.; Vom Berg, J. HDR-based CRISPR/Cas9-mediated Knockout of PD-L1 in C57BL/6 Mice. Bio-protocol 2023, 13, e4724. [Google Scholar] [CrossRef]
- Fierro, J.; DiPasquale, J.; Perez, J.; Chin, B.; Chokpapone, Y.; Tran, A.M.; Holden, A.; Factoriza, C.; Sivagnanakumar, N.; Aguilar, R.; et al. Dual-sgRNA CRISPR/Cas9 knockout of PD-L1 in human U87 glioblastoma tumor cells inhibits proliferation, invasion, and tumor-associated macrophage polarization. Sci. Rep. 2022, 12, 2417. [Google Scholar] [CrossRef] [PubMed]
- Alkaabi, D.; Arafat, K.; Sulaiman, S.; Al-Azawi, A.M.; Attoub, S. PD-1 Independent Role of PD-L1 in Triple-Negative Breast Cancer Progression. Int. J. Mol. Sci. 2023, 24, 6420. [Google Scholar] [CrossRef] [PubMed]
- Mehta, A.; Dalle Vedove, E.; Isert, L.; Merkel, O.M. Targeting KRAS Mutant Lung Cancer Cells with siRNA-Loaded Bovine Serum Albumin Nanoparticles. Pharm. Res. 2019, 36, 1–13. [Google Scholar] [CrossRef] [PubMed]
- Shepherd, F.A.; Domerg, C.; Hainaut, P.; Jänne, P.A.; Pignon, J.-P.; Graziano, S.; Douillard, J.Y.; Brambilla, E.; Le Chevalier, T.; Seymour, L.; et al. Pooled Analysis of the Prognostic and Predictive Effects of KRAS Mutation Status and KRAS Mutation Subtype in Early-Stage Resected Non-Small-Cell Lung Cancer in Four Trials of Adjuvant Chemotherapy. J. Clin. Oncol. 2013, 31, 2173–2181. [Google Scholar] [CrossRef] [PubMed]
- Chen, N.; Fang, W.; Lin, Z.; Peng, P.; Wang, J.; Zhan, J.; Hong, S.; Huang, J.; Liu, L.; Sheng, J.; et al. KRAS mutation-induced upregulation of PD-L1 mediates immune escape in human lung adenocarcinoma. Cancer Immunol. Immunother. 2017, 66, 1175–1187. [Google Scholar] [CrossRef] [PubMed]
- Zhao, D.; Wang, L.; Chen, Z.; Zhang, L.; Xu, L. KRAS is a prognostic biomarker associated with diagnosis and treatment in multiple cancers. Front. Genet. 2022, 13, 1024920. [Google Scholar] [CrossRef] [PubMed]
- Ghosh, S.; Nataraj, N.B.; Noronha, A.; Patkar, S.; Sekar, A.; Mukherjee, S.; Winograd-Katz, S.; Kramarski, L.; Verma, A.; Lindzen, M.; et al. PD-L1 recruits phospholipase C and enhances tumorigenicity of lung tumors harboring mutant forms of EGFR. Cell Rep. 2021, 35, 109181. [Google Scholar] [CrossRef] [PubMed]
- Hamamoto, J.; Yasuda, H.; Aizawa, K.; Nishino, M.; Nukaga, S.; Hirano, T.; Kawada, I.; Naoki, K.; Betsuyaku, T.; Soejima, K. Non-small cell lung cancer PC-9 cells exhibit increased sensitivity to gemcitabine and vinorelbine upon acquiring resistance to EGFR-tyrosine kinase inhibitors. Oncol. Lett. 2017, 14, 3559–3565. [Google Scholar] [CrossRef] [PubMed]
- Skoulidis, F.; Goldberg, M.E.; Greenawalt, D.M.; Hellmann, M.D.; Awad, M.M.; Gainor, J.F.; Schrock, A.B.; Hartmaier, R.J.; Trabucco, S.E.; Gay, L.; et al. STK11/LKB1 mutations and PD-1 inhibitor resistance in KRAS-mutant lung adenocarcinoma. Cancer Discov. 2018, 8, 822–835. [Google Scholar] [CrossRef]
- Xu, Y.; Chen, C.; Guo, Y.; Hu, S.; Sun, Z. Effect of CRISPR/Cas9-Edited PD-1/PD-L1 on Tumor Immunity and Immunotherapy. Front. Immunol. 2022, 13, 848327. [Google Scholar] [CrossRef]
- Hu, H.; Cheng, R.; Wang, Y.; Wang, X.; Wu, J.; Kong, Y.; Zhan, S.; Zhou, Z.; Zhu, H.; Yu, R.; et al. Oncogenic KRAS signaling drives evasion of innate immune surveillance in lung adenocarcinoma by activating CD. J. Clin. Investig. 2023, 133, e153470. [Google Scholar] [CrossRef] [PubMed]
- Li, J.; Cao, P.; Chen, Y.; Wang, J.; Sun, X.; Chen, R.; Wang, G.; Hou, J. Anlotinib combined with the PD-L1 blockade exerts the potent anti-tumor immunity in renal cancer treatment. Exp. Cell Res. 2022, 417, 113197. [Google Scholar] [CrossRef] [PubMed]
- Jiang, H.; Liao, J.; Wang, L.; Jin, C.; Mo, J.; Xiang, S. The multikinase inhibitor axitinib in the treatment of advanced hepatocellular carcinoma: The current clinical applications and the molecular mechanisms. Front. Immunol. 2023, 14, 1163967. [Google Scholar] [CrossRef] [PubMed]
- Liu, C.; Zheng, S.; Wang, Z.; Wang, S.; Wang, X.; Yang, L.; Xu, H.; Cao, Z.; Feng, X.; Xue, Q.; et al. KRAS-G12D mutation drives immune suppression and the primary resistance of anti-PD-1/PD-L1 immunotherapy in non-small cell lung cancer. Cancer Commun. 2022, 42, 828–847. [Google Scholar] [CrossRef] [PubMed]
- Coelho, M.A.; de Carné Trécesson, S.; Rana, S.; Zecchin, D.; Moore, C.; Molina-Arcas, M.; East, P.; Spencer-Dene, B.; Nye, E.; Barnouin, K.; et al. Oncogenic RAS Signaling Promotes Tumor Immunoresistance by Stabilizing PD-L1 mRNA. Immunity 2017, 47, 1083–1099. [Google Scholar] [CrossRef] [PubMed]
- Strober, W. Trypan blue exclusion test of cell viability. Curr. Protoc. Immunol. 2001, 21. [Google Scholar] [CrossRef]
- Tomoiaga, D.; Bubnell, J.; Herndon, L.; Feinstein, P. High rates of plasmid cotransformation in E. coli overturn the clonality myth and reveal colony development. Sci. Rep. 2022, 12, 11515. [Google Scholar] [PubMed]
- El-Wakil, M.H.; Khattab, S.N.; El-Yazbi, A.F.; El-Nikhely, N.; Soffar, A.; Khalil, H.H. New chalcone-tethered 1,3,5-triazines potentiate the anticancer effect of cisplatin against human lung adenocarcinoma A549 cells by enhancing DNA damage and cell apoptosis. Bioorg. Chem. 2020, 105, 104393. [Google Scholar] [CrossRef] [PubMed]
- Xie, C.; Zhou, X.; Liang, C.; Li, X.; Ge, M.; Chen, Y.; Yin, J.; Zhu, J.; Zhong, C. Apatinib triggers autophagic and apoptotic cell death via VEGFR2/STAT3/PD-L1 and ROS/Nrf2/p62 signaling in lung cancer. J. Exp. Clin. Cancer Res. 2021, 40, 266. [Google Scholar] [CrossRef]
- Lakshmanan, I.; Batra, S. Protocol for Apoptosis Assay by Flow Cytometry Using Annexin V Staining Method. Bio-protocol 2013, 3, e374. [Google Scholar] [CrossRef]
- Sladitschek, H.L.; Neveu, P.A. MXS-chaining: A highly efficient cloning platform for imaging and flow cytometry approaches in mammalian systems. PLoS ONE. 2015, 10, e0124958. [Google Scholar] [CrossRef] [PubMed]
- Salazar, Y.; Zheng, X.; Brunn, D.; Raifer, H.; Picard, F.; Zhang, Y.; Winter, H.; Guenther, S.; Weigert, A.; Weigmann, B.; et al. Microenvironmental Th9 and Th17 lymphocytes induce metastatic spreading in lung cancer. J. Clin. Investig. 2020, 130, 3560–3575. [Google Scholar] [CrossRef] [PubMed]


Disclaimer/Publisher’s Note: The statements, opinions and data contained in all publications are solely those of the individual author(s) and contributor(s) and not of MDPI and/or the editor(s). MDPI and/or the editor(s) disclaim responsibility for any injury to people or property resulting from any ideas, methods, instructions or products referred to in the content. |
© 2024 by the authors. Licensee MDPI, Basel, Switzerland. This article is an open access article distributed under the terms and conditions of the Creative Commons Attribution (CC BY) license (https://creativecommons.org/licenses/by/4.0/).
Share and Cite
Abounar, S.A.; El-Nikhely, N.A.; Turkowski, K.; Savai, R.; Saeed, H. CRISPR/Cas-Mediated Knockdown of PD-L1 and KRAS in Lung Cancer Cells. Int. J. Mol. Sci. 2024, 25, 9086. https://doi.org/10.3390/ijms25169086
Abounar SA, El-Nikhely NA, Turkowski K, Savai R, Saeed H. CRISPR/Cas-Mediated Knockdown of PD-L1 and KRAS in Lung Cancer Cells. International Journal of Molecular Sciences. 2024; 25(16):9086. https://doi.org/10.3390/ijms25169086
Chicago/Turabian StyleAbounar, Summer A., Nefertiti A. El-Nikhely, Kati Turkowski, Rajkumar Savai, and Hesham Saeed. 2024. "CRISPR/Cas-Mediated Knockdown of PD-L1 and KRAS in Lung Cancer Cells" International Journal of Molecular Sciences 25, no. 16: 9086. https://doi.org/10.3390/ijms25169086
APA StyleAbounar, S. A., El-Nikhely, N. A., Turkowski, K., Savai, R., & Saeed, H. (2024). CRISPR/Cas-Mediated Knockdown of PD-L1 and KRAS in Lung Cancer Cells. International Journal of Molecular Sciences, 25(16), 9086. https://doi.org/10.3390/ijms25169086