
Inflammation and Fibrosis in Progeria: Organ-Specific Responses in an HGPS Mouse Model
 , , ,
, , ,
Abstract
:1. Introduction
2. Results
2.1. Skin
2.2. Aorta
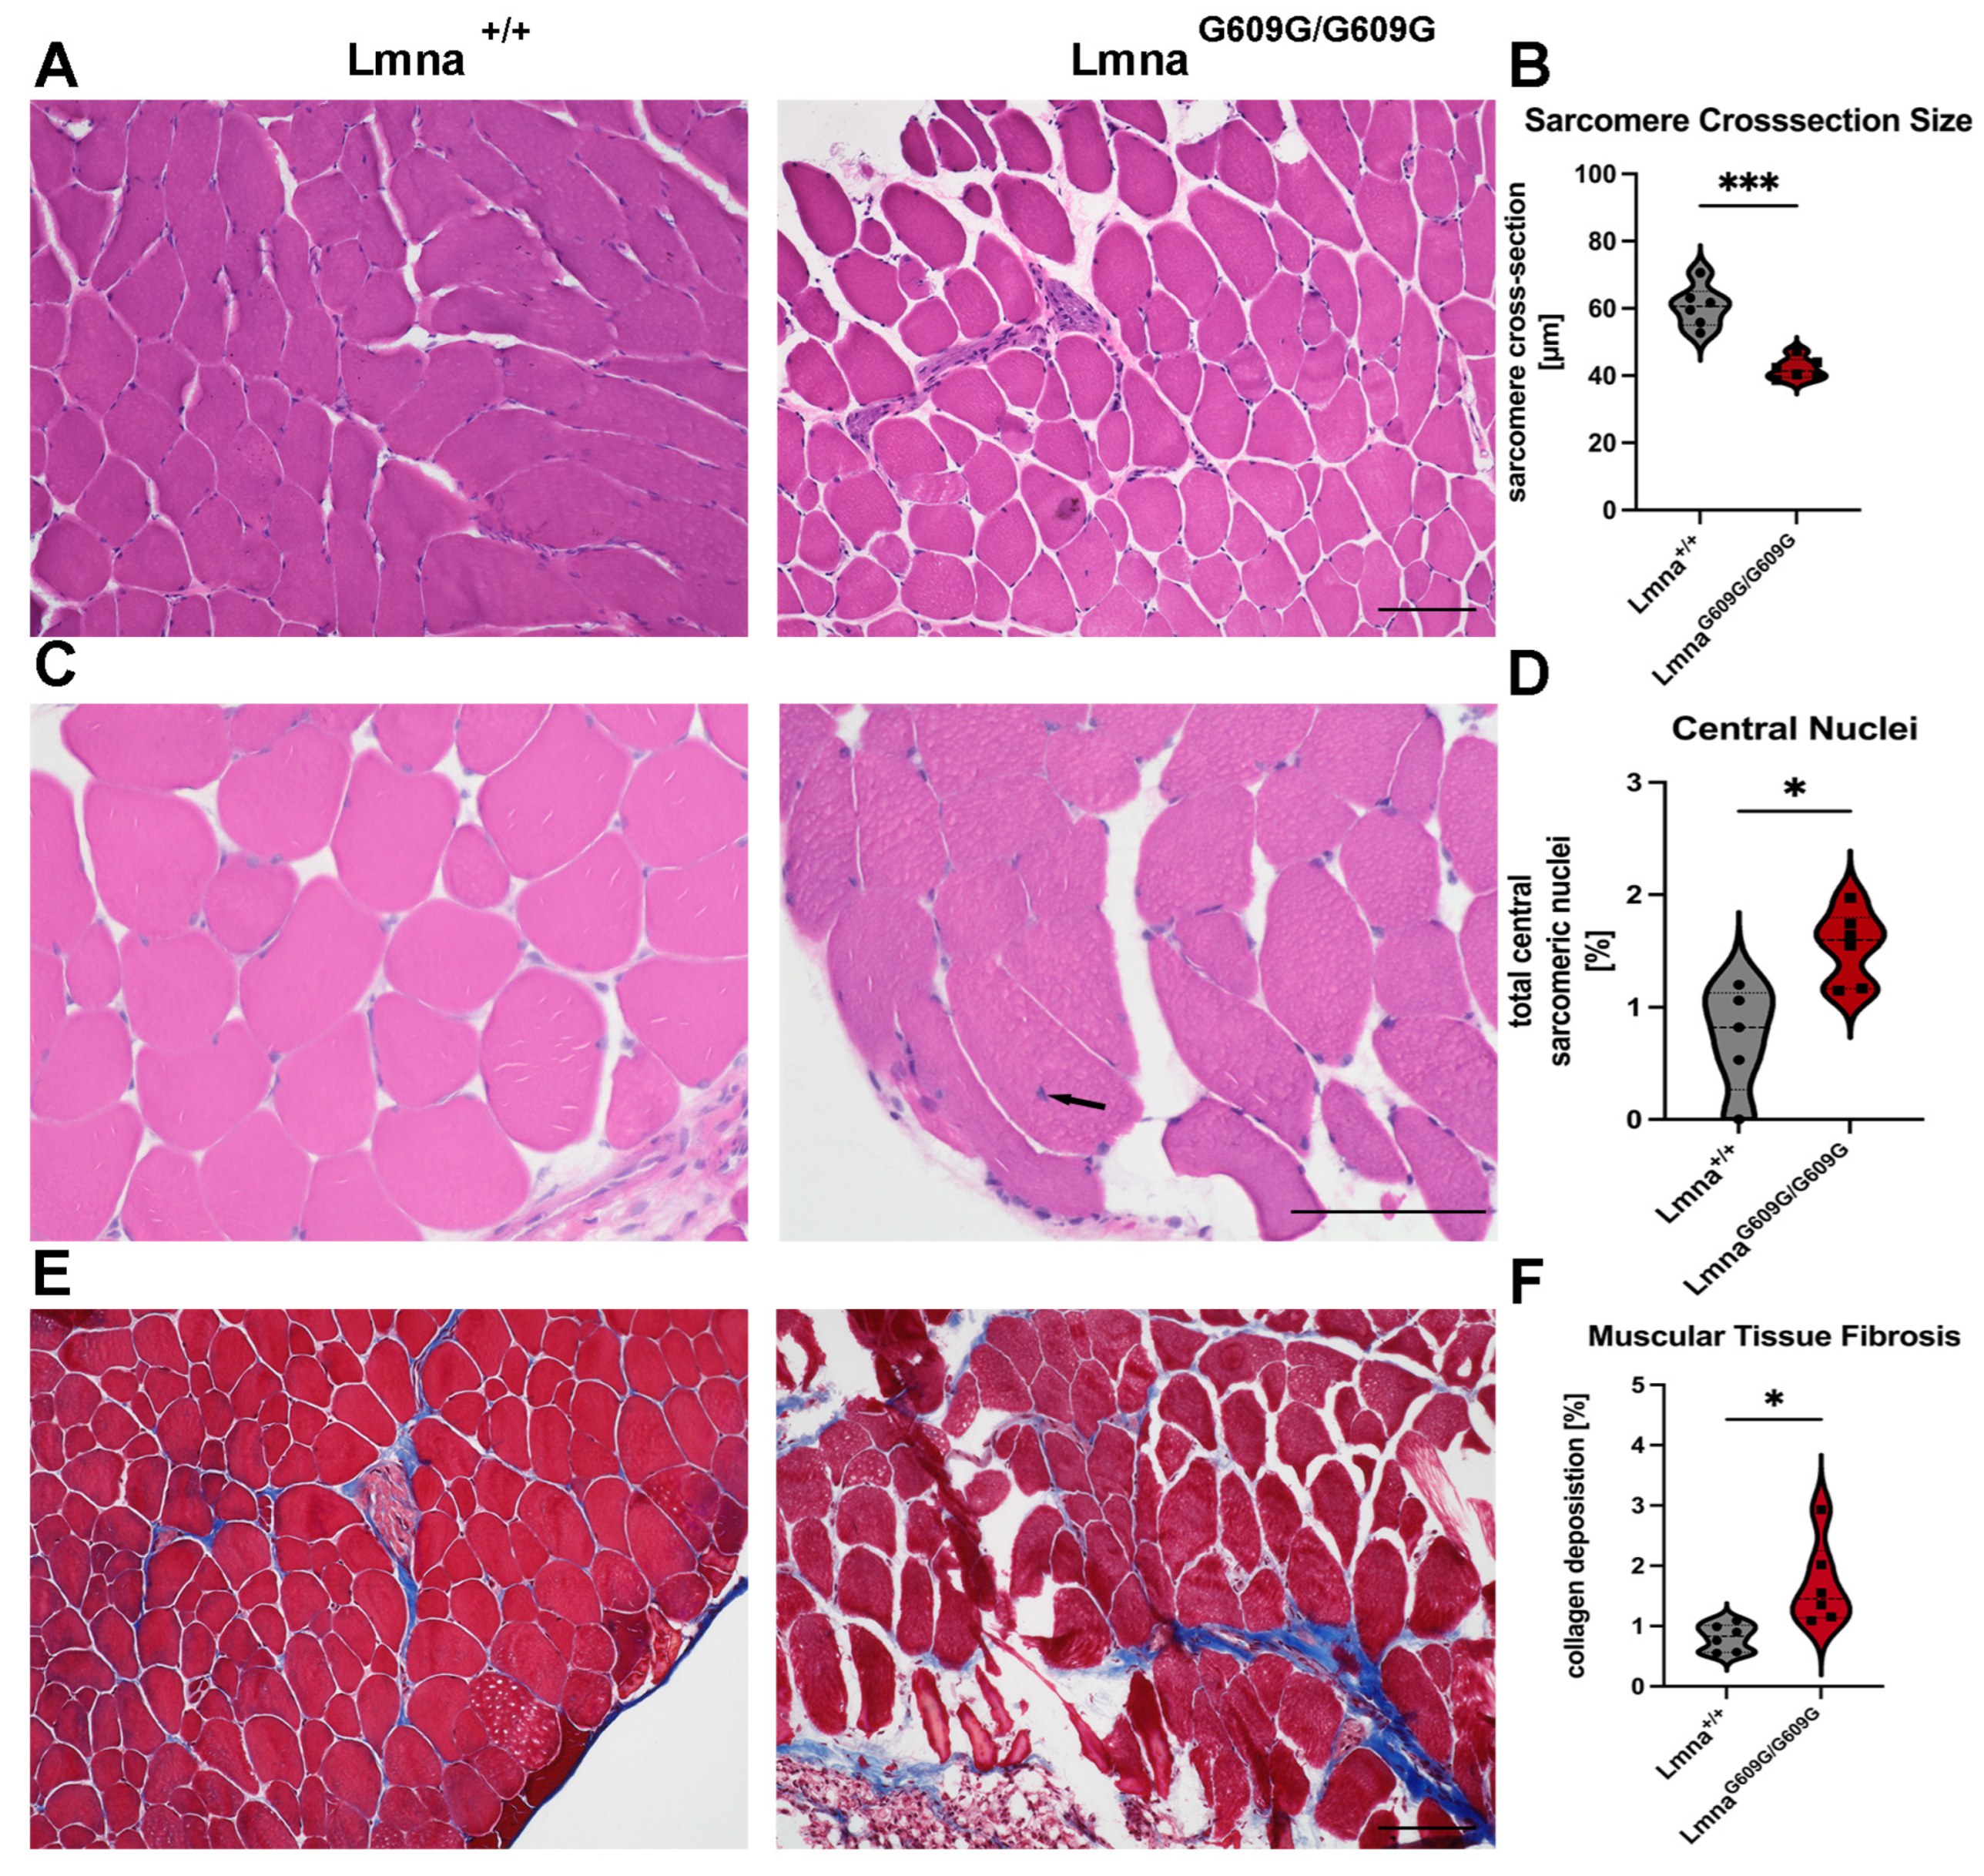
2.3. Muscle
2.4. Lung
2.5. Liver
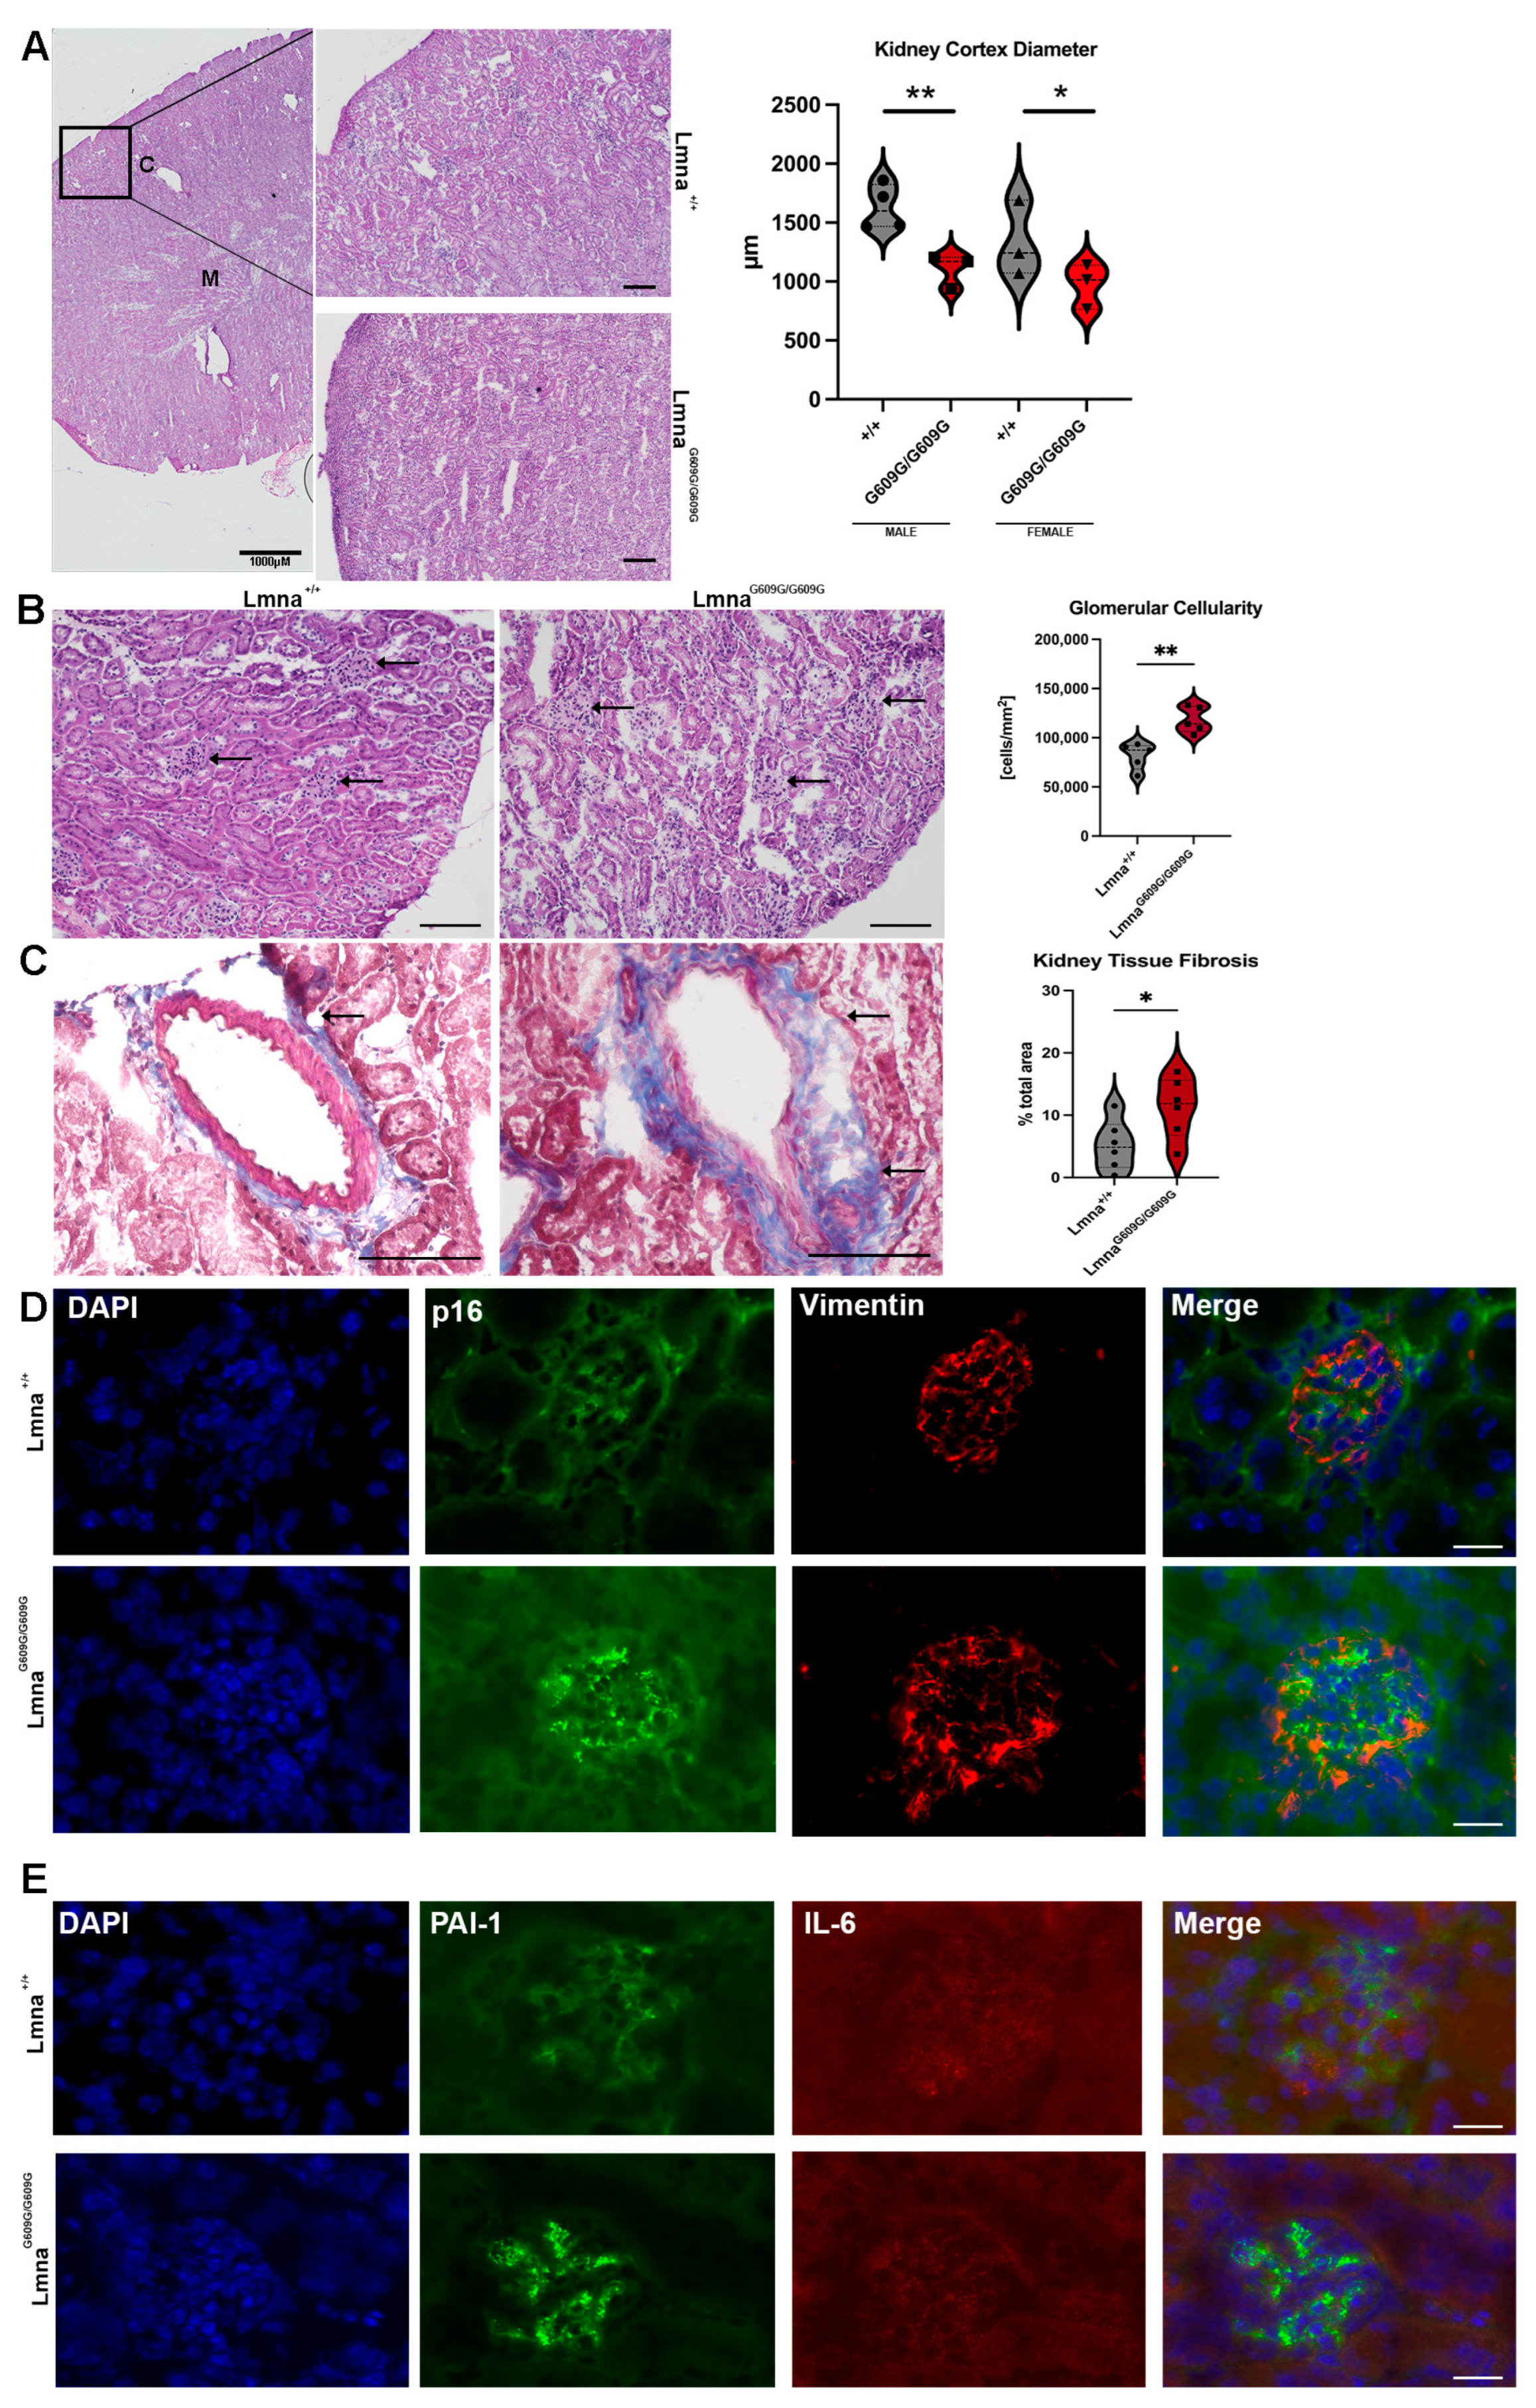
2.6. Kidney
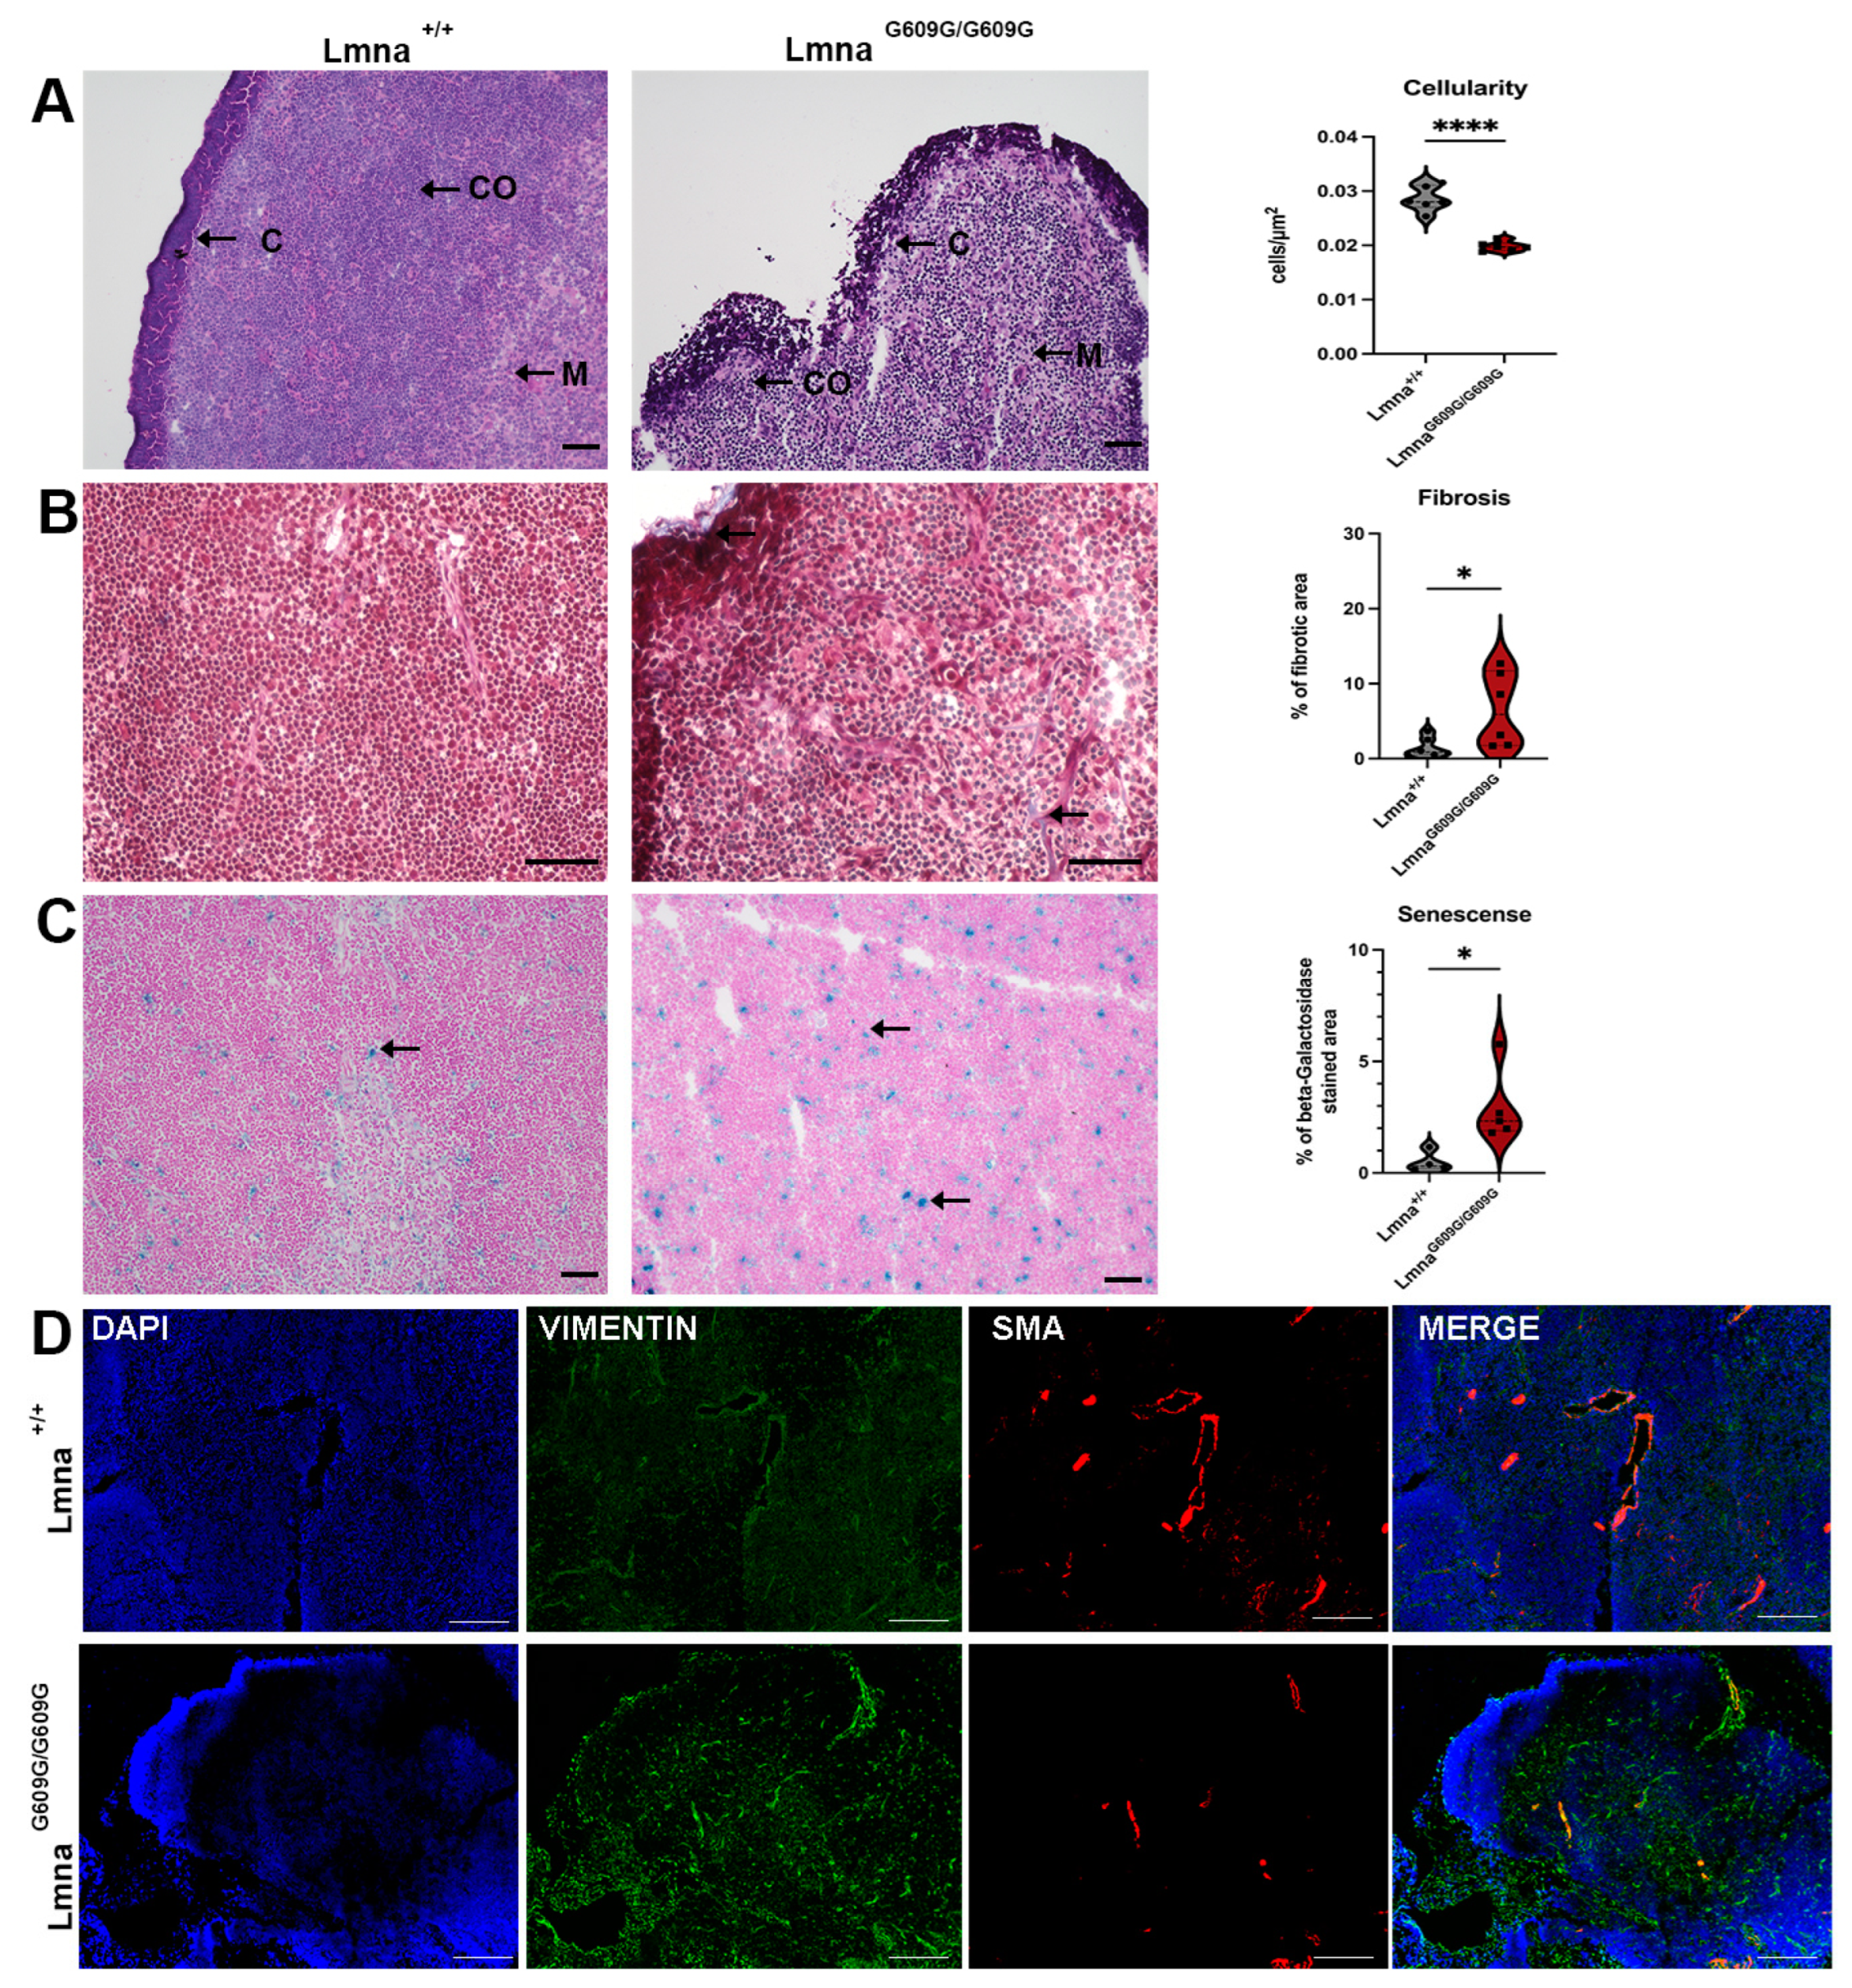
2.7. Spleen
2.8. Thymus
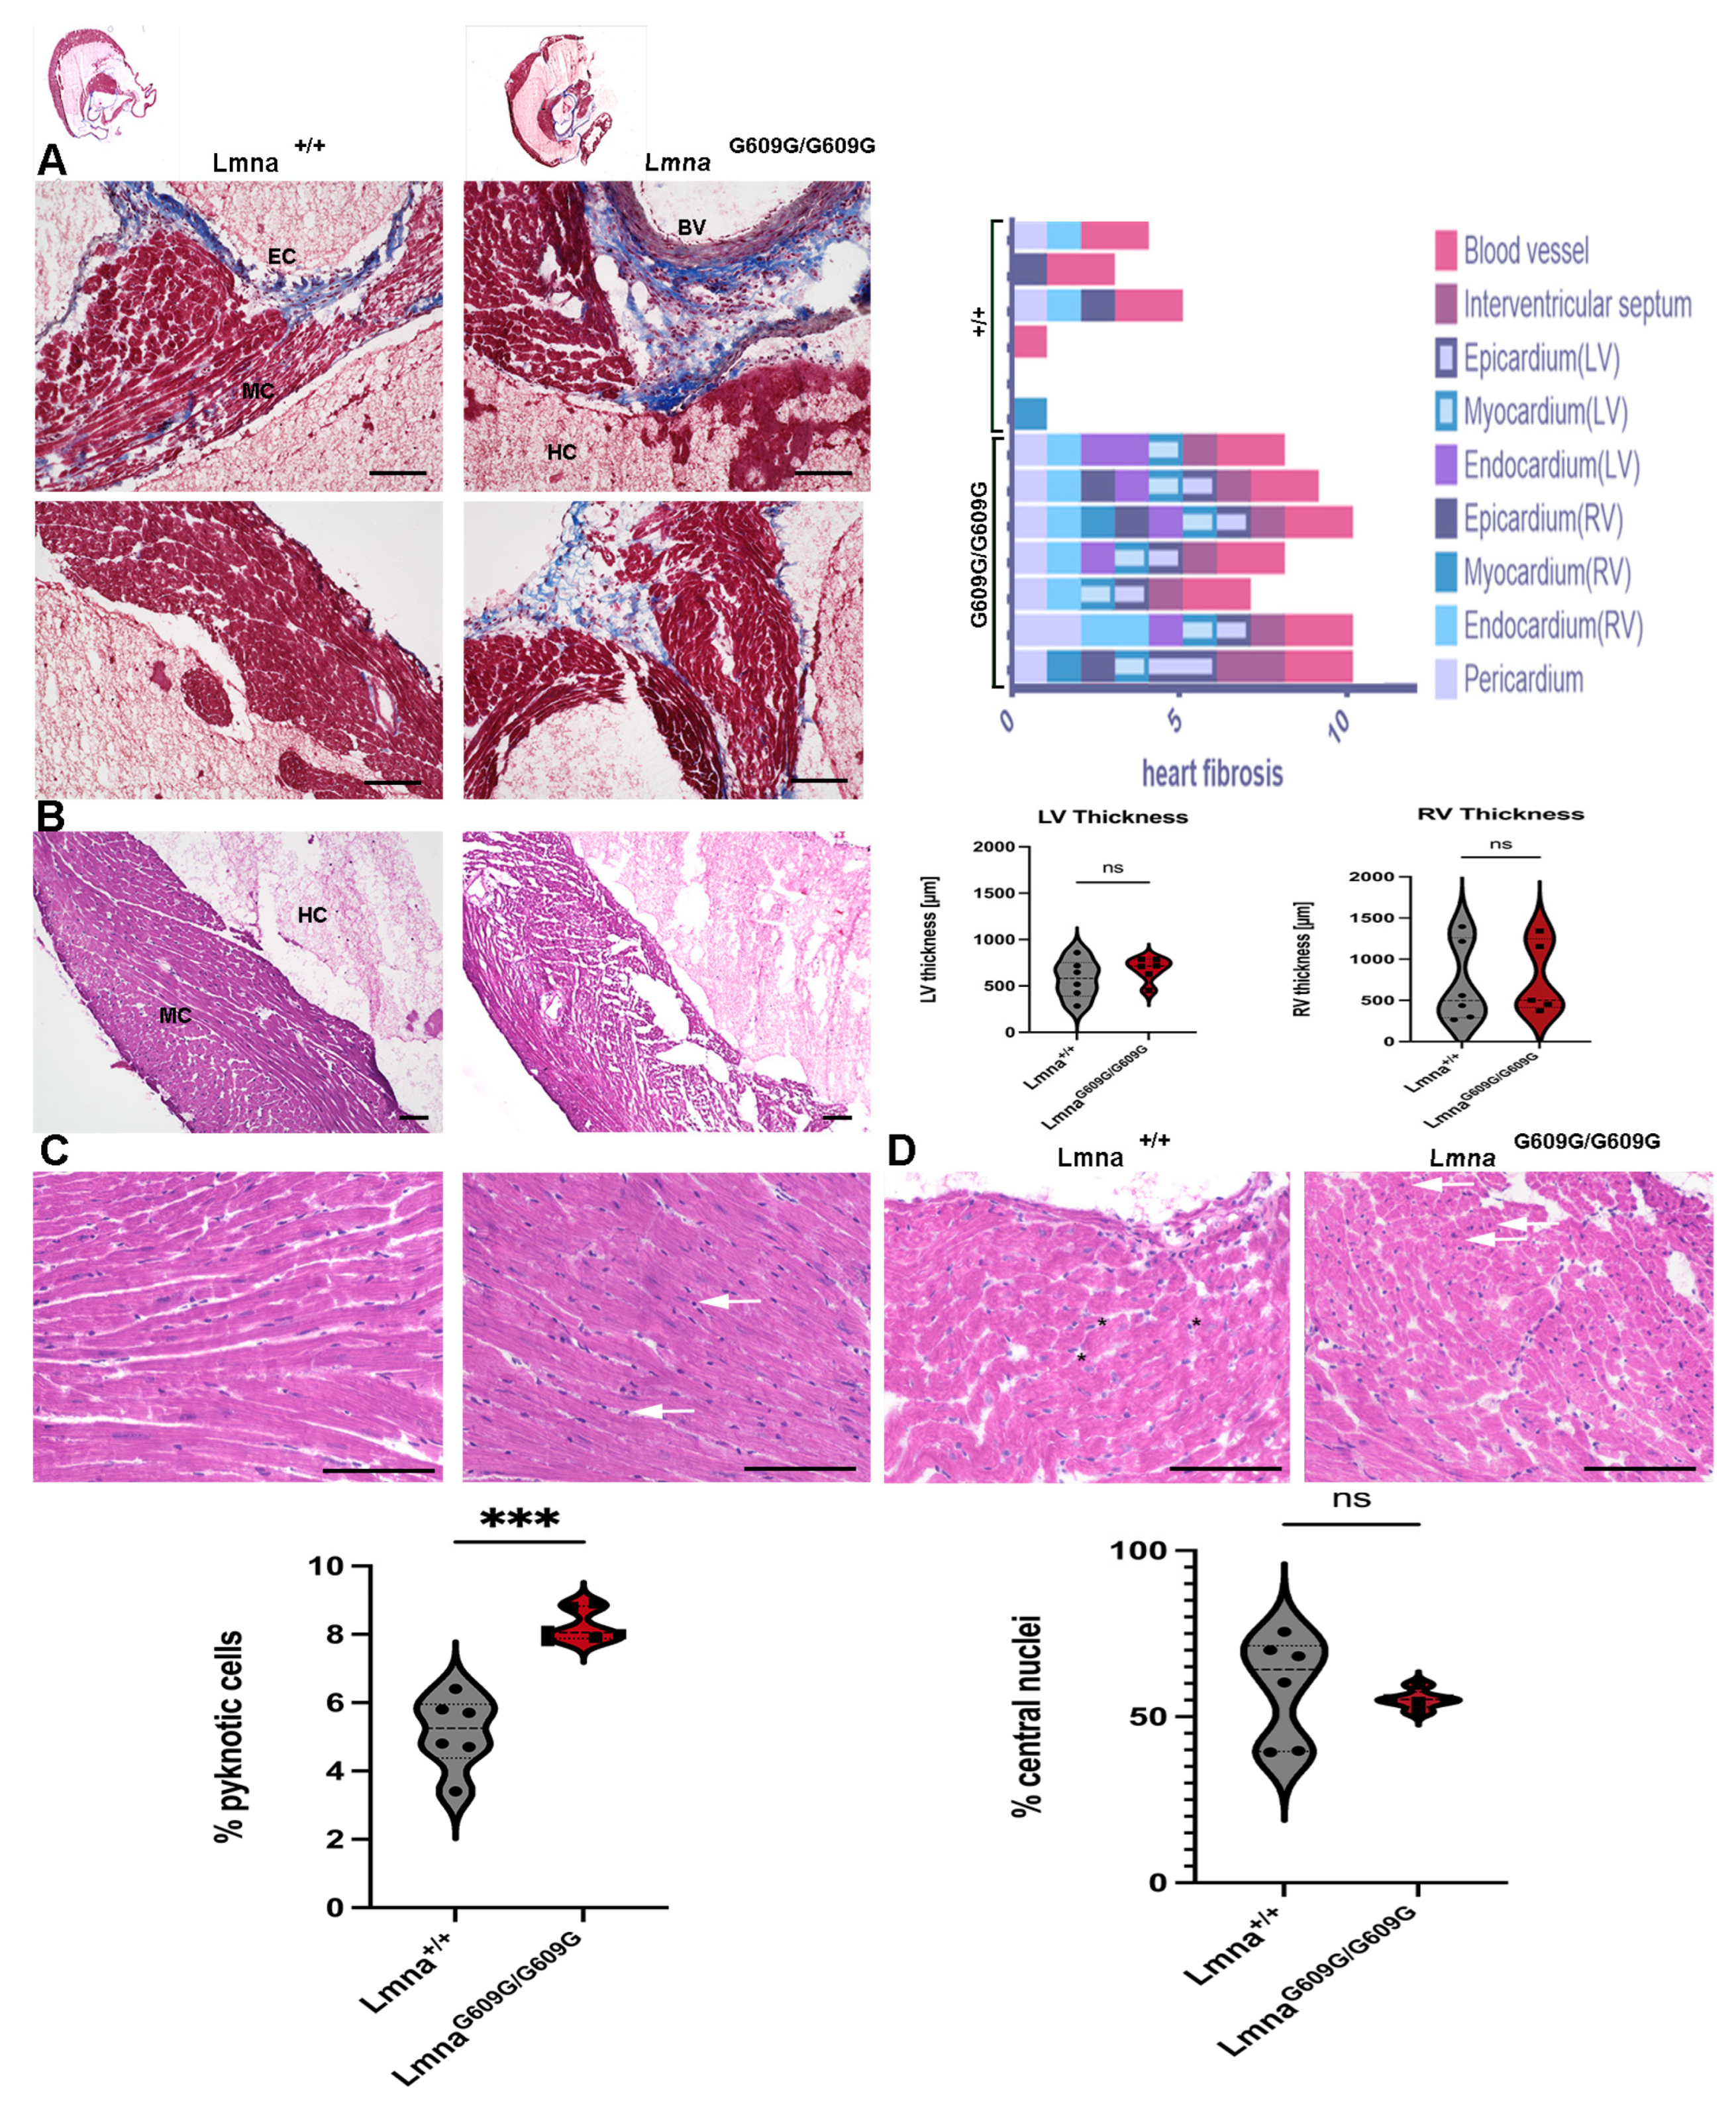
2.9. Heart
3. Discussion
4. Materials and Methods
4.1. Mouse Model and Breeding
4.2. Genotyping
4.3. Mouse Organ Harvest and Sample Preparation
4.4. Histological Staining
4.5. Immunofluorescent Staining
4.6. Western Blot Analysis
4.7. Statistical Analysis
Supplementary Materials
Author Contributions
Funding
Institutional Review Board Statement
Informed Consent Statement
Data Availability Statement
Conflicts of Interest
References
- Hutchinson, J. Congenital Absence of Hair and Mammary Glands with Atrophic Condition of the Skin and its Appendages in a Boy Whose Mother Had Been Almost Wholly Bald from Alopecia Areata from the Age of Six. J. R. Soc. Med. 1886, 69, 473–477. [Google Scholar] [CrossRef] [PubMed]
- Hisama, F.M.; Oshima, J. Ateleiosis and progeria: Continuous youth and premature old age. Br. Med. J. 1904, 2, 914–918. [Google Scholar]
- Chawla, V.; Tawodzera, P.B.; Chukwu, J.N. Progeria: Report of two cases and literature review. East Afr. Med. J. 1986, 63, 749–755. [Google Scholar]
- Badame, A.J. Progeria. Arch. Dermatol. 1989, 125, 540–544. [Google Scholar] [CrossRef] [PubMed]
- Rodrigues, G.H.d.P.; Tâmega, I.d.E.; Duque, G.; Neto, V.S.D. Severe bone changes in a case of Hutchinson–Gilford syndrome. Ann. De Génétique 2002, 45, 151–155. [Google Scholar] [CrossRef]
- Dhillon, S. Lonafarnib: First Approval. Drugs 2021, 81, 283–289. [Google Scholar] [CrossRef]
- De Sandre-Giovannoli, A.; Bernard, R.; Cau, P.; Navarro, C.; Amiel, J.; Boccaccio, I.; Lyonnet, S.; Stewart, C.L.; Munnich, A.; Le Merrer, M.; et al. Lamin a truncation in Hutchinson-Gilford progeria. Science 2003, 300, 2055. [Google Scholar] [CrossRef]
- Gordon, L.B.; Rothman, F.G.; López-Otín, C.; Misteli, T. Progeria: A Paradigm for Translational Medicine. Cell 2014, 156, 400–407. [Google Scholar] [CrossRef]
- Eriksson, M.; Brown, W.T.; Gordon, L.B.; Glynn, M.W.; Singer, J.; Scott, L.; Erdos, M.R.; Robbins, C.M.; Moses, T.Y.; Berglund; et al. Recurrent de novo point mutations in lamin A cause Hutchinson–Gilford progeria syndrome. Nature 2003, 423, 293–298. [Google Scholar] [CrossRef]
- Sinensky, M.; Fantle, K.; Trujillo, M.; McLain, T.; Kupfer, A.; Dalton, M. The processing pathway of prelamin a. J. Cell Sci. 1994, 107, 61–67. [Google Scholar] [CrossRef]
- Ahn, J.; Jeong, S.; Kang, S.-M.; Jo, I.; Park, B.-J.; Ha, N.-C. Crystal structure of progeria mutant S143F lamin A/C reveals increased hydrophobicity driving nuclear deformation. Commun. Biol. 2022, 5, 267. [Google Scholar] [CrossRef]
- Young, S.G.; Fong, L.G.; Michaelis, S. Prelamin A, Zmpste24, misshapen cell nuclei, and progeria--new evidence suggesting that protein farnesylation could be important for disease pathogenesis. J. Lipid Res. 2005, 46, 2531–2558. [Google Scholar] [CrossRef]
- Gordon, L.B.; Brown, W.T.; Collins, F.S. Hutchinson-Gilford Progeria Syndrome, in GeneReviews(®); Adam, M.P., Feldman, J., Mirzaa, G.M., Pagon, R.A., Wallace, S.E., Bean, L.J.H., Gripp, K.W., Amemiya, A., Eds.; University of Washington: Seattle, WA, USA, 1993. [Google Scholar]
- Goldman, R.D.; Shumaker, D.K.; Erdos, M.R.; Eriksson, M.; Goldman, A.E.; Gordon, L.B.; Gruenbaum, Y.; Khuon, S.; Mendez, M.; Varga, R.; et al. Accumulation of mutant lamin A causes progressive changes in nuclear architecture in Hutchinson–Gilford progeria syndrome. Proc. Natl. Acad. Sci. USA 2004, 101, 8963–8968. [Google Scholar] [CrossRef] [PubMed]
- Paradisi, M.; McClintock, D.; Boguslavsky, R.L.; Pedicelli, C.; Worman, H.J.; Dermal, K.D. fibroblasts in Hutchinson-Gilford progeria syndrome with the lamin A G608G mutation have dysmorphic nuclei and are hypersensitive to heat stress. BMC Cell Biol. 2005, 6, 27. [Google Scholar] [CrossRef] [PubMed]
- Dorado, B.; Andrés, V. A-type lamins and cardiovascular disease in premature aging syndromes. Curr. Opin. Cell Biol. 2017, 46, 17–25. [Google Scholar] [CrossRef]
- Dorado, B.; Pløen, G.G.; Barettino, A.; Macías, A.; Gonzalo, P.; Andrés-Manzano, M.J.; González-Gómez, C.; Galán-Arriola, C.; Alfonso, J.M.; Lobo, M.; et al. Generation and characterization of a novel knockin minipig model of Hutchinson-Gilford progeria syndrome. Cell Discov. 2019, 5, 16. [Google Scholar] [CrossRef] [PubMed]
- Wang, F.; Zhang, W.; Yang, Q.; Kang, Y.; Fan, Y.; Wei, J.; Liu, Z.; Dai, S.; Li, H.; Li, Z.; et al. Generation of a Hutchinson–Gilford progeria syndrome monkey model by base editing. Protein Cell 2020, 11, 809–824. [Google Scholar] [CrossRef]
- Crasto, S.; Di Pasquale, E. Induced Pluripotent Stem Cells to Study Mechanisms of Laminopathies: Focus on Epigenetics. Front. Cell Dev. Biol. 2018, 6, 172. [Google Scholar] [CrossRef] [PubMed]
- Zhang, H.; Kieckhaefer, J.E.; Cao, K. Mouse models of laminopathies. Aging Cell 2012, 12, 2–10. [Google Scholar] [CrossRef]
- Zaghini, A.; Sarli, G.; Barboni, C.; Sanapo, M.; Pellegrino, V.; Diana, A.; Linta, N.; Rambaldi, J.; Rosaria, D.M.; Murdocca, M.; et al. Long term breeding of the Lmna G609G progeric mouse: Characterization of homozygous and heterozygous models. Exp. Gerontol. 2020, 130, 110784. [Google Scholar] [CrossRef]
- Osorio, F.G.; Navarro, C.L.; Cadiñanos, J.; López-Mejía, I.C.; Quirós, P.M.; Bartoli, C.; Rivera, J.; Tazi, J.; Guzmán, G.; Varela, I.; et al. Splicing-Directed Therapy in a New Mouse Model of Human Accelerated Aging. Sci. Transl. Med. 2011, 3, 106ra107. [Google Scholar] [CrossRef] [PubMed]
- Villa-Bellosta, R.; Rivera-Torres, J.; Osorio, F.G.; Acín-Pérez, R.; Enriquez, J.A.; López-Otín, C.; Andrés, V. Defective Extracellular Pyrophosphate Metabolism Promotes Vascular Calcification in a Mouse Model of Hutchinson-Gilford Progeria Syndrome That Is Ameliorated on Pyrophosphate Treatment. Circulation 2013, 127, 2442–2451. [Google Scholar] [CrossRef] [PubMed]
- Xu, Q.; Mojiri, A.; Boulahouache, L.; Morales, E.; Walther, B.K.; Cooke, J.P. Vascular senescence in progeria: Role of endothelial dysfunction. Eur. Hear. J. Open 2022, 2, oeac047. [Google Scholar] [CrossRef]
- Varga, R.; Eriksson, M.; Erdos, M.R.; Olive, M.; Harten, I.; Kolodgie, F.; Capell, B.C.; Cheng, J.; Faddah, D.; Perkins, S.; et al. Progressive vascular smooth muscle cell defects in a mouse model of Hutchinson–Gilford progeria syndrome. Proc. Natl. Acad. Sci. USA 2006, 103, 3250–3255. [Google Scholar] [CrossRef] [PubMed]
- Sánchez-López, A.; Espinós-Estévez, C.; González-Gómez, C.; Gonzalo, P.; Andrés-Manzano, M.J.; Fanjul, V.; Riquelme-Borja, R.; Hamczyk, M.R.; Macías, Á.; del Campo, L.; et al. Cardiovascular Progerin Suppression and Lamin A Restoration Rescue Hutchinson-Gilford Progeria Syndrome. Circulation 2021, 144, 1777–1794. [Google Scholar] [CrossRef]
- Hamczyk, M.R.; Villa-Bellosta, R.; Gonzalo, P.; Andrés-Manzano, M.J.; Nogales, P.; Bentzon, J.F.; López-Otín, C.; Andrés, V. Vascular Smooth Muscle–Specific Progerin Expression Accelerates Atherosclerosis and Death in a Mouse Model of Hutchinson-Gilford Progeria Syndrome. Circulation 2018, 138, 266–282. [Google Scholar] [CrossRef]
- Benedicto, I.; Dorado, B.; Andrés, V. Molecular and Cellular Mechanisms Driving Cardiovascular Disease in Hutchinson-Gilford Progeria Syndrome: Lessons Learned from Animal Models. Cells 2021, 10, 1157. [Google Scholar] [CrossRef]
- Rivera-Torres, J.; Acín-Perez, R.; Cabezas-Sánchez, P.; Osorio, F.G.; Gonzalez-Gómez, C.; Megias, D.; Cámara, C.; López-Otín, C.; Enríquez, J.A.; Luque-García, J.L.; et al. Identification of mitochondrial dysfunction in Hutchinson–Gilford progeria syndrome through use of stable isotope labeling with amino acids in cell culture. J. Proteom. 2013, 91, 466–477. [Google Scholar] [CrossRef]
- Brayson, D.; Shanahan, C.M. Current insights into LMNA cardiomyopathies: Existing models and missing LINCs. Nucleus 2017, 8, 17–33. [Google Scholar] [CrossRef]
- Olive, M.; Harten, I.; Mitchell, R.; Beers, J.K.; Djabali, K.; Cao, K.; Erdos, M.R.; Blair, C.; Funke, B.; Smoot, L.; et al. Cardiovascular Pathology in Hutchinson-Gilford Progeria: Correlation with the Vascular Pathology of Aging. Arter. Thromb. Vasc. Biol. 2010, 30, 2301–2309. [Google Scholar] [CrossRef]
- Osorio, F.G.; Bárcena, C.; Soria-Valles, C.; Ramsay, A.J.; de Carlos, F.; Cobo, J.; Fueyo, A.; Freije, J.M.P.; López-Otín, C. Nuclear lamina defects cause ATM-dependent NF-κB activation and link accelerated aging to a systemic inflammatory response. Genes Dev. 2012, 26, 2311–2324. [Google Scholar] [CrossRef] [PubMed]
- Campisi, J. Aging, cellular senescence, and cancer. Annu. Rev. Physiol. 2013, 75, 685–705. [Google Scholar] [CrossRef]
- Squarzoni, S.; Schena, E.; Sabatelli, P.; Mattioli, E.; Capanni, C.; Cenni, V.; D’Apice, M.R.; Andrenacci, D.; Sarli, G.; Pellegrino, V.; et al. Interleukin-6 neutralization ameliorates symptoms in prematurely aged mice. Aging Cell 2021, 20, e13285. [Google Scholar] [CrossRef]
- Santos, G.D.; Rogel, M.R.; Baker, M.A.; Troken, J.R.; Urich, D.; Morales-Nebreda, L.; Sennello, J.A.; Kutuzov, M.A.; Sitikov, A.; Davis, J.M.; et al. Vimentin regulates activation of the NLRP3 inflammasome. Nat. Commun. 2015, 6, 6574. [Google Scholar] [CrossRef] [PubMed]
- Hamczyk, M.R.; Andrés, V. Accelerated atherosclerosis in HGPS. Aging 2018, 10, 2555–2556. [Google Scholar] [CrossRef] [PubMed]
- Ghosh, A.K.; Vaughan, D.E. PAI-1 in tissue fibrosis. J. Cell Physiol. 2012, 227, 493–507. [Google Scholar] [CrossRef]
- Anantharaju, A.; Feller, A.; Chedid, A. Aging Liver: A Review. Gerontology 2002, 48, 343–353. [Google Scholar] [CrossRef]
- Ishak, K.; Baptista, A.; Bianchi, L.; Callea, F.; De Groote, J.; Gudat, F.; Denk, H.; Desmet, V.; Korb, G.; MacSween, R.N.; et al. Histological grading and staging of chronic hepatitis. J. Hepatol. 1995, 22, 696–699. [Google Scholar] [CrossRef]
- Bidault, G.; Garcia, M.; Capeau, J.; Morichon, R.; Vigouroux, C.; Béréziat, V. Progerin Expression Induces Inflammation, Oxidative Stress and Senescence in Human Coronary Endothelial Cells. Cells 2020, 9, 1201. [Google Scholar] [CrossRef]
- Catarinella, G.; Nicoletti, C.; Bracaglia, A.; Procopio, P.; Salvatori, I.; Taggi, M.; Valle, C.; Ferri, A.; Canipari, R.; Puri, P.L.; et al. SerpinE1 drives a cell-autonomous pathogenic signaling in Hutchinson–Gilford progeria syndrome. Cell Death Dis. 2022, 13, 737. [Google Scholar] [CrossRef]
- Dallaway, A.; Kite, C.; Griffen, C.; Duncan, M.; Tallis, J.; Renshaw, D.; Hattersley, J. Age-related degeneration of the lumbar paravertebral muscles: Systematic review and three-level meta-regression. Exp. Gerontol. 2020, 133, 110856. [Google Scholar] [CrossRef]
- Madaro, L.; Bouché, M. From innate to adaptive immune response in muscular dystrophies and skeletal muscle regeneration: The role of lymphocytes. BioMed Res. Int. 2014, 2014, 438675. [Google Scholar] [CrossRef] [PubMed]
- Dalle, S.; Rossmeislova, L.; Koppo, K. The Role of Inflammation in Age-Related Sarcopenia. Front. Physiol. 2017, 8, 1045. [Google Scholar] [CrossRef]
- Parimon, T.; Hohmann, M.S.; Yao, C. Cellular Senescence: Pathogenic Mechanisms in Lung Fibrosis. Int. J. Mol. Sci. 2021, 22, 6214. [Google Scholar] [CrossRef]
- Watt, M.J.; Miotto, P.M.; De Nardo, W.; Montgomery, M.K. The Liver as an Endocrine Organ—Linking NAFLD and Insulin Resistance. Endocr. Rev. 2019, 40, 1367–1393. [Google Scholar] [CrossRef]
- Rhyu, J.; Yu, R. Newly discovered endocrine functions of the liver. World J. Hepatol. 2021, 13, 1611–1628. [Google Scholar] [CrossRef] [PubMed]
- Hunt, N.J.; Kang, S.W.; Lockwood, G.P.; Le Couteur, D.G.; Cogger, V.C. Hallmarks of Aging in the Liver. Comput. Struct. Biotechnol. J. 2019, 17, 1151–1161. [Google Scholar] [CrossRef] [PubMed]
- Rianto, F.; Hoang, T.; Revoori, R.; Sparks, M.A. Angiotensin receptors in the kidney and vasculature in hypertension and kidney disease. Mol. Cell. Endocrinol. 2021, 529, 111259. [Google Scholar] [CrossRef]
- Liu, Q.; Lv, S.; Liu, J.; Liu, S.; Wang, Y.; Liu, G. Mesenchymal stem cells modified with angiotensin-converting enzyme 2 are superior for amelioration of glomerular fibrosis in diabetic nephropathy. Diabetes Res. Clin. Pract. 2020, 162, 108093. [Google Scholar] [CrossRef]
- Sumnu, A.; Gursu, M.; Ozturk, S. Primary glomerular diseases in the elderly. World J. Nephrol. 2015, 4, 263–270. [Google Scholar] [CrossRef]
- Turner, V.M.; Mabbott, N.A. Influence of ageing on the microarchitecture of the spleen and lymph nodes. Biogerontology 2017, 18, 723–738. [Google Scholar] [CrossRef] [PubMed]
- Lewis, S.M.; Williams, A.; Eisenbarth, S.C. Structure and function of the immune system in the spleen. Sci. Immunol. 2019, 4, eaau6085. [Google Scholar] [CrossRef] [PubMed]
- Kraal, G. Cells in the marginal zone of the spleen. Int. Rev. Cytol. 1992, 132, 31–74. [Google Scholar] [PubMed]
- Kraal, G.; Mebius, R. New insights into the cell biology of the marginal zone of the spleen. Int. Rev. Cytol. 2006, 250, 175–215. [Google Scholar]
- Birjandi, S.Z.; Ippolito, J.A.; Ramadorai, A.K.; Witte, P.L. Alterations in Marginal Zone Macrophages and Marginal Zone B Cells in Old Mice. J. Immunol. 2011, 186, 3441–3451. [Google Scholar] [CrossRef]


| Antibody ID | Company | Ref # | Incubation Time | Dilution |
|---|---|---|---|---|
| Lamin A/C | Proteintech (Martinsried, Germany) | 81042-1-RR | ON | 1:250 |
| αSMA | MERCK (Saint Louis, MO, USA) | C6198-100UL | ON | 1:1000 |
| IL-8 | Antibodies.com (Stockholm, Sweden) | A26910 | ON | 1:500 |
| Il-6 | Invitrogen (Carlsbad, CA, USA) | P620 | ON | 1:1000 |
| P16/NK4a | Invitrogen (Carlsbad, CA, USA) | MA5-17142 | ON | 1:500 |
| PAI-1/serpine-1 | Invitrogen (Carlsbad, CA, USA) | MA5-17171 | ON | 1:500 |
| CD68 | Abcam (Boston, MA, USA) | Ab283667 | ON | 1:500 |
| Vimentin | Cell Signalling (Danvers, MA, USA) | D21H3 | ON | 1:500 |
| Antibody ID | Company | Ref # | Incubation Time | Dilution |
|---|---|---|---|---|
| Alexa Fluor 555(mouse) | Invitrogen (Carlsbad, CA, USA) | A31570 | 1 h | 1:1000 |
| Alexa Fluor 488(mouse) | Invitrogen (Carlsbad, CA, USA) | A21202 | 1 h | 1:1000 |
| Alexa Fluor 555(rabbit) | Invitrogen (Carlsbad, CA, USA) | A31572 | 1 h | 1:1000 |
| Alexa Fluor 488(rabbit) | Invitrogen (Carlsbad, CA, USA) | A21206 | 1 h | 1:1000 |
| Antibody ID | Company | Ref # | Incubation Time | Dilution |
|---|---|---|---|---|
| αSMA | MERCK (Saint Louis, MO, USA) | C6198-100UL | ON | 1:2000 |
| Lamin A/C | Santa Cruz (Santa Cruz, CA, USA) | Sc-20681 | ON | 1:5000 |
| Peroxidase AffiniPure Goat Anti-Rabbit IgG (H + L) | Jackson Immuno Research (West Grove, PA, USA) | 111035003 | 1 h | 1:5000 |
| Peroxidase AffiniPure Goat Anti-Mouse IgG (H + L) | Jackson Immuno Research (West Grove, PA, USA) | 115035003 | 1 h | 1:5000 |
Disclaimer/Publisher’s Note: The statements, opinions and data contained in all publications are solely those of the individual author(s) and contributor(s) and not of MDPI and/or the editor(s). MDPI and/or the editor(s) disclaim responsibility for any injury to people or property resulting from any ideas, methods, instructions or products referred to in the content. |
© 2024 by the authors. Licensee MDPI, Basel, Switzerland. This article is an open access article distributed under the terms and conditions of the Creative Commons Attribution (CC BY) license (https://creativecommons.org/licenses/by/4.0/).
Share and Cite
Krüger, P.; Schroll, M.; Fenzl, F.; Lederer, E.-M.; Hartinger, R.; Arnold, R.; Cagla Togan, D.; Guo, R.; Liu, S.; Petry, A.; et al. Inflammation and Fibrosis in Progeria: Organ-Specific Responses in an HGPS Mouse Model. Int. J. Mol. Sci. 2024, 25, 9323. https://doi.org/10.3390/ijms25179323
Krüger P, Schroll M, Fenzl F, Lederer E-M, Hartinger R, Arnold R, Cagla Togan D, Guo R, Liu S, Petry A, et al. Inflammation and Fibrosis in Progeria: Organ-Specific Responses in an HGPS Mouse Model. International Journal of Molecular Sciences. 2024; 25(17):9323. https://doi.org/10.3390/ijms25179323
Chicago/Turabian StyleKrüger, Peter, Moritz Schroll, Felix Fenzl, Eva-Maria Lederer, Ramona Hartinger, Rouven Arnold, Deniz Cagla Togan, Runjia Guo, Shiyu Liu, Andreas Petry, and et al. 2024. "Inflammation and Fibrosis in Progeria: Organ-Specific Responses in an HGPS Mouse Model" International Journal of Molecular Sciences 25, no. 17: 9323. https://doi.org/10.3390/ijms25179323