Article

Identification and Characterization of Shaker Potassium Channel Gene Family and Response to Salt and Chilling Stress in Rice

1
College of Life and Environmental Sciences, Hangzhou Normal University, Hangzhou 311121, China
2
Zhejiang Provincial Key Laboratory for Genetic Improvement and Quality Control of Medicinal Plants, Hangzhou Normal University, Hangzhou 311121, China
3
State Key Laboratory of Rice Biology and Breeding, China National Rice Research Institute, Hangzhou 311400, China
*
Authors to whom correspondence should be addressed.
These authors have contributed equally to this work and share second authorship.
Int. J. Mol. Sci. 2024, 25(17), 9728; https://doi.org/10.3390/ijms25179728
Submission received: 24 July 2024 / Revised: 30 August 2024 / Accepted: 5 September 2024 / Published: 8 September 2024
(This article belongs to the Special Issue Gene Mining and Germplasm Innovation for the Important Traits in Rice)

Abstract

:
Shaker potassium channel proteins are a class of voltage-gated ion channels responsible for K+ uptake and translocation, playing a crucial role in plant growth and salt tolerance. In this study, bioinformatic analysis was performed to identify the members within the Shaker gene family. Moreover, the expression patterns of rice Shaker(OsShaker) K+ channel genes were analyzed in different tissues and salt treatment by RT–qPCR. The results revealed that there were eight OsShaker K+ channel genes distributed on chromosomes 1, 2, 5, 6 and 7 in rice, and their promoters contained a variety of cis-regulatory elements, including hormone-responsive, light-responsive, and stress-responsive elements, etc. Most of the OsShaker K+ channel genes were expressed in all tissues of rice, but at different levels in different tissues. In addition, the expression of OsShaker K+ channel genes differed in the timing, organization and intensity of response to salt and chilling stress. In conclusion, our findings provide a reference for the understanding of OsShaker K+ channel genes, as well as their potential functions in response to salt and chilling stress in rice.

1. Introduction

Soil salinity is a global environmental problem that restricts the growth and productivity of plants [1]. The area of saline soils in the world is about 950 million hectares [2]. It is estimated that, by the middle of the 21st century, about 50% of the world’s arable land will be affected by soil salinization, and this proportion is expected to increase further due to global warming and irrational irrigation [3]. Rice is an important cereal crops for the world’s population. However, it is one of the most salt-susceptible cereals, especially at the seedling stage. Therefore, it is crucial from the perspective of global food security to identify the key genes and breed new varieties of salt-tolerant rice.
Potassium (K+), which accounts for 2–10% of plant dry weight, is essential not only for normal growth and development, but also for salt stress response [4,5,6]. For instance, salt stress normally leads to K+ efflux accompanying the accumulation of Na+ in the cytoplasm, which can competitively combine the K+ binding sites of enzymes, as Na+ and K+ share similar chemical properties, resulting in cellular metabolic disorders. Therefore, maintaining cytoplasmic K+ concentration is vital for plant salt tolerance [7,8]. K+ exists in the soil in a variety of forms, However, due to the adsorption of silicates, the available K+ content in the soil is usually very low [9,10]. Moreover, plant cells need a high concentration of K+ to maintain normal metabolism. Cytoplasmic K+ content is relatively stable, ranging from 60 to 200 mM, while vacuolar K+ concentration is more variable, ranging from 20 to 500 mM [4,11,12]. Therefore, plants have evolved efficient K+ absorption and transport systems to maintain optimal growth in low potassium environments or under abiotic stresses [13].
In plants, K+ absorption and transport are executed mainly by K+ transporters and channels. There are three families of K+ transporters in plants [14]. HAK (high-affinity K+)/KUP (K+ uptake)/KT(K+ transporter) is the largest family of K+ transporters, only found in plants, with a K+/H+ symporter function [15]. The HKT (High-Affinity Potassium Transporter) family is mainly responsible for the transport of K+/Na+ cotransporters or Na+ [16]. The CPA (Cation proton antiporters) family can be further divided into the CHX (Cation/H+ exchangers), NHX (Na+/H+ exchangers), and KEA (K+ efflux antiporters) subfamilies [14], and only some members have been reported to be involved in K+ transport in Arabidopsis [17,18]. Four K+ channel families exist in plants: Shaker (Shaker-type K+ channels), TPK (Two-pore K+-channels), Kir (K+-inward rectifier)-like channels, and NSCC (non-selective cation channels). TPK members generally consists of two ion-conducting pores and four transmembrane domains, and this structure is thought to be similar to that of the KCNK (Two-pore-domain) family in animals [19]. Kir-like has only two transmembrane domains and one ion-conducting pore, similar to animal Kir. TPK and Kir-like channels cannot perceive osmolarity changes due to their lack of osmotic pressure-sensing structures. However, many TPK and Kir-like channels have an EF-hand domain at the C-terminal that can sense changes in calcium ions, suggesting that they may be sensitive to intracellular or intercellular changes in Ca2+ [20]. TPK family members are mainly located in the vacuole membrane to mediate K+ transport, and a few are localized in the plasma membrane [21]. NSCC probably plays the major role in K+ uptake at high concentrations (>10 mM). Shaker channels were the first potassium channel proteins identified and are responsible for the uptake and translocation of K+ [22]. The basic structure of the Shaker channel consists of four alpha-subunits that surround each other to form a central aqueous pore for the permeation of K+ [22]. A typical α-subunit usually contains a short intracellular N-terminus of only about 60 amino acids, a C-terminus, six transmembrane segments (S1–S6) and a conserved ion-conducting pore region [23]. The fourth of these transmembrane structures (S4) senses and transmits voltage changes and controls the opening and closing of the channel [23]. The Shaker family can be divided into three functional subfamilies based on their voltage dependence: inwardly rectifying potassium channels (Kin), weakly rectifying potassium channels (K-weak), and outwardly rectifying potassium channels (K-out) [24].
The Shaker family is important in plant potassium ion uptake and transport under abiotic stresses. Shaker family member AtGORK is an outward K+ channel, which negatively regulates salt tolerance in Arabidopsis, and lack of AtGORK in Arabidopsis could enhance salt tolerance [25]. In rice, OsKAT1 can significantly increase the cellular K+ content and K+/Na+ ratio of suspension cells and alleviate the inhibitory effect of salt stress on cell proliferation [26]. In addition, it was recently found that, under salt stress, the phloem-localized OsAKT2 is responsible for re-transporting K+ leaking from the phloem into the phloem and transporting it through the phloem cycle to critical sites, such as roots and young leaves, to maintain K+ and Na+ homeostasis at these sites, the mutation of OsAKT2 resulted in significant sensitivity to salt stress in rice [27,28]. OsK5.2 expression was significantly up-regulated in the shoot under salt stress, resulting in a large outflow of K+ from the stomatal guard cells, stomatal closure, and a rapid decrease in the transpiration flow, reducing the transport of Na+ to the above-ground part along with the transpiration flow, and improving the salt tolerance of rice [29]. In eggplant, expression of Shaker family genes AKT1, KAT1 and SOS1 was significantly up-regulated in leaves of the salt-tolerant variety ST118 [30]. In addition, Shaker family members have also been found to be involved in the regulation of salt tolerance in other plants. GmAKT1 mediates K+ uptake and maintains Na+/K+ homeostasis under salt stress, and overexpression of GmAKT1 enhances salt tolerance in Arabidopsis and soybean [31,32]. In Zygophyllum xanthoxylum, AKT1 enhances salt tolerance by regulating root cell Na+/K+ homeostasis [33]. PbrKAT1 exhibits typical inward rectifier currents in Xenopus oocytes, and its activity is inhibited by external Na+ [34].
Rice is one of the most important food crops in the world, providing food for more than half of the global population. The Shaker family plays an important role in plant resistance to abiotic stress, However, this family has been less widely studied and lacks systematic bioinformatics analysis for identification and response to adversity stress in rice. In this study, we employed bioinformatics and publicly available data to identify the Shaker potassium channel in the rice genome and performed analysis of its gene structure, phylogenetic tree, conserved protein sequences, and promoter cis-acting elements, etc. In addition, we used reverse transcription quantitative polymerase chain reaction(RT–qPCR) to investigate the tissue expression pattern of the Shaker genes and their transcriptional response to salt and chilling stress. Our results provide a set of potential candidate Shaker K+ channel genes for the future genetic modification of K+ transport and salt and chilling tolerance in higher plants.

2. Results

2.1. Identification of the OsShaker K+ Channel Genes

Eight OsShaker K+ channel genes were identified in the rice genome, which were distributed on chromosomes 1, 2, 5, 6, and 7 (Figure 1, Supplementary Table S1). The OsShaker K+ channel genes are named according to the homologous relationships with Arabidopsis.
The results of physicochemical property analysis showed that the amino acid lengths of the Shaker family proteins ranged from 373 to 935; the amino acid number of the OsKAT4 was the lowest, while the OsAKT1 has the longest peptide. The molecular masses of the proteins ranged from 41.67 to 102.02 kDa, with the smallest being the OsKAT4 and the largest being the OsAKT1, with 41.67 kDa and 102.02 kDa, respectively. The isoelectric points ranged from 5.66 to 10.9, with the smallest being the OsSKOR and the largest being the OsAKT3. The hydrophobicity values of the proteins ranged from −0.3 to 0.308, and the hydrophobicity values of the proteins were distributed in both positive and negative, indicating that the hydrophobicity of the rice Shaker family proteins is not fixed. The predicted subcellular localization showed that all OsShaker K+ channel proteins were localized in the cytoplasmic membrane. In addition, OsAKT3 and OsKAT1 have extra nuclear localization signal peptides (Table 1, Supplementary Table S2).

2.2. OsShaker K+ Channel Proteins’ Sequence Alignment, Gene Structure and Conserved Motif Analysis

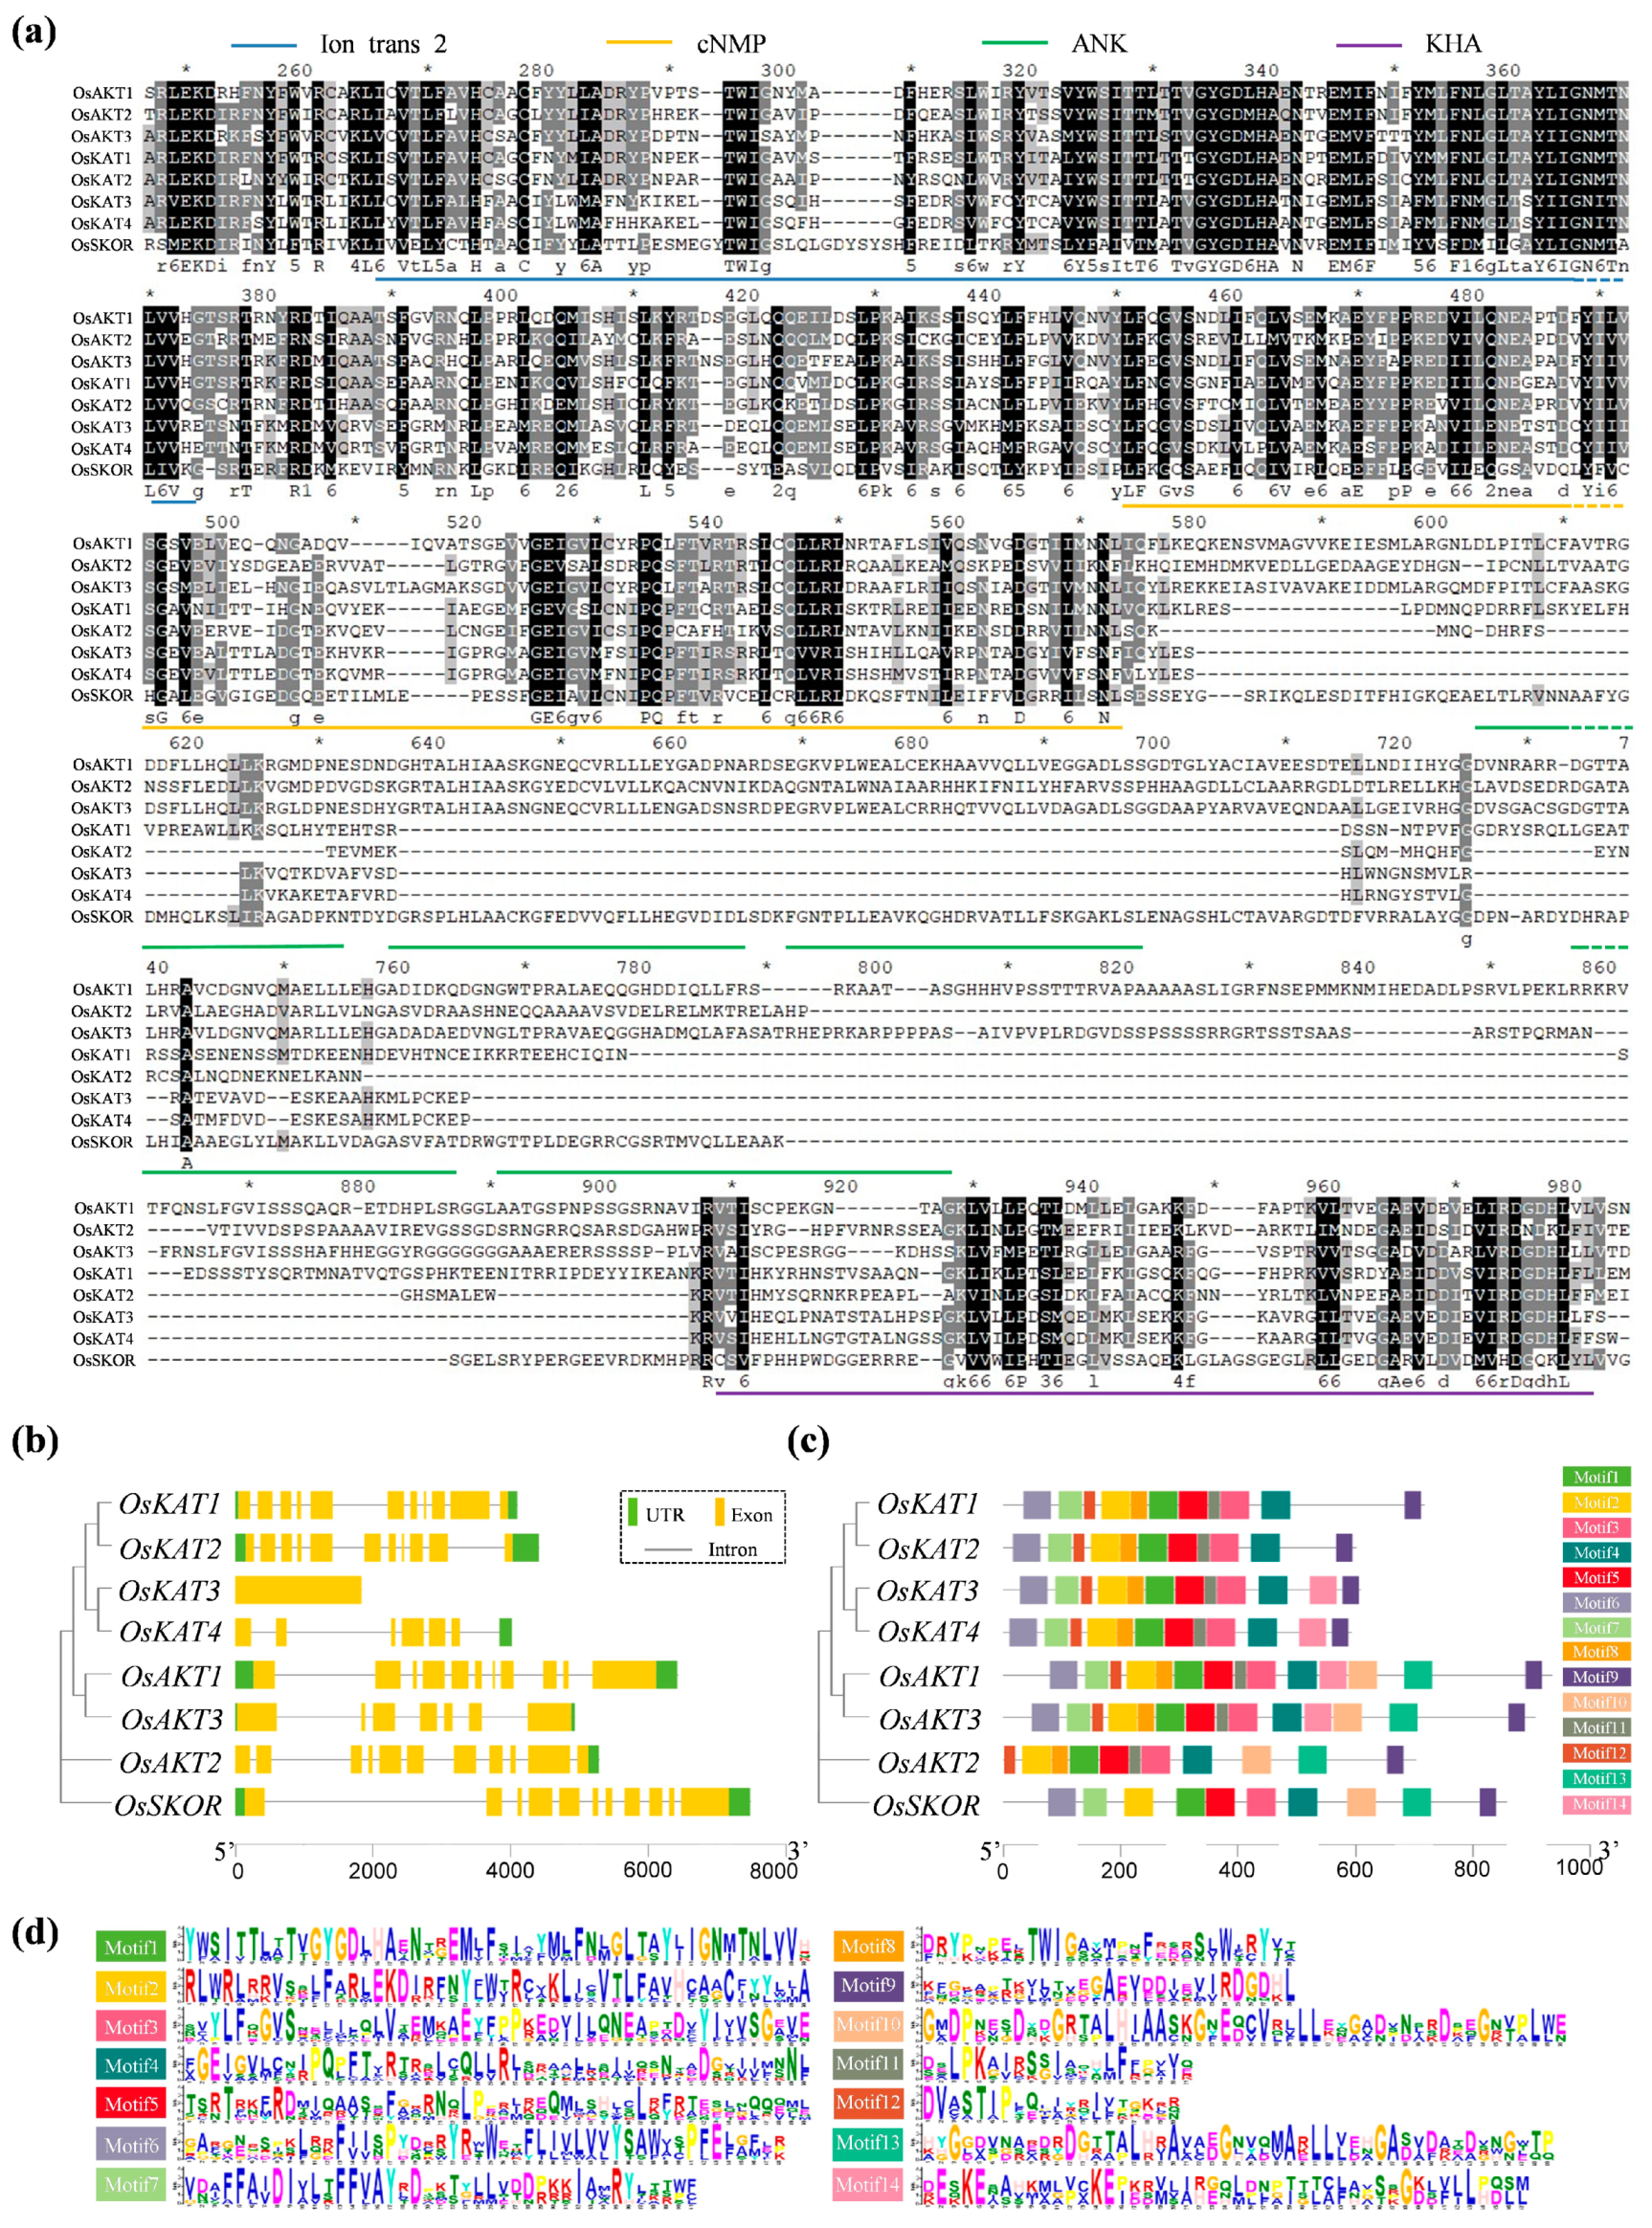
Comparative analysis of the OsShaker K+ channel protein sequences showed that they have four highly conserved domains: the Ion_trans_2 domain, the cNMP domain, the ANK domain and the KHA domain (Figure 2a). Structural analysis of the OsShaker K+ channel genes demonstrated that the length of the family genes ranged from 1776 (OsKAT3) to 7499 (OsSKOR) bp. The number of exons in the OsShaker K+ channel genes ranged from 1 to 11, except for OsKAT3, which contained one exon; the other members contained more than six exons, among which OsAKT1, OsAKT2, OsKAT1, OsKAT2, and OsSKOR contained 11 exons (Figure 2b).
Conserved motif analysis is important for exploring the structural composition of proteins, as well as their function. The MEME online tool was used to analyze the number and distribution of the Motifs of OsShaker K+ channel proteins; a total of 14 Motifs were characterized, named Motif1–Motif14. In the conserved motif map, the relative degree of conservatism increased with the height of the letter and the frequency of the base corresponding to the letter. As shown in Figure 2c, OsAKT2 does not contain Motif7 and Motif9, while OsAKT1 and OsAKT3 contain 14 Motifs in the same number and order (Supplementary Table S3). The similarities and differences shown by these conserved motifs may be attributed to the adaptation of the functions of OsShaker K+ channel proteins to the evolutionary direction during the evolutionary process.

2.3. Phylogenetic and Gene Duplication Analysis of the OsShaker K+ Channel Genes

To further investigate the OsShaker K+ channel genes’ evolutionary relationship between rice and other species, such as Arabidopsis thaliana, Hordeum vulgare, Zea mays, and Glycine max, a phylogenetic tree was constructed. The results showed that Shaker K+ channel proteins are divided into five subfamilies (Clusters I–V)., and the proteins of OsShaker K+ channel were closely related to Shaker in monocotyledonous plants, such as barley and corn (Figure 3a), indicating that the Shaker K+ channel gene family in monocotyledonous and dicotyledonous plants shows different evolutionary trends.
Using TBtools, one pair of segmental duplication events was identified in the OsShaker K+ channel family, including OsKAT2 on chromosome 1 and OsKAT1 on chromosome 2 (Figure 3b). In addition, interspecies collinearity analysis revealed that there are bonds of Shaker K+ channel genes between rice and barley. Three OsShaker K+ channel family members (OsAKT1, OsAKT2, and OsKAT2) and four barley Shaker gene family members had covariate duplications (Figure 3c, Supplementary Table S4), indicating that the OsShaker family and the barley Shaker family are closely related during the evolutionary process.

2.4. Protein Structures and Transmembrane Domain Analysis of OsShaker K+ Channel Proteins

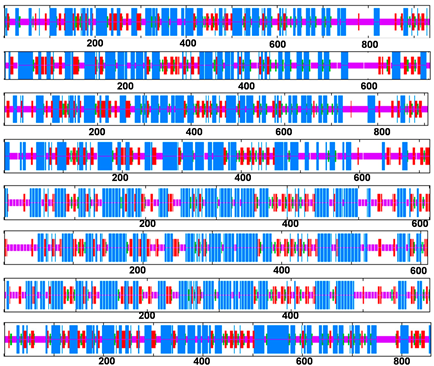
Four secondary structures of OsShaker K+ channel proteins were characterized, i.e., alpha(α) helix, beta(β) turn, random coil and extended strand, and all were in the ratio of α-helix > random coil > extended strand > β-turn (Table 2). Accordingly, it can be noticed that α-helix and random coil are the main components of OsShaker K+ channel proteins, while β-turn and extended strand are scattered throughout the protein sequence, playing an auxiliary role in modification. The three-dimensional structure of OsShaker K+ channel proteins was analyzed, and the results are shown in Figure 4, indicating that the three-dimensional structures of OsShaker K+ channel proteins show a similarity. As shown in Figure 5, the transmembrane domain analysis of OsShaker K+ channel proteins showed that they all have transmembrane structural domains, and the predicted number of transmembrane helices is 3–6 (Figure 5, Supplementary Table S5). OsAKT2 contains three transmembrane domains, and OsKAT2, OsKAT3, OsKAT4 contain six transmembrane structural domains, while the remaining OsShaker K+ channel proteins have five transmembrane structural domains (Figure 5).

2.5. The Cis-Acting Element Analysis of OsShaker K+ Channel Genes Promoter

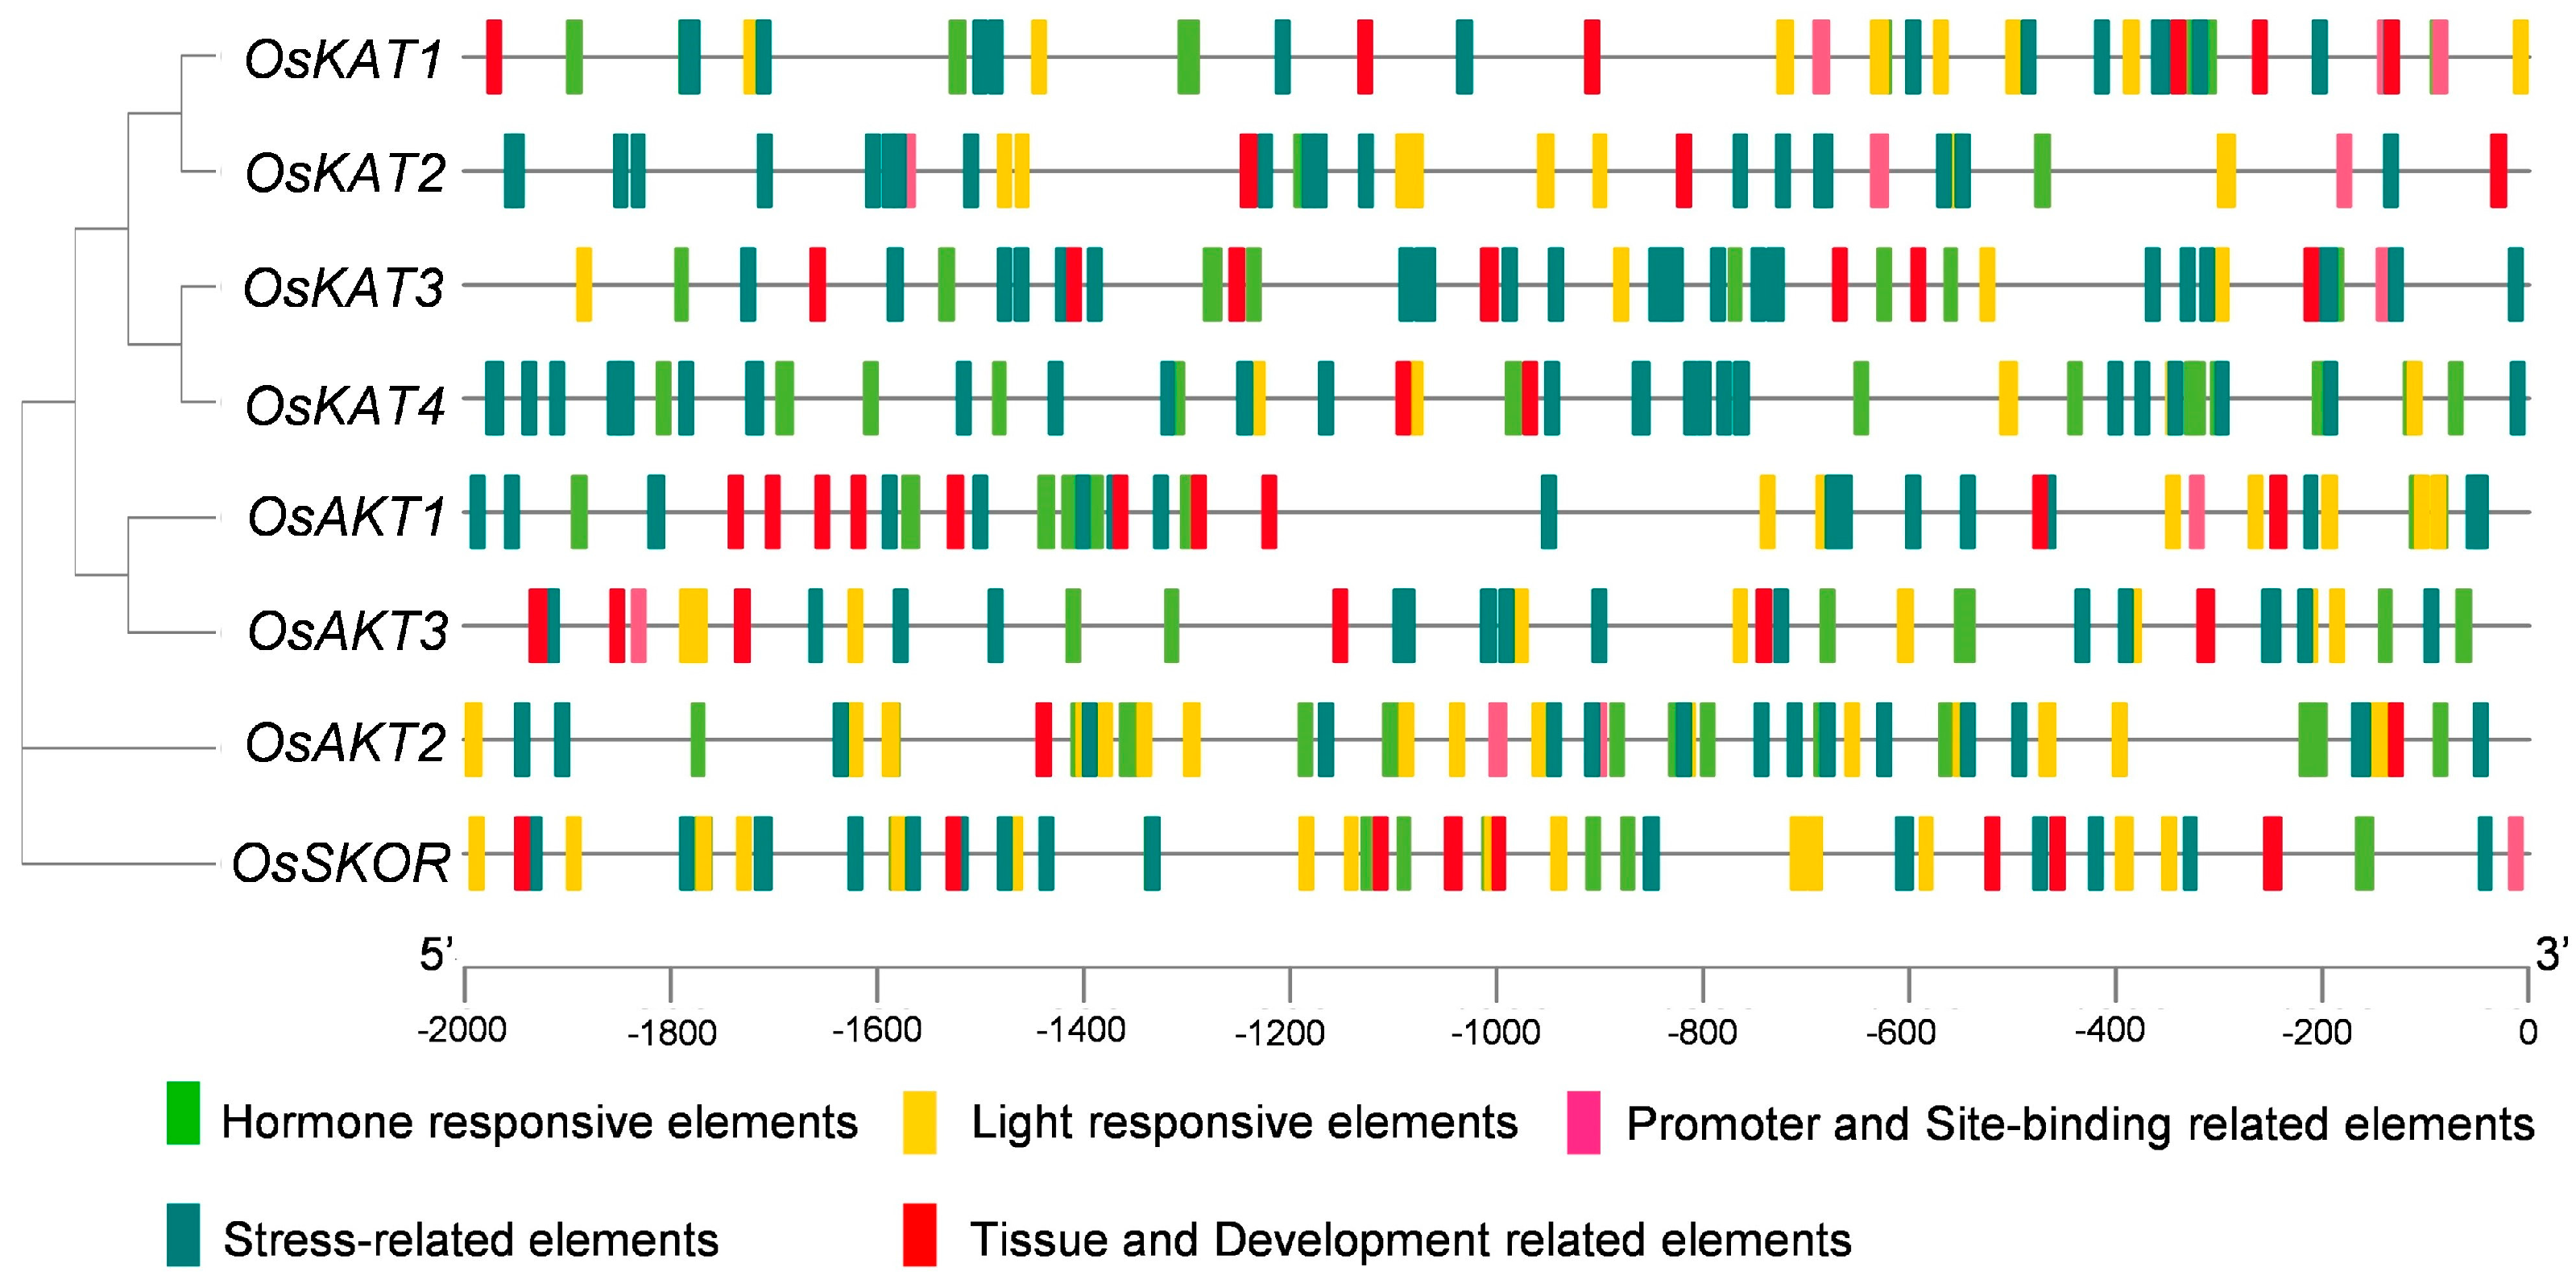
The cis-acting elements in the promoter play a critical role in the regulation of gene expression. The analysis of cis-acting elements of OsShaker K+ channel genes showed that the promoter sequences contained hormone-responsive cis-acting elements (eABRE, as-1, AuxRR-core, CGTCA-motif, ERE, GARE-motif, TATC-box, TGACG-box, TGACG-box, TGACG-box, TGACG-box, TGACG-box, TGACG-box, TGACG-box, TGACG-box, etc.), light-responsive cis-acting elements (AAGAA-motif, AE-box, Box4, G-Box, GATT-motif, ATC-motif, GT1-motif, Sp1, TCCC-motif, ACE, etc.), stress-responsive cis-acting elements (AP-1, ARE, DRE core, LTR, MYB, MYC, STRE, TC-rich repeats, W box, WRE3, etc.), promoter and site-binding-associated elements (CCAAT-box, MBS, MRE, CTAG-motif), and tissue and developmental elements (AAGAA-motif, ATC-motif, ATC-motif, ATC1-motif, Sp1, TCCC-motif, ACE, etc.) (Figure 6, Supplementary Table S6). The results indicate that OsShaker K+ channel genes may be regulated by hormones, light, and abiotic stresses. Among them, OsAKT1 and OsKAT2 contained AP-1 elements in response to cadmium stress, and OsSKOR contained LTR elements in response to stress. OsKAT3 contained seven drought stress-responsive elements and OsKAT4 contained eight cis-regulatory elements necessary for anaerobic induction.

2.6. OsShaker K+ Channel Proteins’ PPI Network Analysis

The PPI network analysis of OsShaker K+ channel proteins was performed using the Interacting Protein Prediction STRING website and Cytoscape software. As shown in Figure 7, OsAKT1, OsAKT2, OsAKT3 and OsSKOR proteins potentially interacted with OsCIPK23, which is the calcium-regulated phosphatase class B protein. OsCBL1 and OsCIPK23 have been identified as upstream regulators of OsAKT1. OsAKT2 interacts with OsAKT1, OsAKT3, OsKAT1, OsKAT2, OsKAT3, and OsKAT4, whereas the OsSKOR only interacted with OsCIPK23 and OsSAPK1 proteins. The results indicate that OsShaker K+ channel proteins could perform different physiological functions by interacting with a variety of other proteins.

2.7. OsShaker K+ Channel Gene Expression Profiling and Tissue Specificity Analysis

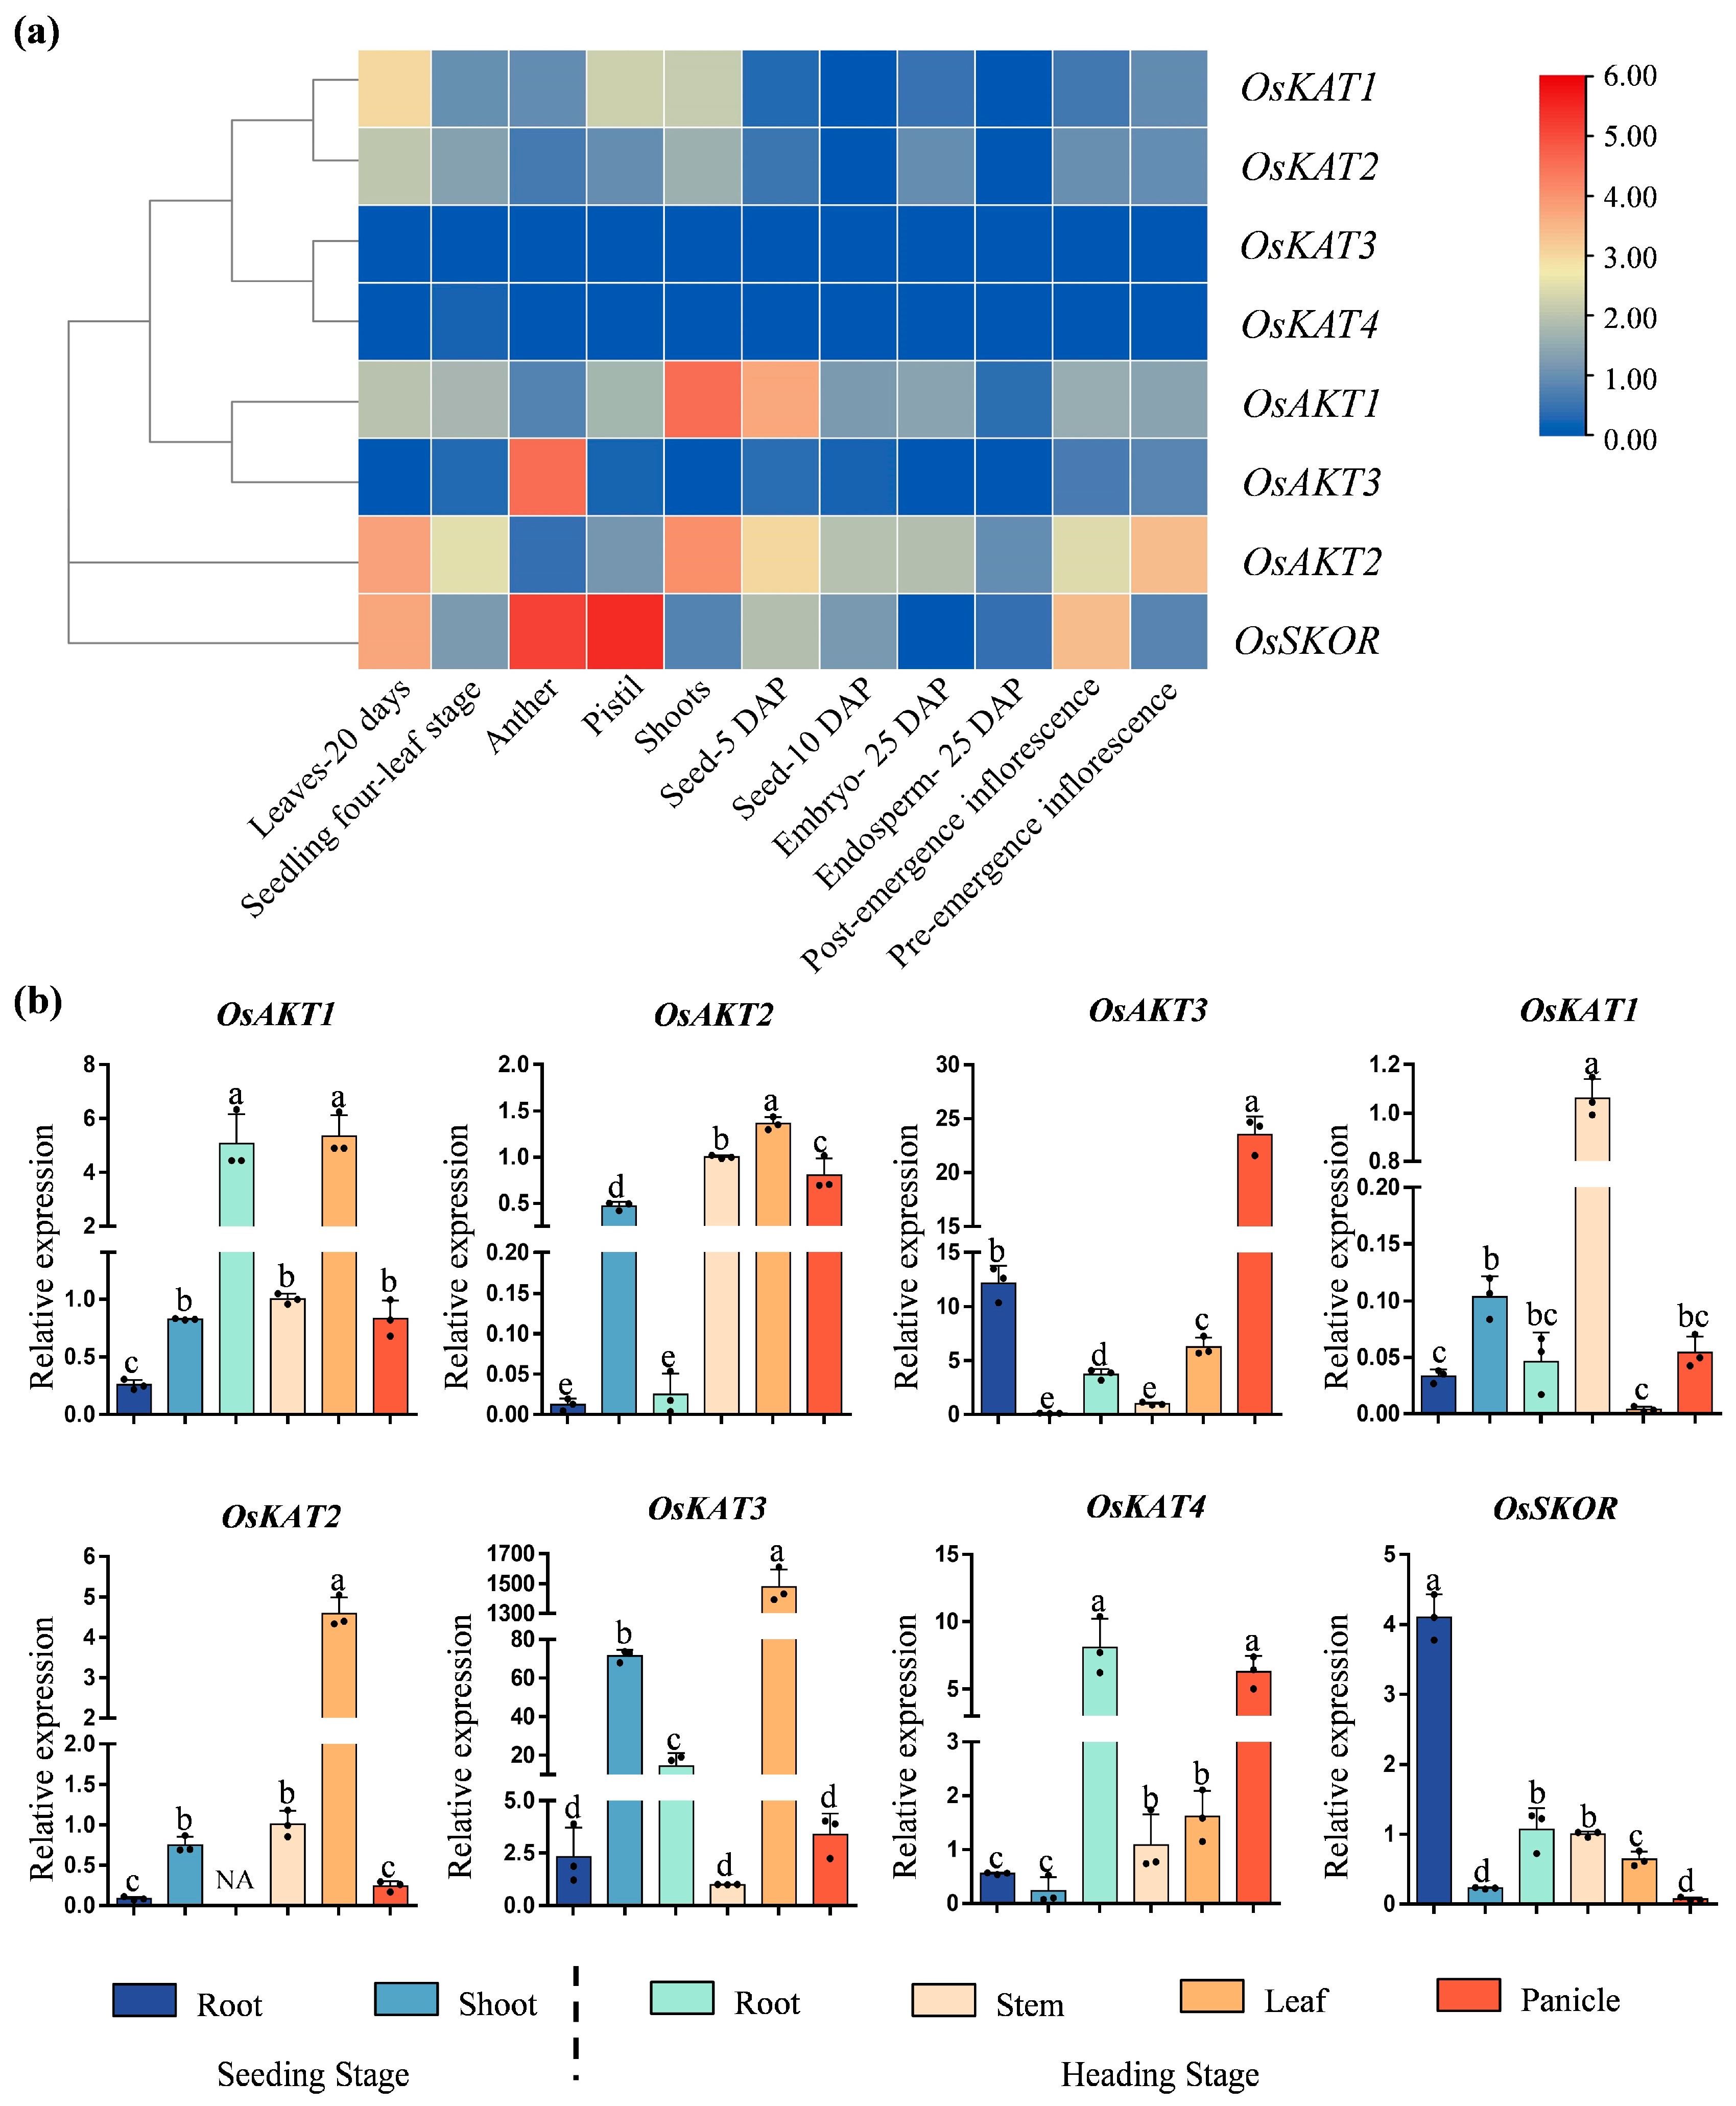
Hierarchical clustering of the expression of OsShaker K+ channel genes in different organs and developmental periods obtained from the database on the RGAP website showed that OsSKOR had the highest expression in stamens and anthers, whereas OsAKT1 and OsAKT2 were found to be predominantly expressed in the shoots. OsKAT3 and OsKAT4 were poorly expressed in all tissues and at all developmental stages of rice. Tissue-specific analyses of roots and shoots at seedling stage, as well as roots, stems, leaves at tasseling stage of ZH11, showed that the expression of OsAKT3 and OsSKOR was higher in roots at seedling stage, and the expression of OsAKT1, OsAKT2, OsKAT1,OsKAT2, and OsKAT3 were higher in shoots at seedling stage. In conclusion the expression of OsShaker K+ channel genes was spatio-temporally specific (Figure 8, Supplementary Table S7).

2.8. Expression Pattern of OsShaker K+ Channel Genes under Salt Stress

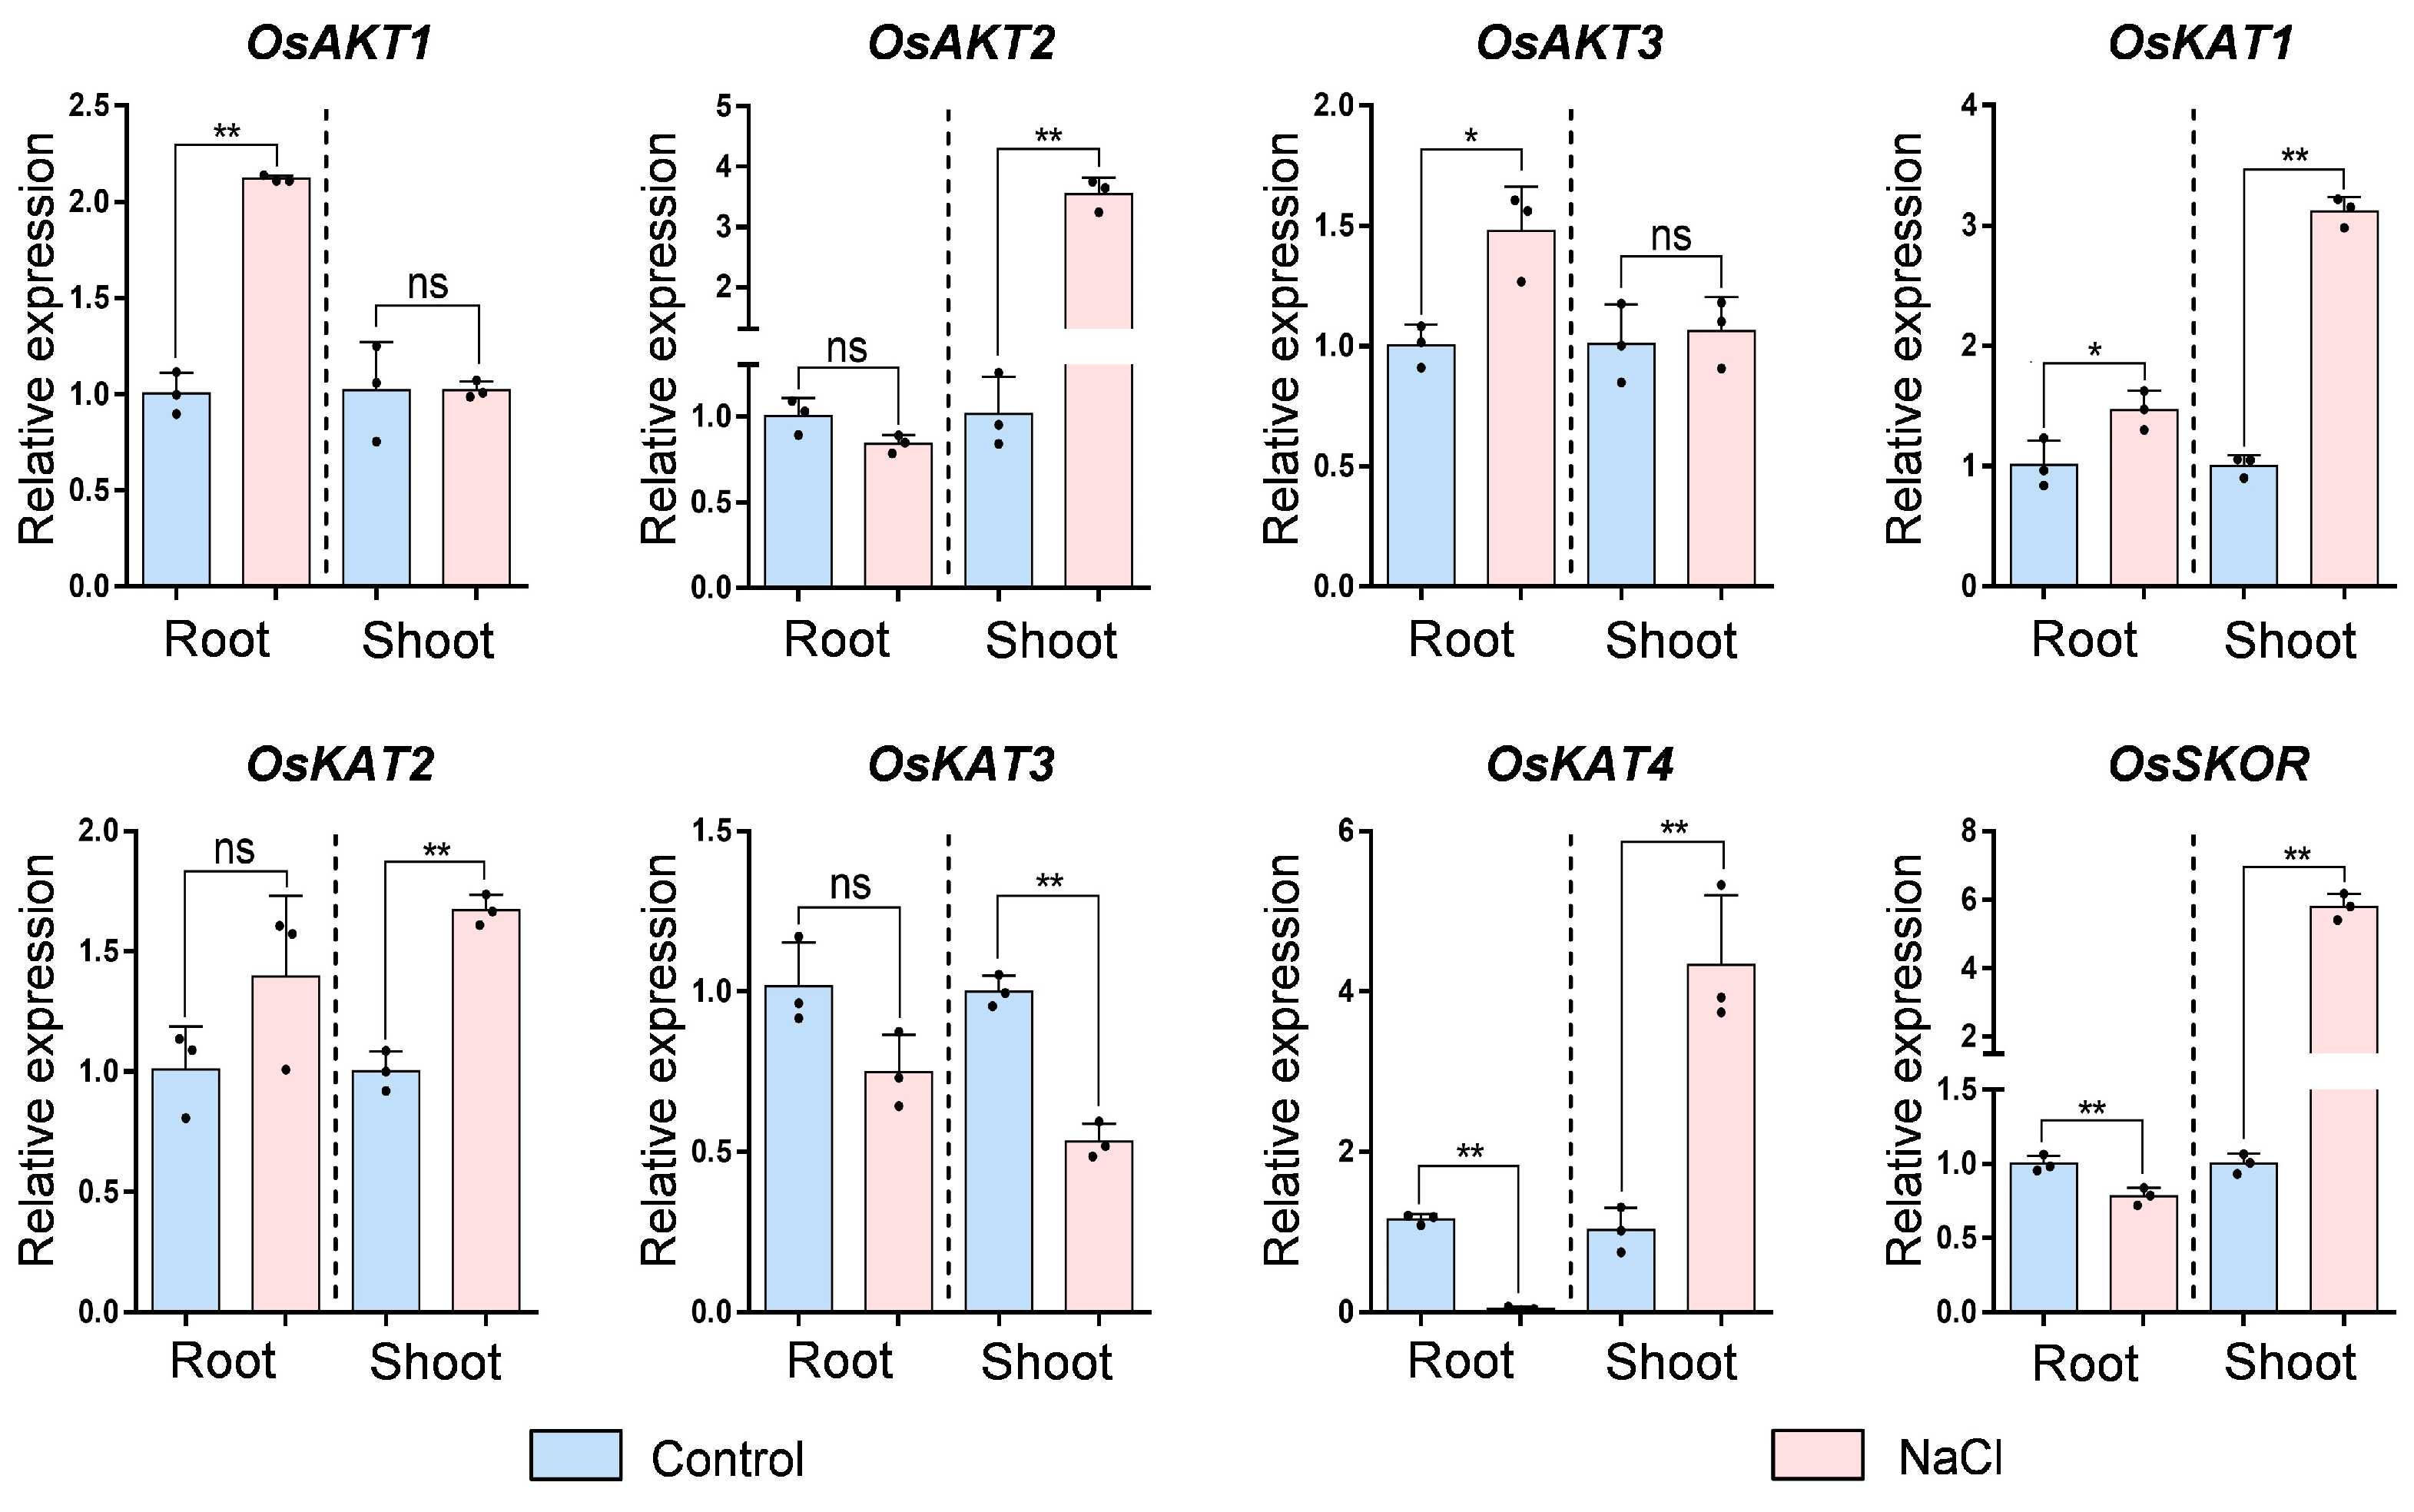
In order to study the response of OsShaker K+ channel genes to salt stress, the expression of OsShaker K+ channel genes of rice seedlings was analyzed (Figure 9). In the root, OsAKT1, OsAKT3, OsKAT1 and OsKAT2 were up-regulated, while the expression level of OsKAT4, OsSKOR were down-regulated. The expression of OsAKT1 was up-regulated by 2.11-fold compared with the control. In the shoot, the expression of OsAKT2, OsKAT1, OsKAT2, OsKAT4 and OsSKOR was induced to be up-regulated, among which the expression of OsSKOR was up-regulated by 5.80-fold. In contrast, the OsKAT3 expression was down-regulated by salt stress in shoot, with about 1.9-fold. In general, OsShaker K+ channel genes’ expression in response to salt stress suggests that OsShaker K+ channel genes may have different functions under salt stress.

2.9. Expression Pattern of OsShaker K+ Channel Genes under Chilling Treatment

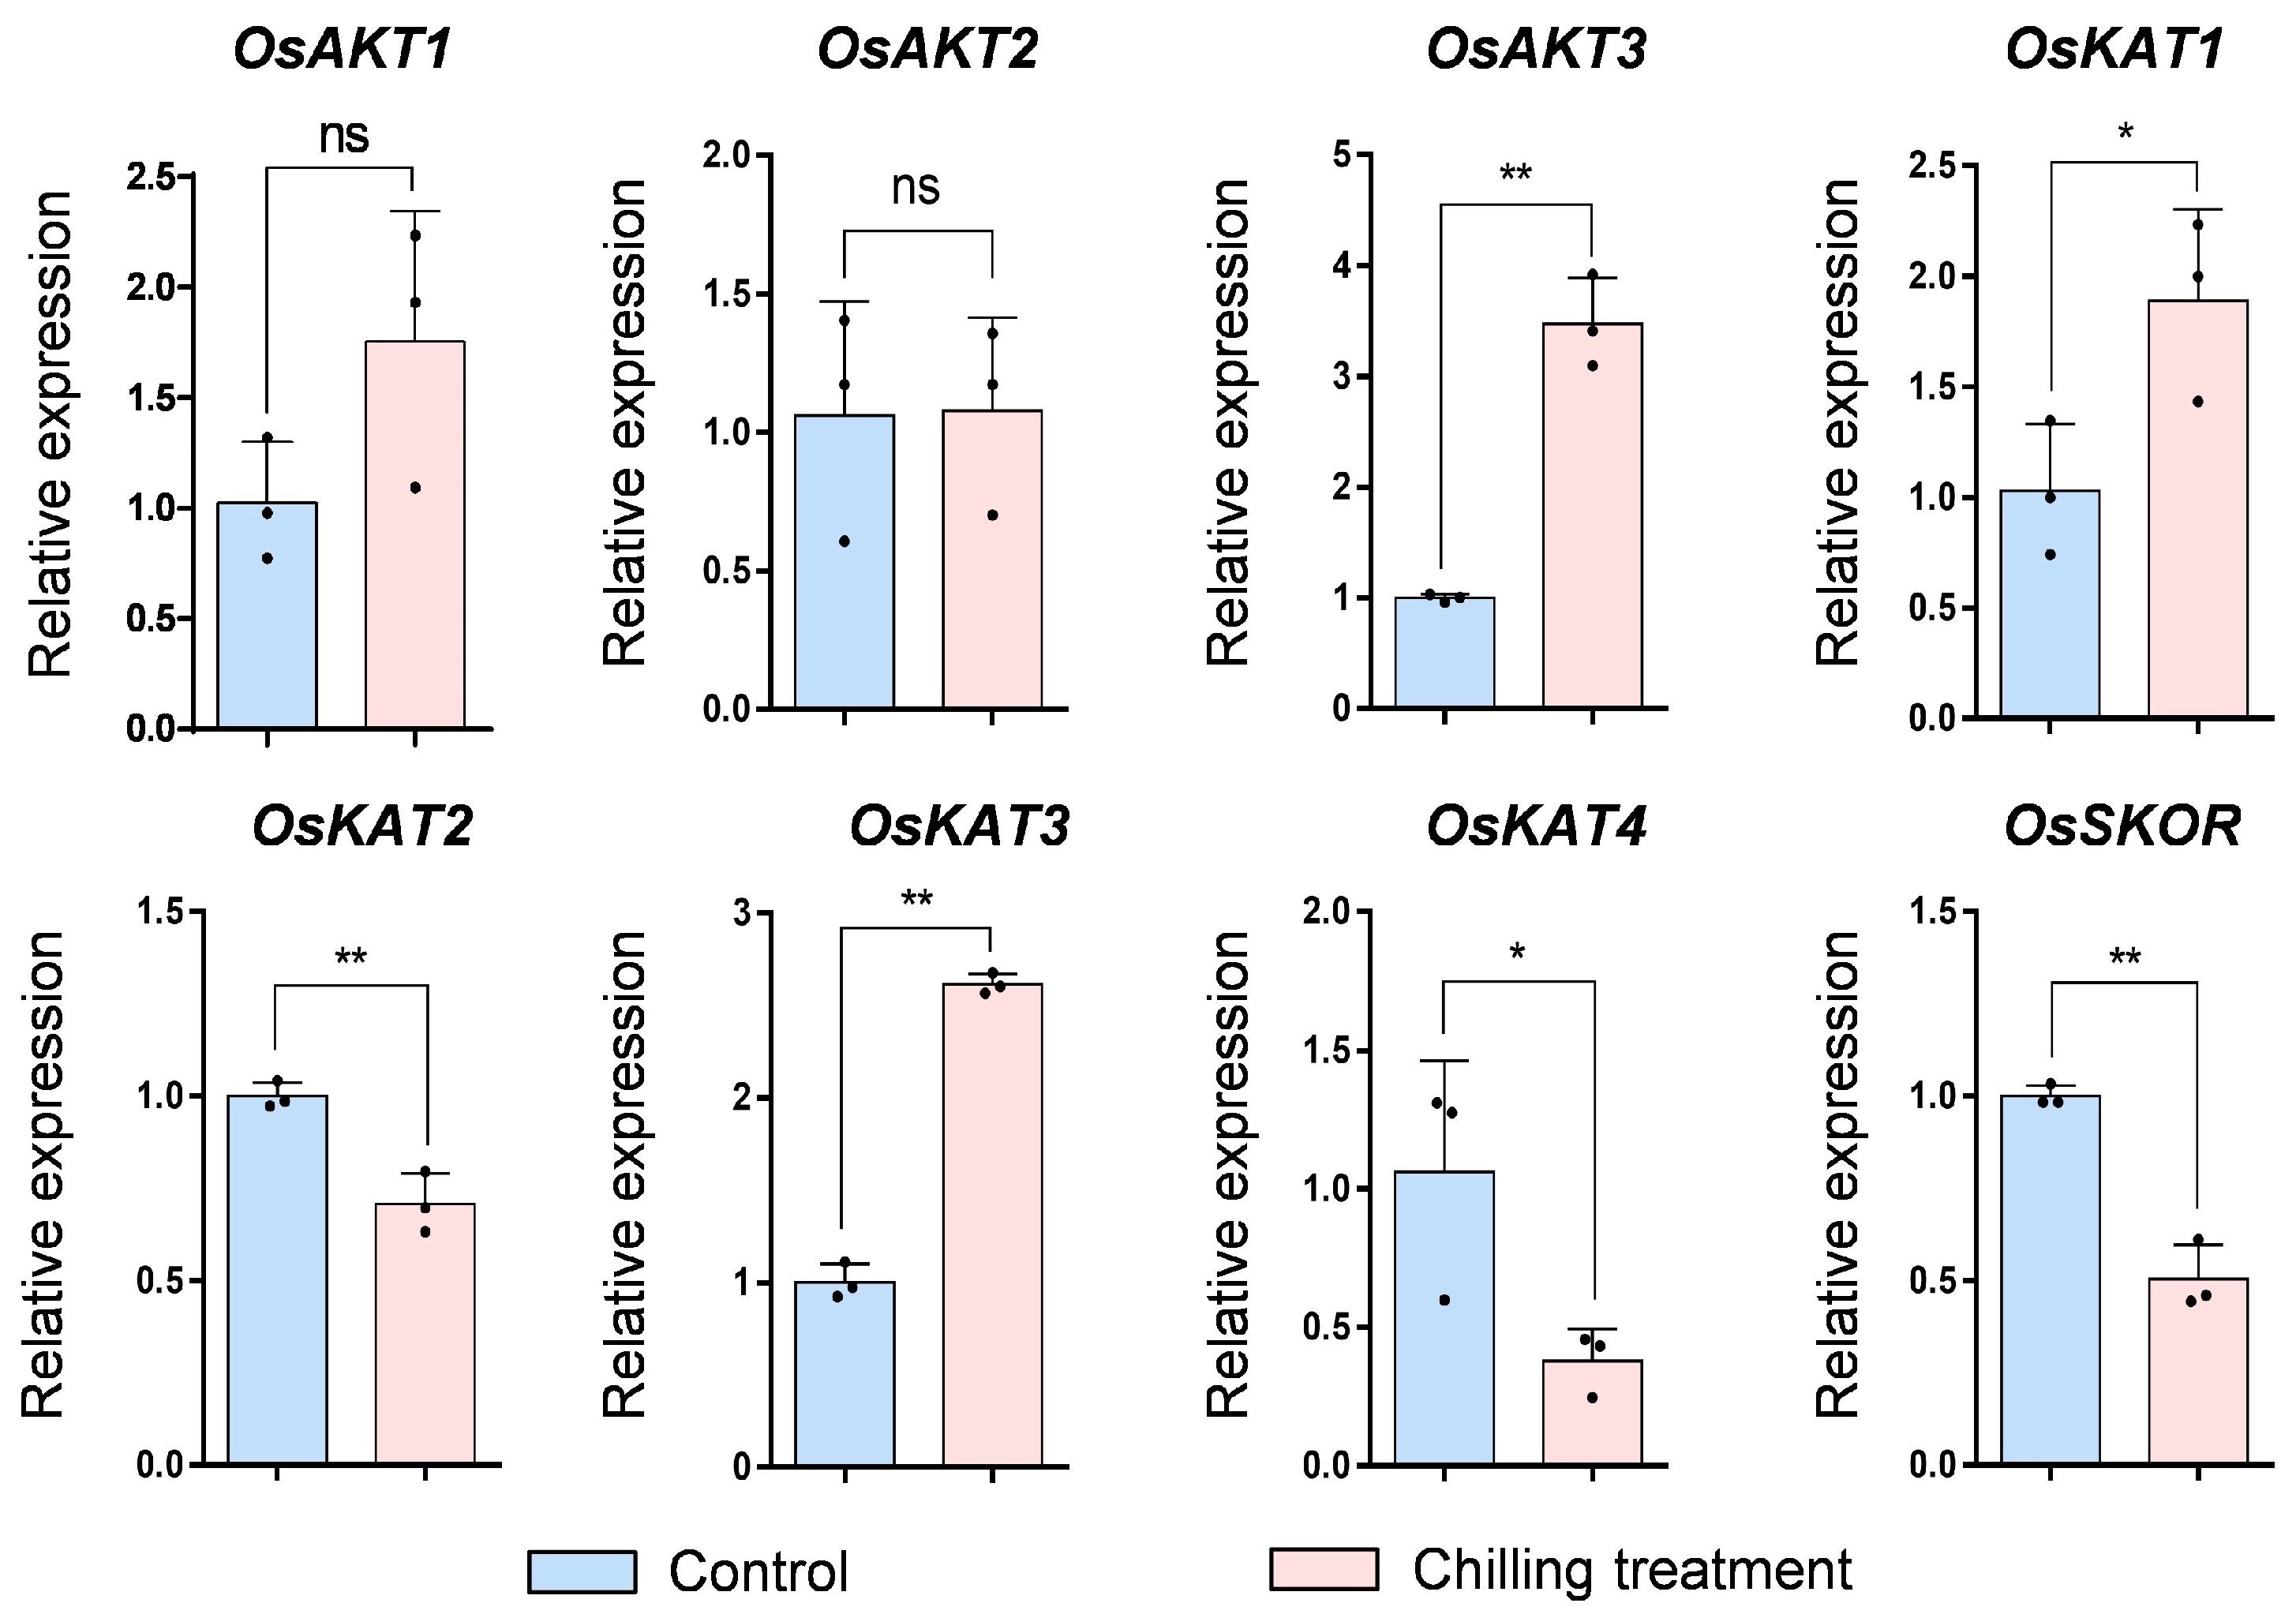
To investigate the response of OsShaker K+ channel genes to low temperature stress, after 12 hours of chilling stress treatment, the expression level of OsShaker K+ channel genes in rice seedlings was analyzed by RT–qPCR. The results suggested that OsAKT3, OsKAT1 and OsKAT3 were induced, while OsKAT2, OsKAT4, OsSKOR were down-regulated in the shoot; however, OsAKT1 and OsAKT2 gene expression was not affected by cold stress. (Figure 10). Therefore, it can be concluded that OsShaker K+ channel genes may also play an important role in response to low temperature.

3. Discussion

Soil salinity severely inhibits rice production. The intracellular Na+/K+ ratio is a key factor in determining the salt tolerance of plants [35]. Potassium channels are responsible for the uptake and transport of Na+ and K+ in plants, among which the Shaker family is the earliest identified potassium channel, which is involved in the regulation of plant salt tolerance and development [36]. The Shaker family has been systematically identified in Arabidopsis thaliana, Hordeum vulgare, Cajanus cajan, Gossypium raimondii, etc. [31,37,38,39,40,41,42], but has been rarely studied in rice. In this study, 8 OsShaker K+ channel genes were identified in the rice genome.
Gene structure and conserved motifs influence their function. In this study, most of the OsShaker K+ channel genes were characterized as having multiple introns, but OsKAT3 has no introns. Intronless genes are typically found in bacteria and primitive eukaryotes [43]. Thus, it is implied that OsKAT3 is perhaps evolutionarily more conserved. In addition, the number and arrangement of motifs are the same in the same subfamily. For example, OsAKT1 and OsAKT3 have 15 motifs, and OsAKT2 has only 7 motifs, suggesting that genes in the same subfamily may have similar functions. Repeatability and covariance analyses of the OsShaker K+ channel genes demonstrated OsKAT1 and OsKAT2, a pair of fragment repeat events, both of which are potassium inward rectifier channel proteins. The predicted subcellular localization results showed that the OsShaker K+ channel proteins were all localized in the cytoplasmic membrane, among which OsAKT2 was identified to be specifically localized in the plasma membrane [28,44].
Cis-acting elements in the promoter region are involved in the regulation of gene expression and can be used to predict biological functions, like stress response [45]. A variety of cis-acting elements, such as stress-responsive elements, light- and hormone-responsive elements, and tissue development-associated elements, were identified on the promoters of the OsShaker K+ channel genes, suggesting that the OsShaker K+ channel genes may be regulated by hormones, light, and adversity stresses, resulting in the regulation of rice growth, development, and response to adversity. Among them, OsKAT3 contained seven drought stress-responsive elements, and OsKAT4 contained eight cis-regulatory elements necessary for anaerobic induction. Analysis of interactions among OsShaker K+ channel proteins showed that OsAKT2 interacts with six OsShaker K+ channel members, except OsSKOR, which interacts with the ABA-responsive protein OsSAPK1. Moreover, the calmodulin phosphatase class B protein-interacting protein OsCIPK23, interacts with OsAKT1 [45]. In addition CIPK23 interactions with OsAKT1 have been experimentally demonstrated [46].
Potassium is one of the essential nutrients for plant growth and development, which can be taken up by plants from the environment through K+ channels or transporter proteins in the root [47]. Transmembrane structure analysis of OsShaker K+ channel proteins showed that they all have transmembrane structures, most of the proteins have 5–6 spans, and it is speculated that the OsShaker K+ channel proteins may have the function of mediating the transmembrane transport of potassium ions. In rice, overexpression of OsAKT1 increases potassium ion uptake in roots, whereas the mutant of the OsAKT1 plant showed a significant reduction in potassium ion content in vivo and exhibited a potassium-deficient phenotype [48]. OsAKT2 possesses the ability to mediate K+ uptake in yeast and Xenopus oocytes [47], while AtAKT1 and AtHAK5 are responsible for K+ uptake in Arabidopsis [49].
Shaker K+ channel genes are widely involved in plant stomatal movement and drought stress response. In Arabidopsis, KAT1 and its homologous KAT2 are the primary inward rectifying channels in guard cells, mediating the influx of K+ into these cells, leading to stomatal opening [50]. However, GORK is the only outward-rectifying K+ channel in guard cells, which facilitate the efflux of K+, resulting in stomatal closure [51,52]. AtAKT1 and AtAKT2 are involved in the drought stress response, and the AKT1 mutant exhibits increased drought tolerance [53]. Additionally, HvAKT1 and HvAKT2 have also been identified as being involved in the regulation of drought tolerance in barley [54]. Here, four KAT, three AKT and one SKOR have been identified in the rice genome, among which OsAKT1 has been reported to be involved in drought regulation [48] Gene expression under stress and the site of gene expression are closely related to gene function [45]. Tissue expression of OsShaker K+ channel genes showed that OsAKT2 and OsKAT2 were mainly expressed in the shoot, whereas OsAKT3 and OsSKOR were mainly expressed in the root. Among them, OsAKT2 has been reported to mediate the distribution of K+ among different leaves [27,28]. The expression of OsShaker K+ channel genes was either up-regulated or down-regulated under salt stress, suggesting that these genes may be involved in the response process to salt stress in rice. The expression of OsAKT1 was up-regulated in roots after salt stress treatment, as in the result of Golldack et al [55]. In this study, it was found that the expression of OsAKT2 was significantly up-regulated in the shoot by salt stress, whereas the expression level in the roots was very low and no significant difference was obtained between normal condition and salt stress, which is consistent with the previous report [28]. Overexpression of OsAKT2 improved salt tolerance in Arabidopsis by reabsorbing K+ in the phloem sap and leaves [27]. In addition, in rice, OsAKT2 promotes the reabsorption of K+ from the phloem, controlling the distribution of shoot K+ among different leaves, as well as increasing the K+/Na+ ratio in young leaves and other growth points to enhance the salt tolerance under salt stress [28]. The different expression sites and the responding path to salt stress of the OsShaker K+ channel genes suggests that they may play different functions in different parts of the plant at different time points of the day during salt stress.

4. Materials and Methods

4.1. Gene Identification and Chromosomal Localization Analysis

The Arabidopsis Information Resource (TAIR) (http://www.arabidopsis.org/, accessed on 15 January 2024) was used to download the Arabidopsis Shaker protein sequences. The genome information of OsShaker K+ channel genes was searched for in the InterPro database, based on the reported Arabidopsis Shaker family members. SMART(http://smart.embl-heidelberg.de/, accessed on 16 January 2024),an online tool, was used to identify the relevant domains (Ion_trans_2 structural domains, cNMP structural domains, ANK structural domains and KHA structural domains). OsShaker K+ channel protein information wsd collected from Rice Date (https://www.ricedata.cn/gene/, accessed on 17 January 2024) and the Rice Genome Annotation Project (http://rice.plantbiology.msu.edu/index.shtml), and utilized TBtools II v2.031 [56] to create chromosomal localization maps.

4.2. Protein Sequence Comparison, Phylogenetic Tree and Gene Duplication Analysis

Sequence comparison and output of the conserved structural domains of OsShaker K+ channel genes were accomplished by MEGA7.0 and geneDoc. The phylogenetic trees of rice, Arabidopsis, barley, soybean, and corn Shaker K+ channel gene family were constructed in MEGA7.0 using the neighbor-joining method., and their amino acid sequences were download from the Ensembl Plants database (https://plants.ensembl.org/index.html, accessed on 22 January 2024) [57]. Analyses with 1000 replicates were conducted to evaluate the phylogenetic tree. The segmental duplication events of Shaker K+ channel gene family proteins between rice and barley were analyzed using TBtools II v2.031. An all-vs-all BLASTP local search was performed among rice and barley to identify potential homologous gene pairs (E < 1 × 10⁻¹⁰). With homologous pairs as input, homologous chains were identified by MCScanX software. The results were presented in the form of Circos plots [56].

4.3. Gene Structure and Conserved Motif Analysis

The coding sequences (CDS) and their corresponding genomic DNA sequences of OsShaker K+ channel genes were downloaded in FASTA format on the Ensembl Plants database (http://plants.ensembl.org/index.html, accessed on 2 February 2024) [57]. Search for the specified genotype number on the Home and click ‘Export data’, and then select GFF3 (Generic Feature Format Version 3) format Output. The distribution of introns and exons and non-coding regions of the genes was mapped using TBtools II v2.031. The online tool MEME (http://meme-suite.org/, accessed on 2 February 2024) was used to search for motifs (we found the most statistically significant (low E-value, E-value < 0.05) motifs), and the conserved motifs were beautified using TBtools II v2.031 [56].

4.4. Protein Physicochemical Properties and Subcellular Localization Analysis

Protein physicochemical properties were analyzed by ExPASy (https://web.expasy.org/protparam/, accessed on 23 January 2024). We perform the compute parameters after keying the protein sequence, then find the corresponding calculation result in the output interface. In addition, we made predictions about subcellular localization through the WoLF (https://wolfpsort.hgc.jp/, accessed on 23 January 2024), and it is important to note here that we first selected the plant option. Nuclear localization sequence analysis by NucPred (https://nucpred.bioinfo.se/nucpred/, accessed on 23 January 2024). The NucPred score was greater than 0.6, the nucleated localization sequence was indicated as “Positive”.

4.5. Protein Structures and Transmembrane Structural Domain Analysis

The secondary and tertiary structures of the protein were analyzed through the SOPMA (https://npsa-prabi.ibcp.fr/cgi-bin/npsa_automat.pl?page=/NPSA/npsa_sopma_f.html, accessed on 12 February 2024) and the SWISS-MODEL (https://swissmodel.expasy.org/, accessed on 13 February 2024), respectively. Among them, the SOPMA website needs to enter the protein sequence, and the Swiss-model website can enter the protein sequence or protein abbreviation. The protein transmembrane structural domains were analysed by the online software tool TMHMM 2.0 (https://services.healthtech.dtu.dk/service.php?DeepTMHMM, accessed on 13 February 2024) [58]. It should be noted here that, after the input of the protein sequence, the following output format has to be selected: ‘Extensive, with graphics’.

4.6. Cis-Acting Elements Analysis

Download 2000 bp upstream of the OsShaker K+ channel genes on the Ensembl (http://plants.ensembl.org/index.html, accessed on 27 January 2024) as the promoter sequence. Select ‘FASTA sequence’ format Output in ‘Export data’. The cis-acting elements predictions of the promoter were performed by PlantCare (http://bioinformatics.psb.ugent.be/webtools/plantcare/html/, accessed on 27 January 2024). After receiving the email from PlantCare, download the file in tab format for preliminary statistical analysis. Then the promoter cis-acting elements were mapped by TBtools II v2.031 software [56,59].

4.7. Plant Growth and Stress Treatments

The Oryza sativa cv. japonica cultivar Zhonghua 11 (ZH11) used in this study was obtained from the China National Rice Research Institute (Hangzhou, China). Seedlings were grown in an artificial climate chamber(Intelligent light incubator #GXM-508C-4, Ningbo Jiangnan Instrument Factory, China) under the following conditions: 14 h of light at 28 °C, 10 h of dark at 24 °C, 70% humidity, and a light intensity 18,000 lx.
Salt treatment: Two-week-old hydroponic seedlings were transferred to the nutrient solution with 140 mM NaCl for treatment, and the shoot and root were taken for gene expression analysis after 5 h of salt stress [28].
Chilling treatment: Two-week-old hydroponic seedlings were treated under cold stress (4 °C). The shoots of the seedlings were collected after 12 h of treatment for RT–qPCR [60].

4.8. RNA Extraction and RT–qPCR Analysis

The total RNA was extracted by using Plant Total RNA Kit (Tiangen Biochemical Technology Co., Ltd. Code: DP432, Beijing, China), and 1 μg RNA was reversed transcribed into cDNA by using HiScriptIII 1st Strand cDNA Synthesis Kit (Vazyme Code: R312-02). PCR amplification was performed using a CFX96 Real-Time PCR Detection System (Bio-Rad, Hercules, CA, USA). The reaction conditions were pre-denaturation at 95 °C for 5 min, denaturation at 94 °C for 30 s, annealing at 60 °C for 40 s, and extension at 72 °C for 20 s. Forty amplification cycles were performed, with three replicates, and the data were processed by 2−ΔΔCt [61,62]. Primer Premier 5 was used to design primers for RT–qPCR, and OsUBQ5 was selected as the internal reference gene.

4.9. Statistical Analysis

Microsoft Excel 2010 and GraphPad Prism 8.0 were used for data analysis and fig. construction. The general linear model procedure in SPSS 21.0 was used for analysis of variance (ANOVA). Mean values were compared using Duncan’s multiple comparison procedure at the 1% or 5% level of probability and the single-sample t-test (* p < 0.05; ** p < 0.01).

5. Conclusions

In this study, genome-wide identification and expression pattern analysis of OsShaker K+ channel genes were performed in rice. Eight OsShaker K+ channel genes were identified in the rice genome and divided into five groups. Members of the same subfamily have similar genetic characteristics. All OsShaker K+ channel proteins were predicted to localized in the cytoplasmic membrane. The promoters of OsShaker K+ channel gene contain certain elements which respond to abiotic stresses. In addition, the RT–qPCR analysis suggested that the expression of OsShaker K+ channel gene was significantly influenced by salt and chilling. According to the findings, it can be concluded that OsShaker K+ channel genes may play an important role in salt stress and chilling stress response. Overall, the results of this study enriched the understanding of the Shaker K+ channel family, providing a theoretical basis for in-depth research on their functions in the response to abiotic stress, as well as the cultivation of new abiotic-tolerant rice varieties.

Supplementary Materials

The following supporting information can be downloaded at: https://www.mdpi.com/article/10.3390/ijms25179728/s1.

Author Contributions

D.X. and Q.T. conceived and designed the project. T.Y., M.D. and Q.T. analyzed the data. Q.T., T.Y., M.D., Y.H. and Y.X., co-wrote the manuscript. D.X., X.Z., Q.T., J.Z., Y.F. and X.C. revised and edited the manuscript. All authors have read and agreed to the published version of the manuscript.

Funding

This study was supported by the China national key R&D program (2022YFE0125600; 2022YFE0139400), National Natural Science Foundation of China (Grant No 32301744), Hangzhou Scientific and Technological Major Project (202203A01), Zhejiang Provincial Natural Science Foundation of China (LY21C130007).

Institutional Review Board Statement

Not applicable.

Informed Consent Statement

Not applicable.

Data Availability Statement

Data are contained within the article and Supplementary Materials.

Conflicts of Interest

The authors declare no conflicts of interest.

References

  1. Liu, C.; Mao, B.; Yuan, D.; Chu, C.; Duan, M. Salt tolerance in rice: Physiological responses and molecular mechanisms. Crop J. 2022, 10, 13–25. [Google Scholar] [CrossRef]
  2. van Zelm, E.; Zhang, Y.; Testerink, C. Salt Tolerance Mechanisms of Plants. Annu. Rev. Plant Biol. 2020, 71, 403–433. [Google Scholar] [CrossRef] [PubMed]
  3. Mukhopadhyay, R.; Sarkar, B.; Jat, H.S.; Sharma, P.C.; Bolan, N.S. Soil salinity under climate change: Challenges for sus-tainable agriculture and food security. J. Environ. Manag. 2021, 280, 111736. [Google Scholar] [CrossRef] [PubMed]
  4. Anschütz, U.; Becker, D.; Shabala, S. Going beyond nutrition: Regulation of potassium homoeostasis as a common denomi-nator of plant adaptive responses to environment. J. Plant Physiol. 2014, 171, 670–687. [Google Scholar] [CrossRef]
  5. Hasanuzzaman, M.; Bhuyan, M.H.M.B.; Nahar, K.; Hossain, M.S.; Mahmud, J.A.; Hossen, M.S.; Masud, A.A.C.; Moumita; Fujita, M. Potassium: A Vital Regulator of Plant Responses and Tolerance to Abiotic Stresses. Agronomy 2018, 8, 31. [Google Scholar] [CrossRef]
  6. Wang, M.; Zheng, Q.; Shen, Q.; Guo, S. The Critical Role of Potassium in Plant Stress Response. Int. J. Mol. Sci. 2013, 14, 7370–7390. [Google Scholar] [CrossRef]
  7. Ismail, A.M.; Horie, T. Genomics, Physiology, and Molecular Breeding Approaches for Improving Salt Tolerance. Annu. Rev. Plant Biol. 2017, 68, 405–434. [Google Scholar] [CrossRef] [PubMed]
  8. Niu, X.; Bressan, R.A.; Hasegawa, P.M.; Pardo, J.M. Ion Homeostasis in NaCl Stress Environments. Plant Physiol. 1995, 109, 735–742. [Google Scholar] [CrossRef] [PubMed]
  9. Fageria, N.K. The Use of Nutrients in Crop Plants; CRC Press: Boca Raton, FL, USA, 2016. [Google Scholar] [CrossRef]
  10. Wang, C.; Xie, Y.; Tan, Z. Soil potassium depletion in global cereal croplands and its implications. Sci. Total. Environ. 2024, 907, 167875. [Google Scholar] [CrossRef]
  11. MacRobbie, E.A. Control of Volume and Turgor in Stomatal Guard Cells. J. Membr. Biol. 2006, 210, 131–142. [Google Scholar] [CrossRef]
  12. Walker, D.J.; Leigh, R.A.; Miller, A.J. Potassium homeostasis in vacuolate plant cells. Proc. Natl. Acad. Sci. USA 1996, 93, 10510–10514. [Google Scholar] [CrossRef] [PubMed]
  13. Nieves, M.; Alemán, F.; Martínez, V.; Rubio, F. K+ uptake in plant roots. The systems involved, their regulation and paral-lels in other organisms. J. Plant Physiol. 2014, 171, 688–695. [Google Scholar] [CrossRef] [PubMed]
  14. Gierth, M.; Mäser, P. Potassium transporters in plants–involvement in K+ acquisition, redistribution and homeostasis. FEBS Lett. 2007, 581, 2348–2356. [Google Scholar] [CrossRef] [PubMed]
  15. Yang, T.; Zhang, S.; Hu, Y.; Wu, F.; Hu, Q.; Chen, G.; Cai, J.; Wu, T.; Moran, N.; Yu, L.; et al. The role of a potassium trans-porter OsHAK5 in potassium acquisition and transport from roots to shoots in rice at low potassium supply levels. Plant Physiol. 2014, 166, 945–959. [Google Scholar] [CrossRef] [PubMed]
  16. Almeida, P.; Katschnig, D.; De Boer, A.H. HKT Transporters—State of the Art. Int. J. Mol. Sci. 2013, 14, 20359–20385. [Google Scholar] [CrossRef]
  17. Cellier, F.; Conéjéro, G.; Ricaud, L.; Luu, D.T.; Lepetit, M.; Gosti, F.; Casse, F. Characterization of AtCHX17, a member of the cation/H+ exchangers, CHX family, from Arabidopsis thaliana suggests a role in K+ homeostasis. Plant J. 2004, 39, 834–846. [Google Scholar] [CrossRef]
  18. Zhu, X.; Pan, T.; Zhang, X.; Fan, L.; Quintero, F.J.; Zhao, H.; Su, X.; Li, X.; Villalta, I.; Mendoza, I.; et al. K+ Efflux Antiporters 4, 5, and 6 Mediate pH and K+ Homeostasis in Endomembrane Compartments. Plant Physiol. 2018, 178, 1657–1678. [Google Scholar] [CrossRef]
  19. Dabravolski, S.A.; Isayenkov, S.V. Recent updates on the physiology and evolution of plant TPK/KCO channels. Funct. Plant Biol. 2023, 50, 17–28. [Google Scholar] [CrossRef]
  20. Lebaudy, A.; Véry, A.A.; Sentenac, H. K+ channel activity in plants: Genes, regulations and functions. FEBS Lett. 2007, 581, 2357–2366. [Google Scholar] [CrossRef]
  21. Voelker, C.; Schmidt, D.; Mueller-Roeber, B.; Czempinski, K. Members of the Arabidopsis AtTPK/KCO family form homomeric vacuolar channels in planta. Plant J. 2006, 48, 296–306. [Google Scholar] [CrossRef]
  22. Véry, A.-A.; Nieves-Cordones, M.; Daly, M.; Khan, I.; Fizames, C.; Sentenac, H. Molecular biology of K+ transport across the plant cell membrane: What do we learn from comparison between plant species? J. Plant Physiol. 2014, 171, 748–769. [Google Scholar] [CrossRef] [PubMed]
  23. Ragel, P.; Raddatz, N.; Leidi, E.O.; Quintero, F.J.; Pardo, J.M. Regulation of K+ Nutrition in Plants. Front. Plant Sci. 2019, 10, 281. [Google Scholar] [CrossRef] [PubMed]
  24. Véry, A.-A.; Sentenac, H. Molecular Mechanisms and Regulation of K+ Transport in Higher Plants. Annu. Rev. Plant Biol. 2003, 54, 575–603. [Google Scholar] [CrossRef]
  25. Lim, C.W.; Kim, S.H.; Choi, H.W.; Luan, S.; Lee, S.C. The Shaker Type Potassium Channel, GORK, Regulates Abscisic Acid Signaling in Arabidopsis. Plant Pathol. J. 2019, 35, 684–691. [Google Scholar] [CrossRef] [PubMed]
  26. Obata, T.; Kitamoto, H.K.; Nakamura, A.; Fukuda, A.; Tanaka, Y. Rice Shaker Potassium Channel OsKAT1 Confers Tolerance to Salinity Stress on Yeast and Rice Cells. Plant Physiol. 2007, 144, 1978–1985. [Google Scholar] [CrossRef] [PubMed]
  27. Huang, Y.N.; Yang, S.Y.; Li, J.L.; Wang, S.F.; Wang, J.J.; Hao, D.L.; Su, Y.H. The rectification control and physiological rele-vance of potassium channel OsAKT2. Plant Physiol. 2021, 187, 2296–2310. [Google Scholar] [CrossRef]
  28. Tian, Q.; Shen, L.; Luan, J.; Zhou, Z.; Guo, D.; Shen, Y.; Jing, W.; Zhang, B.; Zhang, Q.; Zhang, W. Rice shaker potassium channel OsAKT2 positively regulates salt tolerance and grain yield by mediating K+ redistribution. Plant Cell Environ. 2021, 44, 2951–2965. [Google Scholar] [CrossRef]
  29. Zhou, J.; Nguyen, T.H.; Hmidi, D.; Luu, D.T.; Sentenac, H.; Véry, A.A. The outward shaker channel OsK5.2 improves plant salt tolerance by contributing to control of both leaf transpiration and K+ secretion into xylem sap. Plant Cell Environ. 2022, 45, 1734–1748. [Google Scholar] [CrossRef]
  30. Li, J.; Gao, Z.; Zhou, L.; Li, L.; Zhang, J.; Liu, Y.; Chen, H. Comparative transcriptome analysis reveals K+ transporter gene contributing to salt tolerance in eggplant. BMC Plant Biol. 2019, 19, 1–18. [Google Scholar] [CrossRef]
  31. Feng, C.; He, C.; Wang, Y.; Xu, H.; Xu, K.; Zhao, Y.; Yao, B.; Zhang, Y.; Zhao, Y.; Carther, K.F.I.; et al. Genome-wide identification of soybean Shaker K+ channel gene family and functional characterization of GmAKT1 in transgenic Arabidopsis thaliana under salt and drought stress. J. Plant Physiol. 2021, 266, 153529. [Google Scholar] [CrossRef]
  32. Wang, X.; Zhao, J.; Fang, Q.; Chang, X.; Sun, M.; Li, W.; Li, Y. GmAKT1 is involved in K+ uptake and Na+/K+ homeostasis in Arabidopsis and soybean plants. Plant Sci. 2020, 304, 110736. [Google Scholar] [CrossRef]
  33. Ma, Q.; Hu, J.; Zhou, X.R.; Yuan, H.J.; Kumar, T.; Luan, S.; Wang, S.M. ZxAKT1 is essential for K+ uptake and K+/Na+ homeo-stasis in the succulent xerophyte Zygophyllum xanthoxylum. Plant J. 2017, 90, 48–60. [Google Scholar] [CrossRef]
  34. Chen, G.; Chen, Q.; Qi, K.; Xie, Z.; Yin, H.; Wang, P.; Wang, R.; Huang, Z.; Zhang, S.; Wang, L.; et al. Identification of Shaker K+ channel family members in Rosaceae and a functional exploration of PbrKAT1. Planta. 2019, 250, 1911–1925. [Google Scholar] [CrossRef]
  35. Assaha, D.V.M.; Ueda, A.; Saneoka, H.; Al-Yahyai, R.; Yaish, M.W. The role of Na+ and K+ transporters in salt stress adaptation in glycophytes. Front. Physiol. 2017, 8, 509. [Google Scholar] [CrossRef] [PubMed]
  36. Hedrich, R. Ion Channels in Plants. Physiol. Rev. 2012, 92, 1777–1811. [Google Scholar] [CrossRef]
  37. Siddique, M.H.; Babar, N.I.; Zameer, R.; Muzammil, S.; Nahid, N.; Ijaz, U.; Masroor, A.; Nadeem, M.; Rashid, M.A.R.; Hashem, A.; et al. Genome-Wide Identification, Genomic Organization, and Characterization of Potassium Transport-Related Genes in Cajanus cajan and Their Role in Abiotic Stress. Plants 2021, 10, 2238. [Google Scholar] [CrossRef] [PubMed]
  38. Azeem, F.; Zameer, R.; Rehman Rashid, M.A.; Rasul, I.; Ul-Allah, S.; Siddique, M.H.; Fiaz, S.; Raza, A.; Younas, A.; Rasool, A.; et al. Genome-wide analysis of potassium transport genes in Gossypium rai-mondii suggest a role of GrHAK/KUP/KT8, GrAKT2.1 and GrAKT1.1 in response to abiotic stress. Plant Physiol. Biochem. 2022, 170, 110–122. [Google Scholar] [CrossRef] [PubMed]
  39. Azeem, F.; Ahmad, B.; Atif, R.M.; Ali, M.A.; Nadeem, H.; Hussain, S.; Manzoor, H.; Azeem, M.; Afzal, M. Genome-Wide Analysis of Potassium Transport-Related Genes in Chickpea (Cicer arietinum L.) and Their Role in Abiotic Stress Responses. Plant Mol. Biol. Rep. 2018, 36, 451–468. [Google Scholar] [CrossRef]
  40. Kumar, S.A.; Kumari, P.H.; Nagaraju, M.; Reddy, P.S.; Dheeraj, T.D.; Mack, A.; Katam, R.; Kishor, P.B.K. Genome-wide identification and multiple abiotic stress transcript profiling of potassium transport gene homologs in Sorghum bicolor. Front. Plant Sci. 2022, 13, 965530. [Google Scholar] [CrossRef]
  41. Philippar, K.; Büchsenschütz, K.; Abshagen, M.; Fuchs, I.; Geiger, D.; Lacombe, B.; Hedrich, R. The K+ Channel KZM1 Mediates Potassium Uptake into the Phloem and Guard Cells of the C4 Grass Zea mays. J. Biol. Chem. 2003, 278, 16973–16981. [Google Scholar] [CrossRef]
  42. Boscari, A.; Clément, M.; Volkov, V.; Golldack, D.; Hybiak, J.; Miller, A.J.; Amtmann, A.; Fricke, W. Potassium channels in barley: Cloning, functional characterization and expression analyses in relation to leaf growth and development. Plant Cell Environ. 2009, 32, 1761–1777. [Google Scholar] [CrossRef] [PubMed]
  43. Hausner, G.; Hafez, M.; Edgell, D.R. Bacterial group I introns: Mobile RNA catalysts. Mob. DNA 2014, 5, 8. [Google Scholar] [CrossRef] [PubMed]
  44. Shen, L.; Tian, Q.; Yang, L.; Zhang, H.; Shi, Y.; Shen, Y.; Zhou, Z.; Wu, Q.; Zhang, Q.; Zhang, W. Phosphatidic acid directly binds with rice potassium channel OsAKT2 to inhibit its activity. Plant J. 2020, 102, 649–665. [Google Scholar] [CrossRef]
  45. Yu, T.; Cen, Q.; Kang, L.; Mou, W.; Zhang, X.; Fang, Y.; Zhang, X.; Tian, Q.; Xue, D. Identification and expression pattern analysis of the OsSnRK2 gene family in rice. Front. Plant Sci. 2022, 13, 1088281. [Google Scholar] [CrossRef] [PubMed]
  46. Sánchez-Barrena, M.J.; Chaves-Sanjuan, A.; Raddatz, N.; Mendoza, I.; Cortés, Á.; Gago, F.; González-Rubio, J.M.; Benavente, J.L.; Quintero, F.J.; Pardo, J.M.; et al. Recognition and Activation of the Plant AKT1 Potassium Channel by the Kinase CIPK23. Plant Physiol. 2020, 182, 2143–2153. [Google Scholar] [CrossRef]
  47. Li, J.; Long, Y.; Qi, G.-N.; Li, J.; Xu, Z.-J.; Wu, W.-H.; Wang, Y. The Os-AKT1 Channel Is Critical for K+ Uptake in Rice Roots and Is Modulated by the Rice CBL1-CIPK23 Complex. Plant Cell 2014, 26, 3387–3402. [Google Scholar] [CrossRef]
  48. Ahmad, I.; Mian, A.; Maathuis, F.J.M. Overexpression of the rice AKT1 potassium channel affects potassium nutrition and rice drought tolerance. J. Exp. Bot. 2016, 67, 2689–2698. [Google Scholar] [CrossRef]
  49. Gierth, M.; Mäser, P.; Schroeder, J.I. The Potassium Transporter AtHAK5 Functions in K+ Deprivation-Induced High-Affinity K+ Uptake and AKT1 K+ Channel Contribution to K+ Uptake Kinetics in Arabidopsis Roots. Plant Physiol. 2005, 137, 1105–1114. [Google Scholar] [CrossRef]
  50. Szyroki, A.; Ivashikina, N.; Dietrich, P.; Roelfsema, M.R.G.; Ache, P.; Reintanz, B.; Deeken, R.; Godde, M.; Felle, H.; Steinmeyer, R.; et al. KAT1 is not essential for stomatal opening. Proc. Natl. Acad. Sci. USA 2001, 98, 2917–2921. [Google Scholar] [CrossRef]
  51. Adem, G.D.; Chen, G.; Shabala, L.; Chen, Z.H.; Shabala, S. GORK Channel: A Master Switch of Plant Metabolism? Trends Plant Sci. 2020, 25, 434–445. [Google Scholar] [CrossRef]
  52. Eisenach, C.; Papanatsiou, M.; Hillert, E.K.; Blatt, M.R. Clustering of the K+ channel GORK of Arabidopsis parallels its gat-ing by extracellular K+. Plant J. 2014, 78, 203–214. [Google Scholar] [CrossRef]
  53. Nieves-Cordones, M.; Caballero, F.; Martínez, V.; Rubio, F. Disruption of the Arabidopsis thaliana Inward-Rectifier K+ Channel AKT1 Improves Plant Responses to Water Stress. Plant Cell Physiol. 2011, 53, 423–432. [Google Scholar] [CrossRef] [PubMed]
  54. Feng, X.; Liu, W.; Qiu, C.W.; Zeng, F.; Wang, Y.; Zhang, G.; Chen, Z.H.; Wu, F. HvAKT2 and HvHAK1 confer drought toler-ance in barley through enhanced leaf mesophyll H+ homoeostasis. Plant Biotechnol. J. 2020, 18, 1683–1696. [Google Scholar] [CrossRef] [PubMed]
  55. Golldack, D.; Quigley, F.; Michalowski, C.B.; Kamasani, U.R.; Bohnert, H.J. Salinity stress-tolerant and -sensitive rice (Oryza sativa L.) regulate AKT1-type potassium channel transcripts differently. Plant Mol. Biol. 2003, 51, 71–81. [Google Scholar] [CrossRef] [PubMed]
  56. Chen, C.; Chen, H.; Zhang, Y.; Thomas, H.R.; Frank, M.H.; He, Y.; Xia, R. TBtools: An Integrative Toolkit Developed for Inter-active Analyses of Big Biological Data. Mol. Plant. 2020, 13, 1194–1202. [Google Scholar] [CrossRef]
  57. Kinsella, R.J.; Kähäri, A.; Haider, S.; Zamora, J.; Proctor, G.; Spudich, G.; Almeida, J.; Staines, D.; Derwent, P.; Kerhornou, A.; et al. Ensembl BioMarts: A hub for data retrieval across taxonomic space. Database 2011, 2011, bar030. [Google Scholar] [CrossRef]
  58. Krogh, A.; Larsson, B.; von Heijne, G.; Sonnhammer, E.L. Predicting transmembrane protein topology with a hidden Mar-kov model: Application to complete genomes. J. Mol. Biol. 2001, 305, 567–580. [Google Scholar] [CrossRef]
  59. Lescot, M.; Déhais, P.; Thijs, G.; Marchal, K.; Moreau, Y.; Van de Peer, Y.; Rouzé, P.; Rombauts, S. PlantCARE, a database of plant cis-acting regulatory elements and a portal to tools for in silico analysis of promoter sequences. Nucleic Acids Res. 2002, 30, 325–327. [Google Scholar] [CrossRef]
  60. Zhang, M.; Zhao, R.; Huang, K.; Huang, S.; Wang, H.; Wei, Z.; Li, Z.; Bian, M.; Jiang, W.; Wu, T.; et al. The OsWRKY63–OsWRKY76–OsDREB1B module regulates chilling tolerance in rice. Plant J. 2022, 112, 383–398. [Google Scholar] [CrossRef]
  61. Livak, K.J.; Schmittgen, T.D. Analysis of relative gene expression data using real-time quantitative PCR and the 2(-Delta Delta C(T)) Method. Methods. 2001, 25, 402–408. [Google Scholar] [CrossRef]
  62. Rathor, P.; Borza, T.; Stone, S.; Tonon, T.; Yurgel, S.; Potin, P.; Prithiviraj, B. A Novel Protein from Ectocarpus sp. Improves Salinity and High Temperature Stress Tolerance in Arabidopsis thaliana. Int. J. Mol. Sci. 2021, 22, 1971. [Google Scholar] [CrossRef] [PubMed]
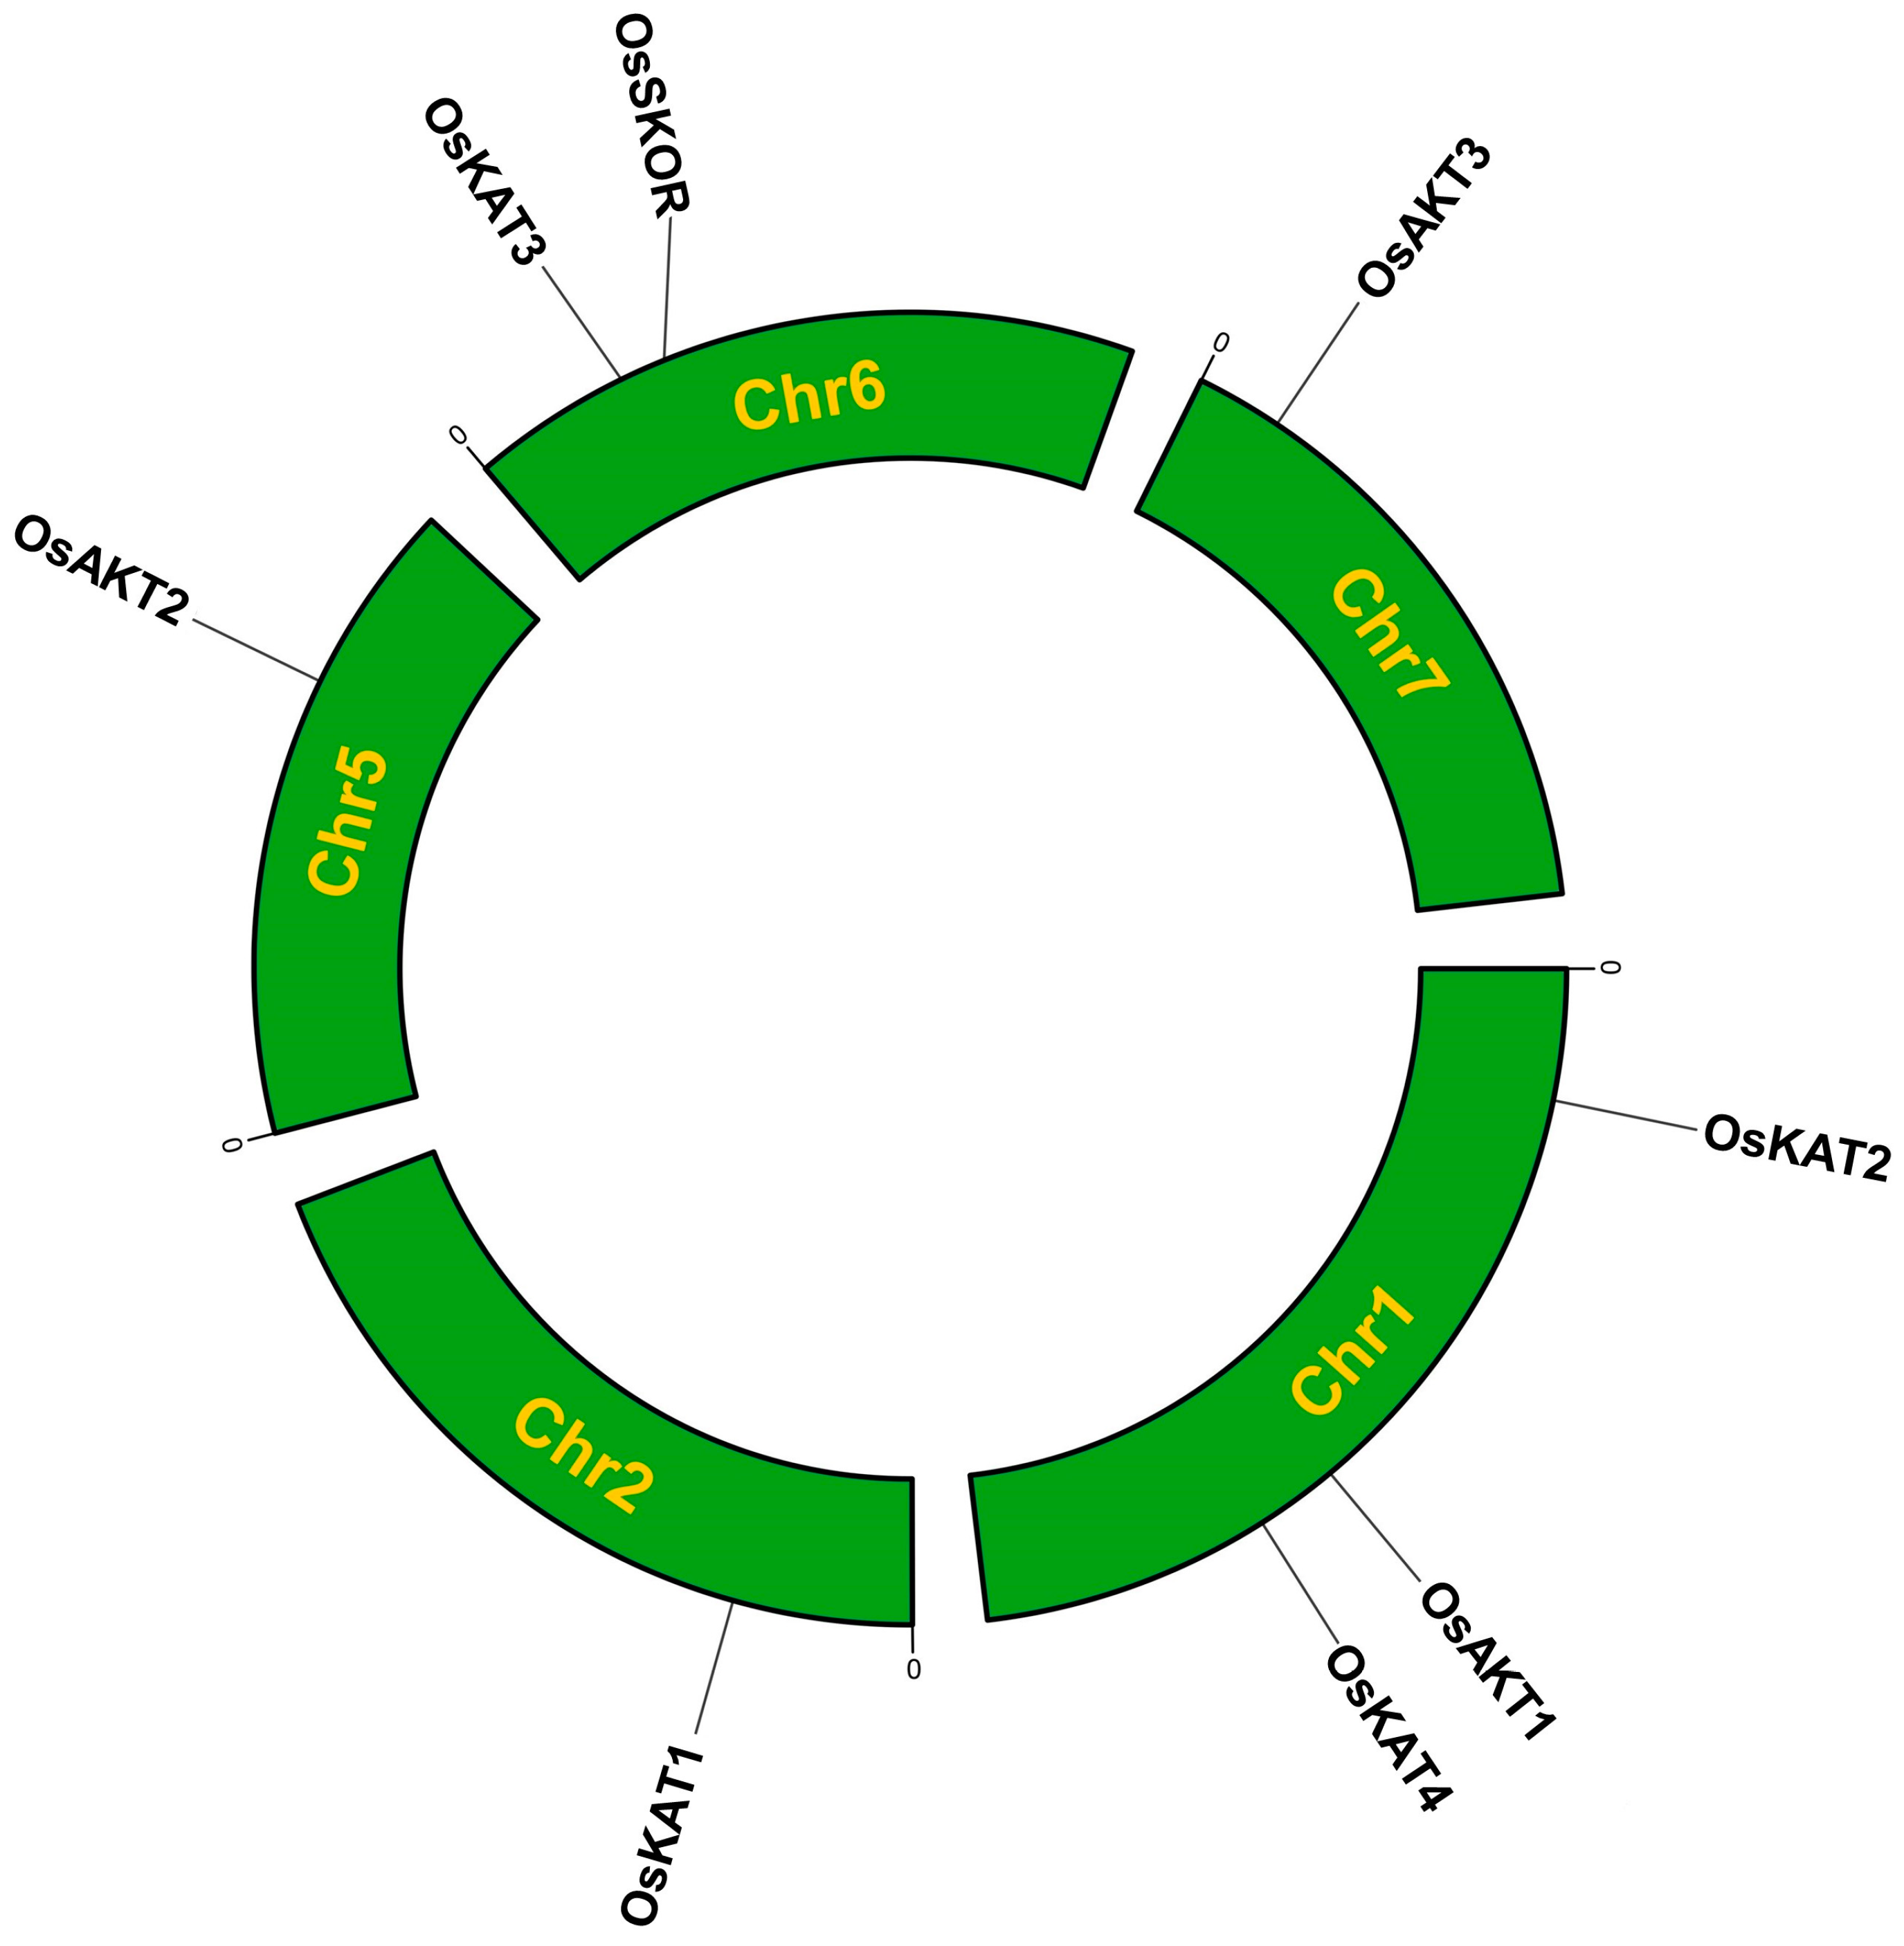
Figure 1. Chromosome localization analysis of Shaker K+ channel genes in rice. The green arc length represents chromosome length.
Ijms 25 09728 g001
Figure 2. Analysis of protein sequence, gene structure and motifs of the OsShaker K+ channel proteins. (a) Protein sequence comparison of the OsShaker K+ channel, the underlining in different colors representing different structural domains. (b) Analysis of the gene structure of OsShaker K+ channel genes, containing introns, exons, and UTR region, indicated by the black line, yellow and green rectangles, respectively. (c) Analysis of conserved motifs of the OsShaker K+ channel proteins, different colored rectangles representing different motifs. (d) Sequence Logo of the OsShaker K+ channel protein motifs. Different letters represent different amino acids.
Ijms 25 09728 g002
Figure 3. Phylogenetic, gene duplication and collinearity analysis of OsShaker K+ channel genes. (a) Phylogenetic analysis of the Shaker gene in Oryza sativa, Arabidopsis thaliana, Hordeum vulgare, Zea mays, Glycine max, Cajanus cajan, Gossypium raimondii, Cicer arietinum, Sorghum bicolor. Oryza sativa, Arabidopsis thaliana, Hordeum vulgare, Zea mays, Glycine max, Cajanus cajan, Gossypium raimondii, Cicer arietinum, Sorghum bicolor are prefixed with Os, At, Hv, Zm, Gm, Cc, Gr, Car and Sb, respectively. (b) Gene segmental duplications of the OsShaker K+ channel genes; the red curve represents one pair of segmental duplicated genes. The scale bar at the periphery of the chromosome represents the physical location (Kb). (c) Collinearity analysis of OsShaker K+ genes in rice and barley.
Ijms 25 09728 g003
Figure 4. Protein 3D structure prediction model of OsShaker K+ channel proteins. AlphaFold produces a per-residue confidence score (pLDDT) between 0 and 100.
Ijms 25 09728 g004
Figure 5. Transmembrane structure analysis of OsShaker K+ channel proteins.
Ijms 25 09728 g005
Figure 6. Prediction of cis-acting elements in OsShaker K+ channel genes promoter. Promoter sequences (−2 Kb) of OsShaker K+ channel genes were analyzed by PlantCARE. Different cis-elements are represented by different colors.
Ijms 25 09728 g006
Figure 7. Protein–protein interaction (PPI) network analysis of OsShaker K+ channel proteins. Nodes represent proteins with direct interactions, and colors represent interaction frequencies; edges represent different types of interactions, and colors represent the strength of interactions.
Ijms 25 09728 g007
Figure 8. Tissue expression pattern of OsShaker K+ channel genes. (a) The expression profiles of the OsShaker K+ channel genes in the indica rice variety Minghui 63 obtained through the CREP database. The color scale represents relative expression levels from low (blue) to high (red). (b) The expression of OsShaker K+ channel genes in root, shoot, stem, leaf, and panicle. OsUBQ5 was used for internal parameter, and transcript abundance was normalized to Stem. The data represent means ± standard deviation (n = 3); different letters indicate significant differences.
Ijms 25 09728 g008
Figure 9. The expression analysis of OsShaker K+ channel genes under salt stress. OsUBQ5 was used for normalization, and transcript abundance was normalized to Control. The data represent means ± standard deviation (n = 3). Asterisks represents significant differences from Control (* p < 0.05; ** p < 0.01) by Student’s t-test; ns indicates no significant difference.
Ijms 25 09728 g009
Figure 10. The expression analysis of OsShaker K+ channel genes with chilling treatment. The data represent means ± standard deviation (n = 3). OsUBQ5 was used for normalization, and transcript abundance was normalized to Control. Asterisks represents significant differences from Control (* p < 0.05; ** p < 0.01) by Student’s t-test; ns indicates no significant difference.
Ijms 25 09728 g010
Table 1. Physiochemical properties of the OsShaker K+ channel genes.
NameGene IDAccession NumberChromosome PositionLength
(aa)
MW
(kDa)
PIGRAVYLocalizationNLS
Predicts
OsAKT1Os01g0648000LOC_Os01g45990Chr1935102.026.78−0.149PlasNA
OsAKT2Os05g0428700LOC_Os05g35410Chr570376.706.40−0.071PlasNA
OsAKT3Os07g0175400LOC_Os07g07910Chr771177.4610.9−0.355PlasPositive
OsKAT1Os02g0245800LOC_Os02g14840Chr271881.036.76−0.243PlasPositive
OsKAT2Os01g0210700LOC_Os01g11250Chr160168.178.57−0.076PlasNA
OsKAT3Os06g0254200LOC_Os06g14310Chr661067.739.030.149PlasNA
OsKAT4Os01g0718700LOC_Os01g52070Chr137341.679.190.308PlasNA
OsSKOROs06g0250600LOC_Os06g14030Chr685895.105.66−0.211PlasNA
Note: MW, Molecular weight (kDa); pI, Isoelectric point; GRAVY, Grand average of hydropathicity; NLS predicts, Nuclear Localization Signal predicts. Plas, Plasma membrane. “NA” is an abbreviation for “Not Available” and indicates no NLS. “Positive” indicates the presence of NLS.
Table 2. Secondary structure analysis of OsShaker K+ channel proteins.
Protein NamePercentageDistribution of Secondary Structure Elements
Ah
Ijms 25 09728 i001
Bt
Ijms 25 09728 i002
Rc
Ijms 25 09728 i003
Es
Ijms 25 09728 i004
OsAKT140.437.3837.8614.33Ijms 25 09728 i005
OsAKT243.107.1133.7116.07
OsAKT340.797.5035.5016.21
OsKAT141.364.3238.0216.30
OsKAT247.924.9928.7918.30
OsKAT346.394.7530.0018.85
OsKAT445.365.9029.5119.22
OsSKOR44.768.2830.8916.08
Note: In the secondary structure component distribution diagram, the blue structure represents Alpha helix (Ah), the green structure represents Beta turn (Bt), the yellow structure represents Random coil (Rc), and the red structure represents Extended strand (Es).
Disclaimer/Publisher’s Note: The statements, opinions and data contained in all publications are solely those of the individual author(s) and contributor(s) and not of MDPI and/or the editor(s). MDPI and/or the editor(s) disclaim responsibility for any injury to people or property resulting from any ideas, methods, instructions or products referred to in the content.