Article

QTL Analysis for Rice Quality-Related Traits and Fine Mapping of qWCR3

1
National Key Laboratory of Crop Genetic Improvement and National Center of Plant Gene Research, Hubei Hongshan Laboratory, Huazhong Agricultural University, Wuhan 430070, China
2
Institute of Crop Germplasm Resources, Guizhou Academy of Agriculture Science, Guiyang 550006, China
3
College of Life Science, Heilongjiang University, Harbin 150080, China
*
Authors to whom correspondence should be addressed.
These authors contributed equally to this work.
Int. J. Mol. Sci. 2024, 25(8), 4389; https://doi.org/10.3390/ijms25084389
Submission received: 1 March 2024 / Revised: 27 March 2024 / Accepted: 9 April 2024 / Published: 16 April 2024
(This article belongs to the Special Issue Molecular Research for Cereal Grain Quality 2.0)

Abstract

:
The quality of rice, evaluated using multiple quality-related traits, is the main determinant of its market competitiveness. In this study, two japonica rice varieties with significant differences in quality-related traits were used as parents to construct two populations, BC3F2 and BC3F2:3, with Kongyu131 (KY131) as the recurrent parent. A genetic linkage map was constructed using the BC3F2 population based on 151 pairs of SSR/InDel polymorphic markers selected between the parents. Grain-shape-related traits (grain length GL, grain width GW, and length-to-width ratio LWR), chalkiness-related traits (white-core rate WCR, white-belly rate WBR, white-back rate BR, and chalkiness rate CR), and amylose content (AC) were investigated in the two populations in 2017 and 2018. Except for BR and CR, the traits showed similar characteristics with a normal distribution in both populations. Genetic linkage analysis was conducted for these quality-related traits, and a total of 37 QTLs were detected in the two populations. Further validation was performed on the newly identified QTLs with larger effects, and three grain shape QTLs and four chalkiness QTLs were successfully validated in different environments. One repeatedly validated QTL, qWCR3, was selected for fine mapping and was successfully narrowed down to a 100 kb region in which only two genes, LOC_0s03g45210 and LOC_0s03g45320, exhibited sequence variations between the parents. Furthermore, the variation of LOC_Os03g45210 leads to a frameshift mutation and premature protein termination. The results of this study provide a theoretical basis for positional cloning of the qWCR3 gene, thus offering new genetic resources for rice quality improvement.

1. Introduction

As one of the main food crops, rice (Oryza sativa L.) feeds billions of people worldwide [1]. With increasing living standards, the demand of consumers has shifted the goal of rice breeding toward the improvement of rice grain quality [2]. Rice quality is a complex trait that includes milling quality, appearance quality, nutrition quality, eating and cooking quality (ECQ), and hygiene quality [3]. Among these, appearance quality (which is mainly determined by grain shape and chalkiness [4]) and ECQ (which is mainly determined by the amylose content) are the primary factors affecting the market value of rice [3].
Grain shape, which affects rice yield and quality simultaneously, is determined according to three traits: grain length, grain width, and grain thickness. Although a great number of major genes regulating grain shape have been cloned in recent years, there are still many minor genes to be discovered [5].
Chalkiness can be divided into white-belly, white-core, and white-back based on its distribution on the rice grain [6]. Chalkiness is an undesirable trait for consumers that negative affects rice grain appearance quality, milling quality, and ECQ [7]. The formation of chalkiness is regulated by both genetic factors and environmental factors [8]. Over past few decades, many chalkiness QTLs (quantitative trait loci) have been identified [9], but only a major chalkiness gene Chalk5 and a major white-core gene WCR1 have been cloned [10,11]. Chalk5 encodes a vacuolar H+-translocating pyrophosphatase (V-ppase) which disrupts the pH homeostasis of the developing endomembrane transport system, thereby affecting the biogenesis of protein bodies and forming air gaps between storage component in the endosperm, ultimately leading to chalkiness [10]. WCR1 encodes an F-box protein. OsDOF17 binds to the WCR1 promoter to increase its transcription level to promote the transcription of MT2b and inhibit 26S proteasome-mediated MT2b degradation, promoting the elimination of excess ROS, maintaining redox homeostasis, and delaying programmed cell death (PCD) in the endosperm, ultimately leading to a decrease in the white-core rate [11]. Thus, discovering more chalkiness genes is conducive to deepening our understanding of rice chalkiness.
Eating and cooking quality is reflected in multiple indices, including amylose content (AC), gel consistency (GC), gelatinization temperature (GT), and aroma and taste value [3]. AC is mainly regulated by a gene specifically expressed by the endosperm, Wx/GBSSI, which fluctuates between 0% to 30% according to the different allele of Wx [12]. However, there are also many minor genes that affect AC, such as Osbzip58, OsBP5, and Du1 [13,14,15].
In this study, two back-cross populations derived from two rice cultivars (Cypress and KY131) were developed and used for QTL mapping of the rice grain shape, chalkiness, and AC. As a result, 18 grain shape QTLs, 18 chalkiness QTLs, and 1 AC QTL were detected. The genetic effects of three grain shape QTLs—qGL7.2, qLWR7.2, and qGW3—and three chalkiness QTLs—qBR2, qWCR3, and qWCR11—were then confirmed in a random population. Using the progeny test method, qWCR3 was fine-mapped to a 100 kb region of chromosome 3.

2. Results

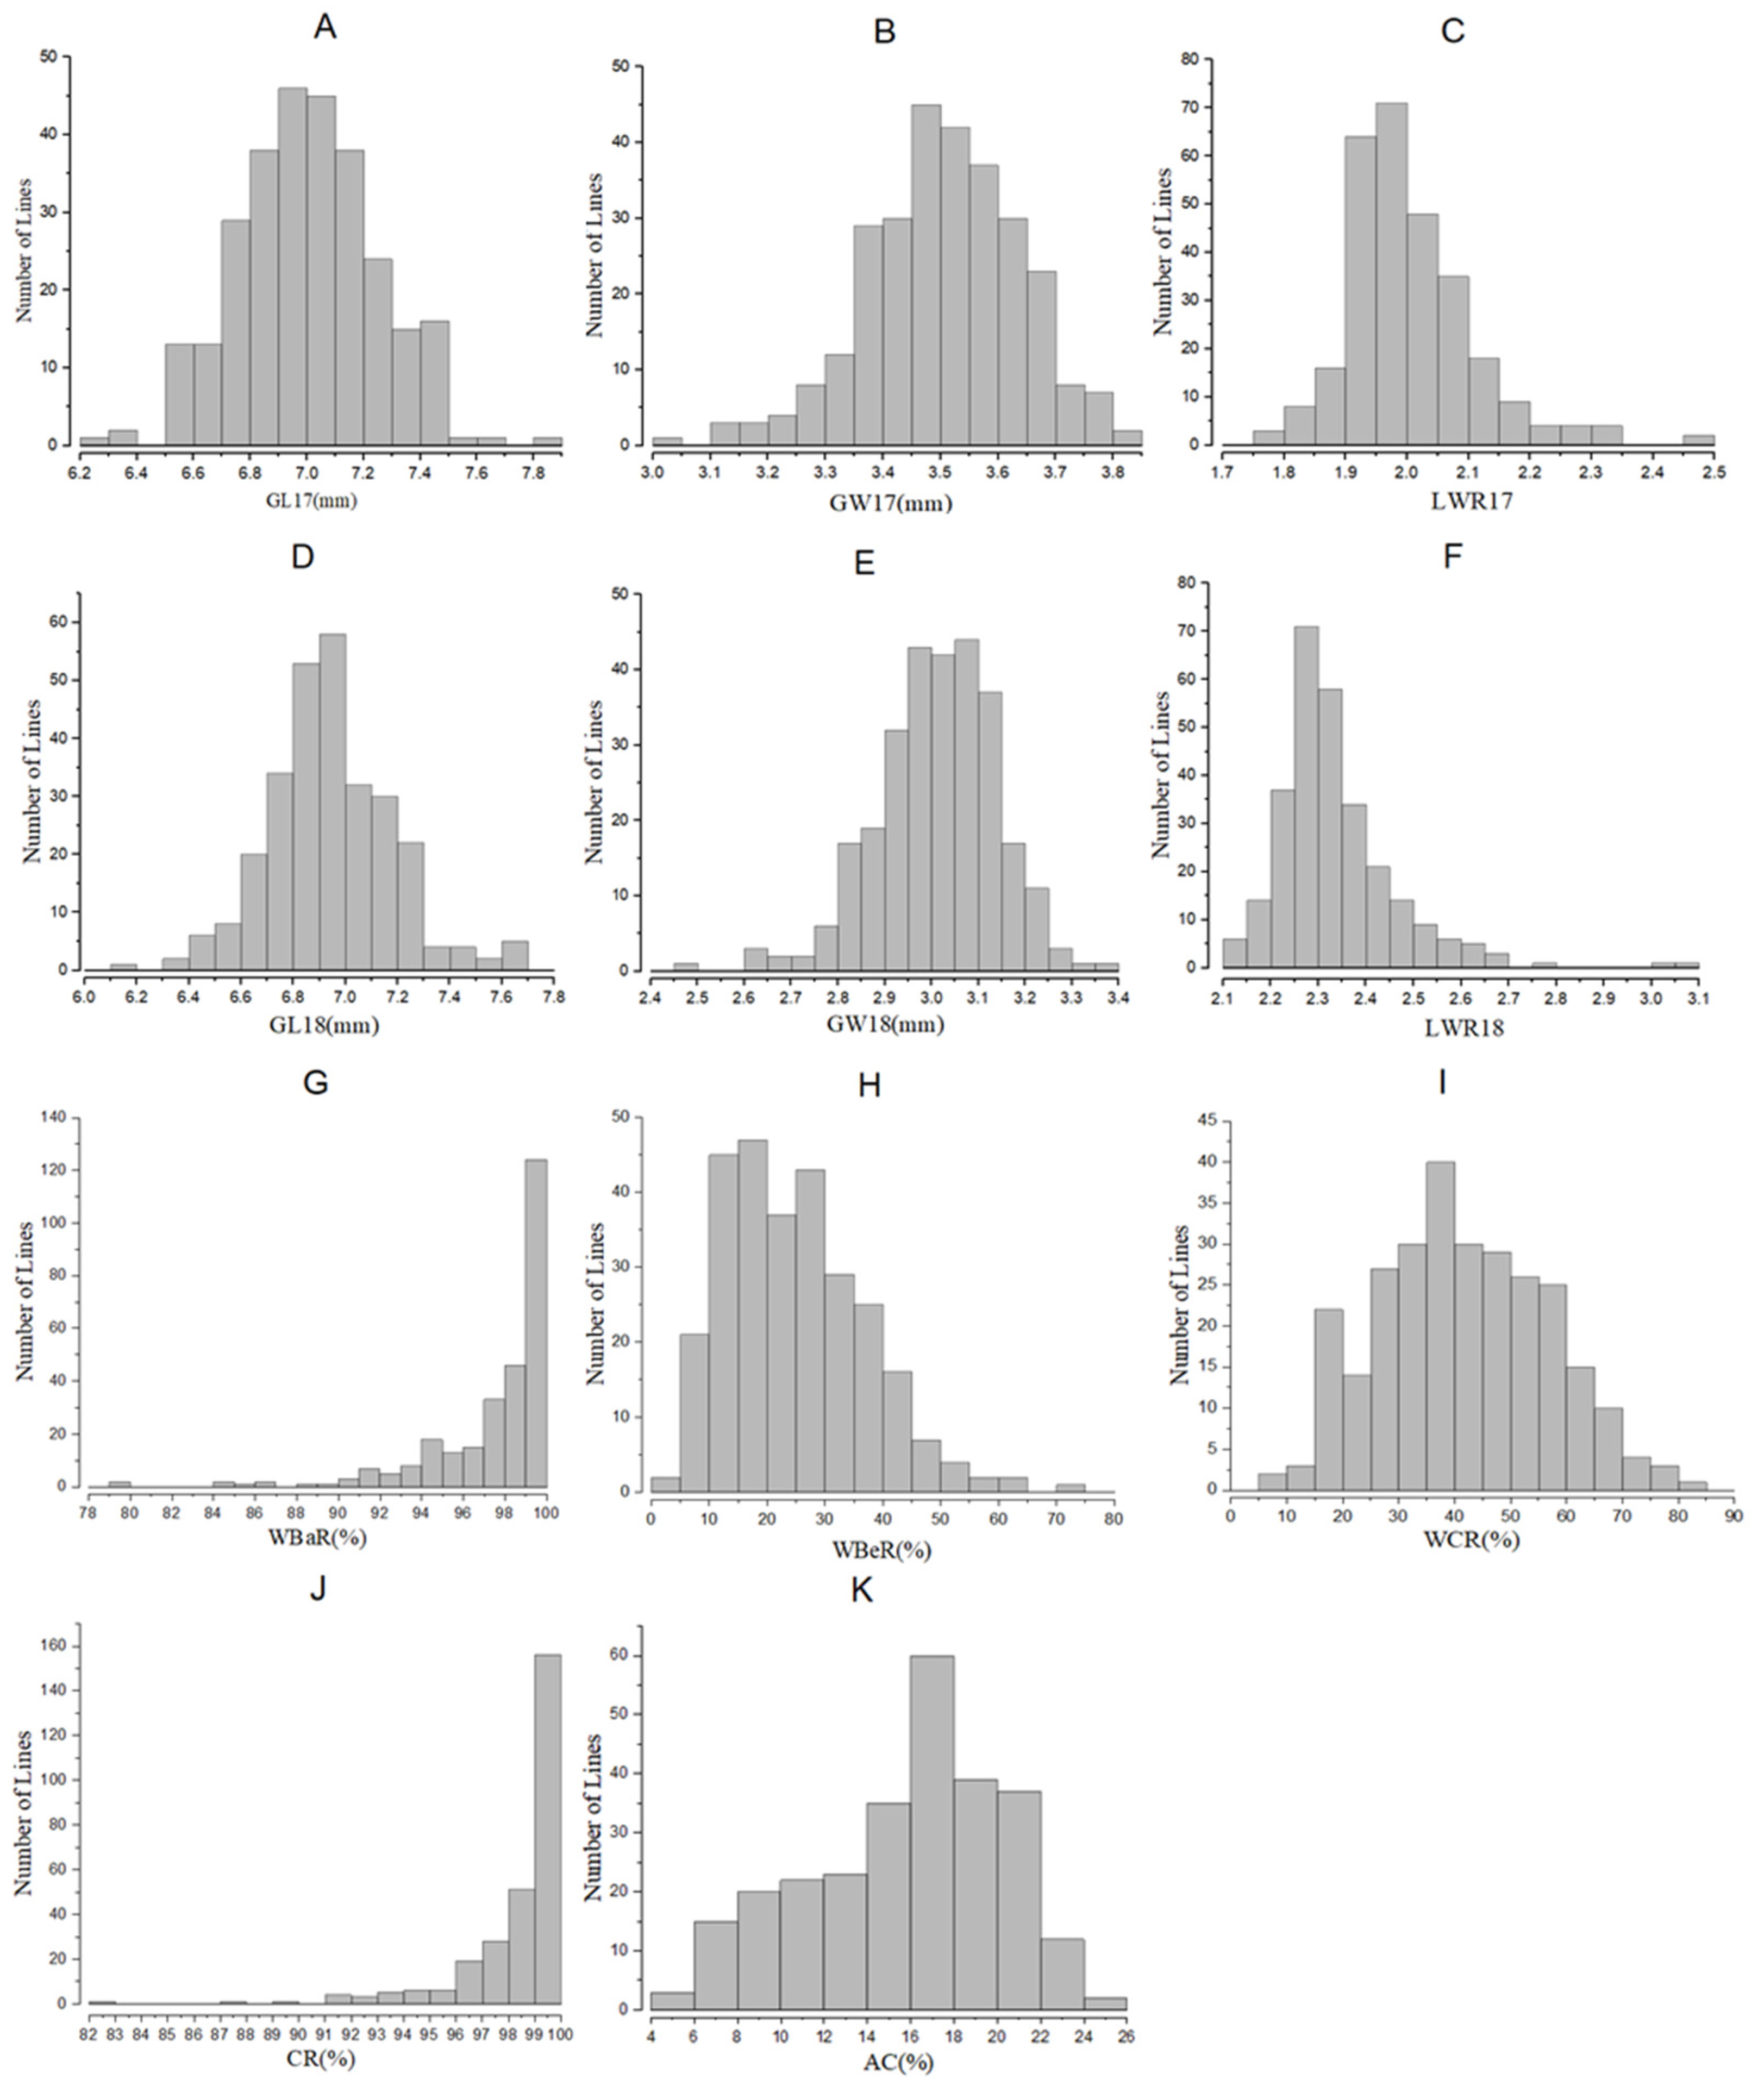
2.1. Phenotype Variation in BC3F2 and BC3F2:3 Populations

The grain length (GL), grain width (GW), length-to-width ratio (LWR), and amylose content (AC) had consistently higher values in Cypress than in KY131, while an opposite trend was observed for white-core rate (WCR), white-belly rate (WBR), white-back rate (BR), and chalkiness rate (CR) in both the BC3F2 (Hainan 2017) and BC3F2:3 populations (Wuhan 2018; Table 1). The GL, GW, and LWR in BC3F2 and BC3F2:3 populations showed a normal distribution (Figure 1A–F), as well as WBR, WCR, and AC in the BC3F2:3 population (Figure 1H,I,K); however, BR and CR showed skewed distributions in the BC3F2:3 population (Figure 1G,J).
Correlation analysis was conducted for all traits in the BC3F2:3 population. Among grain-shape-related traits, an extremely significant positive correlation was detected between GL and LWR, while an extremely significant negative correlation was found between GW and LWR. Among the chalkiness-related traits, BR was positively correlated to CR with high significance, and there were also significant positive correlations among WCR, WBR, and CR (Table 2). Moreover, GL was significantly positively correlated to WBR, while GW was negatively correlated to WBR and WCR with high significance.

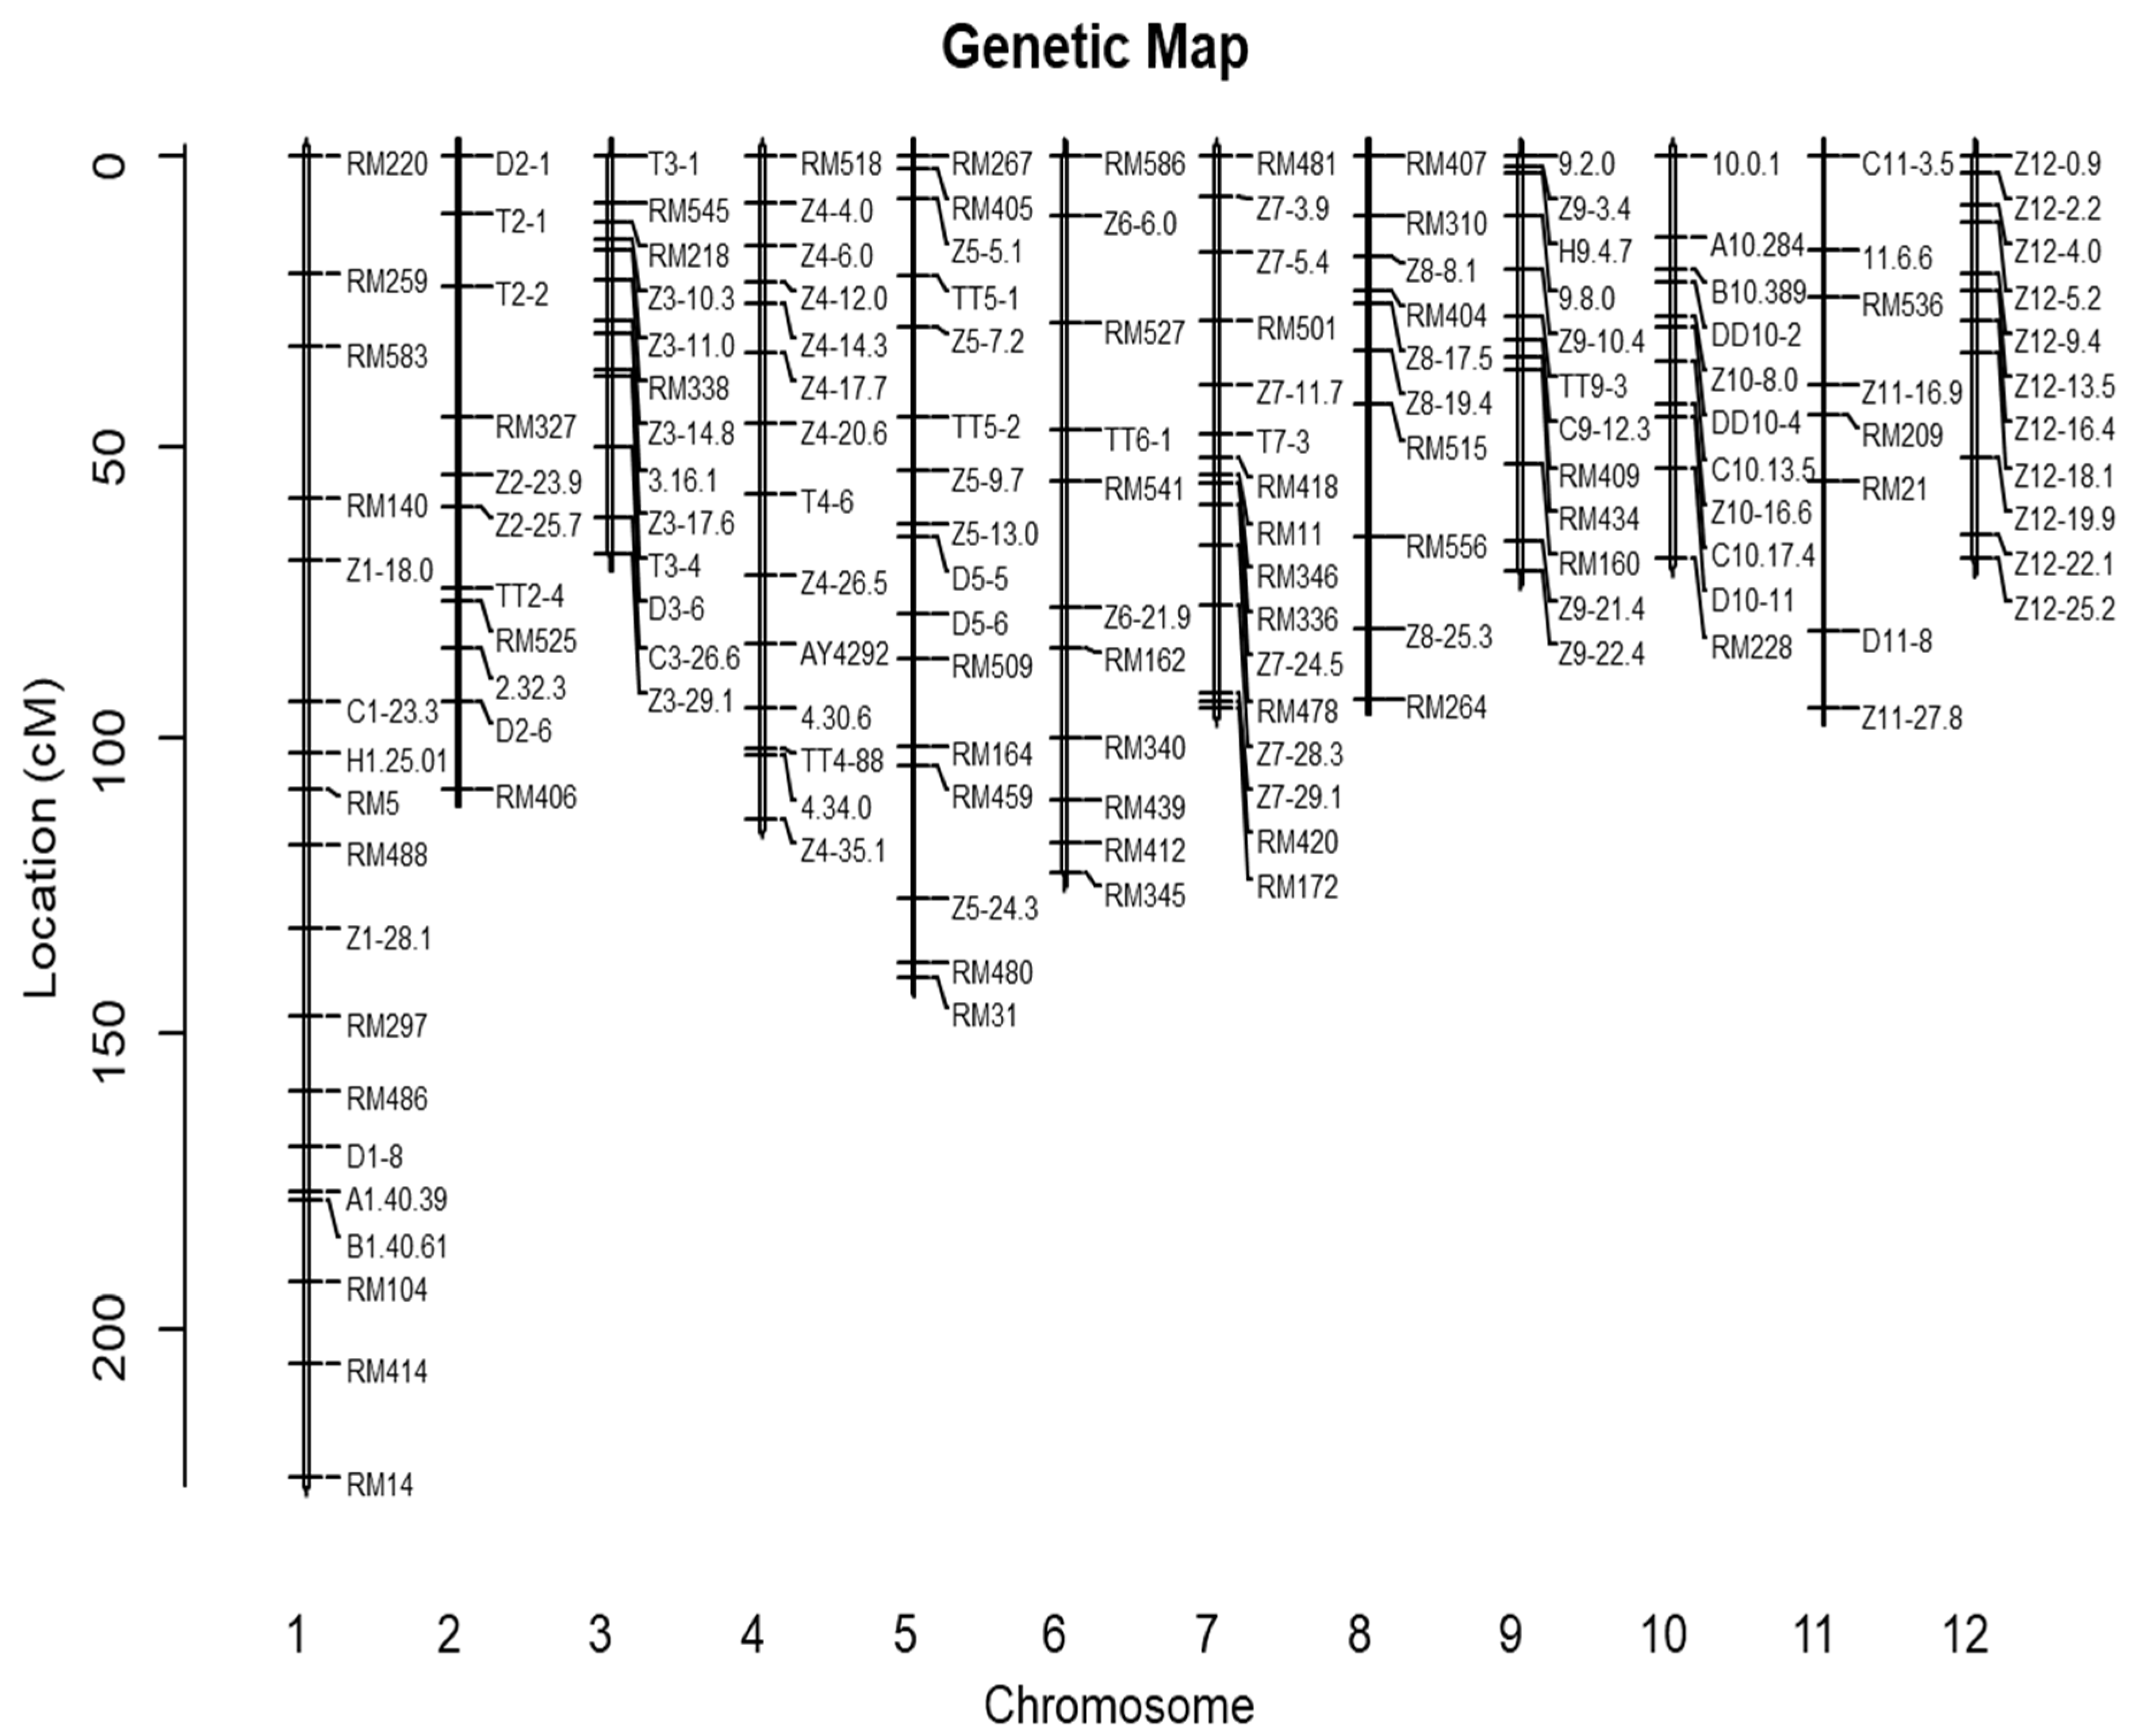
2.2. Construction of Genetic Linkage Map

After screening nearly 1000 markers, 151 SSR (simple sequence repeat) and InDel (insertion and deletion) polymorphic makers between KY131 and Cypress were selected for genetic linkage map construction (Table S1). As a result, the genetic map covered a 948.6 cM genome region with an average interval size of 6.3 cM (Figure 2).

2.3. 37 QTLs Were Detected in BC3F2 and BC3F2:3 Populations

Using the genetic linkage analysis method, a total of 37 QTLs were detected on 11 chromosomes (excluding chromosome 10) in the BC3F2 and BC3F2:3 populations (Table 3).
A total of 18 grain-shape-related QTLs were found, of which there were seven for GL (qGL3, qGL4, qGL6, qGL7.1, qGL7.2, qGL7.3, and qGL8); the phenotypic variance explained by each QTL for GL ranged from 4.55% to 20.60%, and qGL7.1 was detected repeatedly both years. There were six QTLs for GW (qGW1, qGW3, qGW5.1, qGW5.2, qGW7.1, and qGW7.2), with qGW3 and qGW7.2 located in the same intervals as qGL3 and qGL7.2, respectively. We also detected five QTLs for LWR (qLWR3, qLWR5, qLWR7.1, qLWR7.2, and qLWR9), of which qLWR5 and qLWR7.1 were detected repeatedly both years, and qLWR7.1 was located in the same interval as qGW7.1.
A total of 18 QTLs for chalkiness were found in BC3F2:3 population, including four QTLs for BR (qBR1, qBR2, qBR9, and qBR11), four QTLs for WBR (qWBR1.1, qWBR1.2, qWBR5, and qWBR6), five QTLs for WCR (qWCR3, qWCR5.1, qWCR5.2, qWCR11, and qWCR12), and five QTLs for CR (qCR1.1, qCR1.2, qCR2, qCR9, and qCR11). Of these, qBR2 and qBR11 were located in common intervals with qCR2 and qWCR11, respectively.
For AC, only one QTL (qAC4) was detected in the BC3F2:3 population, explaining 4.01% of the phenotype variation.

2.4. Genetic Effect Validation of Seven QTLs

Based on the results of QTL mapping, a number of QTLs with large effects were selected for genetic effect validation. The seeds of BC3F2:3 plants with heterozygous genotype in each QTL interval were selected to construct near-isogenic lines for genetic effect validation. As shown in Table 4, three grain-shape-related QTLs (qGW3, qGL7.2, and qLWR7.2) and four chalkiness-related QTLs (qWBR1.2, qBR2, qWCR3, and qWCR11) were chosen for genetic effect validation. In particular, qWBR1.2, qGL7.2, and qGW3 were validated in one environment, while qLWR7.2, qBR2, qWCR3, and qWCR11 were validated in two environments.

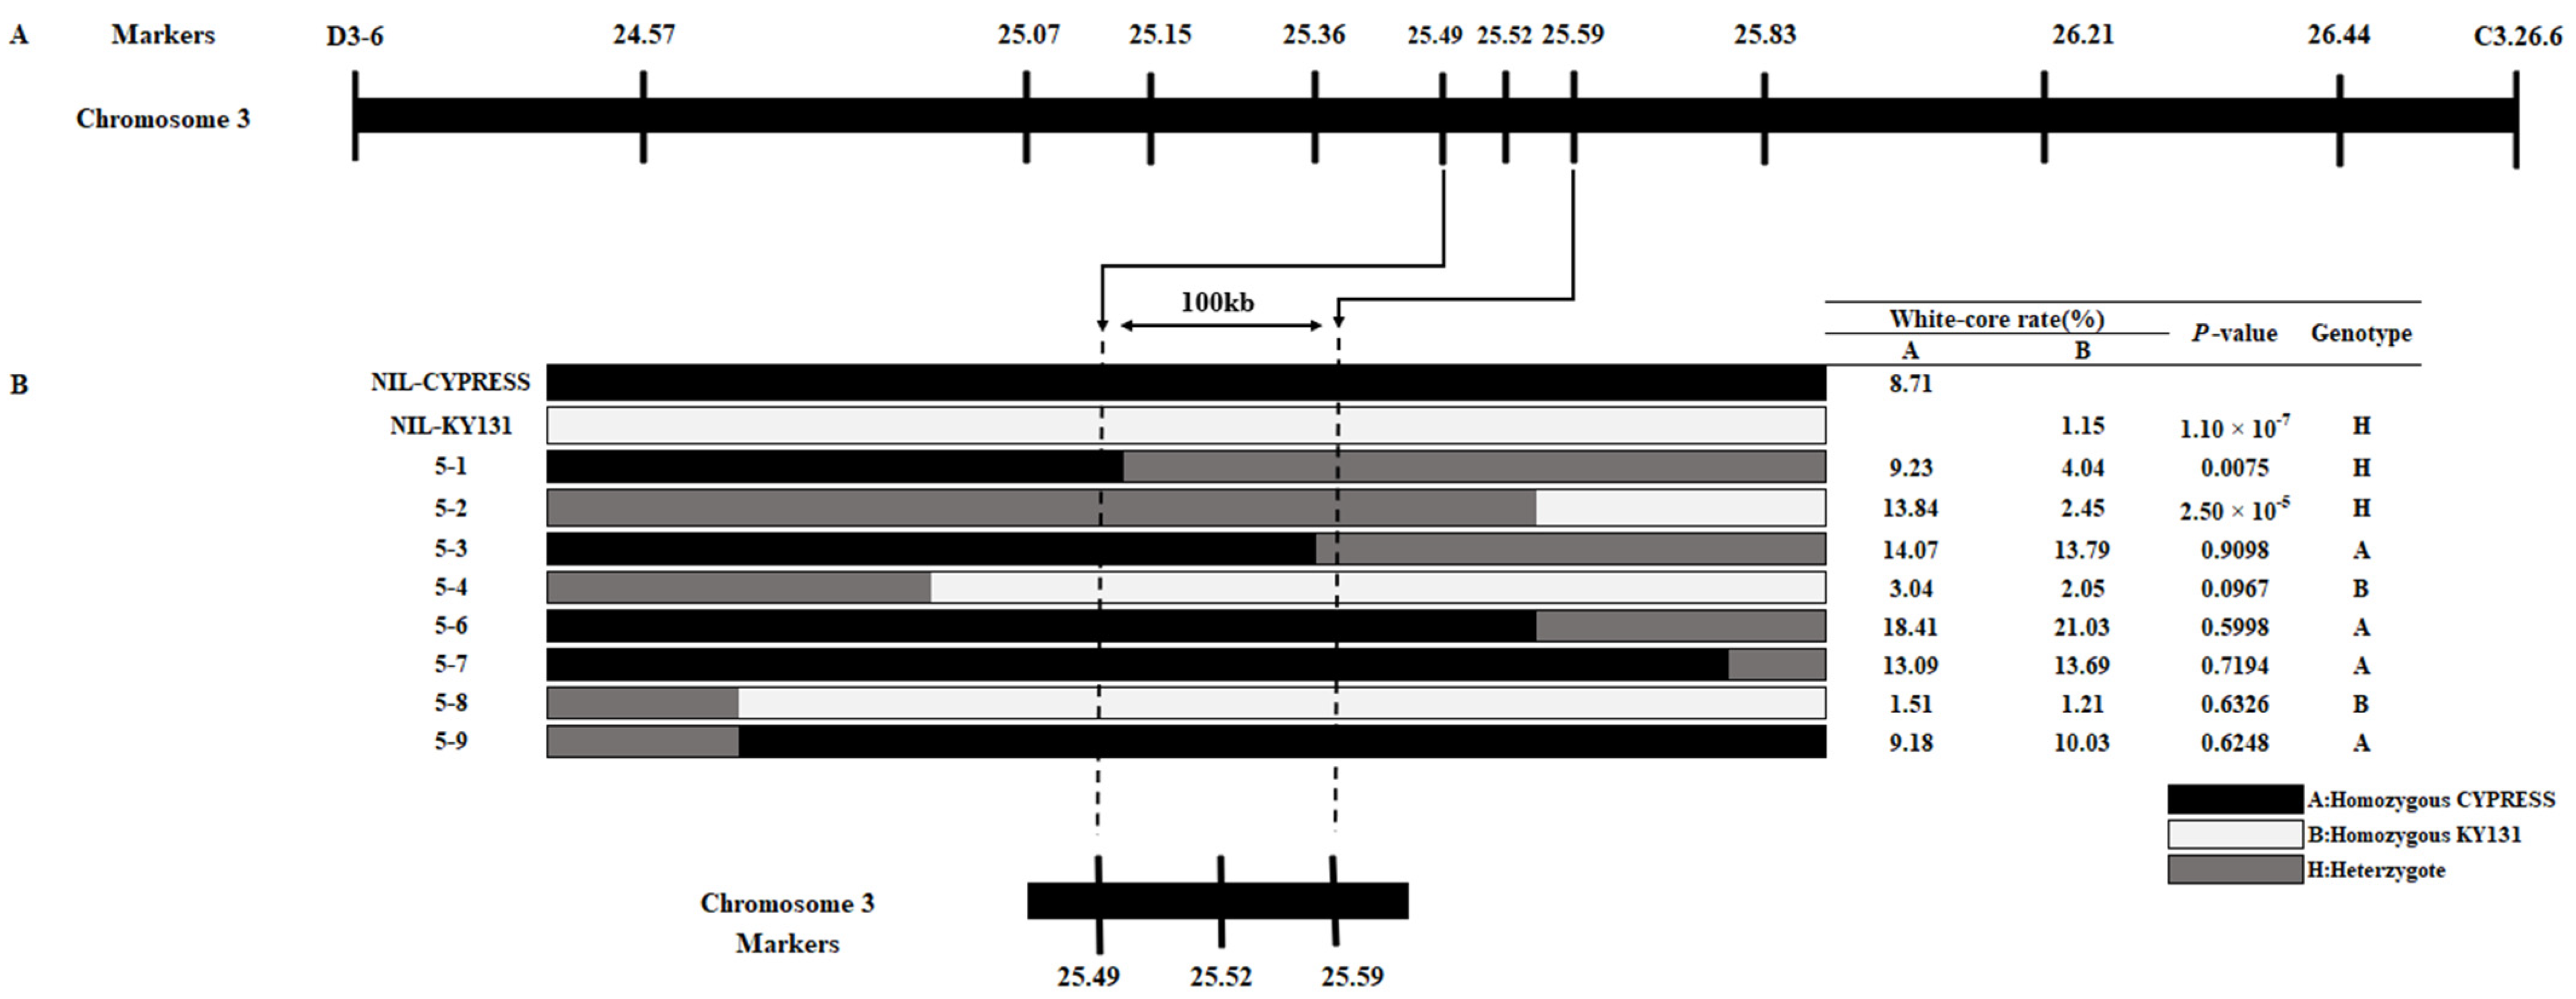
2.5. qWCR3 Was Fine-Mapped to a 100 kb Region

We selected a stable QTL, qWCR3, for further research. For the fine mapping of qWCR3, a BC3F4 population consisting of 200 individuals was developed, and eight recombinants between D3-6 and C3.26.6 were identified. All recombinants were used for progeny testing of qWCR3, and 10 InDel makers were developed to genotype these recombinants according to the sequence variation of the two parents (Figure 3A). The progeny test involves comparing the phenotypes of two homozygous genotype plants in the inbred line of each recombinant and, if there is a significant difference, the candidate gene is considered to be located in the heterozygous fragment of the recombinant; otherwise, it is considered to be in the homozygous fragment. Progeny test results are shown in Figure 3B, from which it can be seen that significant WCR differences were observed between homozygous plants of lines 5–1 and 5–2, while no significant WCR differences were detected in other recombinant lines, suggesting that the candidate gene should be located in the 100 kb region between makers 25.49 and 25.59, and that qWCR3 co-segregated with maker 25.52.

2.6. LOC_Os03g45210 Could Be the Candidate Genes of qWCR3

The target 100 kb region of qWCR3 contains 16 annotated genes (Table 5), according to the annotation information of the japonica variety Nipponbare from the RGAP website (Rice Genome Annotation Project; http://rice.uga.edu/; accessed on 8 April 2024). Of those, only two genes—LOC_Os03g45210 and LOC_Os03g45320—exhibited sequence variation between Cypress and KY131. LOC_Os03g45320 has a T insertion variation (Cypress-TTTTTTTTTT, KY131-TTTTTTTTTTT) on the intron between two parents, although it leads to no mutation of the protein. LOC_Os03g45210 has an 11 bp InDel variation (CYPRESS-T, KY131-CATACAGGTTAT) on the second exon between two parents, leading to frameshift mutation and premature protein termination of LOC_Os03g45210. In addition, out of the 16 genes, only LOC_Os03g45210 is specifically expressed in seed and endosperm, according to the prediction of the RGAP website (http://rice.uga.edu/; accessed on 8 April 2024). Therefore, we preliminary identified LOC_Os03g45210 as the candidate gene for qWCR3, and the function of this gene needs to be further verified.

3. Discussion

Rice grain quality reflects the demands of consumers, sellers, and producers, consists of complex traits, and is one of the most important goals of rice breeding. Mapping-based cloning can help us identify QTLs (quantitative trait loci) that regulate rice grain quality traits, thus providing a theoretical basis for rice breeding. In this study, we identified 37 QTLs for grain shape, chalkiness, and amylose content in back-cross populations between Cypress and KY131.

3.1. Cloned Genes in the QTL Mapping Intervals

Among these QTLs, qGL3 and qGW3 were located in the same interval, which contains two cloned genes: PGL1 and BG1 [16,17]. PGL1 encodes a bHLH protein which positively regulates grain length through regulation of cell length in the lemma [16]. BG1 encodes a membrane localization protein, which plays a role in regulating the transport and distribution of auxin, thus positively regulating grain size [17]. The interval of qGL6 contains a cloned gene, BU1, which regulates BR signaling pathways through OsBRI1 and RGA1 and controls the degree of curvature of rice leaf nodes [18]. The interval of qGL8 contains a cloned gene, GAD1, which encodes a small secretory signal peptide leading to shorter grain length [19]. The interval of qGW5.1 contains a cloned gene, GS5, which encodes a serine carboxypeptidase and positively regulates grain width [20]. qGW5.2 and qLWR5 are located in the same interval which contains two genes, GSK2 and OSCYP51G3, that can regulate grain shape [21,22]. The intervals of qGW5.1, qGW5.2, and qLWR5 share partial overlaps, with the overlapping area containing a grain width-controlling gene, GW5. A deletion mutation in GW5 led to down-regulation of its expression level and to an increase in grain width. In addition, the GW5 protein can inhibit the activity of GSK2, thereby regulating the positive expression of genes in the downstream BR signaling pathway and positively regulating grain width [23]. The qLWR3 interval contains a cloned gene, GS3. Through competitively binding with the rice G protein β subunit RGB1, GS3 inhibits the signal pathway of the G protein, thus regulating grain length [24,25]. The overlapping regions of qGL7.2, qGW7.2, qLWR7.1, and qLWR7.2 contain five cloned genes, GLW7, GL7, OsBZR1, BG2, and SRS1/DEP2, which are related to grain shape [26,27,28,29,30]. These QTLs containing cloned genes may be used in rice breeding for the improvement of rice quality.

3.2. Four Chalkiness QTLs Were Newly Found

The formation of rice chalkiness is regulated by complex genetic networks and environments. Over the past few decades, researchers have detected a large number of quantitative trait loci controlling rice chalkiness [9]; however, few QTLs/genes have been fine-mapped or cloned. In this study, we detected 18 QTLs for chalkiness and verified four QTLs (qWBR1.2, qBR2, qWCR3, and qWCR11) repeatedly. The Cypress allele at qWCR3 effectively increased the white-core rate (Table 3 and Table 4), while the Cypress alleles at qWBR1.2, qBR2, and qWCR11 were found to effectively decrease the white-belly rate, white-back rate, and white-core rate, respectively. These results could serve as a basis for further fine mapping of the four QTLs and could be used in breeding programs to reduce chalkiness.

3.3. LOC_Os03g45210 Could Be a New Gene for Rice Chalkiness

qWCR3 was fine-mapped to a 100 kb region, where only LOC_Os03g45210 has an 11 bp InDel variation on the second exon between the two parents, leading to frameshift mutation and premature protein termination. LOC_Os03g45210 encodes a protein belonging to the plant cysteine oxidase (PCOs) family, which act as O2-sensing enzymes in plants. The PCOs family in Arabidopsis controls the stability of ERF-VIIs through the N/Arg degradation pathway, first through oxidization of the N-terminal cysteine of ERF-VIIs proteins, then by carrying out Argyl-tRNA-protein transferase 1 (ATE1)-mediated arginine installation to control the stability of ERF-VIIs, thus regulating oxygen homeostasis [31]. When plants are submerged, the oxygen concentration level decreases and the activity level of PCOs decreases accordingly, leading to enhanced stability of ERF VIIs and accumulation of ethylene, allowing plants to adapt to the transcription of genes related to hypoxic conditions [32]. At present, the cloned white-core rate gene—WCR1—is known to be related to oxygen homeostasis in rice endosperm cells [11]. Taken together, the candidate gene of qWCR3 may function as an O2 sensor in rice, controlling the formation of chalkiness through regulation of oxygen homeostasis in the endosperm.

4. Materials and Methods

4.1. Plant Materials and Field Experiment

A BC3F1 population consisting of 313 lines was derived from a cross between a temperate japonica cultivar KY131 (the recurrent parent) and a tropical japonica cultivar Cypress (the donor parent). The BC3F2 population consisted of 286 lines, with each line planted in one row including 12 plants. The BC3F2 population and their parents were planted in the experimental field of Huazhong Agricultural University in Lingshui city, Hainan province, in 2017. When the seeds of the BC3F2 plant matured, we mix-harvested the seeds of the BC3F2 lines to produce the BC3F2:3 lines, ensuring that the seeds of each of the BC3F2 lines corresponded strictly to a line of the BC3F2:3 population, i.e., each BC3F2:3 line originated from a mixed seed of a specific BC3F2 line. All the BC3F2:3 lines and their parents were planted in the experimental field of Huazhong Agricultural University in Wuhan city, Hubei province, in 2018. The phenotypes of rice quality-related traits in the BC3F2 and BC3F2:3 populations were collected for QTL mapping analysis.
In 2019, 2020, 2021, and 2022, the BC3F2 and BC3F2:3 lines with double heterozygous genotypes in the target QTL interval were planted for evaluation of genetic effects in the experimental field of Huazhong Agricultural University in Wuhan and Hainan. For the fine mapping of qWCR3, eight recombinants between D3-6 and C3.26.6 were identified from a BC3F4 population derived from a BC3F3 plant with a double heterozygous qWCR3 segment, where all recombinants were planted in 8 rows with 12 plants per row.
The 30-day-old progeny seedlings of these populations were transplanted into eight rows with 12 seedlings each, having 16.5 cm spacing in single-row plots in the field, while the rows were 26.4 cm apart. Field management followed local practices. Ten plants from the middle of each row were harvested individually for the measurement of traits.

4.2. Phenotyping and Statistical Analysis

Before measurement, harvested grains were air-dried at room temperature for at least 3 months to maintain a consistent water balance. The grain length (GL), grain width (GW), and grain length-to-width ratio (LWR) were measured after threshing using a BenQ scanner and analyzed with SmartGrain software [33]. Grain chalkiness, including white-belly (WBR), white-core (WCR), and white-back (BR) phenotypes, was assessed visually. The percentage of chalky grains in the total number of dehulled grains was used for measurement of the grain chalkiness rate. The chalkiness rate (CR) was calculated as the sum of the three types of chalkiness. Flour ground from milled grain was used to measure the amylose content using the iodine staining method [34].
The grain shape, chalkiness, and amylose content of two different homozygous genotypes in the same QTL were compared through a t-test. If the p-value was less than 0.05, the candidate gene was considered to be located in the heterozygous fragment, otherwise it was considered to be located in the homozygous fragment.

4.3. Genotyping and QTL Analysis

Leaves from the parent varieties KY131 and Cypress were used to extract genome DNA using the CTAB method [35], and the population’s leaves were used to extract genome DNA using the TPS method. The parent genomes were sequenced and assembled according to the rice reference genome (Rice Genome Annotation Project; http://rice.uga.edu/; accessed on 8 April 2024) [36]. According to the sequencing data of the parents, we developed 151 polymorphic simple sequence repeat (SSR) and InDel makers distributed over all 12 chromosomes. The genome DNA was amplified through PCR, following a program of 94 °C for 5 min, then 32–34 cycles of 30 s at 94 °C, 30 s at 55 °C, 30 s at 72 °C, and, finally, 5 min at 72 °C. The PCR products were identified through 4% polyacrylamide gel electrophoresis (PAGE). Through the use of two flanking markers for each QTL, the corresponding genetic effect populations were genotyped.

4.4. Progeny Testing Analysis

Progeny testing was conducted in the progeny segregation population of each recombinant. In the progeny line of each recombinant, a student’s t test was performed to compare the grain size differences between plants with a homozygous KY131 allele and a homozygous Cypress allele. If the p-value was less than 0.05, the candidate gene was considered to be located in the heterozygous fragment, otherwise it was considered to be located in the homozygous fragment.

4.5. Genetic Map Construction and QTL Analysis

Mapmaker/Exp3.0 was used to construct the genetic linkage map [37], while the composite interval mapping method included in the WinQTLCart software version 2.5 was used to perform QTL scanning on population phenotype data and genetic maps, as well as to screen QTLs with a logarithm of odds (LOD) threshold of 2.0 [38].

5. Conclusions

Using back-cross populations of Cypress and KY131, a genetic linkage map with 151 polymorphic markers was constructed and 37 QTLs for grain shape, chalkiness, and amylose content were detected through QTL mapping analysis. Among them, three QTLs for grain shape (qGW3, qGL7.2, and qLWR7.1) and four QTLs for chalkiness (qWBR1.2, qBR2, qWCR3, and qWCR11) presented repeatable and detectable genetic effects in different generation populations. Through progeny testing, we fine-mapped qWCR3 to a 100 kb region that contains 16 annotated genes, of which only LOC_Os03g45210 is specifically expressed in seed and endosperm, with an 11 bp InDel variation on the second exon between two parents leading to a frameshift mutation and premature protein termination. As a result, LOC_Os03g45210 could be the candidate gene for qWCR3. The results of this study lay the foundation for map-based cloning of these QTLs.

Supplementary Materials

The supporting information can be downloaded at: https://www.mdpi.com/article/10.3390/ijms25084389/s1.

Author Contributions

Conceptualization, Y.H.; methodology, J.L., G.L. and H.Z.; investigation, J.L., H.Z., Y.W., E.L., G.G., Q.Z. and H.S.; resources, G.J. and Y.H.; data curation, J.L. and H.Z.; writing, J.L.; supervision, Y.H.; funding acquisition, Y.H. All authors have read and agreed to the published version of the manuscript.

Funding

This work was supported by grants from STI 2030—Major Project (2023ZD04069), National Natural Science Foundation of China (U21A20211, 31821005) and Earmarked fund for China Agriculture Research System (CARS-01-01).

Institutional Review Board Statement

Not applicable.

Informed Consent Statement

Not applicable.

Data Availability Statement

The datasets generated during the current study are available from the corresponding author upon reasonable request.

Acknowledgments

The authors extend their appreciation for the support received from the National Key Laboratory of Crop Genetic Improvement, Huazhong Agricultural University.

Conflicts of Interest

The authors declare that there are no conflicts of interest.

References

  1. Wing, R.; Purugganan, M.; Zhang, Q. The rice genome revolution: From an ancient grain to Green Super Rice. Nat. Rev. Genet. 2018, 19, 505–517. [Google Scholar] [CrossRef] [PubMed]
  2. Tian, Z.; Qian, Q.; Liu, Q.; Yan, M.; Liu, X.; Yan, C.; Liu, G.; Gao, Z.; Tang, S.; Zeng, D.; et al. Allelic diversities in rice starch biosynthesis lead to a diverse array of rice eating and cooking qualities. Proc. Natl. Acad. Sci. USA 2009, 106, 21760–21765. [Google Scholar] [CrossRef] [PubMed]
  3. Zhou, H.; Xia, D.; He, Y. Rice grain quality-traditional traits for high quality rice and health-plus substances. Mol. Breed. 2020, 40, 1. [Google Scholar] [CrossRef]
  4. Fitzgerald, M.; McCouch, S.; Hall, R. Not just a grain of rice: The quest for quality. Trends Plant Sci. 2009, 14, 133–139. [Google Scholar] [CrossRef] [PubMed]
  5. Zhao, D.; Zhang, C.; Li, Q.; Liu, Q. Genetic control of grain appearance quality in rice. Biotechnol. Adv. 2022, 60, 108014. [Google Scholar] [CrossRef] [PubMed]
  6. Tan, Y.; Xing, Y.; Li, J.; Yu, S.; Xu, C.; Zhang, Q. Genetic bases of appearance quality of rice grains in Shanyou 63, an elite rice hybrid. Theor. Appl. Genet. 2000, 101, 823–829. [Google Scholar] [CrossRef]
  7. Chun, A.; Song, J.; Kim, K.; Lee, H. Quality of head and chalky rice and deterioration of eating quality by chalky rice. J. Crop Sci. Biotechnol. 2009, 12, 239–244. [Google Scholar] [CrossRef]
  8. Tang, S.; Zhang, H.; Liu, W.; Dou, Z.; Zhou, Q.; Chen, W.; Wang, S.; Ding, Y. Nitrogen fertilizer at heading stage effectively compensates for the deterioration of rice quality by affecting the starch-related properties under elevated temperatures. Food Chem. 2019, 277, 455–462. [Google Scholar] [CrossRef] [PubMed]
  9. Wu, B.; Xia, D.; Zhou, H.; Cheng, S.; Wang, Y.; Li, M.; Gao, G.; Zhang, Q.; Li, X.; He, Y. Fine mapping of qWCR7, a grain chalkiness QTL in rice. Mol. Breed. 2021, 41, 68. [Google Scholar] [CrossRef] [PubMed]
  10. Li, Y.; Fan, C.; Xing, Y.; Yun, P.; Luo, L.; Yan, B.; Peng, B.; Xie, W.; Wang, G.; Li, X.; et al. Chalk5 encodes a vacuolar H(+)-translocating pyrophosphatase influencing grain chalkiness in rice. Nat. Genet. 2014, 46, 398–404. [Google Scholar] [CrossRef]
  11. Wu, B.; Yun, P.; Zhou, H.; Xia, D.; Gu, Y.; Li, P.; Yao, J.; Zhou, Z.; Chen, J.; Liu, R.; et al. Natural variation in WHITE-CORE RATE 1 regulates redox homeostasis in rice endosperm to affect grain quality. Plant Cell 2022, 34, 1912–1932. [Google Scholar] [CrossRef] [PubMed]
  12. Mikami, I.; Uwatoko, N.; Ikeda, Y.; Yamaguchi, J.; Hirano, H.; Suzuki, Y.; Sano, Y. Allelic diversification at the wx locus in landraces of Asian rice. Theor. Appl. Genet. 2008, 116, 979–989. [Google Scholar] [CrossRef] [PubMed]
  13. Bello, B.; Hou, Y.; Zhao, J.; Jiao, G.; Wu, Y.; Li, Z.; Wang, Y.; Tong, X.; Wang, W.; Yuan, W.; et al. NF-YB1-YC12-bHLH144 complex directly activates Wx to regulate grain quality in rice (Oryza sativa L.). Plant Biotechnol. J. 2019, 17, 1222–1235. [Google Scholar] [CrossRef] [PubMed]
  14. Zhu, Y.; Cai, X.; Wang, Z.; Hong, M. An interaction between a MYC protein and an EREBP protein is involved in transcriptional regulation of the rice Wx gene. J. Biol. Chem. 2003, 278, 47803–47811. [Google Scholar] [CrossRef] [PubMed]
  15. Zeng, D.; Yan, M.; Wang, Y.; Liu, X.; Qian, Q.; Li, J. Du1, encoding a novel Prp1 protein, regulates starch biosynthesis through affecting the splicing of Wxb pre-mRNAs in rice (Oryza sativa L.). Plant Mol. Biol. 2007, 65, 501–509. [Google Scholar] [CrossRef]
  16. Heang, D.; Sassa, H. Antagonistic actions of HLH/bHLH proteins are involved in grain length and weight in rice. PLoS ONE 2012, 7, e31325. [Google Scholar] [CrossRef] [PubMed]
  17. Liu, L.; Tong, H.; Xiao, Y.; Che, R.; Xu, F.; Hu, B.; Liang, C.; Chu, J.; Li, J.; Chu, C. Activation of Big Grain1 significantly improves grain size by regulating auxin transport in rice. Proc. Natl. Acad. Sci. USA 2015, 112, 11102–11107. [Google Scholar] [CrossRef] [PubMed]
  18. Tanaka, A.; Nakagawa, H.; Tomita, C.; Shimatani, Z.; Ohtake, M.; Nomura, T.; Jiang, C.; Dubouzet, J.; Kikuchi, S.; Sekimoto, H.; et al. BRASSINOSTEROID UPREGULATED1, encoding a helix-loop-helix protein, is a novel gene involved in brassinosteroid signaling and controls bending of the lamina joint in rice. Plant Physiol. 2009, 151, 669–680. [Google Scholar] [CrossRef] [PubMed]
  19. Jin, J.; Hua, L.; Zhu, Z.; Tan, L.; Zhao, X.; Zhang, W.; Liu, F.; Fu, Y.; Cai, H.; Sun, X.; et al. GAD1 Encodes a Secreted Peptide That Regulates Grain Number, Grain Length, and Awn Development in Rice Domestication. Plant Cell 2016, 28, 2453–2463. [Google Scholar] [CrossRef] [PubMed]
  20. Li, Y.; Fan, C.; Xing, Y.; Jiang, Y.; Luo, L.; Sun, L.; Shao, D.; Xu, C.; Li, X.; Xiao, J.; et al. Natural variation in GS5 plays an important role in regulating grain size and yield in rice. Nat. Genet. 2011, 43, 1266–1269. [Google Scholar] [CrossRef]
  21. Tong, H.; Liu, L.; Jin, Y.; Du, L.; Yin, Y.; Qian, Q.; Zhu, L.; Chu, C. DWARF AND LOW-TILLERING acts as a direct downstream target of a GSK3/SHAGGY-like kinase to mediate brassinosteroid responses in rice. Plant Cell 2012, 24, 2562–2577. [Google Scholar] [CrossRef] [PubMed]
  22. Xia, K.; Ou, X.; Tang, H.; Wang, R.; Wu, P.; Jia, Y.; Wei, X.; Xu, X.; Kang, S.; Kim, S.; et al. Rice microRNA osa-miR1848 targets the obtusifoliol 14α-demethylase gene OsCYP51G3 and mediates the biosynthesis of phytosterols and brassinosteroids during development and in response to stress. New Phytol. 2015, 208, 790–802. [Google Scholar] [CrossRef] [PubMed]
  23. Liu, J.; Chen, J.; Zheng, X.; Wu, F.; Lin, Q.; Heng, Y.; Tian, P.; Cheng, Z.; Yu, X.; Zhou, K.; et al. GW5 acts in the brassinosteroid signalling pathway to regulate grain width and weight in rice. Nat. Plants 2017, 3, 17043. [Google Scholar] [CrossRef] [PubMed]
  24. Mao, H.; Sun, S.; Yao, J.; Wang, C.; Yu, S.; Xu, C.; Li, X.; Zhang, Q. Linking differential domain functions of the GS3 protein to natural variation of grain size in rice. Proc. Natl. Acad. Sci. USA 2010, 107, 19579–19584. [Google Scholar] [CrossRef] [PubMed]
  25. Sun, S.; Wang, L.; Mao, H.; Shao, L.; Li, X.; Xiao, J.; Ouyang, Y.; Zhang, Q. A G-protein pathway determines grain size in rice. Nat. Commun. 2018, 9, 851. [Google Scholar] [CrossRef] [PubMed]
  26. Wang, Y.; Xiong, G.; Hu, J.; Jiang, L.; Yu, H.; Xu, J.; Fang, Y.; Zeng, L.; Xu, E.; Xu, J.; et al. Copy number variation at the GL7 locus contributes to grain size diversity in rice. Nat. Genet. 2015, 47, 944–948. [Google Scholar] [CrossRef] [PubMed]
  27. Bai, M.; Zhang, L.; Gampala, S.; Zhu, S.; Song, W.; Chong, K.; Wang, Z. Functions of OsBZR1 and 14-3-3 proteins in brassinosteroid signaling in rice. Proc. Natl. Acad. Sci. USA 2007, 104, 13839–13844. [Google Scholar] [CrossRef] [PubMed]
  28. Si, L.; Chen, J.; Huang, X.; Gong, H.; Luo, J.; Hou, Q.; Zhou, T.; Lu, T.; Zhu, J.; Shangguan, Y.; et al. OsSPL13 controls grain size in cultivated rice. Nat. Genet. 2016, 48, 447–456. [Google Scholar] [CrossRef] [PubMed]
  29. Xu, F.; Fang, J.; Ou, S.; Gao, S.; Zhang, F.; Du, L.; Xiao, Y.; Wang, H.; Sun, X.; Chu, J.; et al. Variations in CYP78A13 coding region influence grain size and yield in rice. Plant Cell Environ. 2015, 38, 800–811. [Google Scholar] [CrossRef] [PubMed]
  30. Abe, Y.; Mieda, K.; Ando, T.; Kono, I.; Yano, M.; Kitano, H.; Iwasaki, Y. The SMALL AND ROUND SEED1 (SRS1/DEP2) gene is involved in the regulation of seed size in rice. Genes Genet. Syst. 2010, 85, 327–339. [Google Scholar] [CrossRef] [PubMed]
  31. Taylor-Kearney, L.; Flashman, E. Targeting plant cysteine oxidase activity for improved submergence tolerance. Plant J. 2022, 109, 779–788. [Google Scholar] [CrossRef]
  32. Licausi, F.; Kosmacz, M.; Weits, D.; Giuntoli, B.; Giorgi, F.; Voesenek, L.; Perata, P.; van Dongen, J. Oxygen sensing in plants is mediated by an N-end rule pathway for protein destabilization. Nature 2011, 479, 419–422. [Google Scholar] [CrossRef] [PubMed]
  33. Tanabata, T.; Shibaya, T.; Hori, K.; Ebana, K.; Yano, M. SmartGrain: High-throughput phenotyping software for measuring seed shape through image analysis. Plant Physiol. 2012, 160, 1871–1880. [Google Scholar] [CrossRef] [PubMed]
  34. Bao, J.; Corke, H.; Sun, M. Nucleotide diversity in starch synthase IIa and validation of single nucleotide polymorphisms in relation to starch gelatinization temperature and other physicochemical properties in rice (Oryza sativa L.). Theor. Appl. Genet. 2006, 113, 1171–1183. [Google Scholar] [CrossRef] [PubMed]
  35. Miura, K.; Agetsuma, M.; Kitano, H.; Yoshimura, A.; Matsuoka, M.; Jacobsen, S.E.; Ashikari, M. A metastable DWARF1 epigenetic mutant affecting plant stature in rice. Proc. Natl. Acad. Sci. USA 2009, 106, 11218–11223. [Google Scholar] [CrossRef] [PubMed]
  36. Li, H.; Durbin, R. Fast and accurate short read alignment with Burrows-Wheeler transform. Bioinformatics 2009, 25, 1754–1760. [Google Scholar] [CrossRef] [PubMed]
  37. Lander, E.; Green, P.; Abrahamson, J.; Barlow, A.; Daly, M.; Lincoln, S.; Newberg, L. MAPMAKER: An interactive computer package for constructing primary genetic linkage maps of experimental and natural populations. Genomics 1987, 1, 174–181. [Google Scholar] [CrossRef] [PubMed]
  38. Wang, S.; Basten, C.; Zeng, Z. Windows QTL Cartographer 2.5. Department of Statistics, North Carolina State. 2006. Available online: http://statgen.ncsu.edu/qtlcart/WQTLCart.htm (accessed on 8 April 2024).
Figure 1. Distribution of phenotypic values among the BC3F2 and BC3F2:3 populations derived from KY131/Cypress. Grain shape-related traits in 2017 (AC), grain shape-related traits in 2018 (DF), chalkiness-related traits (GJ), and amylose content (K) in 2018. GL, grain length; GW, grain width; LWR, length-to-width ratio; WBaR, white-back rate; WBeR, white-belly rate; WCR, white-core rate; CR, chalkiness rate; AC, amylose content.
Ijms 25 04389 g001
Figure 2. Genetic linkage map based on 151 SSR markers. RM primers were derived from public databases, while the other InDel primers were designed based on parental sequence variations.
Ijms 25 04389 g002
Figure 3. Fine mapping of qWCR3: (A) markers used in the fine mapping of qWCR3. (B) Progeny test of the eight recombinants narrowed qWCR3 to a 100 kb region. Black, white, and grey blocks represent the genotype of homozygous CYPRESS, homozygous KY131, and heterozygote, respectively.
Ijms 25 04389 g003
Table 1. Phenotypes of grain traits in the BC3F2 and BC3F2:3 populations.
TraitParents2017HN BC3F22018WH BC3F2:3
KY131CypressMeanSDMINMAXMeanSDMINMAX
GL (mm)6.818.676.990.295.377.876.940.016.147.67
GW (mm)2.882.523.500.133.053.843.000.012.473.38
LWR2.393.462.010.101.792.462.330.012.113.08
BR (%)22.060.99 97.483.3279.21100
WCR (%)3.823.16 41.3815.087.6680.72
WBR (%)2.961.56 24.9112.273.7274.89
CR (%)24.424.98 98.412.2482.67100
AC (%)16.6725.06 15.814.495.6324.51
Note: GL, grain length; GW, grain width; LWR, length-to-width ratio; BR, white-back rate; WBR, white-belly rate; WCR, white-core rate; CR, chalkiness rate; AC, amylose content. BC3F2 was planted in Hainan (HN) in 2017. BC3F2:3 was planted in Wuhan (WH) in 2018.
Table 2. Correlation analysis of traits in the BC3F2:3 (KY131/Cypress) population.
GL (mm)GW (mm)LWRBR (%)WCR (%)WBR (%)CR (%)
GW (mm)0.20 **
LWR0.50 **−0.74 **
BR (%)0.060.010.04
WCR (%)−0.040.28 **−0.28 **0.14 *
WBR (%)−0.12 *0.24 **−0.29 **−0.010.55 **
CR (%)0.030.08−0.040.93 **0.22 **0.13 *
AC (%)−0.04−0.01−0.020.030.24 **0.010.04
Note: GL, grain length; GW, grain width; LWR, length-to-width ratio; BR, white-back rate; WBR, white-belly rate; WCR, white-core rate; CR, chalkiness rate; AC, amylose content. ** Correlation is significant at p < 0.01; * Correlation is significant at p < 0.05.
Table 3. QTL mapping of KY131/Cypress populations.
TraitsQTLChrIntervalBC3F2BC3F2:3
LODADDV (%)LODADDV (%)
GLqGL33T3-1-RM54511.461.29120.60
qGL44Z4-20.6-Z4-26.53.06−0.1884.85
qGL66Z6-6.0-TT6-1 4.81−0.1405.88
qGL7.17RM481-Z7-5.4 3.690.1254.55
qGL7.27T7-3-RM4786.72−0.3429.128.74−0.31612.82
qGL7.37RM478-Z7-28.34.03−0.2527.07
qGL88RM515-Z8-25.34.44−0.1786.61
GWqGW11RM486-A1.40.39 2.960.0974.58
qGW33T3-1-RM5457.870.60817.52
qGW5.15RM405-TT5-13.490.15610.03
qGW5.25Z5-5.1-Z5-7.2 6.350.13913.03
qGW7.17RM346-RM4785.830.19612.50
qGW7.27T7-3-RM478 5.360.1408.94
LWRqLWR33Z3-14.8-Z3-17.6 3.83−0.0874.10
qLWR55Z5-5.1-Z5-7.26.20−0.0958.8210.56−0.17921.13
qLWR7.17RM346-RM47825.80−0.23733.2617.73−0.24626.86
qLWR7.27T7-3-RM346 10.19−0.20313.20
qLWR999.8.0-Z9-10.4 3.72−0.27514.78
BRqBR11A1.40.39-RM104 2.696.3984.25
qBR22T2-1-T2-2 4.372.7908.94
qBR999.2.0-9.8.0 3.032.6803.79
qBR1111C11-3.5-11-6.6 3.77−2.1355.05
WBRqWBR1.11C1-23.3-RM5 3.246.7714.32
qWBR1.21D1-8-B1.40.61 4.52−9.2745.46
qWBR55Z5-5.1-Z5-7.2 4.548.9256.73
qWBR66RM586-Z6-6.0 9.00−19.77018.17
WCRqWCR33D3-6-C3.26.6 2.54−10.6074.88
qWCR5.15Z5-5.1-TT5-1 2.9810.8735.75
qWCR5.25TT5-1-TT5-2 2.817.3073.99
qWCR1111C11-3.5-11.6.6 2.98−1.3104.47
qWCR1212Z12-19.9-Z12-25.2 4.38−10.9977.02
CRqCR1.11Z1-18.0-C1-23.3 3.253.39326.30
qCR1.21C1-23.3-RM5 4.041.4485.59
qCR22T2-1-T2-2 3.431.6757.22
qCR99H9.4.7-9.8.0 3.481.8804.57
qCR111111-6.6-Z11-16.9 2.88−1.0263.76
ACqAC44Z4-6.0-Z4-14.3 2.523.6874.01
Note: QTL, quantitative trait locus; GL, grain length; GW, grain width; LWR, length-to-width ratio; BR, white-back rate; WBR, white-belly rate; WCR, white-core rate; CR, chalkiness rate; AC, amylose content; Chr, chromosome; LOD, logarithm of odds; ADD, additive effect, where positive values indicate that alleles from Cypress increase the trait scores; V, variance explained by the QTL.
Table 4. Validation of QTLs in BC3F3 and BC3F4 populations.
YearQTLCypress GenotypeKY131 Genotypep ValueADD
2019WHqLWR7.22.89 ± 0.172.58 ± 0.200.00160.15
qBR2 (%)40.05 ± 20.9361.97 ± 18.970.033−10.96
qWBR1.2 (%)25.65 ± 11.528.66 ± 7.500.00198.50
2020WHqGL7.2 (mm)8.42 ± 0.397.70 ± 0.240.00590.36
qGW3 (mm)3.15 ± 0.153.31 ± 0.080.0069−0.08
qLWR7.22.80 ± 0.072.50 ± 0.065.58 × 10−90.15
2021WHqBR2 (%)29.06 ± 6.1941.81 ± 9.020.0026−6.37
2021HNqWCR3(%)14.47 ± 5.902.46 ± 2.990.0016.01
qWCR11(%)3.91 ± 1.2614.86 ± 3.866.14 × 10−7−5.47
2022WHqWCR3(%)8.71 ± 4.291.16 ± 0.751.09 × 10−73.78
qWCR11(%)6.08 ± 4.2412.02 ± 6.460.0070−2.97
Note: QTL, quantitative trait locus. WH, Wuhan. HN, Hainan. GL, grain length. GW, grain width. LWR, length-to-width ratio. BR, white-back rate. WBR, white-belly rate. WCR, white-core rate. ADD, additive effect; positive values indicate that alleles from Cypress increase the trait scores.
Table 5. The ORFs in the fine-mapping region of qWCR3.
GeneGene Product Name
LOC_Os03g45150LTP family protein precursor
LOC_Os03g45160Hypothetical protein
LOC_Os03g45170Amino acid permease
LOC_Os03g45180Expressed protein
LOC_Os03g45194Oxidoreductase
LOC_Os03g45210Plant Cysteine oxidase-3
LOC_Os03g45220Expressed protein
LOC_Os03g45230Expressed protein
LOC_Os03g45250Plant Cysteine oxidase-2
LOC_Os03g45260Vesicle transport v-SNARE protein
LOC_Os03g45270CS domain containing protein
LOC_Os03g45280Dehydrin
LOC_Os03g45290Ankyrin repeat domain-containing protein 50
LOC_Os03g45300Transposon protein
LOC_Os03g45310Hypothetical protein
LOC_Os03g45320Dehydrogenase
Disclaimer/Publisher’s Note: The statements, opinions and data contained in all publications are solely those of the individual author(s) and contributor(s) and not of MDPI and/or the editor(s). MDPI and/or the editor(s) disclaim responsibility for any injury to people or property resulting from any ideas, methods, instructions or products referred to in the content.

