

Stable Dual miR-143 and miR-506 Upregulation Inhibits Proliferation and Cell Cycle Progression
 , and
, and 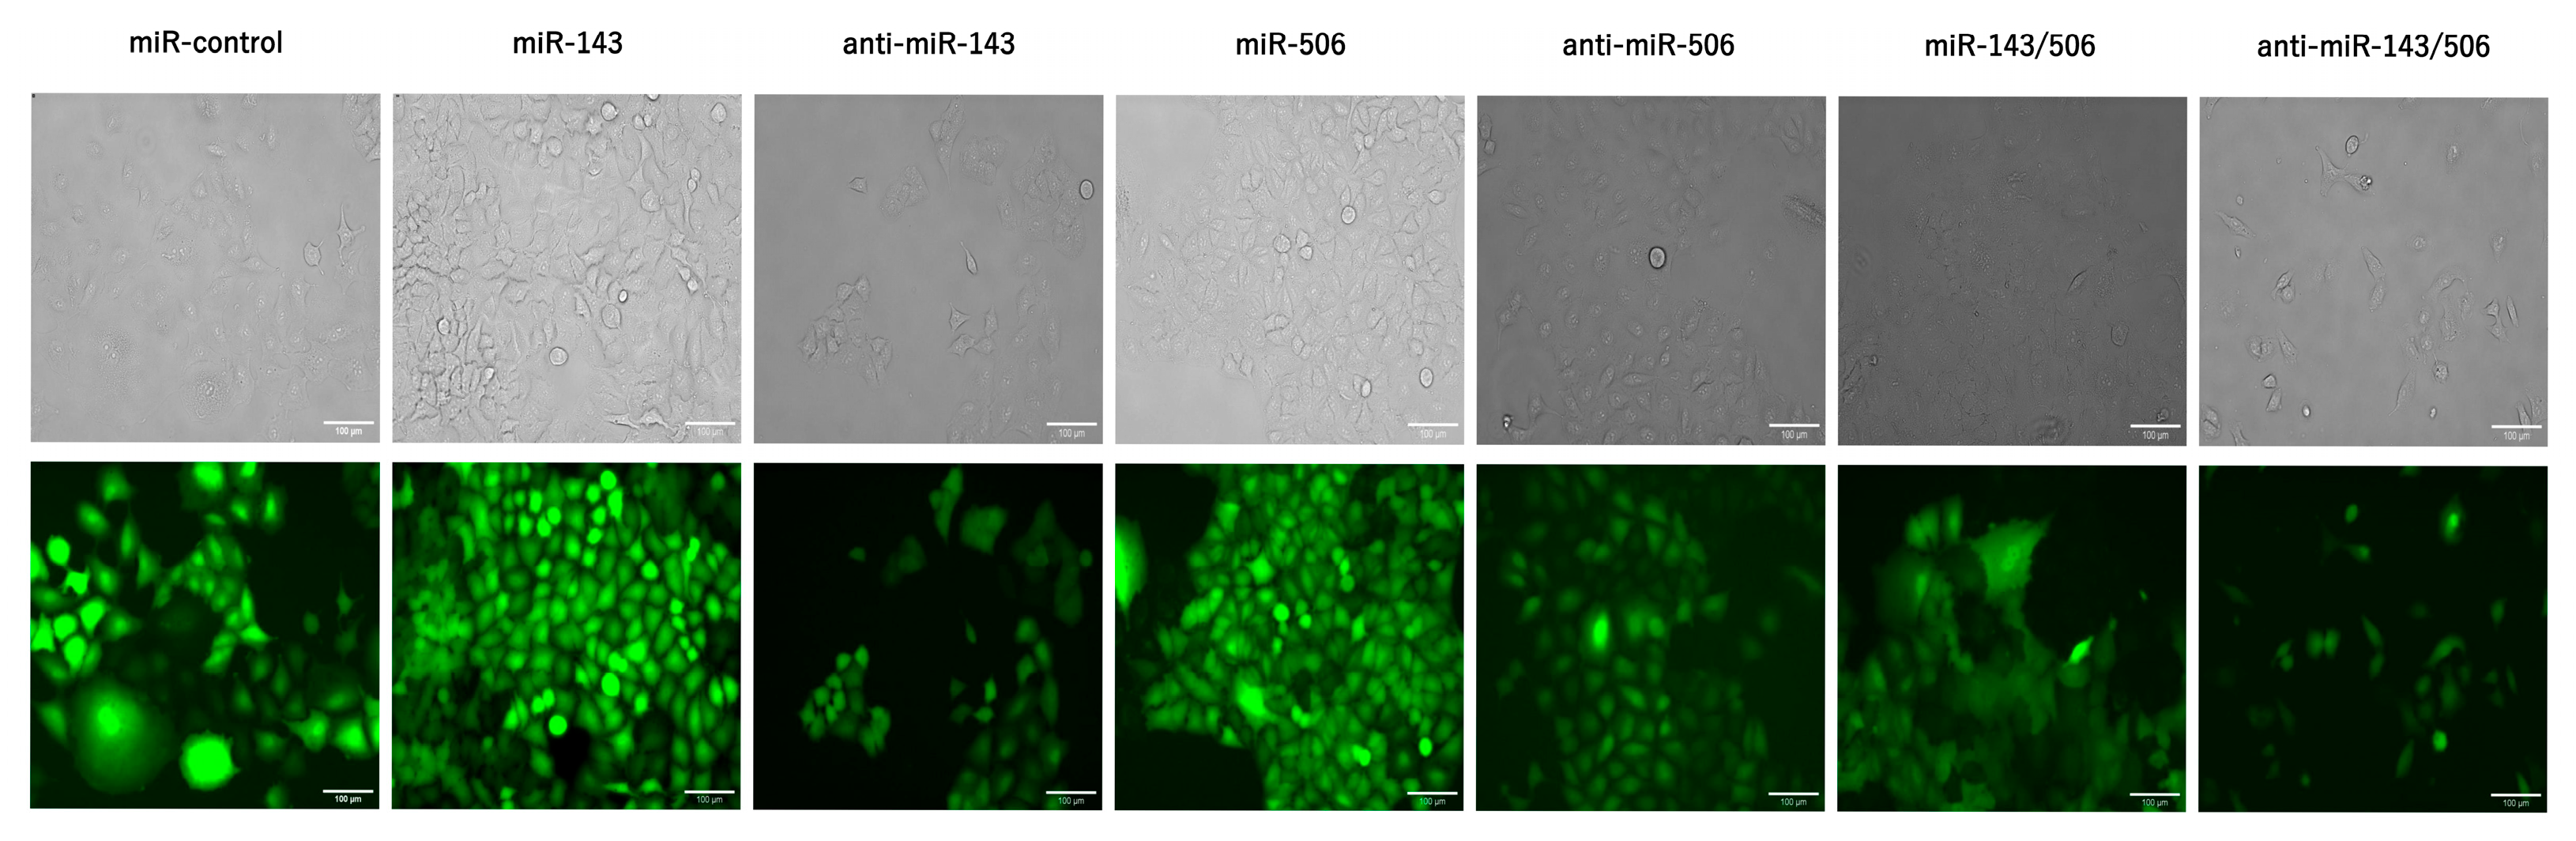
Abstract
:1. Introduction
2. Results
2.1. Stable Transduction of Cells
2.2. miR-143 Deregulation
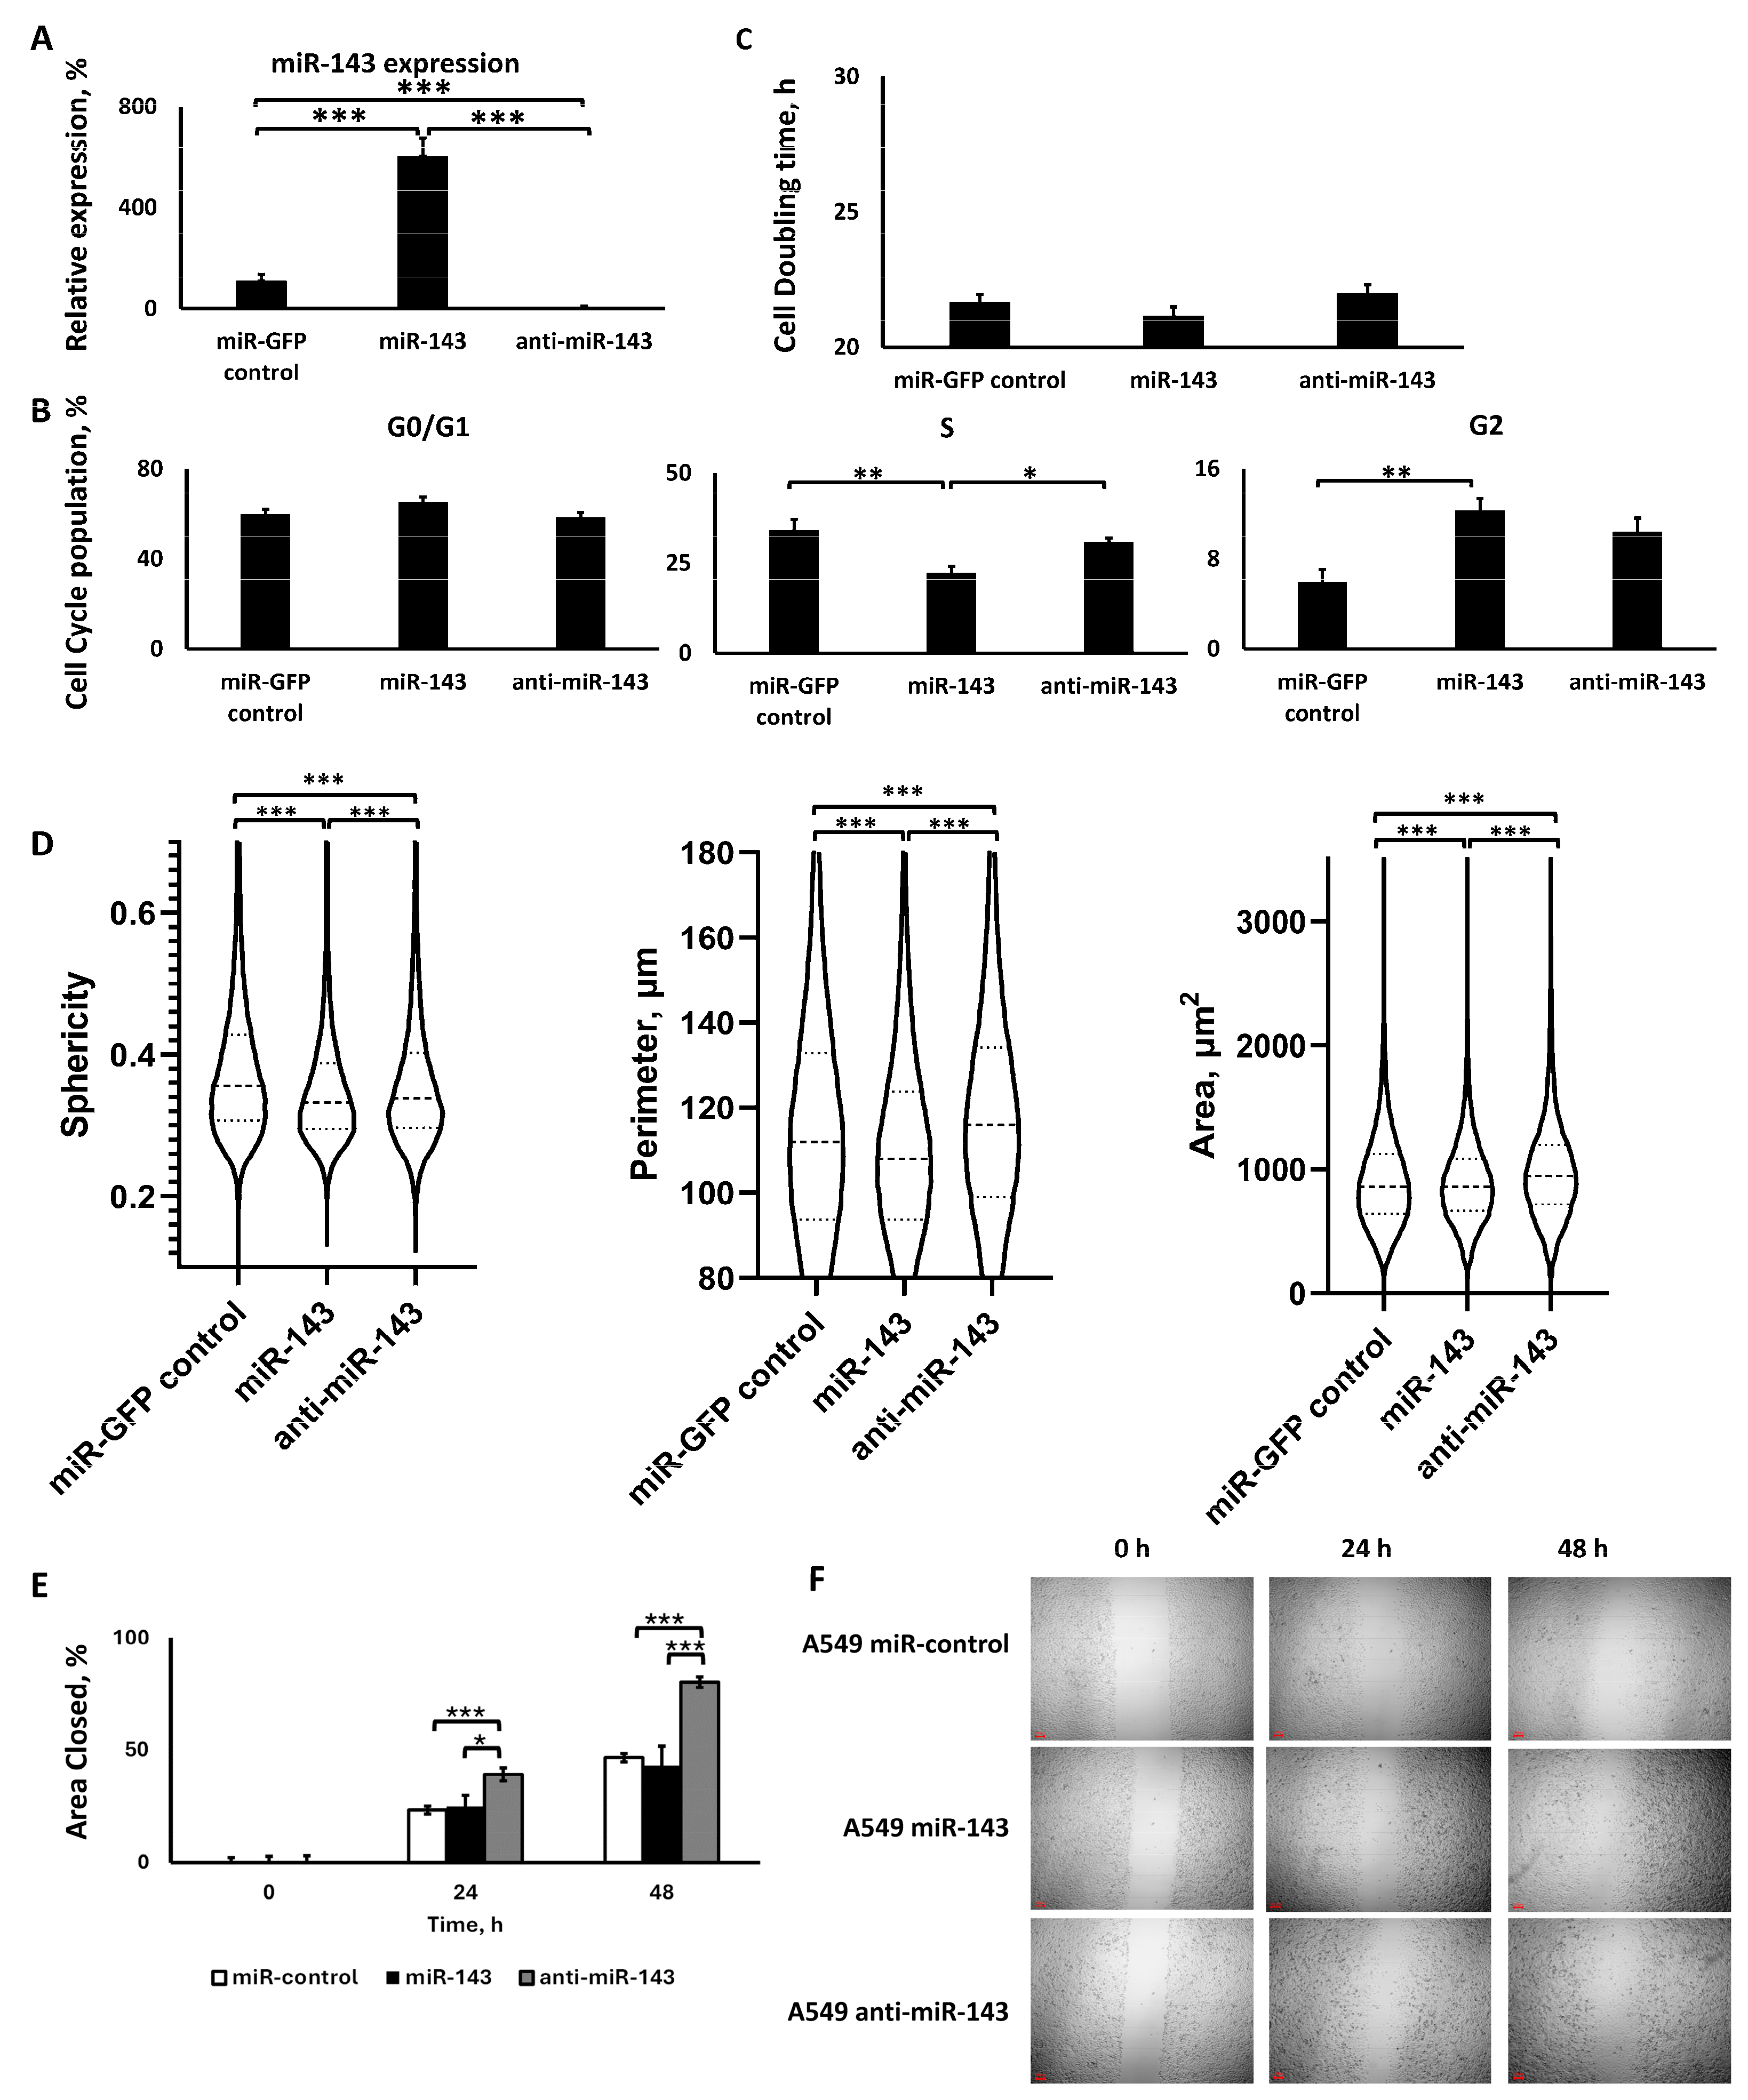
2.2.1. Lentiviral Transduction Induced miR-143 Deregulation
2.2.2. miR-143 Upregulation Decreased S Phase Population, but All miR-143 Deregulations Increased G2 Phase Population, without Affecting Cell Proliferation
2.2.3. The Two miR-143 Deregulations Altered Cell Morphology and Motility in a Similar Manner
2.3. miR-506 Deregulation
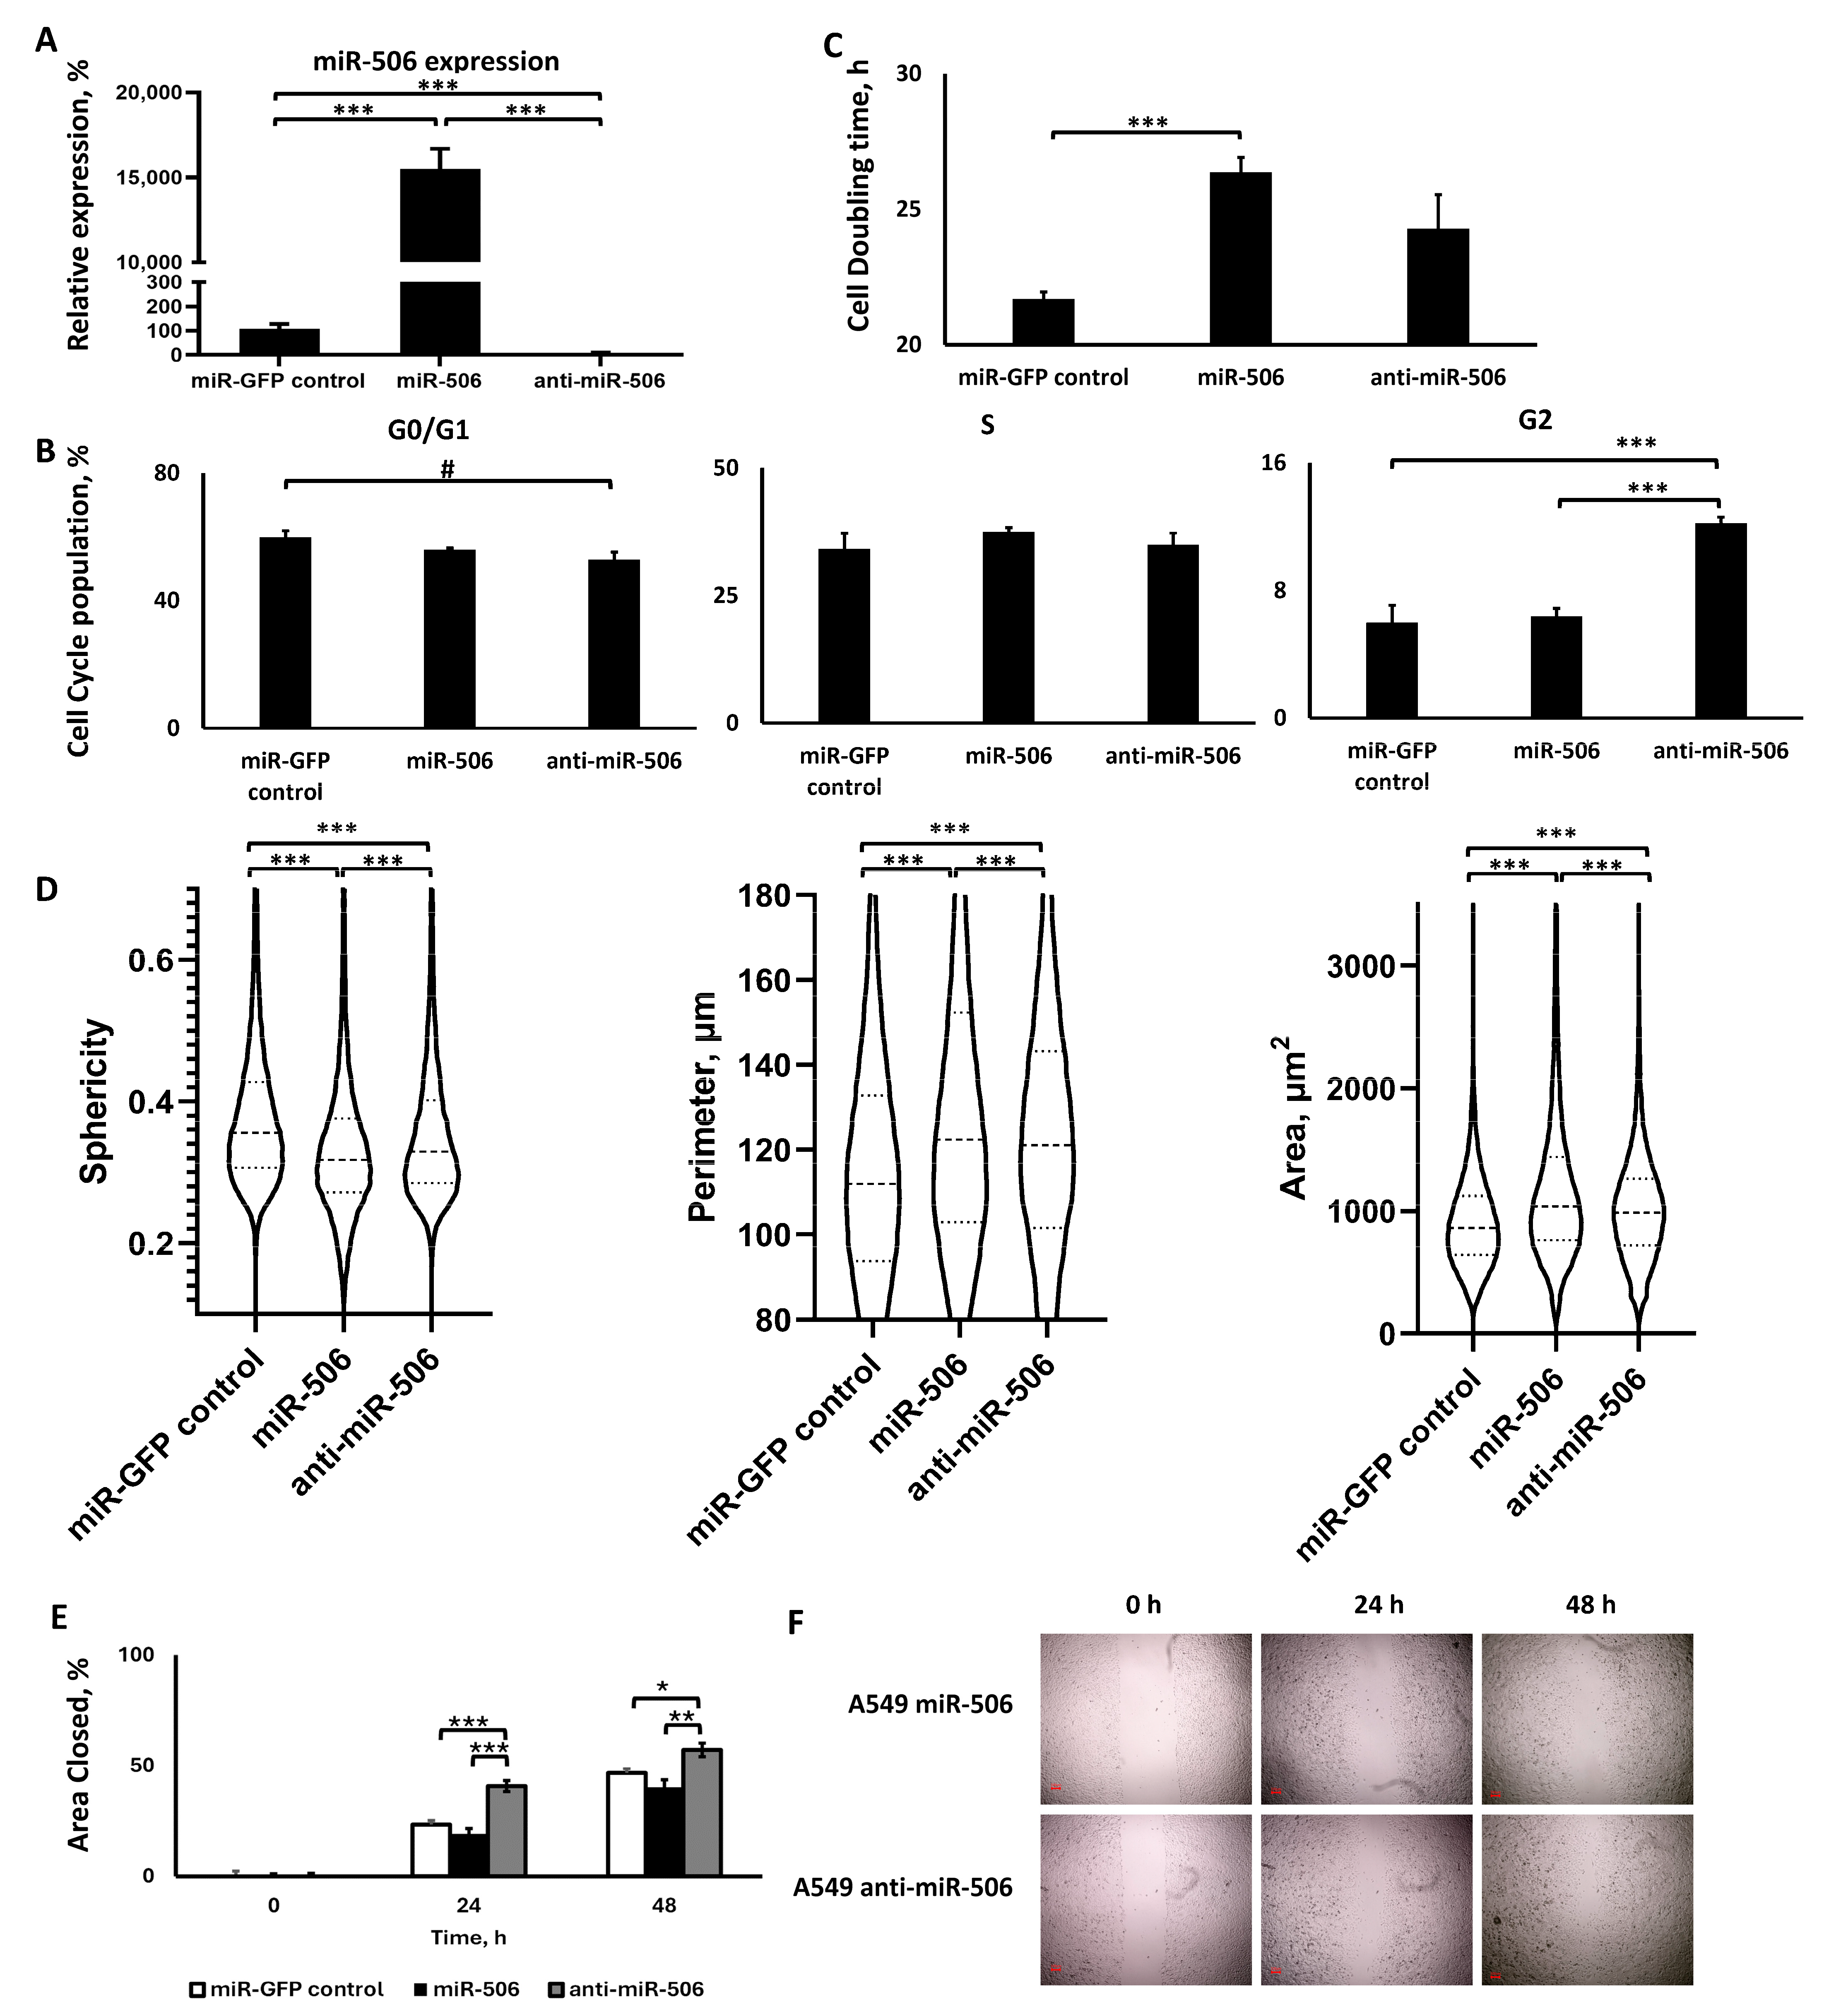
2.3.1. Lentiviral Transduction Induced miR-506 Deregulation
2.3.2. miR-506 Downregulation, but Not Upregulation, Affected the Cell Cycle, but Both Slowed Down Proliferation
2.3.3. The Two miR-506 Deregulations Altered Cell Morphology in a Similar Manner, but Not Motility
2.4. miR-506 and miR-143 Deregulation
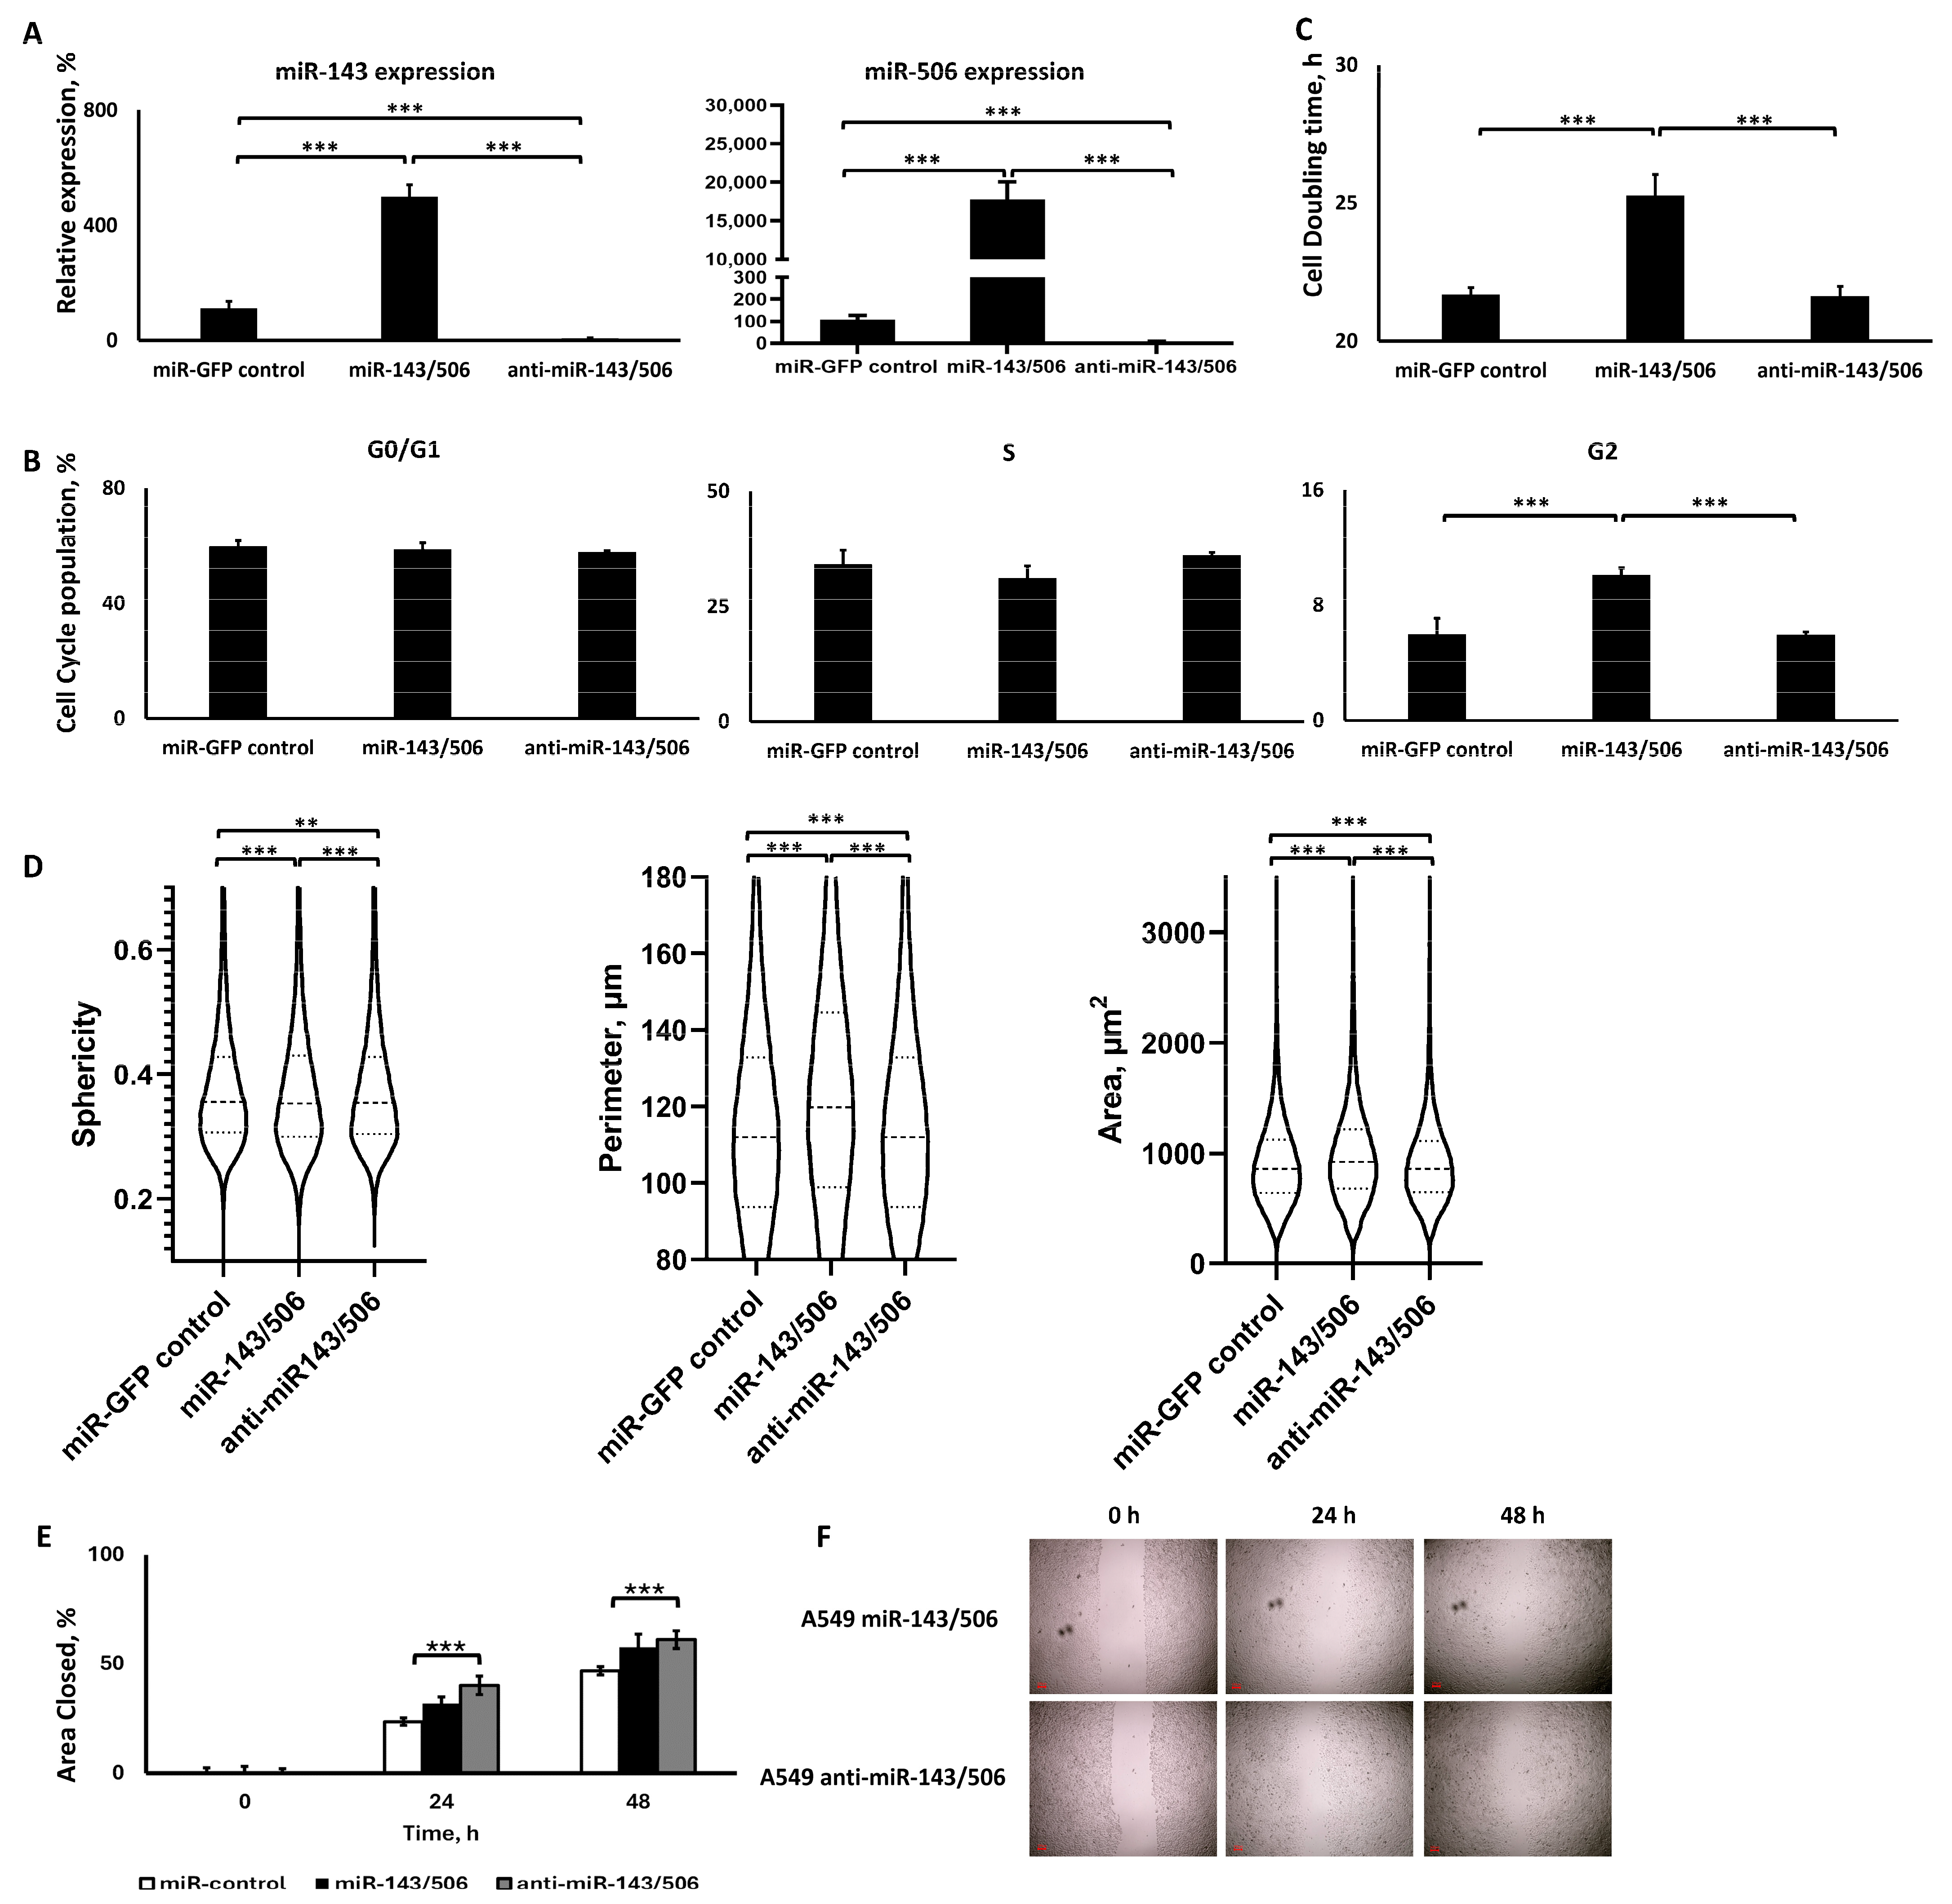
2.4.1. Dual Lentiviral Transduction Induced Both miR-506 and miR-143 Deregulation
2.4.2. miR-143/506 Upregulation Increased G2 Cell Population and Slowed Down Proliferation
2.4.3. miR-143/506 Upregulation Altered Cell Morphology, but miR-143/506 Downregulation Increased Cell Motility
3. Discussion
4. Materials and Methods
4.1. Materials
4.2. Cell Culture
4.3. Stable Cell Line Generation
4.4. Cell Sorting
4.5. RNA Extraction and qPCR Analysis
4.6. Cell Cycle Analysis
4.7. Wound Healing Assay
4.8. Mycoplasma Detection Analysis
4.9. Quantitative Phase Imaging
4.10. Statistical Analyses
5. Conclusions
Supplementary Materials
Author Contributions
Funding
Institutional Review Board Statement
Informed Consent Statement
Data Availability Statement
Conflicts of Interest
References
- Siegel, R.L.; Miller, K.D.; Wagle, N.S.; Jemal, A. Cancer statistics, 2023. CA Cancer J. Clin. 2023, 73, 17–48. [Google Scholar] [CrossRef] [PubMed]
- Labatut, A.E.; Mattheolabakis, G. Non-viral based miR delivery and recent developments. Eur. J. Pharm. Biopharm. 2018, 128, 82–90. [Google Scholar] [CrossRef] [PubMed]
- Plotnikova, O.; Baranova, A.; Skoblov, M. Comprehensive Analysis of Human microRNA-mRNA Interactome. Front. Genet. 2019, 10, 933. [Google Scholar] [CrossRef] [PubMed]
- Zhang, L.; Liao, Y.; Tang, L. MicroRNA-34 family: A potential tumor suppressor and therapeutic candidate in cancer. J. Exp. Clin. Cancer Res. 2019, 38, 53. [Google Scholar] [CrossRef] [PubMed]
- Wu, X.; Cheng, Y.L.; Matthen, M.; Yoon, A.; Schwartz, G.K.; Bala, S.; Taylor, A.M.; Momen-Heravi, F. Down-regulation of the tumor suppressor miR-34a contributes to head and neck cancer by up-regulating the MET oncogene and modulating tumor immune evasion. J. Exp. Clin. Cancer Res. 2021, 40, 70. [Google Scholar] [CrossRef] [PubMed]
- Black, R.C.; Khurshid, H. NSCLC: An Update of Driver Mutations, Their Role in Pathogenesis and Clinical Significance. R. I Med. J. 2015, 98, 25–28. [Google Scholar]
- Li, J.; Ju, J.; Ni, B.; Wang, H. The emerging role of miR-506 in cancer. Oncotarget 2016, 7, 62778–62788. [Google Scholar] [CrossRef] [PubMed]
- Li, Z.H.; Zhou, J.H.; Chen, S.N.; Pan, L.; Feng, Y.; Luo, M.Q.; Li, R.X.; Sun, G.L. MicroRNA-506 has a suppressive effect on the tumorigenesis of nonsmall-cell lung cancer by regulating tubby-like protein 3. Bioengineered 2021, 12, 10176–10186. [Google Scholar] [CrossRef] [PubMed]
- Hossian, A.; Mackenzie, G.G.; Mattheolabakis, G. Combination of miR-143 and miR-506 reduces lung and pancreatic cancer cell growth through the downregulation of cyclin-dependent kinases. Oncol. Rep. 2021, 45, 2. [Google Scholar] [CrossRef] [PubMed]
- Arora, H.; Qureshi, R.; Park, W.Y. miR-506 regulates epithelial mesenchymal transition in breast cancer cell lines. PLoS ONE 2013, 8, e64273. [Google Scholar] [CrossRef] [PubMed]
- Yang, D.; Sun, Y.; Hu, L.; Zheng, H.; Ji, P.; Pecot, C.V.; Zhao, Y.; Reynolds, S.; Cheng, H.; Rupaimoole, R.; et al. Integrated analyses identify a master microRNA regulatory network for the mesenchymal subtype in serous ovarian cancer. Cancer Cell 2013, 23, 186–199. [Google Scholar] [CrossRef] [PubMed]
- Li, J.; Wu, H.; Li, W.; Yin, L.; Guo, S.; Xu, X.; Ouyang, Y.; Zhao, Z.; Liu, S.; Tian, Y.; et al. Downregulated miR-506 expression facilitates pancreatic cancer progression and chemoresistance via SPHK1/Akt/NF-κB signaling. Oncogene 2016, 35, 5501–5514. [Google Scholar] [CrossRef]
- Yin, M.; Ren, X.; Zhang, X.; Luo, Y.; Wang, G.; Huang, K.; Feng, S.; Bao, X.; Huang, K.; He, X.; et al. Selective killing of lung cancer cells by miRNA-506 molecule through inhibiting NF-κB p65 to evoke reactive oxygen species generation and p53 activation. Oncogene 2015, 34, 691–703. [Google Scholar] [CrossRef] [PubMed]
- Tokumaru, Y.; Asaoka, M.; Oshi, M.; Katsuta, E.; Yan, L.; Narayanan, S.; Sugito, N.; Matsuhashi, N.; Futamura, M.; Akao, Y.; et al. High Expression of microRNA-143 is Associated with Favorable Tumor Immune Microenvironment and Better Survival in Estrogen Receptor Positive Breast Cancer. Int. J. Mol. Sci. 2020, 21, 3213. [Google Scholar] [CrossRef] [PubMed]
- Chen, X.; Guo, X.; Zhang, H.; Xiang, Y.; Chen, J.; Yin, Y.; Cai, X.; Wang, K.; Wang, G.; Ba, Y.; et al. Role of miR-143 targeting KRAS in colorectal tumorigenesis. Oncogene 2009, 28, 1385–1392. [Google Scholar] [CrossRef] [PubMed]
- Liu, L.; Yu, X.; Guo, X.; Tian, Z.; Su, M.; Long, Y.; Huang, C.; Zhou, F.; Liu, M.; Wu, X.; et al. miR-143 is downregulated in cervical cancer and promotes apoptosis and inhibits tumor formation by targeting Bcl-2. Mol. Med. Rep. 2012, 5, 753–760. [Google Scholar] [CrossRef] [PubMed]
- Shi, H.; Shen, H.; Xu, J.; Zhao, S.; Yao, S.; Jiang, N. MiR-143-3p suppresses the progression of ovarian cancer. Am. J. Transl. Res. 2018, 10, 866–874. [Google Scholar] [PubMed]
- Hossian, A.K.M.N.; Sajib, M.S.; Tullar, P.E.; Mikelis, C.M.; Mattheolabakis, G. Multipronged activity of combinatorial miR-143 and miR-506 inhibits Lung Cancer cell cycle progression and angiogenesis in vitro. Sci. Rep. 2018, 8, 10495. [Google Scholar] [CrossRef] [PubMed]
- Chang, L.; Zhang, D.; Shi, H.; Bian, Y.; Guo, R. MiR-143 inhibits endometrial cancer cell proliferation and metastasis by targeting MAPK1. Oncotarget 2017, 8, 84384–84395. [Google Scholar] [CrossRef] [PubMed]
- Hartmann, J.-U.; Bräuer-Hartmann, D.; Kardosova, M.; Wurm, A.A.; Wilke, F.; Schödel, C.; Gerloff, D.; Katzerke, C.; Krakowsky, R.; Namasu, C.Y.; et al. MicroRNA-143 targets ERK5 in granulopoiesis and predicts outcome of patients with acute myeloid leukemia. Cell Death Dis. 2018, 9, 814. [Google Scholar] [CrossRef] [PubMed]
- Xia, C.; Yang, Y.; Kong, F.; Kong, Q.; Shan, C. MiR-143-3p inhibits the proliferation, cell migration and invasion of human breast cancer cells by modulating the expression of MAPK7. Biochimie 2018, 147, 98–104. [Google Scholar] [CrossRef] [PubMed]
- Peng, X.; Guo, W.; Liu, T.; Wang, X.; Tu, X.; Xiong, D.; Chen, S.; Lai, Y.; Du, H.; Chen, G.; et al. Identification of miRs-143 and -145 that is associated with bone metastasis of prostate cancer and involved in the regulation of EMT. PLoS ONE 2011, 6, e20341. [Google Scholar] [CrossRef] [PubMed]
- Cheng, T.; Hu, C.; Yang, H.; Cao, L.; An, J. Transforming growth factor-β-induced miR-143 expression in regulation of non-small cell lung cancer cell viability and invasion capacity in vitro and in vivo. Int. J. Oncol. 2014, 45, 1977–1988. [Google Scholar] [CrossRef]
- Liu, G.; Sun, Y.; Ji, P.; Li, X.; Cogdell, D.; Yang, D.; Parker Kerrigan, B.C.; Shmulevich, I.; Chen, K.; Sood, A.K.; et al. MiR-506 suppresses proliferation and induces senescence by directly targeting the CDK4/6-FOXM1 axis in ovarian cancer. J. Pathol. 2014, 233, 308–318. [Google Scholar] [CrossRef] [PubMed]
- Zhao, Z.; Ma, X.; Hsiao, T.H.; Lin, G.; Kosti, A.; Yu, X.; Suresh, U.; Chen, Y.; Tomlinson, G.E.; Pertsemlidis, A.; et al. A high-content morphological screen identifies novel microRNAs that regulate neuroblastoma cell differentiation. Oncotarget 2014, 5, 2499–2512. [Google Scholar] [CrossRef]
- Li, Q.; Bian, Y.; Li, Q. Down-Regulation of TMPO-AS1 Induces Apoptosis in Lung Carcinoma Cells by Regulating miR-143-3p/CDK1 Axis. Technol. Cancer Res. Treat. 2021, 20, 1533033820948880. [Google Scholar] [CrossRef] [PubMed]
- Anton, L.; DeVine, A.; Sierra, L.-J.; Brown, A.G.; Elovitz, M.A. miR-143 and miR-145 disrupt the cervical epithelial barrier through dysregulation of cell adhesion, apoptosis and proliferation. Sci. Rep. 2017, 7, 3020. [Google Scholar] [CrossRef] [PubMed]
- Gaponova, S.; Patutina, O.; Sen’kova, A.; Burakova, E.; Savin, I.; Markov, A.; Shmendel, E.; Maslov, M.; Stetsenko, D.; Vlassov, V.; et al. Single Shot vs. Cocktail: A Comparison of Mono- and Combinative Application of miRNA-Targeted Mesyl Oligonucleotides for Efficient Antitumor Therapy. Cancers 2022, 14, 4396. [Google Scholar] [CrossRef] [PubMed]
- Tang, J.; Pan, H.; Wang, W.; Qi, C.; Gu, C.; Shang, A.; Zhu, J. MiR-495-3p and miR-143-3p co-target CDK1 to inhibit the development of cervical cancer. Clin. Transl. Oncol. 2021, 23, 2323–2334. [Google Scholar] [CrossRef] [PubMed]
- Xia, H.; Sun, S.; Wang, B.; Wang, T.; Liang, C.; Li, G.; Huang, C.; Qi, D.; Chu, X. miR-143 inhibits NSCLC cell growth and metastasis by targeting Limk1. Int. J. Mol. Sci. 2014, 15, 11973–11983. [Google Scholar] [CrossRef] [PubMed]
- Guo, S.; Yang, P.; Jiang, X.; Li, X.; Wang, Y.; Zhang, X.; Sun, B.; Zhang, Y.; Jia, Y. Genetic and epigenetic silencing of mircoRNA-506-3p enhances COTL1 oncogene expression to foster non-small lung cancer progression. Oncotarget 2017, 8, 644–657. [Google Scholar] [CrossRef] [PubMed]
- Yang, Y.; Li, S.; Cao, J.; Li, Y.; Hu, H.; Wu, Z. RRM2 Regulated By LINC00667/miR-143-3p Signal Is Responsible For Non-Small Cell Lung Cancer Cell Progression. Onco Targets Ther. 2019, 12, 9927–9939. [Google Scholar] [CrossRef] [PubMed]
- Hossian, A.; Muthumula, C.M.R.; Sajib, M.S.; Tullar, P.E.; Stelly, A.M.; Briski, K.P.; Mikelis, C.M.; Mattheolabakis, G. Analysis of Combinatorial miRNA Treatments to Regulate Cell Cycle and Angiogenesis. J. Vis. Exp. 2019. [Google Scholar] [CrossRef]
- Sun, X.; Dai, G.; Yu, L.; Hu, Q.; Chen, J.; Guo, W. miR-143-3p inhibits the proliferation, migration and invasion in osteosarcoma by targeting FOSL2. Sci. Rep. 2018, 8, 606. [Google Scholar] [CrossRef] [PubMed]
- Ma, Q.; Jiang, Q.; Pu, Q.; Zhang, X.; Yang, W.; Wang, Y.; Ye, S.; Wu, S.; Zhong, G.; Ren, J.; et al. MicroRNA-143 inhibits migration and invasion of human non-small-cell lung cancer and its relative mechanism. Int. J. Biol. Sci. 2013, 9, 680–692. [Google Scholar] [CrossRef] [PubMed]
- Wang, Z.; Si, M.; Yang, N.; Zhang, H.; Fu, Y.; Yan, K.; Zong, Y.; Zhu, N.; Wei, Y. MicroRNA-506 suppresses invasiveness and metastasis of human hepatocellular carcinoma cells by targeting IL8. Am. J. Cancer Res. 2018, 8, 1586–1594. [Google Scholar] [PubMed]
- Pucci, B.; Kasten, M.; Giordano, A. Cell cycle and apoptosis. Neoplasia 2000, 2, 291–299. [Google Scholar] [CrossRef] [PubMed]
- Zhou, W.; Wang, W.; Liang, Y.; Jiang, R.; Qiu, F.; Shao, X.; Liu, Y.; Fang, L.; Ni, M.; Yu, C.; et al. The RNA-binding protein LRPPRC promotes resistance to CDK4/6 inhibition in lung cancer. Nat. Commun. 2023, 14, 4212. [Google Scholar] [CrossRef] [PubMed]
- Haines, E.; Chen, T.; Kommajosyula, N.; Chen, Z.; Herter-Sprie, G.S.; Cornell, L.; Wong, K.K.; Shapiro, G.I. Palbociclib resistance confers dependence on an FGFR-MAP kinase-mTOR-driven pathway in KRAS-mutant non-small cell lung cancer. Oncotarget 2018, 9, 31572–31589. [Google Scholar] [CrossRef] [PubMed]
- Watt, A.C.; Goel, S. Cellular mechanisms underlying response and resistance to CDK4/6 inhibitors in the treatment of hormone receptor-positive breast cancer. Breast Cancer Res. 2022, 24, 17. [Google Scholar] [CrossRef]
- Li, Z.; Zou, W.; Zhang, J.; Zhang, Y.; Xu, Q.; Li, S.; Chen, C. Mechanisms of CDK4/6 Inhibitor Resistance in Luminal Breast Cancer. Front. Pharmacol. 2020, 11, 580251. [Google Scholar] [CrossRef] [PubMed]
- Cornell, L.; Wander, S.A.; Visal, T.; Wagle, N.; Shapiro, G.I. MicroRNA-Mediated Suppression of the TGF-beta Pathway Confers Transmissible and Reversible CDK4/6 Inhibitor Resistance. Cell Rep. 2019, 26, 2667–2680.e2667. [Google Scholar] [CrossRef] [PubMed]
- Hou, Y. MiR-506 inhibits cell proliferation, invasion, migration and epithelial-to-mesenchymal transition through targeting RWDD4 in human bladder cancer. Oncol. Lett. 2019, 17, 73–78. [Google Scholar] [CrossRef] [PubMed]
- Li, L.; Wei, H.; Zhang, H.; Xu, F.; Che, G. Circ_100565 promotes proliferation, migration and invasion in non-small cell lung cancer through upregulating HMGA2 via sponging miR-506-3p. Cancer Cell Int. 2020, 20, 160. [Google Scholar] [CrossRef] [PubMed]
- Wang, H.; Deng, Q.; Lv, Z.; Ling, Y.; Hou, X.; Chen, Z.; Dinglin, X.; Ma, S.; Li, D.; Wu, Y.; et al. N6-methyladenosine induced miR-143-3p promotes the brain metastasis of lung cancer via regulation of VASH1. Mol. Cancer 2019, 18, 181. [Google Scholar] [CrossRef] [PubMed]
- Jiang, X.F.E.I.W.H.U.G.W.C.S.U.X.H.Z. Effect of microRNA-143-3p-mediated CTNND1 on the biological function of lung cancer cells. BIOCELL 2020, 44, 81–88. [Google Scholar] [CrossRef]
- Asghariazar, V.; Mansoori, B.; Kadkhodayi, M.; Safarzadeh, E.; Mohammadi, A.; Baradaran, B.; Sakhinia, E. MicroRNA-143 act as a tumor suppressor microRNA in human lung cancer cells by inhibiting cell proliferation, invasion, and migration. Mol. Biol. Rep. 2022, 49, 7637–7647. [Google Scholar] [CrossRef] [PubMed]
- Chen, R.; Zhang, C.; Cheng, Y.; Wang, S.; Lin, H.; Zhang, H. LncRNA UCC promotes epithelial-mesenchymal transition via the miR-143-3p/SOX5 axis in non-small-cell lung cancer. Lab. Investig. 2021, 101, 1153–1165. [Google Scholar] [CrossRef] [PubMed]
- Sanada, H.; Seki, N.; Mizuno, K.; Misono, S.; Uchida, A.; Yamada, Y.; Moriya, S.; Kikkawa, N.; Machida, K.; Kumamoto, T.; et al. Involvement of Dual Strands of miR-143 (miR-143-5p and miR-143-3p) and Their Target Oncogenes in the Molecular Pathogenesis of Lung Adenocarcinoma. Int. J. Mol. Sci. 2019, 20, 4482. [Google Scholar] [CrossRef]
- Youn, A.; Simon, R. Identifying cancer driver genes in tumor genome sequencing studies. Bioinformatics 2011, 27, 175–181. [Google Scholar] [CrossRef] [PubMed]
- Hynds, R.E.; Frese, K.K.; Pearce, D.R.; Gronroos, E.; Dive, C.; Swanton, C. Progress towards non-small-cell lung cancer models that represent clinical evolutionary trajectories. Open Biol. 2021, 11, 200247. [Google Scholar] [CrossRef] [PubMed]
- Guorgui, J.; Wang, R.; Mattheolabakis, G.; Mackenzie, G.G. Curcumin formulated in solid lipid nanoparticles has enhanced efficacy in Hodgkin’s lymphoma in mice. Arch. Biochem. Biophys. 2018, 648, 12–19. [Google Scholar] [CrossRef] [PubMed]
- Hossian, A.K.M.N.; Zahra, F.T.; Poudel, S.; Abshire, C.F.; Polk, P.; Garai, J.; Zabaleta, J.; Mikelis, C.M.; Mattheolabakis, G. Advanced bioinformatic analysis and pathway prediction of NSCLC cells upon cisplatin resistance. Sci. Rep. 2021, 11, 6520. [Google Scholar] [CrossRef] [PubMed]
- Shrestha, A.; Lahooti, B.; Mikelis, C.M.; Mattheolabakis, G. Chlorotoxin and Lung Cancer: A Targeting Perspective for Drug Delivery. Pharmaceutics 2022, 14, 2613. [Google Scholar] [CrossRef] [PubMed]


Disclaimer/Publisher’s Note: The statements, opinions and data contained in all publications are solely those of the individual author(s) and contributor(s) and not of MDPI and/or the editor(s). MDPI and/or the editor(s) disclaim responsibility for any injury to people or property resulting from any ideas, methods, instructions or products referred to in the content. |
© 2024 by the authors. Licensee MDPI, Basel, Switzerland. This article is an open access article distributed under the terms and conditions of the Creative Commons Attribution (CC BY) license (https://creativecommons.org/licenses/by/4.0/).
Share and Cite
Shrestha, A.; Lahooti, B.; Hossian, A.K.M.N.; Madadi, M.; Mikelis, C.M.; Mattheolabakis, G. Stable Dual miR-143 and miR-506 Upregulation Inhibits Proliferation and Cell Cycle Progression. Int. J. Mol. Sci. 2024, 25, 4432. https://doi.org/10.3390/ijms25084432
Shrestha A, Lahooti B, Hossian AKMN, Madadi M, Mikelis CM, Mattheolabakis G. Stable Dual miR-143 and miR-506 Upregulation Inhibits Proliferation and Cell Cycle Progression. International Journal of Molecular Sciences. 2024; 25(8):4432. https://doi.org/10.3390/ijms25084432
Chicago/Turabian StyleShrestha, Archana, Behnaz Lahooti, A. K. M. Nawshad Hossian, Mahboubeh Madadi, Constantinos M. Mikelis, and George Mattheolabakis. 2024. "Stable Dual miR-143 and miR-506 Upregulation Inhibits Proliferation and Cell Cycle Progression" International Journal of Molecular Sciences 25, no. 8: 4432. https://doi.org/10.3390/ijms25084432