Abstract
Both high serum insulin-like growth factor-binding protein-1 (s-IGFBP-1) and insulin resistance (IR) are associated with poor functional outcome poststroke, whereas overweight body mass index (BMI; 25–30) is related to fewer deaths and favorable functional outcome in a phenomenon labeled “the obesity paradox”. Furthermore, IGFBP-1 is inversely related to BMI, in contrast to the linear relation between IR and BMI. Here, we investigated s-IGFBP-1 and IR concerning BMI and 7-year poststroke functional outcome. We included 451 stroke patients from the Sahlgrenska Study on Ischemic Stroke (SAHLSIS) with baseline measurements of s-IGFBP1, homeostasis model assessment of IR (HOMA-IR), BMI (categories: normal-weight (8.5–25), overweight (25–30), and obesity (>30)), and high-sensitivity C-reactive protein (hs-CRP) as a measure of general inflammation. Associations with poor functional outcome (modified Rankin scale [mRS] score: 3–6) after 7 years were evaluated using multivariable binary logistic regression, with overweight as reference due to the nonlinear relationship. Both normal-weight (odds-ratio [OR] 2.32, 95% confidence interval [CI] 1.30–4.14) and obese (OR 2.25, 95% CI 1.08–4.71) patients had an increased risk of poor functional outcome, driven by deaths only in the normal-weight. In normal-weight, s-IGFBP-1 modestly attenuated (8.3%) this association. In the obese, the association was instead attenuated by HOMA-IR (22.4%) and hs-CRP (10.4%). Thus, a nonlinear relation between BMI and poor 7-year functional outcome was differently attenuated in the normal-weight and the obese.
1. Introduction
Ischemic stroke (henceforth stroke) has high mortality and disability worldwide [1]. Among stroke survivors, the recovery period sometimes extends for years [2]. High body mass index (BMI) is a risk factor for developing stroke, with increased risks for the overweight (BMI 25–30) and obese (BMI > 30), as compared with the normal-weight (BMI 18.5–25) individuals [3]. In contrast, in the poststroke period, it has been puzzling why normal-weight patients with better overall risk profiles do not also have the best recovery and survival [4,5]. In fact, BMI above the normal range has been associated with better prognosis in both stroke and a broad range of cardiovascular diseases (CVD), which is often referred to as the “obesity paradox” [5,6,7,8]. Most often, the overweight range of BMI 25–30 has been associated with better outcomes, especially mortality, than normal range BMI (18.5–25) or obese BMI (>30) [6,8]. This holds, although BMI has been criticized for not being a perfect measure of overweight. For example, ethnicity, sex, visceral fat distribution, and muscle mass may be important confounding factors affecting true metabolic burden [9]. However, despite these limitations, BMI has been shown as one of the better indices to predict dyslipidemia [10].
There are conflicting explanations for the obesity paradox. One hypothesis is that the obesity paradox is merely a result of BMI measurements in prevalent CVD, with disease-related weight loss and survival bias [11]. However, other studies have found an obesity paradox not only for prevalent stroke patients with BMI measurements in the poststroke phase, but also for incident stroke with BMI measurements in a healthy state before the event [8]. Consequently, one proposed explanation for the obesity paradox is an increased metabolic reserve in adipose tissue and skeletal muscle, which protects against the increased catabolic drive and suppressed anabolic stimulation after stroke [12]. It has also been proposed that possible mechanisms for the obesity paradox could be specific anti-inflammatory effects of adipose tissue [13], as well as different mechanisms of hypertension between normal-weight (BMI 18.5–25) and overweight (BMI 25–30) patients [14].
Another part of the obesity paradox is insulin resistance (IR), which is related to BMI and linked to an increased risk of stroke and other CVD [15]. IR may be quantified by several methods, including the homeostasis model assessment of insulin resistance (HOMA-IR). HOMA-IR is easier to monitor than the golden standard euglycemic clamp method, and there is a high correlation between IR estimations using HOMA-IR and the euglycemic clamp method [16]. Impaired HOMA-IR is a well-known risk factor for incident stroke [17], as well as for poor poststroke functional outcome and mortality [18]. Insulin resistance, in turn, is also related to general inflammation, as indexed by, for example, serum levels of C-reactive protein (CRP, for review see: [19]). Although CRP is produced at higher levels in the liver in response to infections and high-degree inflammation [19], there is also a low-grade inflammation with CRP released from the vascular endothelium thought to mirror atherosclerosis [20]. Regardless of the exact mechanism of CRP elevation, it associates with general stroke [21] and CVD risk [22]. After a stroke, CRP has also been shown to independently associate with poor functional outcome [23].
Related to IR is insulin-like growth factor-binding protein-1 (IGFBP-1), which typically binds insulin-like growth factor 1 (IGF-1), resulting in reduced IGF-1-activity [24,25]. Levels of s-IGFBP-1 are negatively correlated with IR [26,27] and BMI [28]. Furthermore, several studies have shown that high levels of s-IGFBP-1 are associated with worse outcome after cardiovascular events [25,29,30]. In line with this, high s-IGFBP-1 is considered a marker for general catabolic states and borderline cachexia [31]. However, to our knowledge, no study has investigated whether s-IGFBP-1 could explain the obesity paradox in stroke.
Here, we aimed to examine the obesity paradox concerning long-term poststroke outcomes and possible mediators. We have also included HOMA-IR, a common cardiovascular risk factor in the analysis, and high-sensitivity C-reactive protein (hs-CRP) as a marker of chronic inflammation [19]. Therefore, we investigated ischemic stroke patients from the Sahlgrenska Academy Study on Ischemic Stroke (SAHLSIS) cohort, regarding relationships between BMI, s-IGFBP-1, HOMA-IR, and functional outcome evaluated by modified Ranking scale (mRS) at poststroke follow-up at 7 years. For regressions, postulating from earlier studies of the obesity paradox that there is a nonlinear relationship between BMI and outcome [5,6,7,8], we used overweight (BMI 25–30) as a reference versus the other BMI categories, i.e., for the convenience of understanding adjustments.
2. Results
2.1. Baseline Characteristics and Correlations
The baseline characteristics of the included patients (n = 451) are summarized in Table 1. As the aim was to investigate the proposed obesity paradox, data in Table 1 are also shown for three BMI categories (normal-weight, overweight, and obesity). Age and sex distributions differed slightly between BMI categories, where the obese were 3.5 years older than the normal-weight, and the normal-weight group comprised more females than the overweight group. There were also higher proportions of hypertension and diabetes in patients with higher BMI category. In contrast, smoking was more frequent in the normal-weight category, as expected. In terms of s-IGFBP-1, it was lower in higher BMI categories. Specifically, the mean s-IGFBP1 in obese (BMI > 30) patients was 52% of that in normal-weight (BMI 18.5–25) patients. Hs-CRP was numerically higher in the normal-weight (BMI 18.5–25) and obese (BMI > 30) patients. National Institutes of Health Stroke Scale (NIHSS) score and frequency of previous stroke did not significantly differ between the BMI categories.

Table 1.
Associations and differences between normal-weight, overweight, and obese stroke patients in baseline values and outcome.
Correlation matrices for the factors of investigation are given in Table 2. The Spearman correlation analyses showed significant correlations between BMI, s-IGFBP-1, HOMA-IR, and hs-CRP. Of note, s-IGFBP-1 displayed a small significant negative correlation with BMI (r = −0.24) and a moderate negative correlation with HOMA-IR (r = −0.32). Additionally, HOMA-IR showed a moderate positive correlation with BMI (r = 0.38) and a small positive correlation with hs-CRP (r = 0.22).
Table 2.
Correlations between BMI, HOMA-IR, s-IGFBP-1, and hs-CRP.
2.2. BMI and Poststroke Functional Outcome
The number of patients with poor poststroke functional outcomes at 3 months, 2 years, and 7 years in normal-weight, overweight, and obesity is presented in Table 3. The number of deaths and previous strokes, used for the sensitivity analysis below, are shown in Supplementary Table S2. At 3 months and 2 years poststroke, the proportion of cases with poor functional outcomes was similar in the three BMI categories. At 7 years of follow-up, there was a larger proportion of patients with poor functional outcome, with significant differences between the three BMI categories. Specifically, at 7 years poststroke, only 28.0% of the overweight (BMI 25–30) patients had poor functional outcome compared to 42.2% in the normal-weight (BMI 18.5–25) patients (p = 0.004) and 48.7% in the obese (BMI > 30) patients (p = 0.001).
Table 3.
Poor functional outcome after 3 months, 2 years, and 7 years poststroke.
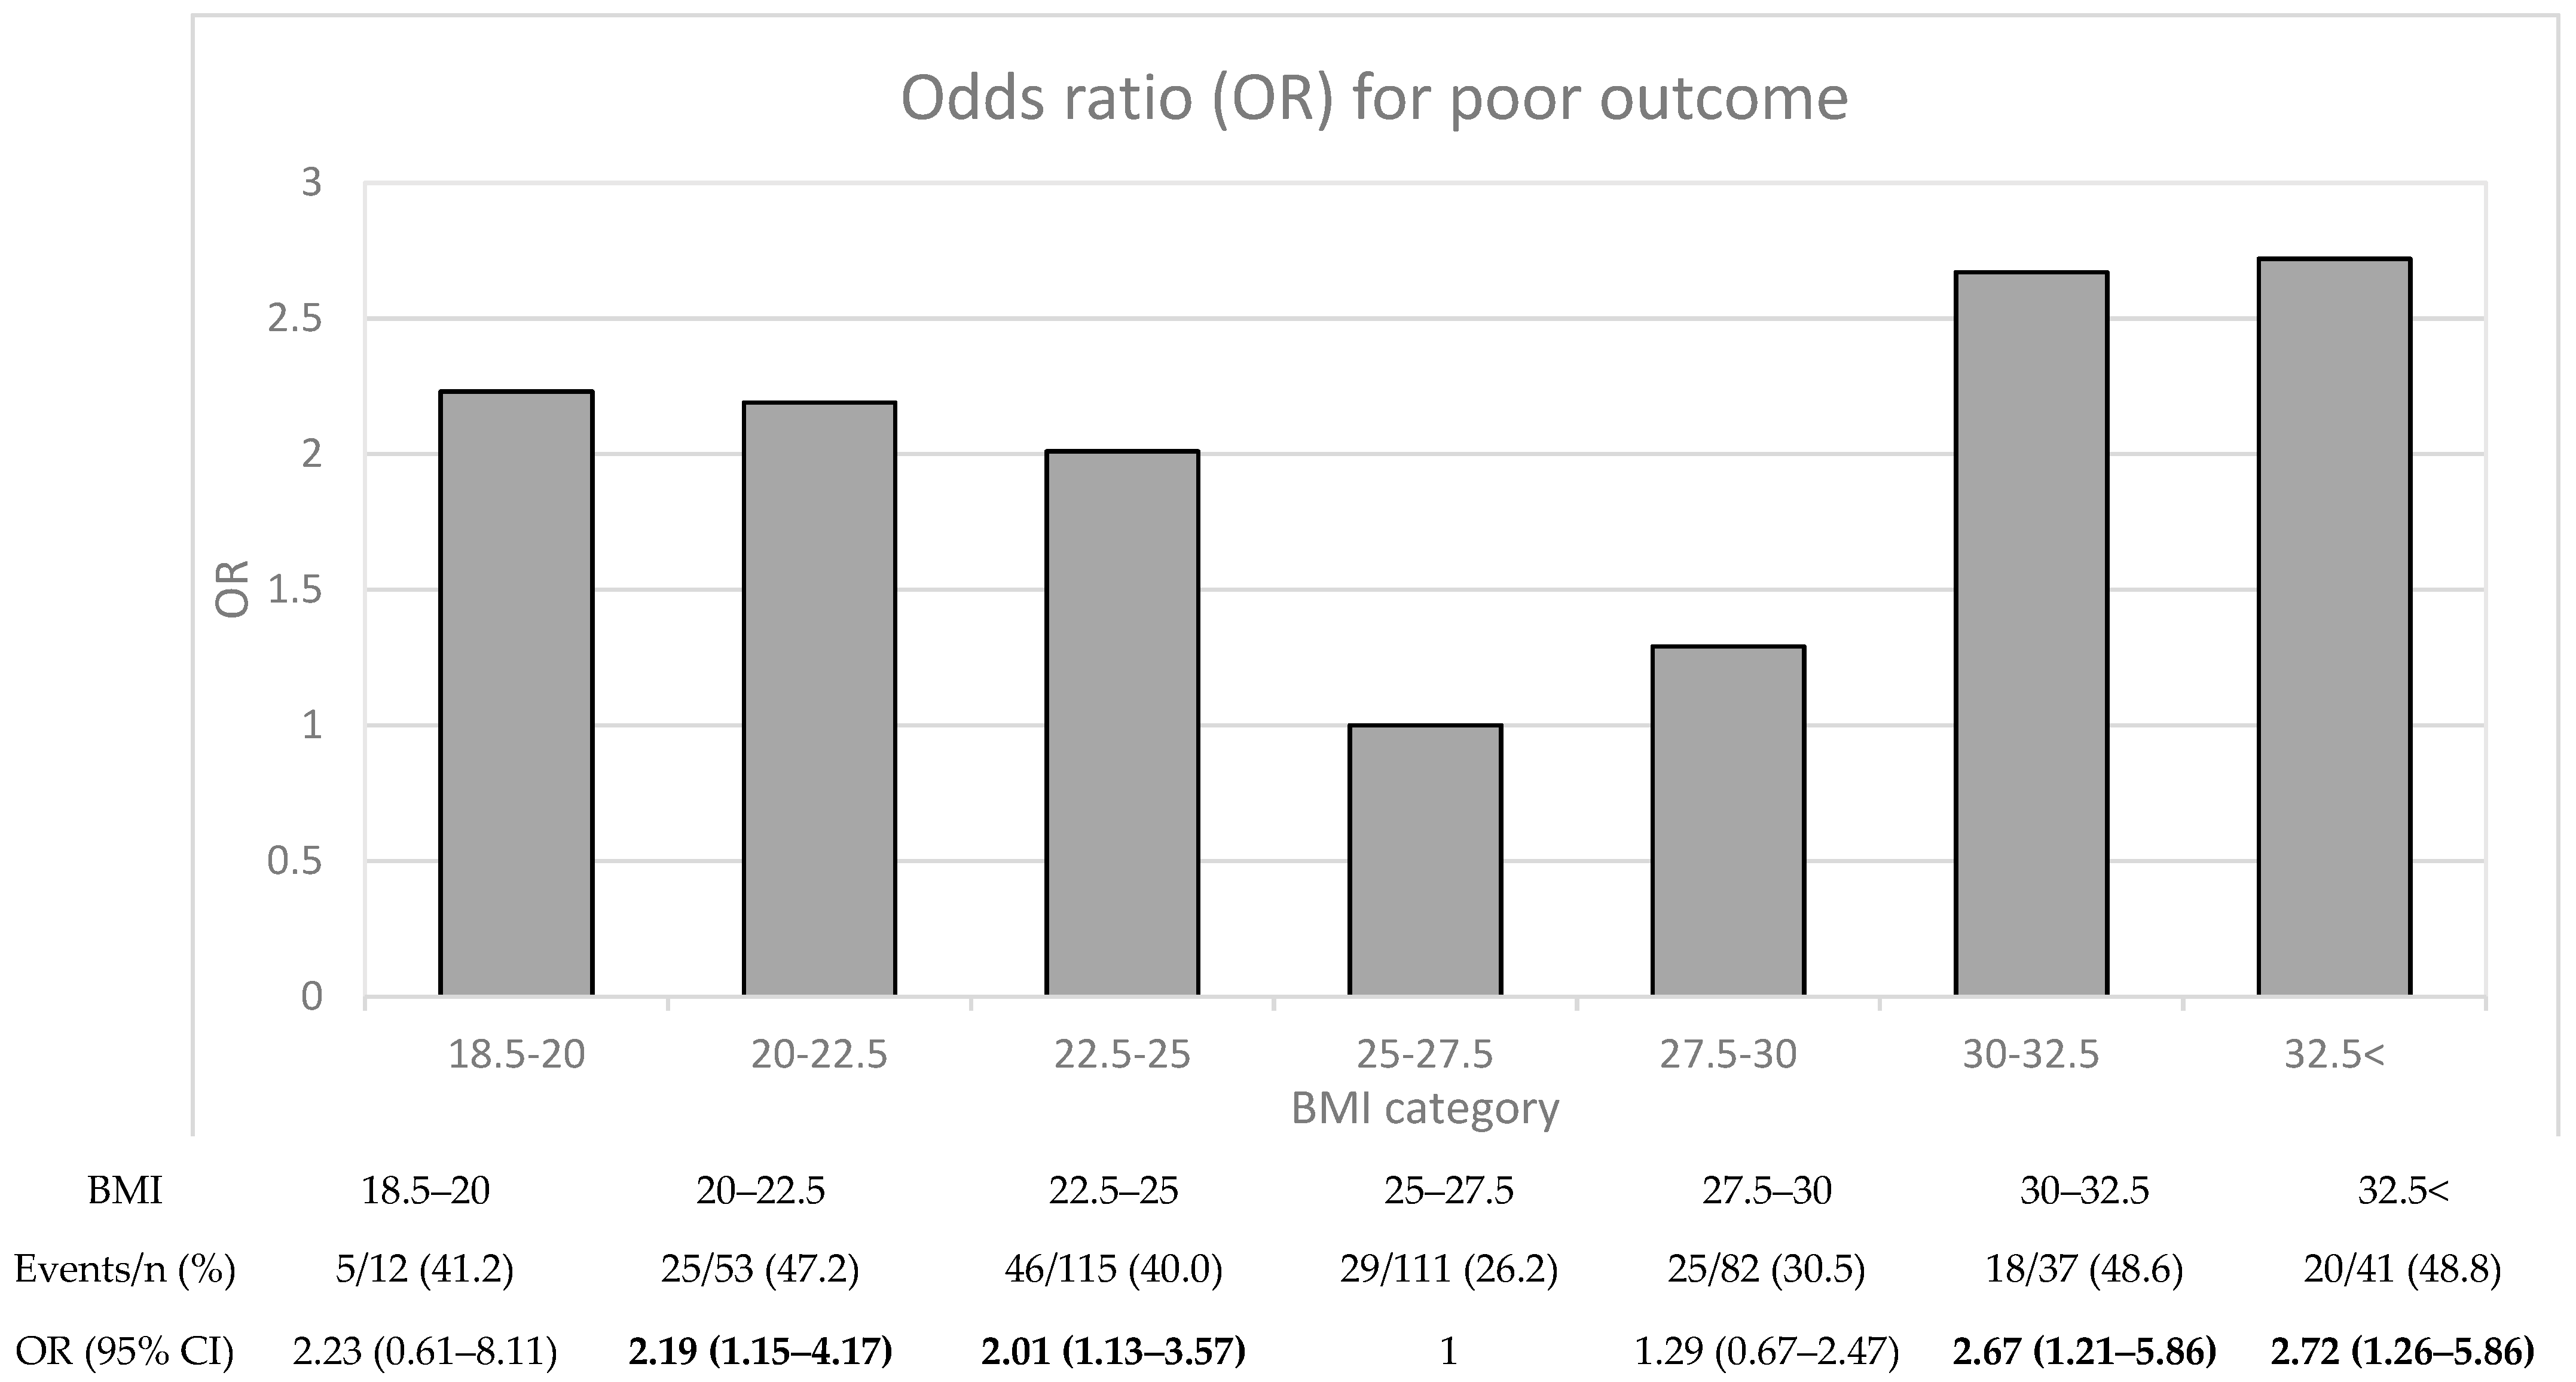
To investigate the association between BMI and poststroke functional outcome in more detail, we divided the patients into seven BMI subcategories (Figure 1), and performed binary regressions adjusted for sex and age (Model 1). Overall, the nonlinear relationship between BMI and 7-year functional outcome was retained. Specifically, with the BMI group of 25.0–27.5 as a reference, binary regression showed the lowest relative ORs for the risk of poor 7-year functional outcome in the overweight BMI subcategories (BMI 25–27.5 and 27.5–30). The ORs for the risk of poor 7-year functional outcome ranged from 2.01 to 2.72 for normal-weight (BMI 18.5–25) and obese (BMI > 30) BMI subcategories.
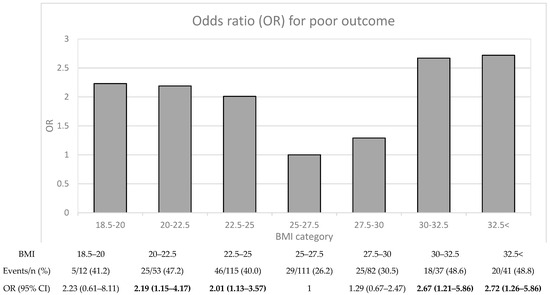
Figure 1.
Poor functional outcome after 7 years poststroke. Odds ratios (ORs) for poor functional outcome (mRS 3–6) with 95% CI were calculated using binary logistic regression. ORs are adjusted for age and sex (Model 1). ORs with statistically significant p-values (<0.05) are shown in bold. Abbreviations: BMI, body mass index; mRS, Modified Rankin Scale.
As functional outcomes were significantly different by BMI category only for the 7-year follow-up, we investigated the reverse, namely, whether the baseline parameters differed in patients with good or poor functional outcome after 7 years (Table 4). The patients with poor 7-year functional outcome were older and had a larger proportion of severe strokes, diabetes, previous strokes, and sedentary lifestyle compared to the patients with favorable outcome, and they also displayed higher levels of s-IGFBP-1, HOMA-IR, and hs-CRP. In contrast, there were no baseline differences in sex, BMI, hypertension, blood pressure, smoking, or LDL levels. The absence of a difference in baseline BMI levels comparing good and poor outcome may be surprising, but is expected given the shown nonlinear relationship in Figure 1.
Table 4.
Baseline characteristics of the patients with good and poor functional outcomes (mRS 3–6) after 7 years poststroke.
2.3. The Relation between BMI, HOMA-IR, and s-IGFBP-1 and Poststroke Functional Outcome
Having observed a nonlinear association between BMI and functional outcome (Figure 1), we performed the binary logistic regressions in different strata of BMI, as there may potentially exist different relations between BMI, HOMA-IR, and s-IGFBP-1 in the lower or higher ranges of BMI (Table 5a,b). Adjustments were made for sex and age (Model 1), cardiovascular risk factors (Model 2), and additionally for either BMI-category, s-IGFBP-1, HOMA-IR, diabetes, or hs-CRP.
Table 5.
(a) Odds ratios (ORs) for poor functional outcome (mRS 3–6) after 7 years poststroke in patients with BMI 18.5–30. (b) Odds ratios (ORs) for poor functional outcome (mRS 3–6) after 7 years poststroke in patients with BMI > 25.
In Table 5a, we show the associations with poor 7-year functional outcome in the subpopulation with BMI 18.5–30 (normal-weight and overweight) for three parameters: normal-weight (BMI 18.5–25) vs. overweight (BMI 25–30), increases in Log10-s-IGFBP-1, and increases in Log10-HOMA-IR. For these regressions, Model 2 adjustments (cardiovascular risk factors except diabetes) should be regarded as the “crude” model for comparison. As expected, there was a significantly higher risk of poor functional outcome after 7 years in normal-weight patients than in overweight patients (OR 2.32, 95% CI 1.30–4.14). Adjusting for s-IGFBP-1 moderately attenuated this association by 8.3% (OR 2.21, 95% CI 1.21–4.02). In comparison, neither hs-CRP (Model 2 + hs-CRP) nor HOMA-IR (Model 2 + HOMA-IR) attenuated the association. Moreover, in the middle and right panels of Table 5a, we present the associations between increases in Log10-s-IGFBP-1 or Log10-HOMA-IR and the risk of poor 7-year functional outcome among the patients with BMI 18.5–30 (normal-weight and overweight), with corresponding adjustments. Interestingly, increases in Log10-s-IGFBP-1 retained statistical significance in all models (Table 5a, middle panel), whereas the association with Log10-HOMA-IR was attenuated below the significance level by adjustment for hs-CRP or diabetes (Table 5a, right panel).
In Table 5b, we show the associations with poor 7-year functional outcome in the subpopulation with BMI > 25 (overweight and obese) for the following three parameters: overweight (BMI 25–30) vs. obese (BMI > 30), increases in log10-s-IGFBP-1, and increases in log10-HOMA-IR. Being obese (BMI > 30) was associated with an increased risk of poor 7-year functional outcome, but this association was attenuated below the significance level by adjustment for hs-CRP and HOMA-IR. HOMA-IR and hs-CRP showed attenuation percentages of 22.4%, and 10.4%, respectively. In contrast, adjustment for IGFBP-1 accentuated the association (Table 5b, left panel). Concerning increases of Log10-s-IGFBP-1 in the subpopulation with BMI > 25 (overweight and obese), the unadjusted OR was not significant (Table 5b, middle panel), which limits the interpretation of the following adjustments, although an accentuation was found in Model 2. In contrast, increases of Log10-s-HOMA-IR in the subpopulation with BMI > 25 had a significant unadjusted OR of 5.34. However, this OR was attenuated to just below significance level by Model 2 adjustment, but was accentuated by adjustment for s-IGFBP-1 and hs-CRP (Table 5b, right panel).
To investigate if deaths (mRS 6) or previous strokes at baseline were driving the associations for BMI and poor functional outcome (mRS 3–6), we performed a sensitivity analysis in the logistic regressions by adding death, previous strokes, and sedentary lifestyle as covariates (Supplementary Tables S1 and S2). First, deaths are shown specifically for the different time points and BMI categories, in analogy to Table 3. Supplementary Table S1 shows the overall percentage of deaths in each BMI category as well as deaths from ischemic stroke, hemorrhagic stroke, cardiovascular cause, and other causes. Essentially, the pattern with fewer deaths in the overweight group was preserved. Specifically, in patients with poor outcome (n = 168), after 7 years there were 47% deaths (mRS 6) and 53% with functional disability (mRS 3–5). In the sensitivity analysis using binary logistic regression by adding deaths as a covariate (Supplementary Table S2), death attenuated the increased risk of 7-year poor outcome in normal-weight patients by 82.6%, and thus explained a major part of the poor functional outcomes. However, for the obese, the attenuation by death was negligible (1.6%). Thus, the relations appear to be largely driven by 7-year poststroke deaths in the normal-weight group, but not in the obese group. A history of previous stroke did not attenuate the increased risk of poor outcome in any of the BMI groups. Sedentary lifestyle attenuated poor functional outcome in the obese, but not in the normal-weight group (Supplementary Table S2), similar to the pattern of HOMA-IR (Table 5).
2.4. Poor Functional Outcome in IGFBP-1, HOMA-IR, and BMI Categories
In Table 6 and Table 7, we analyzed the three BMI categories regarding poor functional outcome according to medians of s-IGFBP-1 (Table 6) and HOMA-IR (Table 7). The patients with complete data on these three parameters at 7 years poststroke were fewer (n = 330), but nevertheless had similar baseline parameters (Supplementary Table S3). The reference category in Table 6 was overweight (BMI 25–30) patients with s-IGFBP-1 below the median, and in Table 7, the reference category was overweight (BMI 25–30) patients with HOMA-IR below the median. Numbers and unadjusted ORs of patients with poor functional 7-year outcomes are given.
Table 6.
Odds ratios (ORs) for poor outcome (mRS 3–6) after 7 years poststroke, for high and low IGFBP-1 in BMI categories.
Table 7.
Odds ratios (ORs) for poor outcome (mRS 3–6) after 7 years poststroke, for high and low HOMA-IR in BMI categories.
In Table 6, these analyses showed that the risk of poor 7-year functional outcome was increased in the normal-weight (BMI 18.5–25) and obesity (BMI > 30) categories as compared to the overweight (BMI 25–30) category. Furthermore, the risk of poor functional outcome was more pronounced for patients with high IGFBP-1 in all three BMI categories (normal-weight: OR 4.41, 95% CI 2.00–9.73; overweight: OR 2.5, 95% CI 1.14–5.51; obesity: OR 4.67, 95% CI 1.79–12.1) compared with the reference group of overweight patients with low s-IGFBP-1.
A similar pattern was found for HOMA-IR (Table 7). Normal-weight (BMI 18.5–25) and obesity (BMI > 30) were both associated with an increased risk of poor functional 7-year outcome regardless of whether HOMA-IR was low or high as compared to the reference group (overweight (BMI 25–30) with low HOMA-IR). For normal-weight patients with high HOMA-IR, the OR for poor prognosis was more pronounced (OR 4.41, 95% CI 2.00–9.73). Obese patients with high HOMA-IR showed the worst prognosis (OR 6.15, 95% CI 2.36–16.1), which was a considerably higher OR than that of obese patients with low HOMA-IR (OR 2.63 95%, CI 0.98–7.05).
3. Discussion
3.1. Nonlinear Associations between BMI and Poor Functional Outcome—Relations with IGFBP-1 and Insulin Resistance
In line with earlier results [5,32], we found an obesity paradox in the sense that normal-weight (BMI 18.5–25) patients did not have the most favorable 7-year functional outcome, despite their overall better cardiovascular risk factor profile regarding hypertension, diabetes, BMI, LDL, and HOMA-IR levels (Table 1). Nevertheless, smoking was more abundant, and hs-CRP was nonsignificantly higher, both of which were adjusted for in Model 2. The lowest risk of poor functional outcome was in the overweight (BMI 25–30) patients, whereas normal-weight (BMI 18.5–25) and obese (BMI > 30) patients had significantly worse 7-year functional outcome. Our results therefore support an obesity paradox in terms of long-term functional outcome, resembling a U-shaped nonlinear relation, as also recently reported on 3-month poststroke functional outcomes [5]. The obesity paradox should perhaps even be called a normal-weight paradox, as we discuss further below. Furthermore, we investigated whether the association between normal-weight (BMI 18.5–25) and the obese (BMI > 30) and the risk of poor functional outcome was dependent on HOMA-IR and s-IGFBP-1. In line with our hypothesis, s-IGFBP-1 slightly attenuated (8.3%) the association for poor functional outcome in the normal-weight (BMI 18.5–25) compared to overweight (BMI 25–30), but not to the degree that it could be regarded as a robust mediator. In contrast, the factors that attenuated the association for poor prognosis in the obese (BMI > 30) compared to the overweight (BMI 25–30) were HOMA-IR (22.4%) and hs-CRP (10.4%). Furthermore, adjustments for HOMA-IR showed opposite attenuations as compared to those of s-IGFBP-1 for both normal-weight vs. overweight and obese vs. overweight. Thus, although BMI, s-IGFBP-1, and HOMA-IR are moderately intercorrelated, they only mediate each other’s effects on poststroke functional outcome to a small extent. The associations for poor functional outcome were largely driven by deaths in the normal-weight but not in the obese category.
3.2. Different Attenuation for Poor Functional Outcome in the Normal-Weight and the Obese
Considering the nonlinear relation between BMI and poststroke functional outcome, there could potentially be different confounding or mediating effects in the different ranges of BMI. The findings that high s-IGFBP-1 is associated with poor functional outcome (Table 4), and that high s-IGFBP-1 is found in patients with lower BMI (Table 1), could suggest that IGFBP-1 is mediating the poor functional outcome for the normal-weight. However, the attenuation by s-IGFBP1 was modest (8.3%) when introduced as a covariate. Nevertheless, s-IGFBP-1 was the only examined factor that attenuated the OR in the normal-weight vs. overweight BMI comparison. In contrast, another investigated factor, hs-CRP, which could have explained part of this relationship, did not exhibit any attenuation. The effects of adjustments for covariates were different in the overweight and obese subpopulations with BMI > 25 (Table 5b, left panel). Specifically, the relationship between poor functional outcome in the obese compared to the overweight was attenuated by HOMA-IR (22.4%) and hs-CRP (10.4%), which thus could partly explain the associations in the obese spectrum.
3.3. Impact and Additive Effects of IGFBP-1 and HOMA-IR in the Different BMI Categories
In Table 5a,b in the middle panels, we demonstrate that s-IGFBP-1 is indeed a determinant of poststroke functional outcome in the subpopulation with BMI 18.5–30 (normal-weight to overweight), with more robust ORs than that observed for HOMA-IR. However, in the subpopulation with BMI > 25 (overweight to obese), s-IGFBP-1 may be a weaker risk factor than HOMA-IR in the unadjusted and Model 1 associations. However, it is difficult to be certain that HOMA-IR is more important than s-IGFBP-1, as there are also some accentuations in the further adjustments.
Moreover, adding s-IGFBP-1 as a covariate did not attenuate the association between increases in HOMA-IR and poor poststroke functional outcome in BMI 18.5–30. Altogether, this could suggest that s-IGFBP-1 is not a mediator of the detrimental effects of high HOMA-IR, but to some degree, a mediator (or confounder) for better poststroke functional outcomes in overweight (BMI 25–30) patients.
Overall, Table 6 and Table 7 imply that patients with overweight (BMI 25–30) and low s-IGFBP-1 or low HOMA-IR demonstrated the largest proportion of good 7-year functional outcome. It is noteworthy that also in the overweight (BMI 25–30) patients with high s-IGFBP-1 (Table 6), and high HOMA-IR (Table 7), there are statistically significant higher risks for poor 7-year functional outcomes. Other studies have shown that normal-weight (BMI 18.5–25) patients with high HOMA-IR, the so-called Metabolically Unhealthy Normal Weight (MUHNW), have worse poststroke functional outcomes and increased mortality [33]. This is supported by data from Table 7, but there is also a significant risk increase for the normal-weight with low HOMA-IR compared to both categories of overweight patients. Finally, Table 6 and Table 7 shows that both high s-IGFBP-1 and HOMA-IR are rather independent risk factors in all the weight categories.
3.4. Effect of Follow-Up Time
Additionally, the association between BMI at index stroke and functional outcome was more marked when the observation times were longer. Although the association patterns were numerically in the same direction for the 2-year follow-up, there was a distinctly higher difference between the BMI categories in the risk of poor functional outcome with longer follow-up time (a significant difference was observed only at the 7-year follow-up). More pronounced associations with poststroke outcomes during longer follow-up have previously been observed for HOMA-IR [34] and s-IGFBP-1 [25], which could indicate that the factors are related. This could also indicate that these factors are less related to early recovery processes in the poststroke phase and more to long-term effects of metabolic factors, priming long-term recovery and deaths. The accentuation by long follow-up could also support that overweight BMI is a factor of resilience for deterioration of functional outcomes. However, our data only allowed analysis of poststroke cardiovascular risk factors that were known at index (cardiovascular adjustments in Model 2). Even so, the different Model 2 adjustments showed relatively small attenuations. Thus, it appears that the augmentation over time of the effects of BMI, HOMA-IR, and s-IGFBP-1 on functional outcome appear to be relatively independent, despite the moderate intercorrelation between these factors. It should also be acknowledged that the trajectories of BMI changes in the different baseline BMI categories would have aided interpretation. In fact, changes in BMI, e.g., weight reductions, would probably be a powerful predictor of a poor functional outcome as indicated by the results of previous studies [35,36]. In this aspect, weight loss is most often resulting from severe strokes with loss of appetite, decreased feeding ability, and muscle mass reduction. However, follow-up BMI was not collected in our study, which is a limitation.
Could the time-dependent association between BMI and poor functional outcome (mRS 3–6) be driven by the proportion of deaths (mRS 6)? Interestingly, in the sensitivity analysis, we observed that death in a high degree attenuated the increased risk of poor functional outcome for the normal-weight, but not for the obese. This indicates that death indeed is largely driving the associations between BMI and 7-year poor functional outcomes in the normal-weight but not in the obese.
3.5. Strengths and Limitations
Our study had a relatively large sample size regarding s-IGFBP1 measurements and poststroke functional outcome. In the multivariate regression models, there was a sufficient number of patients and events to adjust for relevant potential confounders, as argued by the algorithms supplied by Peduzzi and coworkers [37]. Moreover, we only included young and middle-aged predominantly white patients, as the maximum age for inclusion in SAHLSIS was 70 years. This could be important to consider when comparing our results with similar studies from other ethnic groups in Asia [38,39] or cohorts with older patients. Additionally, our study included diabetic patients, even though insulin treatment can interfere with HOMA-IR measurements [34]. However, this is mainly a problem when HOMA-IR is not analyzed under steady-state conditions [40], which it was in our study (morning fasting hours). Still, there is a limitation of the HOMA-IR values for diabetic patients as we lack records of medication, and because acute ischemic stroke, per definition, is a state of non-steady-state. However, since HOMA-IR was not the main focus of this study, we found it pertinent to include diabetic patients to provide a better picture of the role of BMI. Furthermore, the day of blood sampling was not standardized, and ranged from day 1 to 10 after index stroke (median 4 days). Therefore, some patients could theoretically be in a state of stress hyperglycemia. However, hs-CRP, which reflects the general stress response, did not statistically significantly affect the associations, except for in the obese subpopulation (Table 5). HbA1c would have been a suitable variable to include, but was not included in the original protocol of the study, which is a limitation. Furthermore, we do not have records of the participants’ amount of rehabilitation or changes in medications during the follow-up, which is also a limitation.
3.6. The Obesity Paradox and Other Possible Mechanisms
Although an obesity paradox has been reported for poststroke prognosis [6,8], the magnitude and relations to other factors have varied. One study found no obesity paradox in patients with HOMA-IR below the median, whereas normal-weight patients with high HOMA-IR had a worse prognosis after ischemic stroke [33]. We could not replicate these findings, as we found that normal-weight (BMI 18.5–25) patients, regardless of high or low HOMA-IR, had a worse prognosis than overweight (BMI 25–30) patients with high HOMA-IR. However, the mentioned study [33] had a follow-up time of only one year compared to the present study with 7 years of follow-up. Furthermore, the previous study had different BMI criteria according to the standards for Asian participants [39], which could explain some of the different results.
Some serum factors could be of importance for the obesity paradox that we did not analyze. One study found that normal-weight (BMI 18.5–25) participants with hypertension secrete more catecholamines and renin during exercise than obese (BMI > 30) participants [14]. If extrapolated to our long-term study, this could contribute to the unfavorable prognosis in normal-weight individuals. Additionally, TNF-α, an inflammatory cytokine involved in numerous pathological mechanisms, and soluble TNF-α receptors, might be important in explaining the obesity paradox [13,41]. Indeed, TNF-α is released in the brain during ischemic stroke and has been shown to mediate cell death [41]. Furthermore, TNF-α inhibition has been shown to promote neurological recovery in rodent models [42,43]. In vivo, experiments have shown that soluble TNF-α receptors in the circulation, released from adipose tissue, can bind TNF-α [13]. A larger adiposity could therefore neutralize the negative effects of local TNF-α synthesis after stroke. Accordingly, one theory explaining an obesity paradox in the poststroke recovery phase is that inflammatory TNF-α released during ischemic events like stroke may be bound mainly by circulating TNF-α receptors in individuals with more subcutaneous adipose tissue, leading to less inflammatory TNF-α in overweight and obese individuals [44].
4. Materials and Methods
4.1. Study Population
The present study included ischemic stroke cases from the hospital-based prospective observational, longitudinal cohort study SAHLSIS, described previously [45,46] and in the online supplement. Briefly, adult patients aged <70 years with first-ever or recurrent acute ischemic stroke were recruited consecutively at four Stroke Units in western Sweden during 1998–2003 (n = 600). There were 458 patients who had both measurements of BMI and either HOMA-IR or s-IGFBP-1 at index stroke. Out of these, n = 7 had a BMI below normal-weight (<18.5). Since adult underweight below 18.5 is uncommon and often is associated with cachexia [47], these individuals were excluded, rendering the 451 study participants (Supplementary Figure S1, flow chart, Supplementary Materials). BMI values were grouped according to the classification defined by the World Health Organization (WHO): adult normal-weight as a BMI 18.5–25 kg/m2, overweight as a BMI 25–30 kg/m2, and obesity as a BMI above 30 kg/m2, which is suitable for a western population [48]. BMI, hypertension, diabetes, sedentary lifestyle, and smoking were defined as described previously [45,46,49], and are also presented in the Supplementary Materials. Functional independence was evaluated by mRS at poststroke follow-up at 7 years. Of these, there were also n = 432 with mRS at 3 months and n = 449 with mRS at 2 years poststroke. For the 7-year follow-up, there were n = 330 with complete data for both s-IGFBP1 and HOMA-IR. Written informed consent was obtained from all study participants or next of kin. SAHLSIS and the follow-up studies were approved by the Regional Ethics Review Board in Gothenburg, Sweden (#Ö469-99 and #413-04, #T665-07, T586-13).
4.2. Stroke Severity and Functional Outcome
In SAHLSIS, the maximum stroke severity within the first 7 days of admission to the hospital was assessed by the Scandinavian Stroke Scale (SSS), and converted to the more frequently used NIHSS using the established algorithm NIHSS = 25.68 − 0.43 × SSS [50]. Of note, recruitment to SAHLSIS took place before recanalization therapy was part of clinical routine treatment. Functional outcome at 3 months, 2 years, and 7 years after index stroke was assessed using the mRS scale. Over the years, these were performed by one neurology specialist physician at baseline and at the 3-month follow-up. At the 2-year and 7-year follow-ups, a research nurse, trained in stroke medicine by the research specialist physician, assessed functional outcome. Stroke severity was assessed at the inpatient clinic, while all other functional assessments including mRS were performed outpatient on follow-up occasions outside the hospital ward.
4.3. Blood Sampling and Protein Measurement
Venous blood samples were collected in the acute phase, within a range of 1–10 days (median 4 days) after the index stroke. Blood sampling was performed in the morning hours, after an overnight fast of >8 h, where serum was isolated within 2 h by centrifugation at 2000× g at 4 °C for 20 min, aliquoted, and stored at −80 ◦C pending analyses. S-IGFBP-1 was analyzed by an enzyme-linked immunosorbent assay (ELISA) using a commercial kit from Mediagnost, Reutlingen, Germany. The inter-assay coefficient of variation was 14.6%, and the intra-assay coefficient of variation was 4.5%, as reported [25]. Due to the relatively high inter-assay variation for s-IGFBP-1, an inter-assay correction factor was used by placing three original serum samples in each 96-well plate. All blood and plasma concentrations of insulin and glucose were analyzed using standardized methods at the Department of Clinical Chemistry at the Sahlgrenska University Hospital. Calculation of HOMA-IR was done with an algorithm: fasting insulin (microU/L) × fasting glucose (nmol/L)/22.5 [16]. High-sensitivity CRP (hs-CRP) was analyzed by a solid-phase chemiluminescent immunometric assay on Immulite 2000 (Diagnostic Products Corp, Los Angeles, CA, USA) with reagents as directed by the manufacturer.
4.4. Statistical Analysis
The statistical analyses were performed using the IBM® SPSS® ver. 25 software (SPSS Inc., Armonk, NY, USA). Continuous data are presented as mean values and 95% confidence intervals (CIs). The Shapiro–Wilk test was performed to test normality, with no variables showing normal distribution. Due to skewed distribution, the exposure variables s-IGFBP-1, hs-CRP, and HOMA-IR were log-transformed in the statistical analyses.
For descriptive purposes, Mann–Whitney U-tests were performed to examine between-group differences in continuous variables, and Chi square tests to examine differences in categorical values. Correlation analysis was performed according to Spearman, and correlation strengths (rho values; r) were reported according to Cohen [51]. Thus, we report the magnitude of r as very small for r < 0.1, small for r < 0.1 to 0.3, moderate for r < 0.3 to 0.5, and large for r > 0.5. Multivariable binary logistic regression was used to determine odds ratios (ORs) for the associations with poor functional outcome.
Adjustments were made for sex, age (Model 1), and additionally for conventional vascular risk factors (hypertension, smoking, and LDL), and acute stroke severity (Model 2). In the adjustments of the regression analysis, attenuation percentages were calculated as ([Unadjusted OR-1] − [Adjusted OR-1])/(Unadjusted OR-1). For further details on attenuation percentage, see the Supplementary Materials. The appropriate number of covariates was based on the included participants and the fraction of outcomes as reported by Peduzzi and coworkers [37]. For LDL, which had the most missing values (N = 63 or 14.0%, Table 1), imputation was used to replace the missing values with the mean LDL value [49]. Statistical significance was defined as a two-tailed p < 0.05.
5. Conclusions
We conclude that serum IGFBP-1 is an important prognostic factor for long-term poststroke functional outcome, and might play a minor part in what is commonly referred to as the “obesity paradox”. However, considering our results from the binary logistic regression analyses, it may at most partially explain why normal-weight (BMI 18.5–25) patients have an increased risk of poor outcome compared to overweight (BMI 25–30) patients. In contrast, in the poor outcome of obese (BMI > 30) patients, there was a somewhat higher degree of attenuation by HOMA-IR and hs-CRP.
Furthermore, our results support the notion that the phenomenon called “the obesity paradox” could instead be regarded as “the normal-weight paradox” [4], as indicated by our findings of a nonlinear association with the best poststroke functional outcome in the overweight (BMI 25–30) group, and not in the normal-weight (BMI 18.5–25) group as expected. For further studies, the relationships between BMI, TNF-α, soluble TNF-α receptors, catecholamines, renin, and IGFBP-1 need more in-depth exploration. A further understanding of the exact mechanisms underlying the obesity paradox might also suggest new and tailored pharmacological therapies for stroke recovery.
Supplementary Materials
The following supporting information can be downloaded at: https://www.mdpi.com/article/10.3390/ijms25094931/s1. References [52,53,54,55,56] are cited in the supplementary materials.
Author Contributions
Conceptualization, G.G., N.D.Å., D.Å., A.W. and J.S.; methodology, G.G. and N.D.Å.; software, G.G.; validation, H.Z. and N.D.Å.; formal analysis, G.G., N.D.Å. and J.S.; investigation, G.G.; resources, K.J., C.J., H.Z., K.B. and J.I.; data curation, K.J. and C.J.; writing—original draft preparation, G.G., D.Å. and N.D.Å.; writing—review and editing, G.G., D.Å., A.W., H.Z., K.B., K.J., C.J., J.I., J.S. and N.D.Å.; visualization, G.G.; supervision, N.D.Å.; project administration, K.J., C.J., J.S. and N.D.Å.; funding acquisition, N.D.Å. and J.S. All authors have read and agreed to the published version of the manuscript.
Funding
This study was supported by the Swedish state under the agreement between the Swedish government and the county councils, the ALF agreement (ALFGBG-965328, ALFGBG-965744, ALFGBG 719761), the Swedish Medical Society (Svenska Läkaresällskapet), the Swedish Research Council (2021-01114), the Swedish Heart Lung Foundation (20220184), the Swedish Stroke Association, the Göteborg Foundation for Neurological Research, the Rune and Ulla Amlöv, Edit Jacobson, Magnus Bergvall, Emelle, Lars Hierta, and John and Brit Wennerström foundations. H.Z. is a Wallenberg Scholar and a Distinguished Professor at the Swedish Research Council supported by grants from the Swedish Research Council (#2023-00356; #2022-01018 and #2019-02397), the European Union’s Horizon Europe research and innovation programme under grant agreement No 101053962, Swedish State Support for Clinical Research (#ALFGBG-71320), the Alzheimer Drug Discovery Foundation (ADDF), USA (#201809-2016862), the AD Strategic Fund and the Alzheimer’s Association (#ADSF-21-831376-C, #ADSF-21-831381-C, #ADSF-21-831377-C, and #ADSF-24-1284328-C), the Bluefield Project, Cure Alzheimer’s Fund, the Olav Thon Foundation, the Erling-Persson Family Foundation, Stiftelsen för Gamla Tjänarinnor, Hjärnfonden, Sweden (#FO2022-0270), the European Union’s Horizon 2020 research and innovation programme under the Marie Skłodowska-Curie grant agreement No 860197 (MIRIADE), the European Union Joint Programme—Neurodegenerative Disease Research (JPND2021-00694), the National Institute for Health and Care Research University College London Hospitals Biomedical Research Centre, and the UK Dementia Research Institute at UCL (UKDRI-1003).
Institutional Review Board Statement
This study was conducted in accordance with the 1964 Helsinki Declaration and its later amendments or comparable ethical standards. This study was approved by the Ethics Committee of the University of Gothenburg (Ö469-99 and T553-03). The Ethics Committee of the University of Gothenburg is responsible for ethical applications from the entire region of western Sweden, covering all four hospitals in the study.
Informed Consent Statement
Informed consent was obtained from all subjects or the next of kin involved in this study.
Data Availability Statement
The data presented in this study are available on reasonable request from the corresponding author. The data are not publicly available due to legal restrictions regarding privacy and ethical issues.
Acknowledgments
The authors thank research nurse Ingrid Eriksson for her excellent work and assistance in recruiting the study participants and for conducting the follow-up study. The authors also thank statistician Kirsten Mehlig, University of Gothenburg, Sweden, for consultation regarding regressions and attenuation degrees. Furthermore, we are grateful to our study participants, without whom this work would not have been possible.
Conflicts of Interest
H.Z. has served at scientific advisory boards and/or as a consultant for Abbvie, Acumen, Alector, Alzinova, ALZPath, Amylyx, Annexon, Apellis, Artery Therapeutics, AZTherapies, Cognito Therapeutics, CogRx, Denali, Eisai, Merry Life, Nervgen, Novo Nordisk, Optoceutics, Passage Bio, Pinteon Therapeutics, Prothena, Red Abbey Labs, reMYND, Roche, Samumed, Siemens Healthineers, Triplet Therapeutics, and Wave, has given lectures in symposia sponsored by Alzecure, Biogen, Cellectricon, Fujirebio, Lilly, Novo Nordisk, and Roche, and is a co-founder of Brain Biomarker Solutions in Gothenburg AB (BBS), which is a part of the GU Ventures Incubator Program (outside submitted work).
References
- GBD 2019 Stroke Collaborators. Global, regional, and national burden of stroke and its risk factors, 1990–2019: A systematic analysis for the Global Burden of Disease Study 2019. Lancet Neurol. 2021, 20, 795–820. [Google Scholar] [CrossRef] [PubMed]
- Cassidy, J.M.; Cramer, S.C. Spontaneous and Therapeutic-Induced Mechanisms of Functional Recovery After Stroke. Transl. Stroke Res. 2017, 8, 33–46. [Google Scholar] [CrossRef] [PubMed]
- Strazzullo, P.; D’Elia, L.; Cairella, G.; Garbagnati, F.; Cappuccio, F.P.; Scalfi, L. Excess body weight and incidence of stroke: Meta-analysis of prospective studies with 2 million participants. Stroke 2010, 41, e418–e426. [Google Scholar] [CrossRef] [PubMed]
- Flegal, K.M.; Ioannidis, J.P.A. The Obesity Paradox: A Misleading Term That Should Be Abandoned. Obesity 2018, 26, 629–630. [Google Scholar] [CrossRef] [PubMed]
- Wakisaka, K.; Matsuo, R.; Matsumoto, K.; Nohara, Y.; Irie, F.; Wakisaka, Y.; Ago, T.; Nakashima, N.; Kamouchi, M.; Kitazono, T. Non-linear association between body weight and functional outcome after acute ischemic stroke. Sci. Rep. 2023, 13, 8697. [Google Scholar] [CrossRef]
- Forlivesi, S.; Cappellari, M.; Bonetti, B. Obesity paradox and stroke: A narrative review. Eat. Weight. Disord. 2021, 26, 417–423. [Google Scholar] [CrossRef] [PubMed]
- Olsen, T.S.; Dehlendorff, C.; Petersen, H.G.; Andersen, K.K. Body mass index and poststroke mortality. Neuroepidemiology 2008, 30, 93–100. [Google Scholar] [CrossRef] [PubMed]
- Aparicio, H.J.; Himali, J.J.; Beiser, A.S.; Davis-Plourde, K.L.; Vasan, R.S.; Kase, C.S.; Wolf, P.A.; Seshadri, S. Overweight, Obesity, and Survival After Stroke in the Framingham Heart Study. J. Am. Heart Assoc. 2017, 6, e004721. [Google Scholar] [CrossRef] [PubMed]
- Bergman, R.N.; Stefanovski, D.; Buchanan, T.A.; Sumner, A.E.; Reynolds, J.C.; Sebring, N.G.; Xiang, A.H.; Watanabe, R.M. A better index of body adiposity. Obesity 2011, 19, 1083–1089. [Google Scholar] [CrossRef]
- Takhttavous, A.; Saberi-Karimian, M.; Hafezi, S.G.; Esmaily, H.; Hosseini, M.; Ferns, G.A.; Amirfakhrian, E.; Ghamsary, M.; Ghayour-Mobarhan, M.; Alinezhad-Namaghi, M. Predicting the 10-year incidence of dyslipidemia based on novel anthropometric indices, using data mining. Lipids Health Dis. 2024, 23, 33. [Google Scholar] [CrossRef]
- Chang, V.W.; Langa, K.M.; Weir, D.; Iwashyna, T.J. The obesity paradox and incident cardiovascular disease: A population-based study. PLoS ONE 2017, 12, e0188636. [Google Scholar] [CrossRef] [PubMed]
- Scherbakov, N.; Dirnagl, U.; Doehner, W. Body weight after stroke: Lessons from the obesity paradox. Stroke 2011, 42, 3646–3650. [Google Scholar] [CrossRef] [PubMed]
- Mohamed-Ali, V.; Goodrick, S.; Bulmer, K.; Holly, J.M.; Yudkin, J.S.; Coppack, S.W. Production of soluble tumor necrosis factor receptors by human subcutaneous adipose tissue in vivo. Am. J. Physiol. 1999, 277, E971–E975. [Google Scholar] [CrossRef] [PubMed]
- Weber, M.A.; Neutel, J.M.; Smith, D.H. Contrasting clinical properties and exercise responses in obese and lean hypertensive patients. J. Am. Coll. Cardiol. 2001, 37, 169–174. [Google Scholar] [CrossRef] [PubMed]
- Chang, Y.; Kim, C.K.; Kim, M.K.; Seo, W.K.; Oh, K. Insulin resistance is associated with poor functional outcome after acute ischemic stroke in non-diabetic patients. Sci. Rep. 2021, 11, 1229. [Google Scholar] [CrossRef] [PubMed]
- Matthews, D.R.; Hosker, J.P.; Rudenski, A.S.; Naylor, B.A.; Treacher, D.F.; Turner, R.C. Homeostasis Model Assessment—Insulin Resistance and Beta-Cell Function from Fasting Plasma-Glucose and Insulin Concentrations in Man. Diabetologia 1985, 28, 412–419. [Google Scholar] [CrossRef] [PubMed]
- Hanley, A.J.; Williams, K.; Stern, M.P.; Haffner, S.M. Homeostasis model assessment of insulin resistance in relation to the incidence of cardiovascular disease: The San Antonio Heart Study. Diabetes Care 2002, 25, 1177–1184. [Google Scholar] [CrossRef] [PubMed]
- Li, S.; Yin, C.; Zhao, W.; Zhu, H.; Xu, D.; Xu, Q.; Jiao, Y.; Wang, X.; Qiao, H. Homeostasis model assessment of insulin resistance in relation to the poor functional outcomes in nondiabetic patients with ischemic stroke. Biosci. Rep. 2018, 38, BSR20180330. [Google Scholar] [CrossRef]
- Banait, T.; Wanjari, A.; Danade, V.; Banait, S.; Jain, J. Role of High-Sensitivity C-reactive Protein (Hs-CRP) in Non-communicable Diseases: A Review. Cureus 2022, 14, e30225. [Google Scholar] [CrossRef] [PubMed]
- Singh, P.; Hoffmann, M.; Wolk, R.; Shamsuzzaman, A.S.; Somers, V.K. Leptin induces C-reactive protein expression in vascular endothelial cells. Arterioscler. Thromb. Vasc. Biol. 2007, 27, e302–e307. [Google Scholar] [CrossRef] [PubMed]
- Andersson, J.; Johansson, L.; Ladenvall, P.; Wiklund, P.G.; Stegmayr, B.; Jern, C.; Boman, K. C-reactive protein is a determinant of first-ever stroke: Prospective nested case-referent study. Cerebrovasc. Dis. 2009, 27, 544–551. [Google Scholar] [CrossRef] [PubMed]
- Wang, A.; Liu, J.; Li, C.; Gao, J.; Li, X.; Chen, S.; Wu, S.; Ding, H.; Fan, H.; Hou, S. Cumulative Exposure to High-Sensitivity C-Reactive Protein Predicts the Risk of Cardiovascular Disease. J. Am. Heart Assoc. 2017, 6, e005610. [Google Scholar] [CrossRef] [PubMed]
- Coveney, S.; Murphy, S.; Belton, O.; Cassidy, T.; Crowe, M.; Dolan, E.; de Gaetano, M.; Harbison, J.; Horgan, G.; Marnane, M.; et al. Inflammatory cytokines, high-sensitivity C-reactive protein, and risk of one-year vascular events, death, and poor functional outcome after stroke and transient ischemic attack. Int. J. Stroke 2022, 17, 163–171. [Google Scholar] [CrossRef] [PubMed]
- Aberg, N.D.; Brywe, K.G.; Isgaard, J. Aspects of growth hormone and insulin-like growth factor-I related to neuroprotection, regeneration, and functional plasticity in the adult brain. Sci. World J. 2006, 6, 53–80. [Google Scholar] [CrossRef]
- Aberg, D.; Gadd, G.; Jood, K.; Redfors, P.; Stanne, T.M.; Isgaard, J.; Blennow, K.; Zetterberg, H.; Jern, C.; Aberg, N.D.; et al. Serum IGFBP-1 Concentration as a Predictor of Outcome after Ischemic Stroke-A Prospective Observational Study. Int. J. Mol. Sci. 2023, 24, 9120. [Google Scholar] [CrossRef] [PubMed]
- Heald, A.H.; Cruickshank, J.K.; Riste, L.K.; Cade, J.E.; Anderson, S.; Greenhalgh, A.; Sampayo, J.; Taylor, W.; Fraser, W.; White, A.; et al. Close relation of fasting insulin-like growth factor binding protein-1 (IGFBP-1) with glucose tolerance and cardiovascular risk in two populations. Diabetologia 2001, 44, 333–339. [Google Scholar] [CrossRef] [PubMed]
- Rajpathak, S.N.; McGinn, A.P.; Strickler, H.D.; Rohan, T.E.; Pollak, M.; Cappola, A.R.; Kuller, L.; Xue, X.; Newman, A.B.; Strotmeyer, E.S.; et al. Insulin-like growth factor-(IGF)-axis, inflammation, and glucose intolerance among older adults. Growth Horm. IGF Res. 2008, 18, 166–173. [Google Scholar] [CrossRef] [PubMed]
- Janssen, J.A.; Stolk, R.P.; Pols, H.A.; Grobbee, D.E.; Lamberts, S.W. Serum total IGF-I, free IGF-I, and IGFB-1 levels in an elderly population: Relation to cardiovascular risk factors and disease. Arterioscler. Thromb. Vasc. Biol. 1998, 18, 277–282. [Google Scholar] [CrossRef] [PubMed]
- Yeap, B.B.; Chubb, S.A.; McCaul, K.A.; Ho, K.K.; Hankey, G.J.; Norman, P.E.; Flicker, L. Associations of IGF1 and IGFBPs 1 and 3 with all-cause and cardiovascular mortality in older men: The Health In Men Study. Eur. J. Endocrinol. 2011, 164, 715–723. [Google Scholar] [CrossRef]
- Ritsinger, V.; Brismar, K.; Mellbin, L.; Nasman, P.; Ryden, L.; Soderberg, S.; Norhammar, A. Elevated levels of insulin-like growth factor-binding protein 1 predict outcome after acute myocardial infarction: A long-term follow-up of the glucose tolerance in patients with acute myocardial infarction (GAMI) cohort. Diab Vasc. Dis. Res. 2018, 15, 387–395. [Google Scholar] [CrossRef] [PubMed]
- Kaplan, R.C.; McGinn, A.P.; Pollak, M.N.; Kuller, L.; Strickler, H.D.; Rohan, T.E.; Xue, X.; Kritchevsky, S.B.; Newman, A.B.; Psaty, B.M. Total insulinlike growth factor 1 and insulinlike growth factor binding protein levels, functional status, and mortality in older adults. J. Am. Geriatr. Soc. 2008, 56, 652–660. [Google Scholar] [CrossRef] [PubMed]
- Flegal, K.M.; Kit, B.K.; Orpana, H.; Graubard, B.I. Association of all-cause mortality with overweight and obesity using standard body mass index categories: A systematic review and meta-analysis. JAMA 2013, 309, 71–82. [Google Scholar] [CrossRef] [PubMed]
- Xu, J.; Wang, A.; Meng, X.; Jing, J.; Wang, Y.; Wang, Y.; Investigators for ACROSS-China. Obesity-Stroke Paradox Exists in Insulin-Resistant Patients But Not Insulin Sensitive Patients. Stroke 2019, 50, 1423–1429. [Google Scholar] [CrossRef]
- Aberg, D.; Aberg, N.D.; Jood, K.; Holmegaard, L.; Redfors, P.; Blomstrand, C.; Isgaard, J.; Jern, C.; Svensson, J. Homeostasis model assessment of insulin resistance and outcome of ischemic stroke in non-diabetic patients—A prospective observational study. BMC Neurol. 2019, 19, 177. [Google Scholar] [CrossRef] [PubMed]
- Bell, C.L.; Rantanen, T.; Chen, R.; Davis, J.; Petrovitch, H.; Ross, G.W.; Masaki, K. Prestroke weight loss is associated with poststroke mortality among men in the Honolulu-Asia Aging Study. Arch. Phys. Med. Rehabil. 2014, 95, 472–479. [Google Scholar] [CrossRef] [PubMed]
- Yoo, S.H.; Kim, J.S.; Kwon, S.U.; Yun, S.C.; Koh, J.Y.; Kang, D.W. Undernutrition as a predictor of poor clinical outcomes in acute ischemic stroke patients. Arch. Neurol. 2008, 65, 39–43. [Google Scholar] [CrossRef]
- Peduzzi, P.; Concato, J.; Kemper, E.; Holford, T.R.; Feinstein, A.R. A simulation study of the number of events per variable in logistic regression analysis. J. Clin. Epidemiol. 1996, 49, 1373–1379. [Google Scholar] [CrossRef]
- Kodama, K.; Tojjar, D.; Yamada, S.; Toda, K.; Patel, C.J.; Butte, A.J. Ethnic differences in the relationship between insulin sensitivity and insulin response: A systematic review and meta-analysis. Diabetes Care 2013, 36, 1789–1796. [Google Scholar] [CrossRef] [PubMed]
- Consultation, W.H.O.E. Appropriate body-mass index for Asian populations and its implications for policy and intervention strategies. Lancet 2004, 363, 157–163. [Google Scholar] [CrossRef] [PubMed]
- Wallace, T.M.; Levy, J.C.; Matthews, D.R. Use and abuse of HOMA modeling. Diabetes Care 2004, 27, 1487–1495. [Google Scholar] [CrossRef] [PubMed]
- Chen, A.Q.; Fang, Z.; Chen, X.L.; Yang, S.; Zhou, Y.F.; Mao, L.; Xia, Y.P.; Jin, H.J.; Li, Y.N.; You, M.F.; et al. Microglia-derived TNF-alpha mediates endothelial necroptosis aggravating blood brain-barrier disruption after ischemic stroke. Cell Death Dis. 2019, 10, 487. [Google Scholar] [CrossRef]
- Lin, S.Y.; Wang, Y.Y.; Chang, C.Y.; Wu, C.C.; Chen, W.Y.; Liao, S.L.; Chen, C.J. TNF-alpha Receptor Inhibitor Alleviates Metabolic and Inflammatory Changes in a Rat Model of Ischemic Stroke. Antioxidants 2021, 10, 851. [Google Scholar] [CrossRef] [PubMed]
- Bonetti, N.R.; Diaz-Canestro, C.; Liberale, L.; Crucet, M.; Akhmedov, A.; Merlini, M.; Reiner, M.F.; Gobbato, S.; Stivala, S.; Kollias, G.; et al. Tumour Necrosis Factor-alpha Inhibition Improves Stroke Outcome in a Mouse Model of Rheumatoid Arthritis. Sci. Rep. 2019, 9, 2173. [Google Scholar] [CrossRef] [PubMed]
- Cheung, Y.M.; Joham, A.; Marks, S.; Teede, H. The obesity paradox: An endocrine perspective. Intern. Med. J. 2017, 47, 727–733. [Google Scholar] [CrossRef] [PubMed]
- Jood, K.; Ladenvall, C.; Rosengren, A.; Blomstrand, C.; Jern, C. Family history in ischemic stroke before 70 years of age: The Sahlgrenska Academy Study on Ischemic Stroke. Stroke 2005, 36, 1383–1387. [Google Scholar] [CrossRef] [PubMed]
- Aberg, D.; Jood, K.; Blomstrand, C.; Jern, C.; Nilsson, M.; Isgaard, J.; Aberg, N.D. Serum IGF-I levels correlate to improvement of functional outcome after ischemic stroke. J. Clin. Endocrinol. Metab. 2011, 96, E1055–E1064. [Google Scholar] [CrossRef] [PubMed]
- Perna, S.; Peroni, G.; Faliva, M.A.; Bartolo, A.; Naso, M.; Miccono, A.; Rondanelli, M. Sarcopenia and sarcopenic obesity in comparison: Prevalence, metabolic profile, and key differences. A cross-sectional study in Italian hospitalized elderly. Aging Clin. Exp. Res. 2017, 29, 1249–1258. [Google Scholar] [CrossRef] [PubMed]
- World Health Organization. Physical status: The use and interpretation of anthropometry. Report of a WHO Expert Committee. World Health Organ. Tech. Rep. Ser. 1995, 854, 1–452. [Google Scholar]
- Aberg, N.D.; Gadd, G.; Aberg, D.; Hallgren, P.; Blomstrand, C.; Jood, K.; Nilsson, M.; Walker, F.R.; Svensson, J.; Jern, C.; et al. Relationship between Levels of Pre-Stroke Physical Activity and Post-Stroke Serum Insulin-Like Growth Factor I. Biomedicines 2020, 8, 52. [Google Scholar] [CrossRef] [PubMed]
- Gray, L.J.; Ali, M.; Lyden, P.D.; Bath, P.M.; Virtual International Stroke Trials Archive, C. Interconversion of the National Institutes of Health Stroke Scale and Scandinavian Stroke Scale in acute stroke. J. Stroke Cerebrovasc. Dis. 2009, 18, 466–468. [Google Scholar] [CrossRef] [PubMed]
- Cohen, J. Statistical Power Analysis for the Behavioral Sciences, 2nd ed.; Routledge: London, UK, 1988. [Google Scholar] [CrossRef]
- Olsson, S.; Jood, K.; Blomstrand, C.; Jern, C. Genetic variation on chromosome 9p21 shows association with the ischaemic stroke subtype large-vessel disease in a Swedish sample aged≤ 70. Eur. J. Neurol. 2011, 18, 365–367. [Google Scholar] [CrossRef] [PubMed]
- Jood, K.; Ladenvall, P.; Tjarnlund-Wolf, A.; Ladenvall, C.; Andersson, M.; Nilsson, S.; Jern, C.; Blomstrand, C. Fibrinolytic gene polymorphism and ischemic stroke. Stroke 2005, 36, 2077–2081. [Google Scholar] [CrossRef] [PubMed]
- Aberg, N.D.; Aberg, D.; Jood, K.; Nilsson, M.; Blomstrand, C.; Kuhn, H.G.; Isgaard, J.; Jern, C.; Svensson, J. Altered levels of circulating insulin-like growth factor I (IGF-I) following ischemic stroke are associated with outcome—A prospective observational study. BMC Neurol. 2018, 18, 106. [Google Scholar] [CrossRef] [PubMed]
- Rankin, J. Cerebral vascular accidents in patients over the age of 60. II. Prognosis. Scott. Med. J. 1957, 2, 200–215. [Google Scholar] [CrossRef] [PubMed]
- Banks, J.L.; Marotta, C.A. Outcomes validity and reliability of the modified Rankin scale: Implications for stroke clinical trials: A literature review and synthesis. Stroke 2007, 38, 1091–1096. [Google Scholar] [CrossRef] [PubMed]
Disclaimer/Publisher’s Note: The statements, opinions and data contained in all publications are solely those of the individual author(s) and contributor(s) and not of MDPI and/or the editor(s). MDPI and/or the editor(s) disclaim responsibility for any injury to people or property resulting from any ideas, methods, instructions or products referred to in the content. |
© 2024 by the authors. Licensee MDPI, Basel, Switzerland. This article is an open access article distributed under the terms and conditions of the Creative Commons Attribution (CC BY) license (https://creativecommons.org/licenses/by/4.0/).