Abstract
Fusarium pseudograminearum (Fp) and soil salinity are two types of stress that interact in complex ways, potentially leading to more severe consequences on wheat growth and productivity. However, little is known about the colonization efficiency and the signal pathways of the beneficial Trichoderma longibrachiatum TG1 (TG1) in controlling wheat Fusarium crown rot caused by Fp, and enhancing wheat seedling growth under combined salinity and Fp stresses. Therefore, the present study aims to determine the colonization, phytohormone profile, and signaling pathway in TG1-treated wheat seedlings under salinity and Fp stresses. In a dual culture assay, TG1 exhibited a mycoparasitic effect on Fp growth by coiling, conidial attachment, and parasitism observed under fluorescent microscopy. In addition, TG1 colonized the outermost layers of the wheat seedling roots with biomass consisting of conidia and hyphae. Under 100 mM NaCl stress, the combined TG1+Fp-treated seedlings recorded a control efficacy of 47.01% for the wheat crown rot disease compared with Fp-alone-treated seedlings. The contents of indole-3-acetic acid (IAA), gibberellic acid (GA3), abscisic acid (ABA) and jasmonic acid (JA) significantly increased by 72.16%, 86.91%, 20.04%, and 50.40%, respectively, in the combined TG1+Fp treatments, whereas the ethylene (ET) content decreased by 39.07% compared with Fp alone at day 14; and 5.07 and 2.78-fold increases in the expression of salicylic acid (SA) signaling pathway genes, such as pathogenesis-related protein 1 (PR1) and isochorismate synthase 1 (ICS1) genes were recorded respectively, in the combined TG1+Fp-treated seedlings compared with the control at day 14.
1. Introduction
Soil salinization is recognized as one of the most serious threats to agricultural production, affecting more than one billion hectares of land in over 100 countries worldwide [1]. Pathogens can also have devastating effects on plants, impacting their growth, development, and productivity. Infected plants may exhibit morphological changes such as lesions, necrosis, wilting, yellowing, stunted growth, and deformation [2]. Physiologically, pathogens can disrupt plant photosynthesis, nutrient uptake, and hormone balances, leading to growth and productivity reduction [3]. Wheat is a major cereal crop in the North China Plain. Recently, it has faced on the negative effects of biotic and abiotic stresses [4,5]. Saddiq et al. reported that soil salinization can cause a number of negative effects, including physiological and biochemical changes in plants, which manifests as a reduction in plant biomass and crop yield [6]. In addition, wheat crown rot is a serious soil-borne disease that mainly caused by Fusarium pseudograminearum (Fp) in wheat growing regions worldwide, and leading to significant yield losses up to 100% in Australia and 65% in North America under favorable conditions [7]. In China, an outbreak resulted in a 70.6% yield losses, and with mycotoxin contamination further complicated the issue in 2019 [8]. Moreover, the previous studies have reported that the interaction of salt stress and fungi infection, which causes detrimental effects on wheat [9,10], such as the F. graminearum infection can decrease the seed dry weights, germination, and seed vigor in both resistant and susceptible wheat cultivars [11]. In our previous study, we found that different NaCl concentrations and Fp stresses decreased the emergence parameters of wheat seedlings growth and development [9].
Plants, as sessile organisms, employ various mechanisms mediated by enzymes, proteins, or genes as their first line of defense against stress [12]. Heat shock proteins (HSPs) and genes play the vital role in plant defense by stabilizing proteins and cellular structures, helping plants cope with stressful conditions [13]. For instance, cellular stress triggers the appearance of denatured proteins and polypeptides, which in turn upregulate the expression of HSPs, leading to a significant increase in their levels within the cell. While HSPs are primarily induced by heat shock, they can also be upregulated in response to various other stresses such as salinity, drought, oxidation, and a wide range of chemicals and contaminants [14]. In a previous study, the wheat hybrid Jinan 177 and its salt-resistant hybrid protein profiling showed that HSPs and chaperones were highly induced under salt stress [15]. Additionally, mitochondrial HSP70 gene was upregulated in rice roots under salt stress, possibly regulating programmed cell death [16]. However, there are less studies on the effect of beneficial biocontrol agents such as T. longibrachiatum TG1 (TG1) on HSPs genes expression in wheats under dual stress such as salinity and Fp stresses.
Furthermore, plant phytohormones play the pivotal role in mediating and alleviating stress responses, allowing plants to cope with both abiotic and biotic stresses. There are several classes of phytohormone, including auxins, cytokinins, gibberellins (GAs), abscisic acid (ABA), ethylene (ET), salicylic acid (SA), and jasmonic acid (JA), among others. SA, JA, ABA, and ET are four key signaling molecules that play important roles in regulating plant responses to various environmental stresses [17]. Among the different signaling molecules, Trichoderma spp. have been proven to increase the SA contents in wheat [9,18], maize, and rice under salinity stress [19]. In addition, SA plays a vital role in plant defense responses against biotic stress [20] through cross-talks with GA, JA, ABA, and ET. The isochorismate synthase (ICS) and phenylalanine ammonia-lyase (PAL) pathways are two distinct but interconnected pathways that play important roles in the biosynthesis of SA [21]. The ICS-SA pathway involves the conversion of chorismate, an intermediate in the shikimate pathway, into isochorismate by the enzyme ICS [21]. Isochorismate is then converted into SA by the action of the enzyme salicylate synthase (SAS). However, the Trichoderma underlying signal pathway in combined salinity and pathogen stresses in wheat seedlings is still unknown.
Our previous studies revealed that TG1 has a higher potential in promoting wheat seedling growth and increasing endogenous SA content under different concentrations of NaCl and Fp stresses [9,22]. However, the previous studies failed to determine the colonization, phytohormone profile, and signaling pathway in TG1-treated wheat seedlings under salinity and Fp stresses. Therefore, this study aims to determine the colonization, phytohormone profile, and signaling pathway in TG1-treated wheat seedlings under salinity and Fp stresses.
2. Results
2.1. TG1-Green Fluorescence Protein (GFP) Transformation
The TG1 transformant exhibited strong green fluorescence in hyphae (Figure 1D) and spores (Figure 1F) under a fluorescence microscope which corresponded to the bright appearance observed under bright field without fluorescence (Figure 1C,E). The spore concentration and colony growth diameter of the wild-type and transformed strains showed no statistical difference. The transformed strain GFP-TG1 exhibited colony growth diameter and spore concentration of 8.45 cm and 34.35 × 10⁸ spores/mL (Figure 1B) at 5 days after inoculation, compared with the wild-type, with 8.50 cm and 35.47 × 10⁸ spores/mL (Figure 1A).
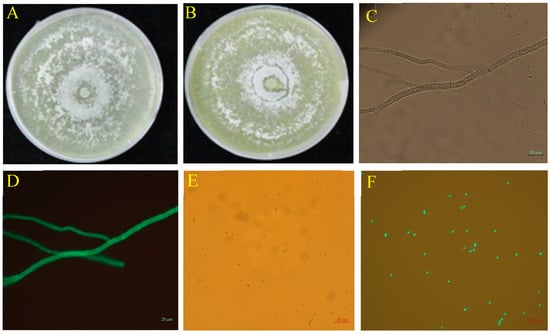
Figure 1.
Colony morphology and microscopic characteristics of wild-type and GFP-TG1 transformant on PDA plates at 5 days after inoculation. (A) Wild-type TG1, (B) GFP-labeled TG1, (C) Bright field microscopic image of GFP-labeled TG1 hyphae, (D) Fluorescence microscopic image of GFP-labeled TG1 hyphae, (E) Bright field microscopic image of GFP-labeled TG1 spores, and (F) Fluorescence microscopic image of GFP-labeled TG1 spores.
2.2. Mycoparasitic Effect and Root Colonization of TG1
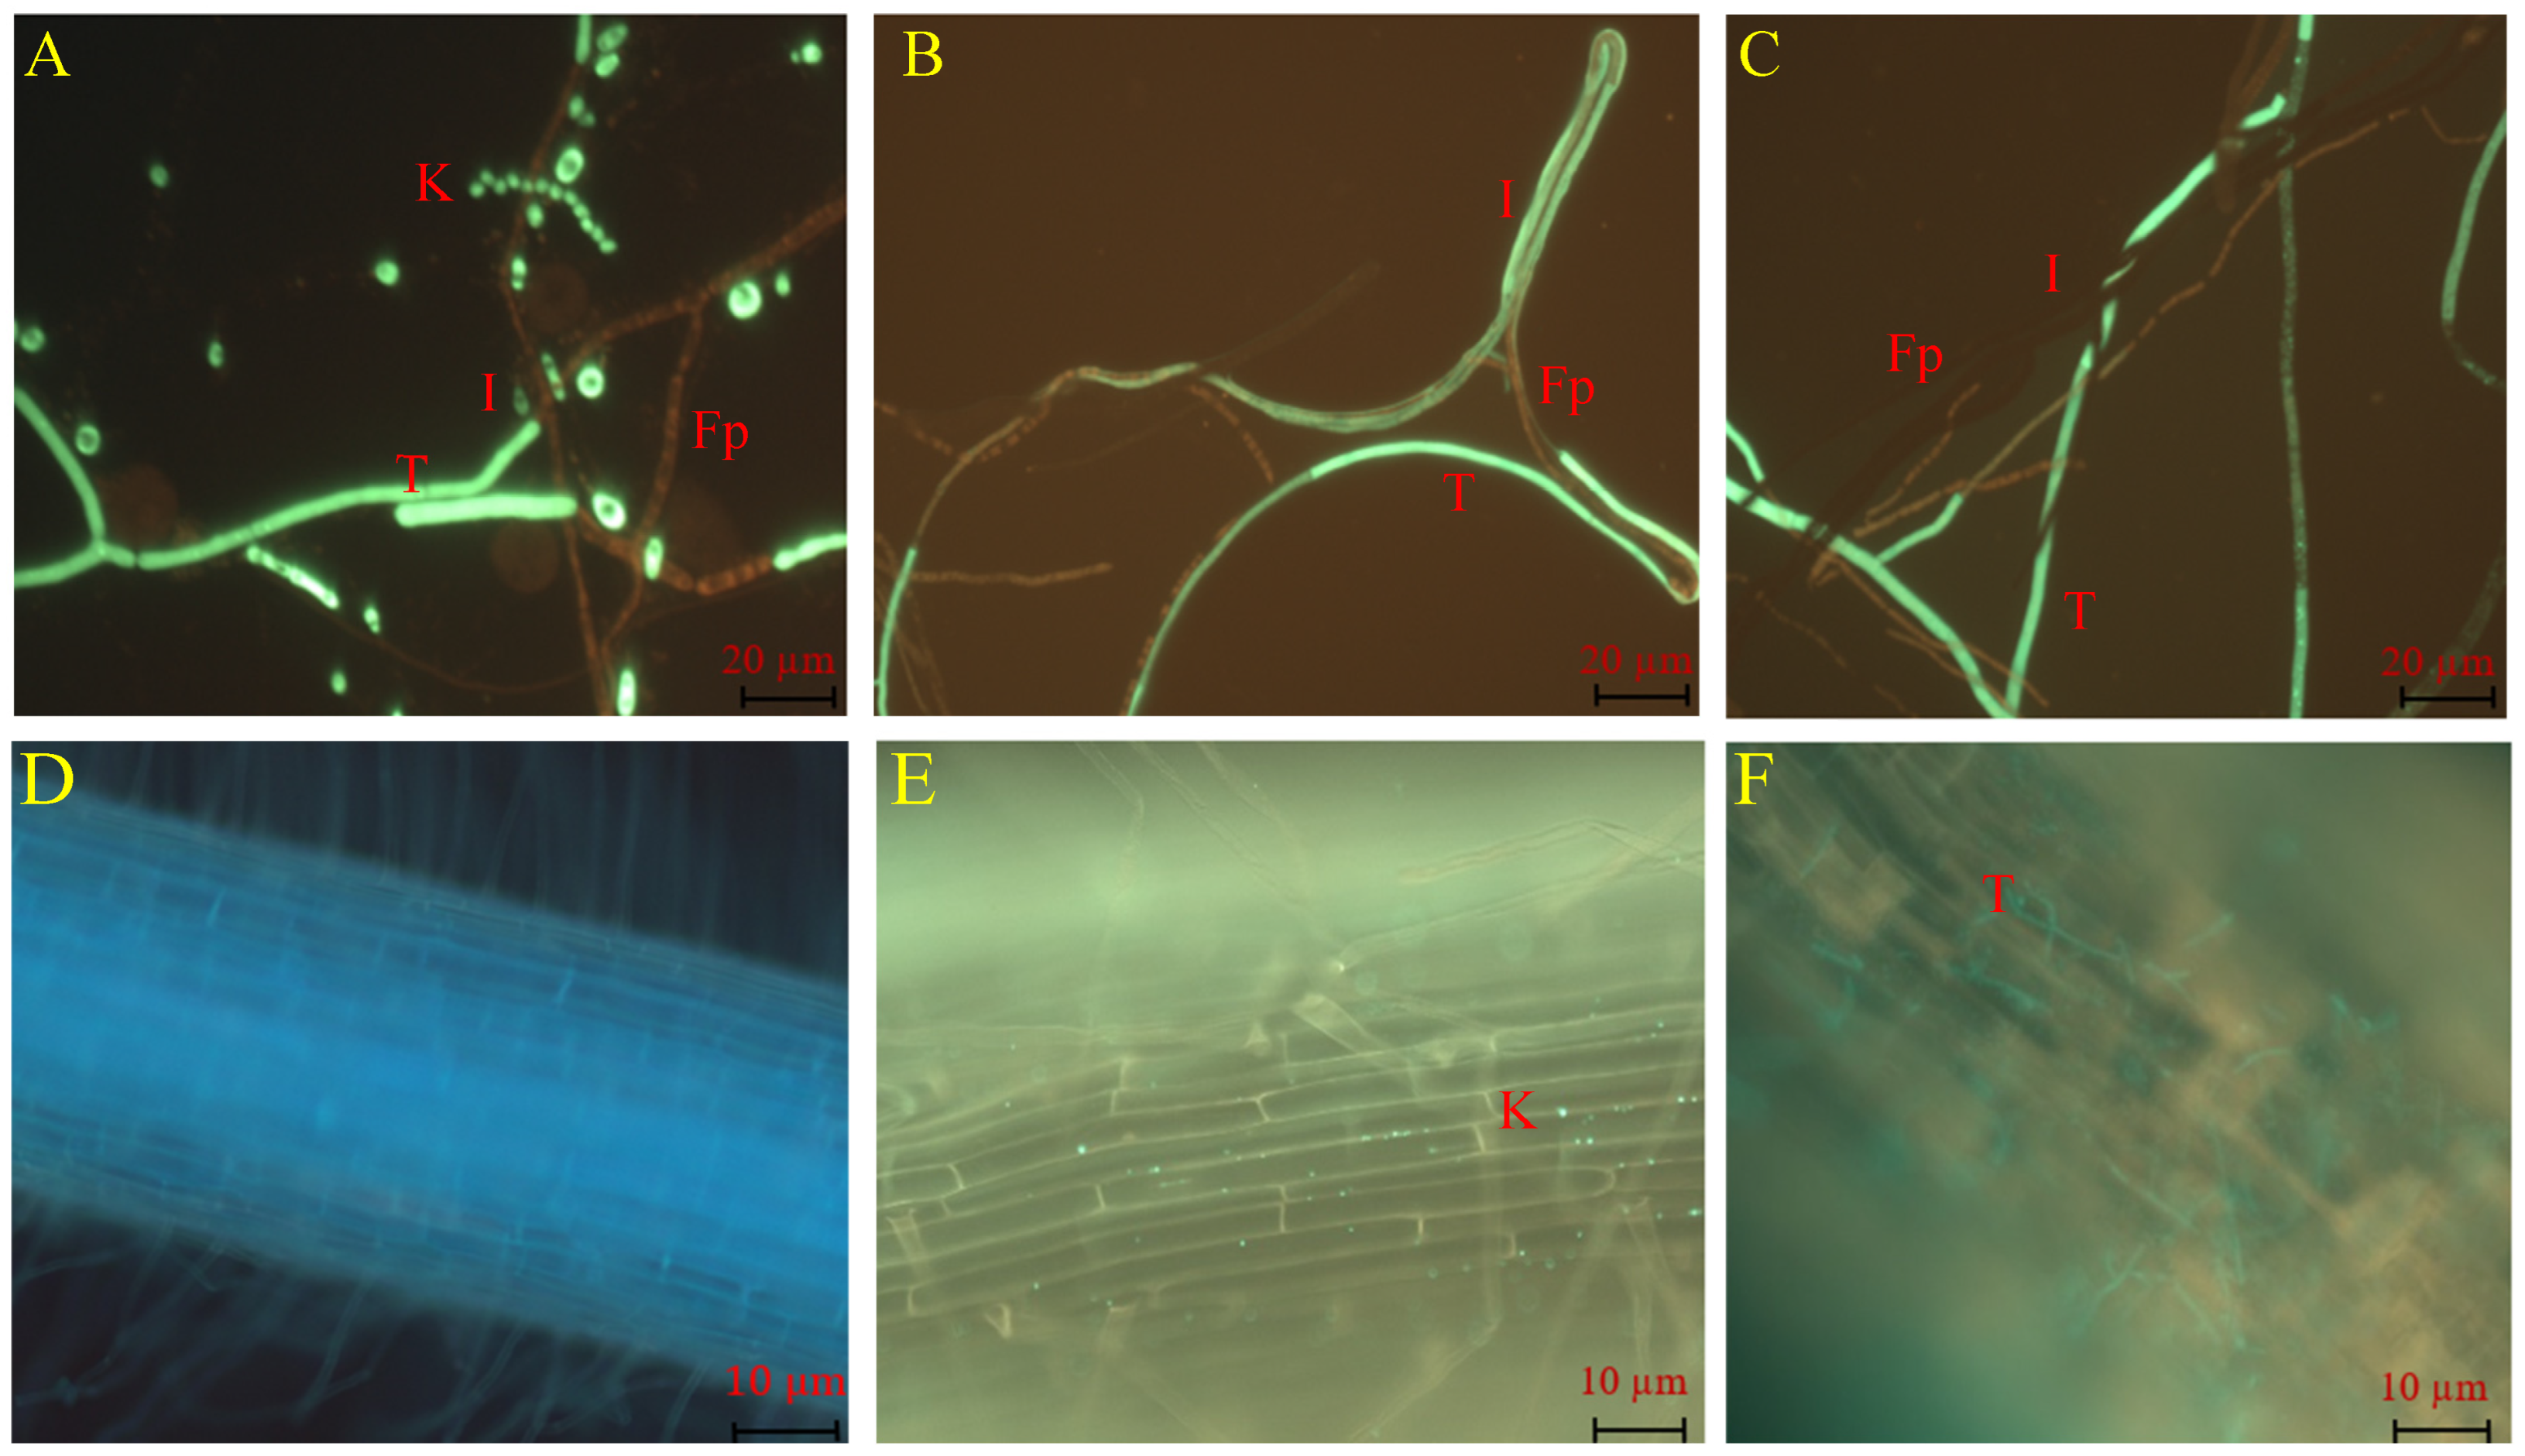
In the dual culture assay, TG1 demonstrated a mycoparasitic effect on the growth of Fp through conidial attachment to Fp hyphae (Figure 2A), and then the TG1 hyphae overgrew on the Fp hyphae and initiated parasitism (Figure 2B). Thereafter, the TG1 hyphae coiled, entangled, or wrapped around the Fp hyphae (Figure 2C). Additionally, in plant treatments, TG1 colonized the outermost layers of the wheat seedling roots with biomass consisting of conidia and hyphae. Under the fluorescence microscope, TG1 conidia were observed firmly attached to the root surface (Figure 2E), in contrast with the control-treated seedling (sterile water) roots (Figure 2D). Similarly, TG1 hyphal colonization and extension were clearly visualized on the root surface (Figure 2F), compared with the control.
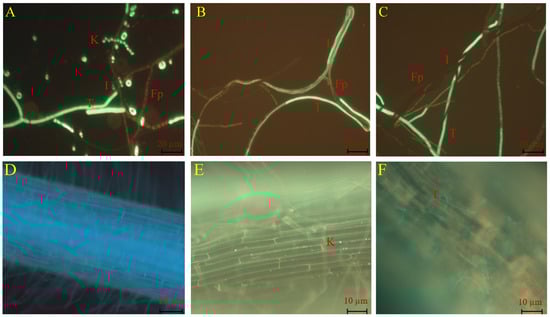
Figure 2.
Visualization of TG1 mycoparasitic effect on Fp and wheat root colonization. Where T and K represent TG1 hyphae and conidia, respectively; Fp represents Fp hyphae, and I represent the interaction between TG1 and Fp. (A) Conidia attachment of Fp hyphae, (B) TG1 hyphae exhibited parallel and overgrowth on the Fp hyphae, (C) TG1 hyphae entangled, coiled, or wrapped the hyphae of Fp, (D) root surface of wheat seedlings treated with sterile water (control), (E) TG1 conidia colonization on the root surface, and (F) TG1 hyphae colonization on the root surface.
2.3. Efficacy of TG1 Transformant in Controlling Fusarium Crown Rot Disease Under Salinity Stress
The disease index of Fusarium crown rot of wheat seedling that treated with TG1 wild-type or TG1-GFP transformant was lower than Fp treatment with or without salt stress. The disease index and control efficacy for the wild-type WT-TG1+Fp and transformant GFP-TG1+Fp-treated seedlings were not statistically significant. Under 0 mM NaCl stress, the control efficacies of WT-TG1+Fp and GFP-TG1+Fp treatments were 59.48% and 56.71%, respectively, compared with Fp alone. Under 100 mM NaCl stress, control efficacies of 47.01% and 41.42% were recorded for the WT-TG1+Fp and GFP-TG1+Fp treatments, respectively, compared with Fp alone (Table 1).

Table 1.
Control efficacy of TG1 and its transformant treatments on wheat Fusarium crown rot disease under salinity stress.
2.4. Phytohormone Contents in TG1-Treated Wheat Seedlings Under Salinity and Fp Stresses
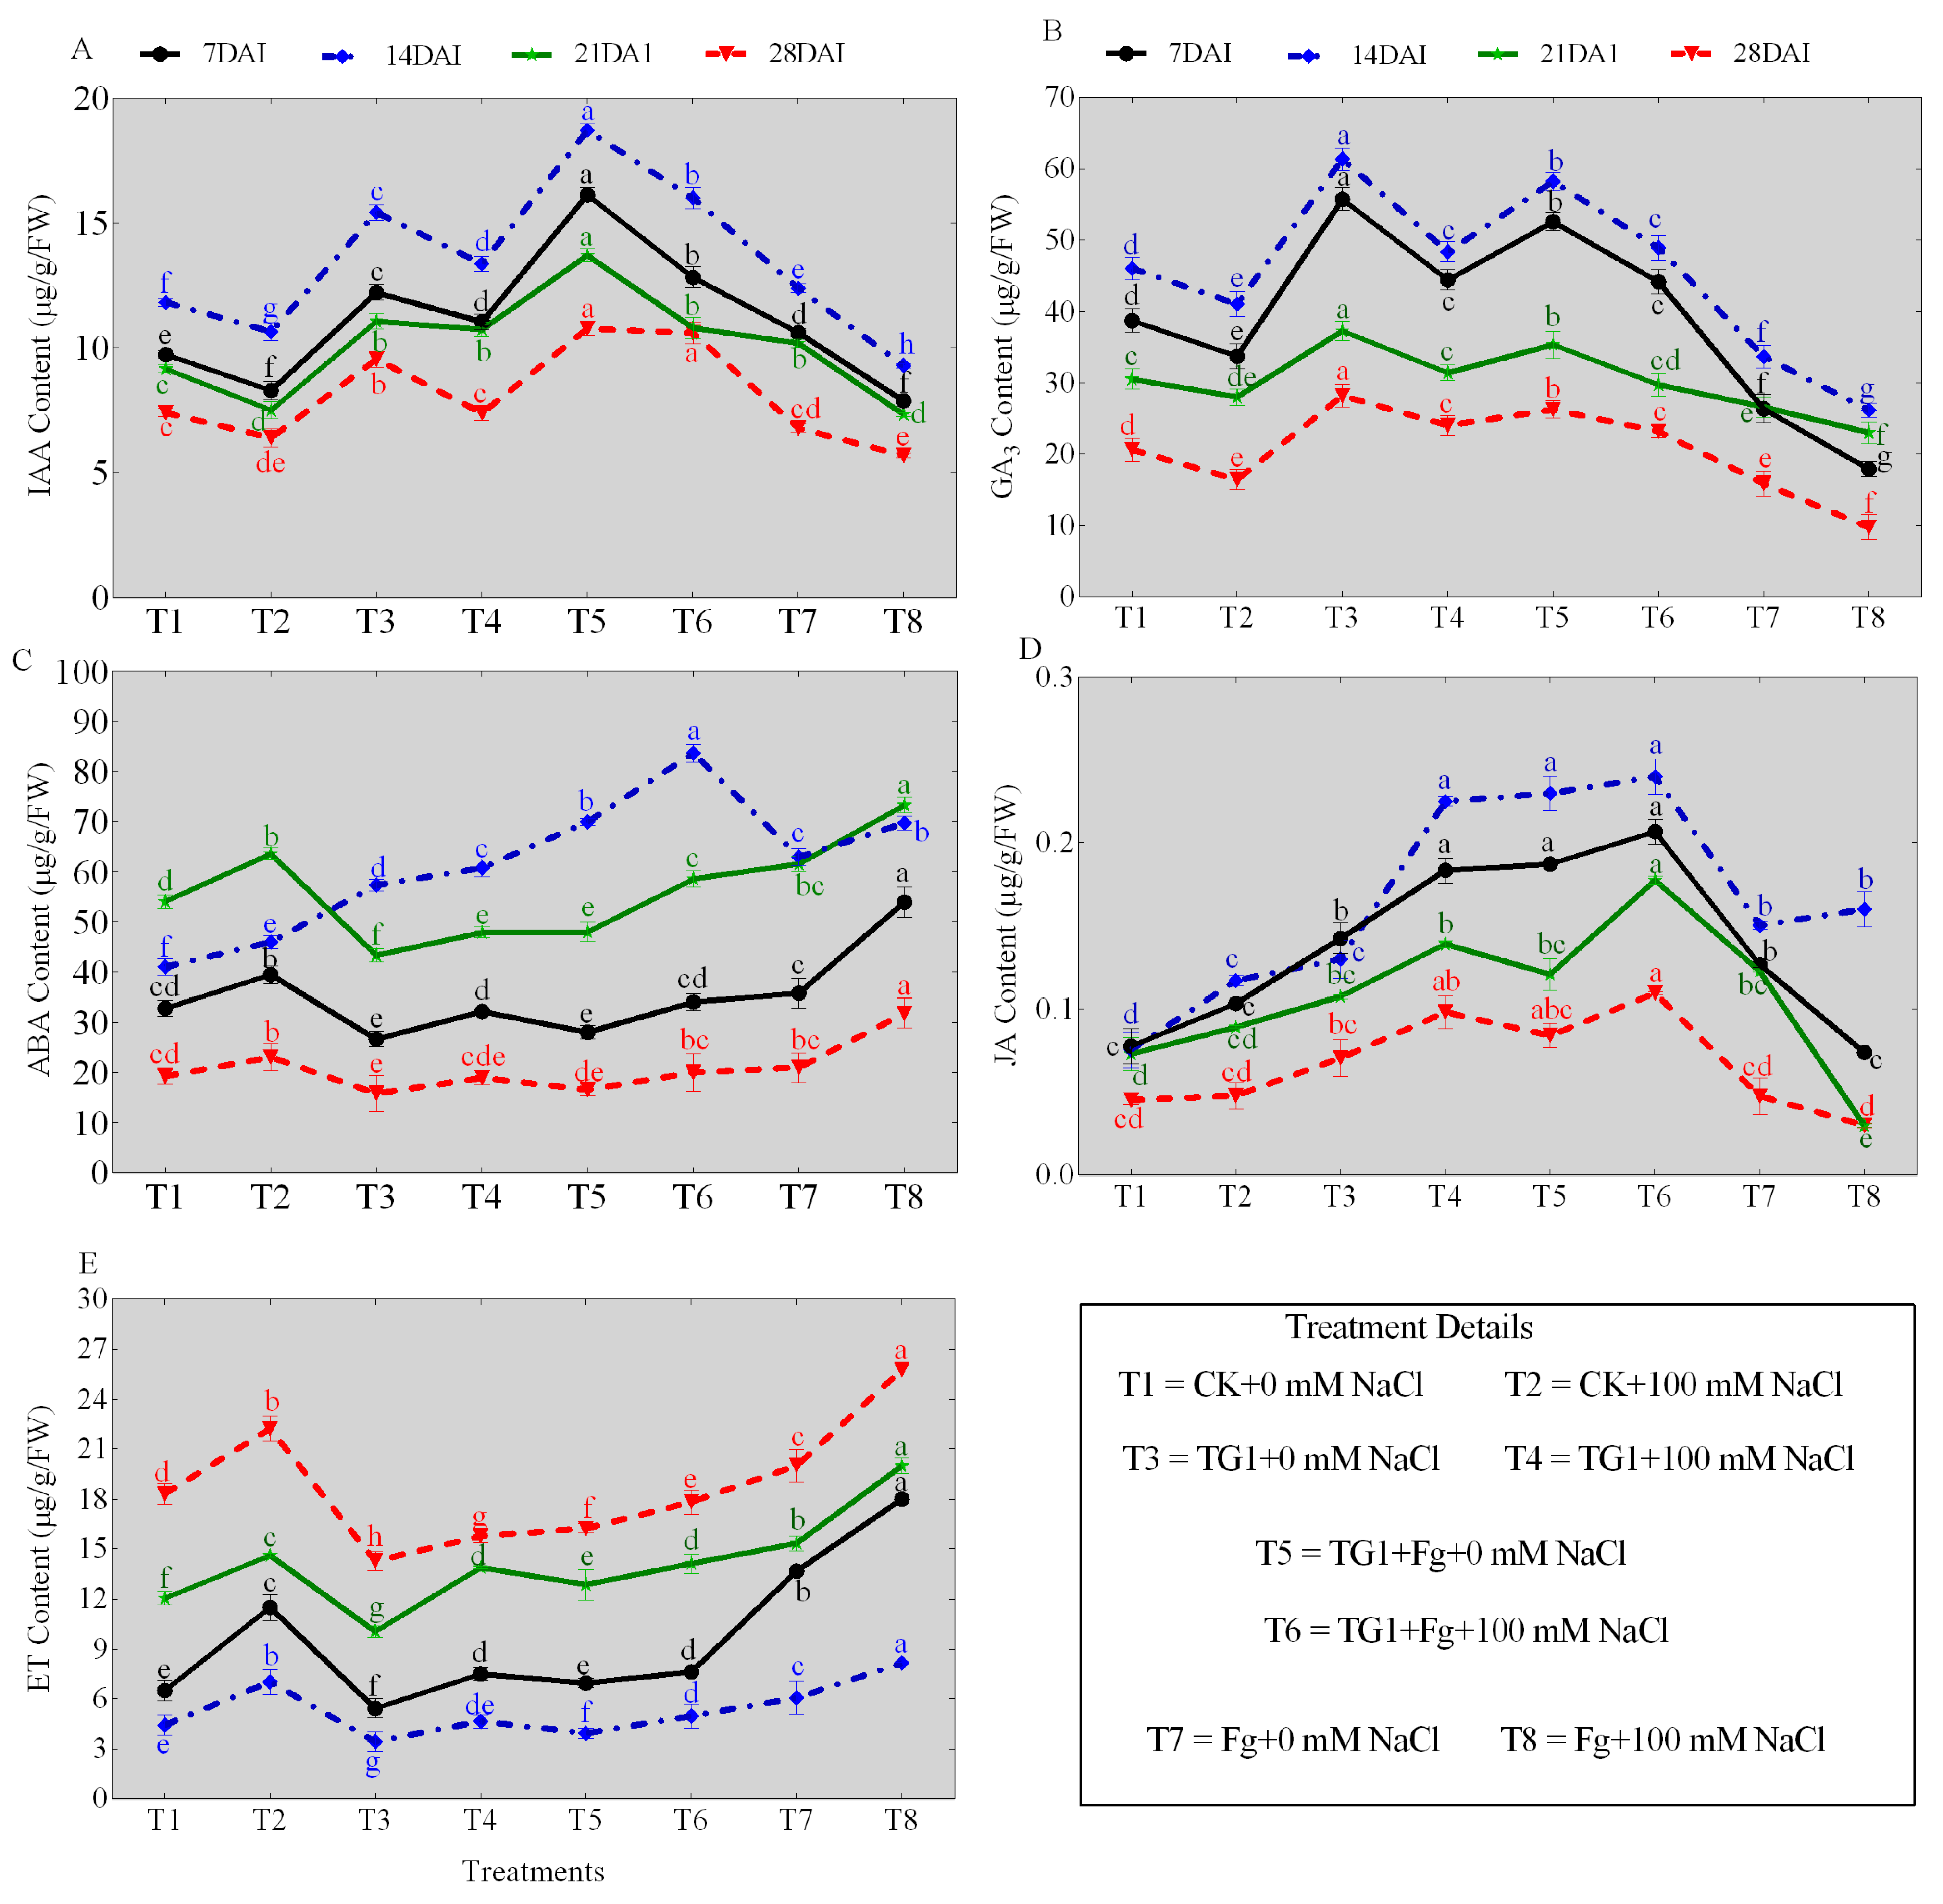
The TG1 treatments significantly increased the contents of IAA, GA3, ABA, and JA, and decreased the ET content of the wheat seedlings across the different days (7, 14, 21, and 28), respectively, compared with the sterile water-treated seedlings with or without salinity stress (Figure 3A–E). Similarly, the combined TG1+Fp-treated seedlings also increased the IAA, GA3, ABA, and JA contents and decreased the ET content of wheat seedlings across the different days, respectively, compared with Fp-alone-treated seedlings with or without salinity stress. Comparatively, the predominant increase in IAA (Figure 3A), GA3 (Figure 3B), ABA (Figure 3C), and JA (Figure 3D) contents and the decrease in ET (Figure 3E) content were observed at day 14. Under 0 mM NaCl stress, the IAA, GA3, ABA, and JA contents of TG1-treated seedlings increased by 30.45%, 33.37%, 39.59%, and 74.72%, and ET content decreased by 22.71% at day 14, respectively, compared with the control (sterile water). Similarly, the IAA, GA3, ABA, and JA contents of the combined TG1+Fp-treated seedlings increased by 50.94%, 72.89%, 11.12%, and 53.03%, and the ET content decreased by 35.08% under 0 mM NaCl stress, respectively, compared with Fp alone at day 14. Under 100 mM NaCl stress, the IAA, GA3, ABA, and JA contents of TG1-treated seedlings increased by 25.50%, 17.80%, 32.26%, and 92.25%, and the ET content decreased by 33.86% at day 14, respectively, compared with the control (sterile water). Similarly, the IAA, GA3, ABA, and JA contents of TG1+Fp-treated seedlings increased by 72.16%, 86.91%, 20.04%, and 50.40%, and the ET content decreased by 39.07%, respectively, compared with the Fp alone at day 14 under 100 mM NaCl stress.
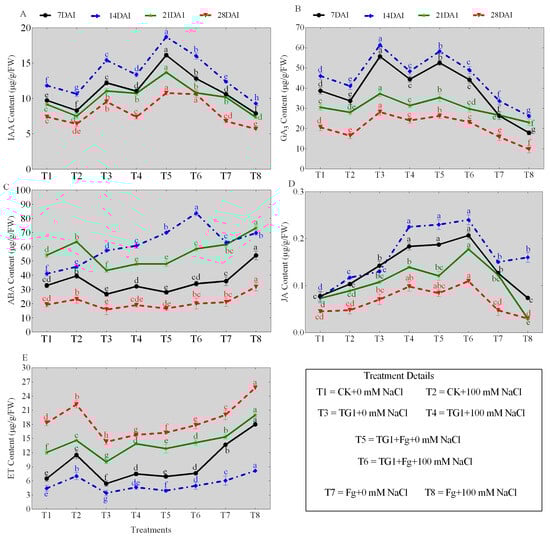
Figure 3.
Effect of TG1 on phytohormone contents of wheat seedlings under the combined salinity and Fp stresses at different days (7, 14, 21, and 28). Where (A–E) represent the contents of IAA, GA3, ABA, JA, and ET, respectively. Where T1 (CK+0 mM NaCl) represents wheat seeds treated with sterile water and subjected to no salt stress (0 mM NaCl), T2 (CK+100 mM NaCl) represents wheat seeds treated with sterile water and subjected to 100 mM NaCl stress, T3 (TG1+0 mM NaCl) represents wheat seeds treated with TG1 spore suspension and subjected to no salt stress (0 mM NaCl), T4 (TG1+100 mM NaCl) represents wheat seeds treated with TG1 spore suspension and subjected to 100 mM NaCl stress, T5 (TG1+Fp+0 mM NaCl) represents wheat seeds treated with TG1 and Fp spore suspension and subjected to no salt stress (0 mM NaCl), T6 (TG1+Fp+100 mM NaCl) represents wheat seeds treated with TG1 and Fp spore suspension and subjected to 100 mM NaCl stress, T7 (Fp+ 0 mM NaCl) represents wheat seeds treated with Fp spore suspension and subjected to no salt stress (0 mM NaCl), and T8 (Fp+100 mM NaCl) represents wheat seeds treated with Fp spore suspension and subjected to 100 mM NaCl stress. Different lowercase letters indicate significant differences at p < 0.05 in Duncan’s multiple-range test using one-way ANOVA.
2.5. SA Signaling Pathway Genes Expression in TG1-Treated Wheat Seedlings Under Salinity and Fp Stresses
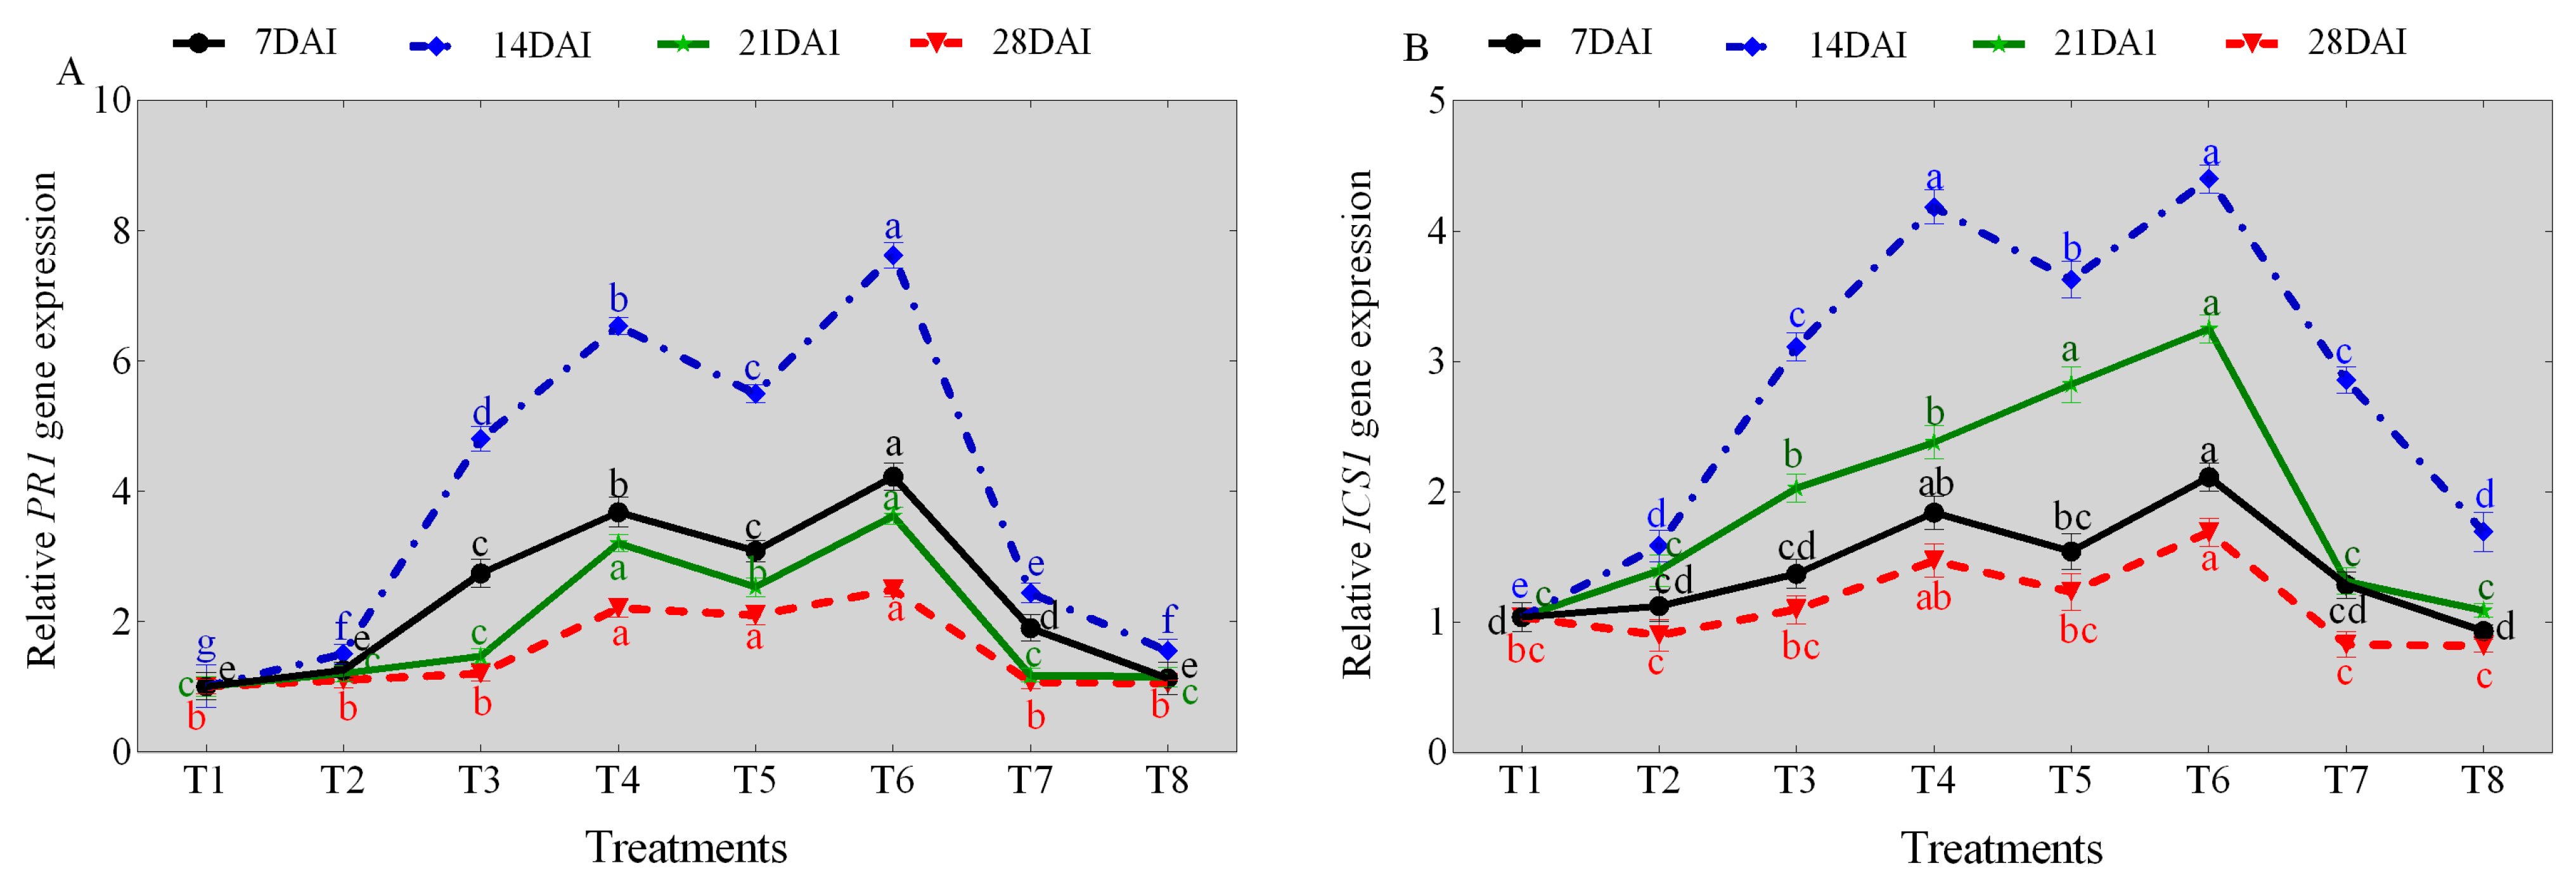
NaCl stress significantly affected the transcription levels of ICS1 and pathogenesis-related 1 (PR1) genes across the different days (7, 14, 21, and 28), respectively, compared with the control (sterile water). Comparatively, a significant increase in both ICS1 and PR1 genes transcript levels were observed in TG1, TG1+Fp, and Fp-treated seedlings across the different days compared with the control (sterile water) (Figure 4A, B). The predominant increase in the ICS1 and PR1 genes transcript levels were observed at day 14 under salinity and Fp stresses. Under 0 mM NaCl stress, the PR1 gene transcript levels of TG1, TG1+Fp, and Fp-treated seedlings increased by 4.76, 5.45, and 2.42-fold at day 14, respectively, compared with the control (sterile water) (Figure 4A). Similarly, the ICS1 gene transcript levels of TG1, TG1+Fp, and Fp-treated seedlings increased by 3.00, 3.49, and 2.75-fold, respectively, compared with the control (sterile water) at day 14 (Figure 4B). Under 100 mM NaCl stress, the PR1 gene transcript levels of TG1, TG1+Fp, and Fp-treated seedlings increased by 4.35, 5.07, and 1.03-fold, respectively, compared with the control (sterile water) at day 14 (Figure 4A). Similarly, the ICS1 gene transcript levels of TG1, TG1+Fp, and Fp-treated seedlings increased by 2.64, 2.78, and 1.07-fold at day 14, respectively, compared with the control (sterile water) (Figure 4B).
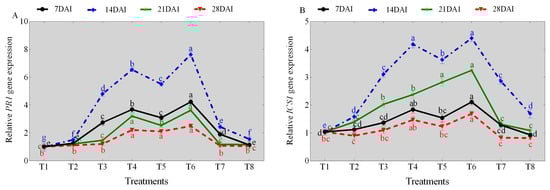
Figure 4.
Transcription levels of (A) PR1 and (B) ICS1 genes for the TG1-treated wheat seedlings under salinity and Fp stresses at different days (7, 14, 21, and 28). Treatments are detailed in the footnote of Figure 3. Different lowercase letters indicate significant differences at p < 0.05 in Duncan’s multiple range test using one-way ANOVA.
2.6. Effect of TG1 on HSP70 Genes Expression in Wheat Seedlings Under Fp and Salinity Stresses
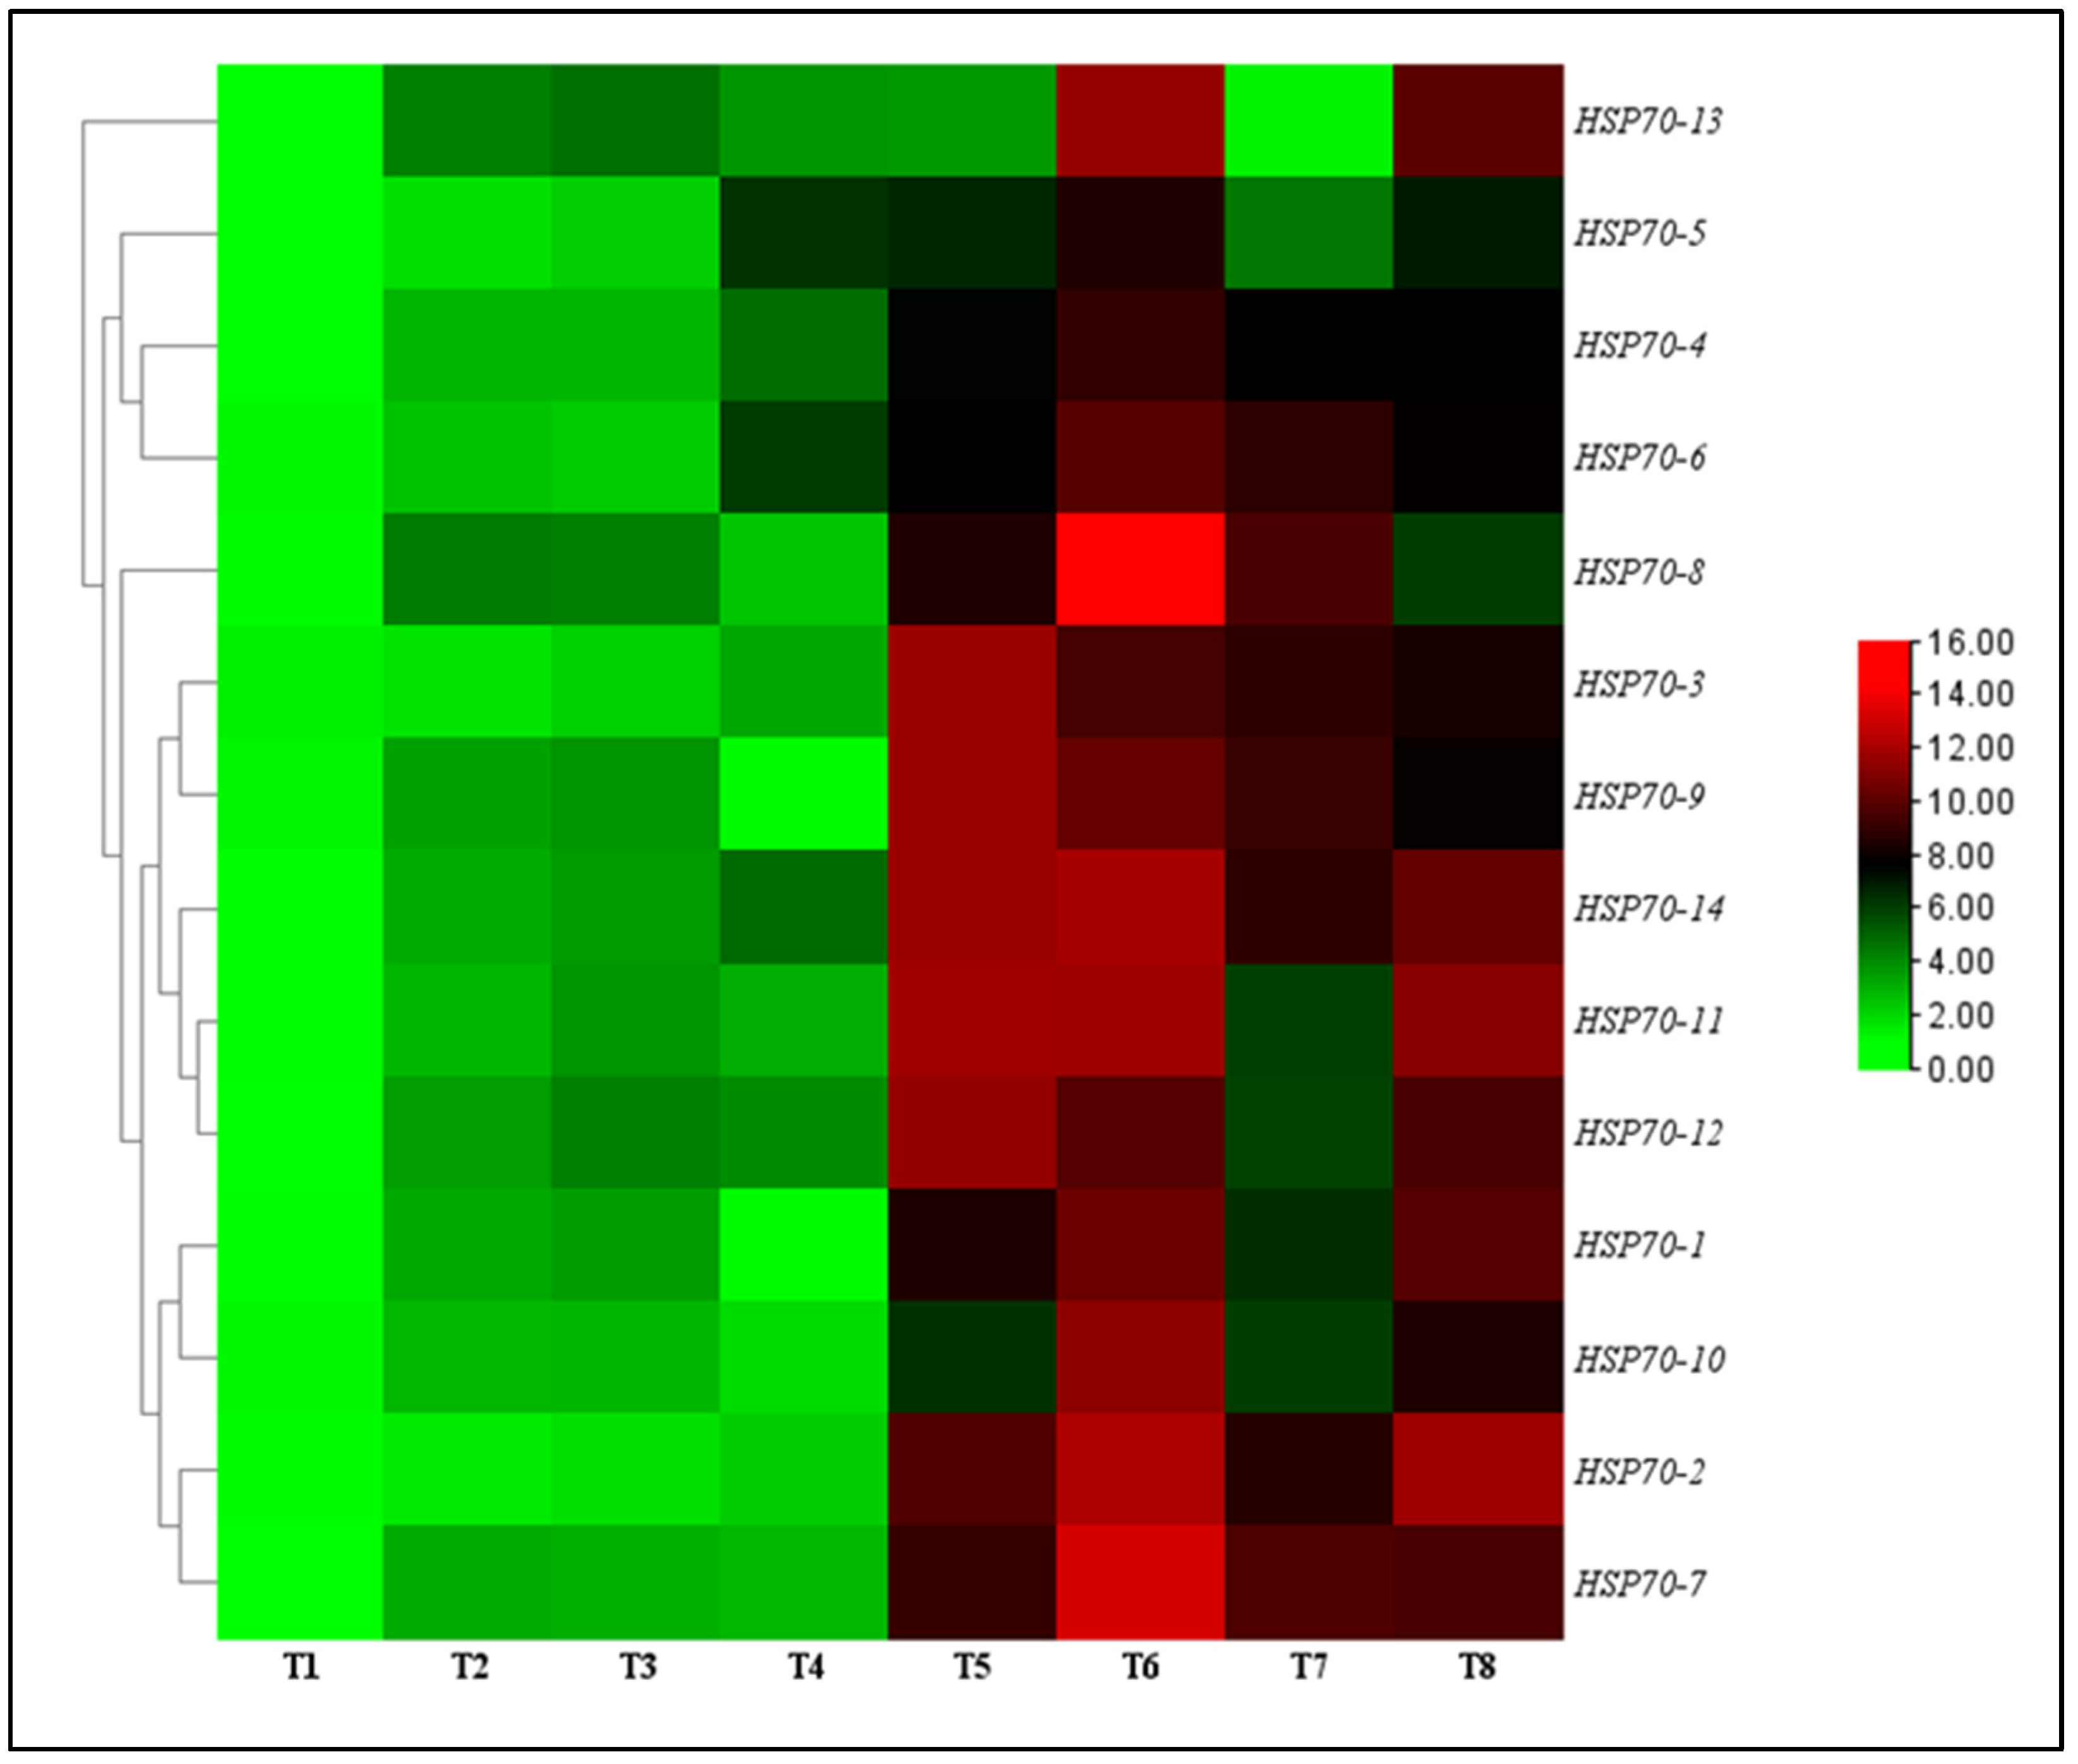
The effect of TG1 on the transcript levels of HSP70 genes in wheat seedlings were evaluated under salinity and Fp stresses at day 14 after treatment. The results showed that all transcript levels of HSP70-1 to HSP70-14 genes were significantly upregulated and increased for the TG1, TG1+Fp, and Fp-treated seedlings with or without salinity stress compared with the control (sterile water). Under 0 mM NaCl stress, the transcript levels of HSP70-1 to HSP70-14 genes increased from 2.25 to 2.30-fold for the TG1-treated seedlings, respectively, compared with the control (sterile water). Similarly, under 100 mM NaCl stress, the transcript levels of HSP70-1 to HSP70-14 genes for the TG1-treated seedlings increased from 1.46 to 1.58-fold, respectively, compared with the control (sterile water). Compared with Fp-alone treatments, the combined TG1+Fp treatments significantly increased the transcript levels of HSP70-1 to HSP70-14 genes from 1.57 to 1.46-fold, respectively, under 0 mM NaCl stress. Similarly, TG1+Fp treatments increased the transcript levels of all HSP70-1 to HSP70-14 genes from 1.12 to 1.44-fold, respectively, under 100 mM NaCl stress, where HSP70-7 and HSP70-8 showed the highest transcript level increases of 2.14 and 5.87-folds (Figure 5).
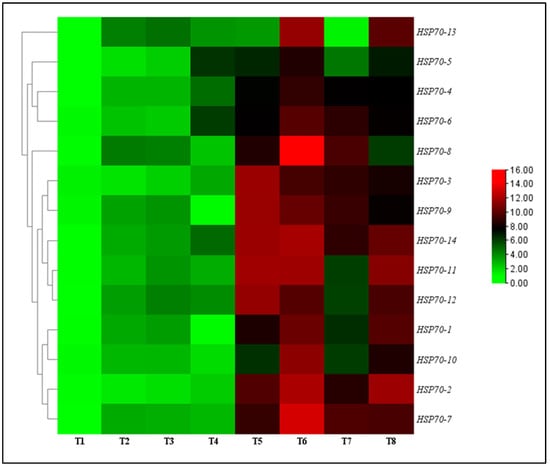
Figure 5.
Relative transcription levels of HSP70 genes in TG1-treated wheat seedlings under Fp and salinity stresses at day 14. The color bar is the scale of relative transcript levels of the genes. Treatments are detailed in the footnote of Figure 3.
2.7. Resistance Genes in TG1-Treated Wheat Seedlings Under Salinity and Fp Stresses
The transcript levels of defense-related genes (nonexpressor of pathogenesis-related 1 (NPR1), enhanced disease susceptibility (EDS), phytoalexin deficient 4 (PAD4), salicylic acid induction-deficient 2 (SID2), lipid transfer protein (LTP), and WRKY transcription factor (WRKY)), JA-associated genes (lipoxygenase (LOX), allene oxide synthase (AOS), acyl-CoA oxidase (ACX), allene oxide cyclase (AOC)) and ET-associated genes (1-aminocyclopropane-1-carboxylate synthase (ACS), ethylene response factor 1 (ERF1), ethylene insensitive 2 (EIN2), ethylene insensitive 3 (EIN3)) were analyzed for the TG1-treated seedlings under salinity and Fp stresses at day 14. Under 0 mM NaCl stress, the transcript levels of NPR1, EDS, PAD4, SID2, LTP, and WRKY genes increased by 3.59, 2.16, 3.22, 3.47, 5.88, and 3.79-fold at day 14 for the TG1 treated seedlings, respectively, compared with the control (sterile water). Similarly, they increased by 2.56, 1.12, 1.32, 1.91, 2.19, and 2.40-fold under 100 mM NaCl stress. Additionally, the transcript levels of NPR1, EDS, PAD4, SID2, LTP, and WRKY genes increased by 2.20, 1.94, 1.70, 1.63, 2.80, and 4.60-fold for the combined TG1+Fp-treated seedlings under 0 mM NaCl stress, respectively, compared with Fp-alone treatment. Similarly, they increased by 2.05, 2.51, 3.61, 3.51, 3.05, and 2.34-fold under 100 mM NaCl stress (Figure 6).
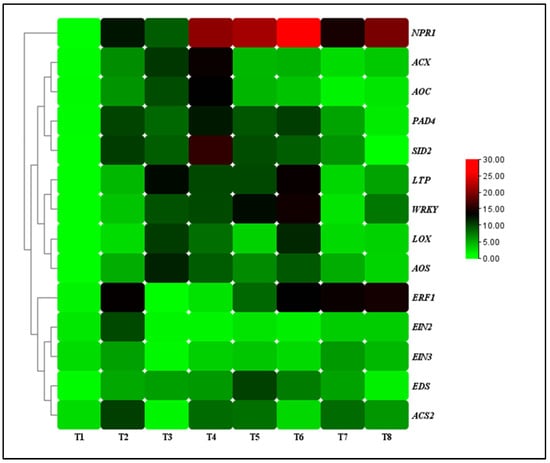
Figure 6.
The transcript levels of resistance genes in TG1-treated wheat seedlings under Fp and salinity stresses at 14 days after treatment. The color bar is the scale of relative transcript levels of the genes. Treatments are detailed in the footnote of Figure 3.
Under 0 mM NaCl stress, the transcript levels of LOX, AOS, ACX, and AOC genes increased by 4.31, 5.12, 4.39, and 3.77-fold at day 14 for the TG1-treated seedlings, respectively, compared with the control (sterile water). Similarly, the transcript levels of TG1-treated seedlings LOX, AOS, ACX, and AOC genes increased by 2.27, 1.76, 2.61, and 2.60-fold under 100 mM NaCl stress, respectively, compared with the control (sterile water). The combined TG1+Fp-treated seedlings LOX, AOS, ACX, and AOC genes transcript levels increased by 1.07, 1.29, 1.36, and 1.71-fold, respectively, compared with Fp-alone treatment under 0 mM NaCl stress at day 14. Similarly, under 100 mM NaCl stress, the combined TG1+Fp-treated seedlings LOX, AOS, ACX, and AOC genes transcript levels increased by 3.32, 2.48, 1.20, and 1.35-fold, respectively, compared with Fp-alone treatment at day 14 (Figure 6).
Furthermore, under 0 mM NaCl stress, TG1-treated seedlings ACS2, ERF1, EIN2, and EIN3 genes transcript levels decreased by 1.27, 1.11, 1.15, and 1.31-fold, respectively, compared with the control (sterile water) at day 14. Similarly, under 100 mM NaCl stress, TG1-treated seedlings ACS2, ERF1, EIN2, and EIN3 genes transcript levels decreased by 1.33, 4.99, 3.71, and 1.45-fold, respectively, compared with the control (sterile water). The combined TG1+Fp-treated seedlings ACS2, ERF1, EIN2, and EIN3 genes transcript levels decreased by 1.03, 2.05, 1.22, and 1.41-fold, respectively, compared with Fp-alone treatment under 0 mM NaCl stress at day 14. Similarly, under 100 mM NaCl stress, the combined TG1+Fp-treated seedlings ACS2, ERF1, EIN2, and EIN3 genes transcript levels decreased by 1.66, 1.14, 1.35, and 1.32-fold, respectively, compared with Fp-alone treatment at day 14 (Figure 6).
3. Discussion
In this study, the highly efficient TG1 strain exhibited strong green fluorescence, and the transformant possessed the same biological characteristics as the wild-type strain. In the dual culture assay, the TG1 strain initiated a mycoparasitic effect on Fp by coiling, conidial attachment, and parasitism of Fp hyphae. This mycoparasitic action helps reduce the severity of fungal disease caused by pathogen like Fp, which causes crown rot, especially when environmental stress, such as salinity, make plants more vulnerable to infections. Our findings are consistent with Hasan et al. [23], who reported that Trichoderma and Clonostachys rosea mycoparasites efficiently overgrow and kill the fungal pathogen (Botrytis cinerea) by using infection structures and applying lytic enzymes such as cell wall-degrading enzymes (CWDEs) and toxic metabolites during interaction.
In previous studies, the co-inoculation of Aspergillus niger and T. harzianum alleviated the deleterious effects of salt stress in wheat seedlings through the solubilization of phosphorus and joint production of indoleacetic acid [24]; Sánchez-Montesinos et al. [25] reported that with the increase in sodium chloride concentrations, three isolates of Trichoderma showed antagonistic activity against Pythium ultimum on melon seedlings by reducing the incidence of the disease. However, in this study, the inoculation of TG1 alone decreased the deleterious effects of salt stress on wheat seedlings and the combined TG1+Fp treatment induced resistance to Fp by decreasing the disease index. In addition, Ruano-Rosa et al. [26] reported that the visualization of the green fluorescence protein labeled T. harzianum CECT 2413 (Th-GFP) biomass showed the presence of pre-germinated conidia on olive roots. Fluorescent hyphae were minimal or absent, with conidia and chlamydospores firmly attached to the root epidermis, showing little change at 14 DAI. In this study, fluorescence microscopy revealed the presence of conidia and hyphae of TG1-GFP on the surface of the wheat seedling roots at 14 DAI. The abundant TG1 conidia and hyphae on the seedling root surfaces defined their colonization potential.
The establishment of microbial symbioses to promote plant growth and nutrient acquisition by beneficial microbes have been correlated with the biosynthesis of plant growth regulators and phytohormones [27]. A previous study has shown that a higher synthesis of IAA in cucumber by a putative mutant of T. harzianum enhanced the colonization of the rhizosphere, rhizoplane, roots, and stems [28]. Similarly, in this current study, the co-inoculation of TG1 and Fp increased the IAA, GA3, JA, and ABA contents and decreased the ET content of the wheat seedlings under the combined stress. The increase in phytohormones and regulation of the ethylene content induced plant growth, salinity tolerance, and resistance. In support of our findings, it was reported that T. asperellum also releases ABA, together with IAA and GA, into the culture medium, and its application to cucumber promoted seedling growth and alleviated the effects of salt stress [29]. Again, it was reported that ET regulates plant growth, development, and senescence, and it is well established that low ET concentrations in the root zone correspond to higher shoot growth [30].
From a previous study, it was reported that biotrophic and necrotrophic pathogens are generally two types of pathogens that activate the SA signaling pathway [31]. The biotrophic pathogens stimulate the transcription of NPR1. This, in turn, triggers the activation and accumulation of SA-associated genes, such as PR1, PR2, and PR5, both locally and systematically, leading to systemic acquired resistance (SAR) [31]. Similarly, in this study, the combined TG1+Fp treatment can lead to SAR, characterized by elevating the transcript levels of PR1 and ICS1 genes, which are genes of the SA pathway. Additionally, the exposure of tomato species to both high and low temperatures, along with infection by Phytophthora infestans, led to the upregulation of HSP70 genes and the increased synthesis of HSP70 proteins [32]. In this current study, the TG1 alone and combined TG1+Fp inoculation increased the transcript levels of HSP70 genes compared with the control under the combined stress. Similar findings were observed in Arabidopsis HSPs, along with PR proteins being more effective against Rhizoctonia solani [33]; many HSPs are induced and upregulated in saline stress situation like HSP70 genes expression in rice seedlings [34], wheat [35], and HSP70-9 to 12 and HSP70-33 genes expression in poplar [36].
In addition, another study identified genes and proteins involved in the beneficial interaction between Trichoderma and various plant species, both in roots and leaves during induced systemic resistance (ISR) [37]. Tomato seedlings inoculated with T. parareesei T6 significantly increased the transcript level of JA gene (LOX) 24 h after inoculation under NaCl stress in comparison with the control (sterile water) [38]. However, in this study, compared with the control (sterile water), TG1 alone or TG1+Fp treatment increased the transcript levels of JA-associated gene such as LOX at 14 days after inoculation with or without NaCl stress. Based on previous studies, several ET key genes, including EIN2, EIN3, and ERF1, have been assumed to be involved in fungal infections and salinity stress [39,40,41]. We hypothesized that EIN2, EIN3, and ERF1 genes may be master modulators of wheat seedling immunity against Fp infection and salinity stress. Therefore, we determined that these genes functions are involved in the defense responses of wheat seedlings against Fp and salinity stresses. From our findings, salinity stress and Fp infection induced and increased the transcript levels of EIN2, EIN3, and ERF1 genes in wheat seedlings that treated with sterile water. This finding confirmed that these key genes function as ET signaling and defense by providing immunity against salinity stress and Fp attacks. It has been demonstrated that a constitutive expression of ERF1 gene, a downstream component of the ET signaling pathway, increases Arabidopsis resistance to B. cinerea and Plectosphaerella cucumerina [42]. Solano et al. [43] also found that EIN3 directly regulates ERF1 gene expression by binding to a primary ethylene response element present in the promoter of ERF1. Xu et al. [44] reported that the transcription of the wheat TaERF1 gene was induced by salinity and Blumeria graminis f. sp. tritici, suggesting that ERF1 gene might play a role in distinct areas under biotic and abiotic stresses. Similarly, Zhao et al. [45] reported that, when salt stress diminishes, ERF1 gene expression decreases, thus alleviating the inhibition of lateral root emergence caused by the abnormal distribution of high auxin accumulation and promoting Arabidopsis root growth. Wang et al. [46] reported that transcriptomic ERF-related genes (EIL1, ERF3, ERF54, ERF53, ERF6, ERF9, and ERF7) were downregulated in Arabidopsis seedlings after inoculated with T. asperellum or T. viride under salt stress. This finding indicates that the inoculation with T. asperellum and T. viride decreased ethylene synthesis, thus improving the tolerance of seedlings to salt stress. In addition, it was reported that the ET signaling regulates plant growth and development, and EIN2, a key gene in the ET signaling pathway, is required for salt tolerance [39]. We found that the plant growth-promoting TG1 strain decreased the transcript levels of EIN2 gene under salinity and Fp stresses. In consistent with our findings, Rubio et al. [47] reported that the application of T. harzianum T34 decreased the expression level of EIN2 gene expression under salt stress or not in comparison with the normal tomato plants (control), while the salt stress alone increased the expression level of the EIN2 gene.
In addition, it was reported that, plants that over-accumulate EIN3 are compromised in pathogen-associated molecular pattern (PAMP) defenses and exhibited enhanced disease susceptibility to Pseudomonas syringae, and high transcription levels of EIN3 gene negatively regulates innate immunity in Arabidopsis [48]. In this current study, TG1 alone or combined TG1+Fp decreased the transcript levels of EIN3 gene, negatively regulating ethylene synthesis and promoting seedling growth, salinity tolerance, and resistance to Fp. In comparison with the previous study, the transcription level of EIN3 gene in onion was downregulated at day 1 after inoculation with the combined T. asperellum and Sclerotium cepivorum, whereas it increased at 21 days [49]. In contrast to our study, TG1 decreased the transcription level of EIN3 gene in wheat seedlings under salinity and Fp stresses at day 14. This indicates that TG1 modulates the expression of some key ET genes by suppressing the transcription of their repressors under combined abiotic and biotic stresses.
Similarly, it was reported that, in ethylene biosynthesis, ACO and ACS are key rate-limiting enzymes. ERFs can interact with the ACS2/5 genes promoter to inhibit their expression, negatively regulating ethylene synthesis [46]. In addition, the expression of ACS6, ACO6, ACS10, ACS10, and ACS11 genes was decreased after inoculation with T. viride under salinity stress [46]. Consistent with our findings, the TG1 strain alone or in combination with Fp reduced ethylene synthesis in wheat seedlings by lowering the transcript levels of ACS2 gene under combined salinity and Fp stresses. These results suggest that inoculation with the TG1 strain, which has ACCD activity, promotes plant growth by decreasing ethylene content, thereby alleviating the negative effects of both Fp and salinity stresses.
4. Materials and Methods
4.1. GFP-TG1 Strain Transformation and Fungal Inoculum Preparation
The fungi strains (Trichoderma longibrachiatum (TG1) and Fusarium pseudograminearum (Fp)) were obtained from the Laboratory of Plant Pathology, Gansu Agricultural University. TG1 and Fp were cultured on PDA media in Petri dishes for 7 and 14 days at 25 °C, respectively. Construction of the GFP-labeled strain TG1 was performed following the method of Hasan et al. [23], where TG1 spores were prepared and cultured in potato dextrose broth (PDB) at 180 rpm and 28 °C overnight. Protoplasts were filtered with three layers of lens tissue paper, suspended in sorbitol–Tris–calcium (STC) buffer and stored on ice. Polyethylene glycol CaCl2-mediated transformation of GFP was conducted. The pBR322 plasmid was propagated in Escherichia coli DH5α and cultured on Luria–Bertani (LB) medium with 100 µg/mL ampicillin, and the plasmid DNA was extracted using a TIANprep Rapid Mini Plasmid Kit (Tiangen Biotech Co., Ltd., Beijing, China). The protoplast suspension (200 µL) was mixed with 5 µg plasmid DNA and incubated on ice for 20 min, and then 1.25 mL of 40% polyethylene glycol–Tris–calcium solution was added. After 20 min, the mixture was poured into the LB medium containing ampicillin, followed by incubating at 28 °C. Transformants were obtained after 5 days. After four generations, stable transformants were checked under fluorescence microscopy (Zeiss™ Axioscope 5, Carl Zeiss Suzhou Co., Ltd., Suzhou, China). Transformants demonstrating robust fluorescence were selected for further experiment. The spore suspensions of TG1 and Fp were prepared according to the method of Zhang et al. [50]. The spore suspension of TG1 (1.0 × 10⁸ spores/mL) and Fp (5 × 10⁸ spores/mL) were quantified and stored at 4 °C.
4.2. Mycoparasitic Effect of GFP-TG1 on Fp and Determination Its Root Colonization In Vitro Conditions
The mycoparasitic effect of GFP-TG1 on Fp was observed using a dual plate culture method following the procedures of Yassin et al. [51]. Briefly, the cellophane fragments in the interaction zone were examined after following contact (overgrowth) at 4 days. Interaction between the fungi was observed under fluorescence microscopy (Zeiss™ Axioscope 5, Carl Zeiss Suzhou Co., Ltd., Suzhou, China).
Wheat seeds with equal sizes were surface sterilized with 1% NaOCl solution for 10 min and rinsed with sterile water for six times after disinfection. Thereafter, wheat seeds were soaked in GFP-TG1 spore suspension at a concentration of 1.0 × 10⁸ spores/mL and sterile water (control) for 12 h, respectively. The treatment-seeds were air-dried overnight under aseptic conditions, and then exposed to soil. Each treatment and control having three replicates, and each replicate with one plastic pot (9 cm in diameter and 10.5 cm in depth, containing 0.54 kg of sterile soil). Twenty uniform seeds were sown 1 cm deep in soil and lightly covered. The wheat seedlings were maintained in a growth chamber at 25/20 °C day/night temperature under a 16/8 h light/dark photoperiod. Following periodic irrigation, seedlings were harvested at 14 days after treatment. For the observation of root colonization by TG1, wheat seedling roots in each treatment and control were collected, thoroughly washed with sterile water and excised for the observation under the fluorescence microscopy.
4.3. Efficacy of GFP-TG1 in Controlling Fusarium Crown Rot Disease Under Salinity Stress
The sterile wheat seeds were soaked in (i) Fp spore suspension (5.0 × 10⁸ spore/mL) only for 12 h, (ii) Fp spore suspension for 12 h followed by WT-TG1 spore suspension (1 × 10⁸ spore/mL) for 12 h and (iii) Fp spore suspension for 12 h followed by GFP-TG1 spore suspension (1 × 10⁸ spore/mL) for 12 h, respectively. Thereafter, all the seeds in different treatments were air-dried and sown in pots that contained 0.54 kg of sterile soil at 0 or 100 mM NaCl concentrations. Following periodic irrigation, wheat seedlings were harvested at 14 days after treatment. Each treatment having three replicates (pots). The disease index was assessed using a 0–5 point scale (0, symptomless; 1, slightly necrotic; 2, moderately necrotic; 3, severely necrotic; 4, completely necrotic and 5, death), following the method of Zhang et al. [52].
4.4. Effect of TG1 on the Physiological and Molecular Parameters of Wheat Seedlings Growth and Disease Resistance Under Salinity and Fp Stresses
The sterile wheat seeds were soaked in WT-TG1 (1.0 × 10⁸ spore/mL) or Fp (5 × 10⁸ spore/mL) spore suspension for 12 h. For the combined (TG1+Fp), seeds were soaked in Fp spore suspension for 12 h followed by soaking in TG1 spore suspension for 12 h. The control seeds (CK) were soaked in sterile water for 12 h. Seeds in each treatment and control were air-dried overnight under aseptic conditions and exposed to artificial saline soil at 0 or 100 mM NaCl. The detailed treatments were grouped into eight (T1-T8), where T1 (CK+0 mM NaCl) represents wheat seeds treated with sterile water and subjected to no salt stress (0 mM NaCl), T2 (CK+100 mM NaCl) represents wheat seeds treated with sterile water and subjected to 100 mM NaCl stress, T3 (TG1+0 mM NaCl) represents wheat seeds treated with TG1 spore suspension and subjected to no salt stress (0 mM NaCl), T4 (TG1+100 mM NaCl) represents wheat seeds treated with TG1 spore suspension and subjected to 100 mM NaCl stress, T5 (TG1+Fp+0 mM NaCl) represents wheat seeds treated with TG1 and Fp spore suspension, and subjected to no salt stress (0 mM NaCl), T6 (TG1+Fp+100 mM NaCl) represents wheat seeds treated with TG1 and Fp spore suspension, and subjected to 100 mM NaCl stress, T7 (Fp+0 mM NaCl) represents wheat seeds treated with Fp spore suspension and subjected to no salt stress (0 mM NaCl), and T8 (Fp+100 mM NaCl) represents wheat seeds treated with Fp spore suspension and subjected to 100 mM NaCl stress. Each treatment having three replicates (pots), each pot containing 0.54 kg of air-dried sterile saline soil or non-saline soil. Following periodic irrigation, wheat seedlings were harvested at 7, 14, 21, and 28 days after treatment for physiological and molecular analysis.
4.5. Measurement of Phytohormones in TG1-Treated Wheat Seedlings Under Salinity and Fp Stresses
Fungi and sterile water-treated wheat seedlings subjected to 0 and 100 mM NaCl were harvested at different time points (7, 14, 21 and 28 days) into liquid nitrogen, freezed and grounded. 0.1 g of grounded leaves tissue was weighed into 1.5 mL microfuge tubes and extracted with 400 μL of 10% methanol containing 1% acetic acid. The supernatant was carefully removed and the pellet re-extracted with 400 μL of 10% methanol containing 1% acetic acid. Following a further 30 min incubation on ice, the extract was centrifuged and the supernatant obtained. The IAA, ABA, GA3, and JA contents determinations were performed by using high-pressure liquid chromatography (HPLC) (Agilent 1260 HPLC, Waters ACQUITY Arc UHPLC, Agilent Technologies Inc., Santa Clara, CA, USA) following the methods of Allasia et al. [53] and Hou et al. [54]. Briefly, HPLC was performed using (4.6 × 250 mm, 5 µm) columns at room temperature with a combination of 0.1% trifluoroacetic acid (A) and acetonitrile (B) at a flow rate of 1 mL/min. Fluorometric detection was measured at 254 nm. Individual standard compounds were prepared to determine the concentrations, and the HPLC-generated standard curve with linear equations was derived from peak areas for analysis. The content of ET was determined by Gas Chromatography using an Agilent 7080B gas chromatograph (Agilent 7080B, Santa Clara, CA, USA) under the following chromatographic conditions: PoraparkQ 15 m × 0.53 mm × 25 µm, injection port at 150 °C, split injection, ECD detector, detection temperature at 300 °C, column temperature at 45 °C, and column flow rate of 3.3 mL/min [55].
4.6. Extraction of Total RNA
The wheat seedlings leaves were collected at 7, 14, 21 and 28 days after treatments, and used for RNA extraction. The specific method for the samples RNA extraction was performed following the manufacturer’s protocol of the E.Z.N.A® plant RNA kit (OMEGA Bio-Tek, Norcross, GA, USA). The quantity and purity of the isolated RNA were analyzed using a Nanophotometer (IMPLEN, Schatzbogen, Germany). First-strand cDNA was synthesized using a Revert AidTM First Strand cDNA Synthesis Kit (Tiangen Biotechnology, Beijing, China) following the manufacturer’s protocol. The first-strand cDNA was used for genes expression analysis using qRT-PCR.
4.7. Analysis of Genes Expression by qRT-PCR
The transcript levels of ICS1 and PR1 genes were evaluated at four different time points (7, 14, 21, and 28 days), while 14 HSP70 genes transcript levels were evaluated at day 14. The transcription levels of NPR1, EDS, PAD4, SID2, LTP, WRKY, LOX, AOS, ACX, AOC, ACS2, ERF1, EIN2, and EIN3 genes were also analyzed at day 14 after treatment. Primers used in the experiments were designed using Primer Express 5.0 software, which amplifies target genes according to the sequences of candidate genes available in NCBI wheat EST [56]. Two wheat actin genes were used as endogenous controls (Table 2). qRT-PCR was performed using 2 × M5 HiPer Real-time PCR Supermix with Low Rox (Mei5 Biotechnology, Co., Ltd., Beijing, China). Three biological replicates were used for each gene. The 2−ΔΔCt method was used to measure the relative expression of the genes [57].
Table 2.
List of primes used in this study.
4.8. Statistical Analysis
IBM SPSS® Statistics 27 (IBM Corp., Armonk, NY, USA) was used for statistical analysis using one-way analysis of variance. Results were expressed as mean value ± standard error (SE). p-values less than 0.05 were considered to be significant using Duncan’s new multiple range test.
5. Conclusions
TG1 exhibited a mycoparasitic effect on Fp growth by coiling, conidial attachment, and parasitism, which was observed under fluorescent microscopy. TG1 pretreatment of wheat seedlings-initiated root surface colonization and decreased the disease index of Fusarium crown rot. Meanwhile, the TG1 pretreatment increased the IAA, GA3, JA, and ABA contents of wheat seedlings, whereas decreased the ET content under salinity and Fp Stresses. In addition, TG1 induced salinity tolerance and resistance of wheat seedlings to Fp infection by increasing the transcript levels of wheat salinity tolerance and resistance genes expression.
Author Contributions
Conceptualization, S.Z. and B.X.; methodology, S.B., N.Z. and E.L.; software, S.B.; validation, S.Z. and B.X.; formal analysis, S.B.; investigation, S.B.; resources, S.Z. and B.X.; data curation, S.B., N.Z. and E.L.; writing—original draft preparation, S.B.; writing—review and editing, S.B.; visualization, S.Z. and B.X.; supervision, S.Z. and B.X.; project administration, S.Z. and B.X.; funding acquisition, S.Z. and B.X. All authors have read and agreed to the published version of the manuscript.
Funding
This study was funded by the State Key Laboratory of Aridland Crop Science of China (GSCS-2023-02); Fuxi Outstanding Talent Cultivation Program, Gansu Agricultural University (Gaufx-03J03); Gansu Provincial Major Science and Technology Project (23ZDNA008); Technology Youth Talent Innovation Project of Lanzhou (2023-QN-171); Lanzhou Science and Technology Foundation Project (2021-1-39); National Natural Science Foundation of China (31860526); and Gansu Provincial Science Fund for Distinguished Young Scholars (18JR3RA161).
Institutional Review Board Statement
Not applicable.
Informed Consent Statement
Not applicable.
Data Availability Statement
The data presented in this study are available on request from the corresponding author.
Acknowledgments
The authors would like to show sincere gratitude to the research team members of Plant Protection, Gansu Agricultural University.
Conflicts of Interest
The authors declare no conflicts of interest.
References
- Konstantin, I.; Harm, B.; Arnold, B.K.; Alim, P.; Bas, K.; Luis, D.S. Global mapping of soil salinity change. Remote Sens. Environ. 2019, 231, 111260. [Google Scholar]
- Singh, B.K.; Delgado-Baquerizo, M.; Egidi, E.; Guirado, E.; Leach, J.E.; Liu, H.; Trivedi, P. Climate change impacts on plant pathogens, food security and paths forward. Nat. Rev. Microbiol. 2023, 21, 640–656. [Google Scholar] [CrossRef] [PubMed]
- Wahab, A.; Muhammad, M.; Munir, A.; Abdi, G.; Zaman, W.; Ayaz, A.; Khizar, C.; Reddy, S.P.P. Role of arbuscular mycorrhizal fungi in regulating growth, enhancing productivity, and potentially influencing ecosystems under abiotic and biotic stresses. Plants 2023, 12, 3102. [Google Scholar] [CrossRef] [PubMed]
- Mao, R.; Fitzpatrick, R.; Liu, X.; Davies, P. Chemical properties of selected soils from the North China Plain. In Regional Water and Soil Assessment for Managing Sustainable Agriculture in China and Australia; Canberra, Australia, 2002; Volume 84, pp. 173–186. [Google Scholar]
- Li, J.G.; Pu, L.J.; Han, M.F.; Zhu, M.; Zhang, R.S.; Xiang, Y.Z. Soil salinization research in China: Advances and prospects. J. Geogr. Sci. 2014, 24, 943–960. [Google Scholar] [CrossRef]
- Saddiq, M.S.; Iqbal, S.; Hafeez, M.B.; Amir, M.H.I.; Ali, R.; Fatima, E.M.; Baloch, H.; Jahanzaib; Pasqualina, W.; Ciarmiello, L.F. Effect of salinity stress on physiological changes in winter and spring wheat. Agronomy 2021, 11, 1193. [Google Scholar] [CrossRef]
- Alahmad, S.; Simpfendorfer, S.; Bentley, A.R.; Hickey, L.T. Crown rot of wheat in Australia: Fusarium pseudograminearum taxonomy, population biology and disease management. Australas. Plant Pathol. 2018, 47, 285–299. [Google Scholar] [CrossRef]
- Kazan, K.; Gardiner, D.M. Fusarium crown rot caused by Fusarium pseudograminearum in cereal crops: Recent progress and future prospects. Mol. Plant Pathol. 2018, 19, 1547–1562. [Google Scholar] [CrossRef]
- Boamah, S.; Zhang, S.W.; Xu, B.L.; Li, T.; Calderón-Urrea, A. Trichoderma longibrachiatum (TG1) enhances wheat seedlings tolerance to salt stress and resistance to Fusarium pseudograminearum. Front. Plant Sci. 2021, 12, 741231. [Google Scholar] [CrossRef]
- Firoozeh, F.; Morteza, Z. Beneficial effects of arbuscular mycorrhizal fungi on wheat (Triticum aestivum L.) nutritional status and tolerance indices under soil salinity stress. J. Plant Nutr. 2021, 45, 185–201. [Google Scholar]
- Argyris, J.; Van Sanford, D.; TeKrony, D. Fusarium graminearum infection during wheat seed development and its effect on seed quality. Crop Sci. 2003, 43, 1782–1788. [Google Scholar] [CrossRef]
- Sachdev, S.; Ansari, S.A.; Ansari, M.I.; Fujita, M.; Hasanuzzaman, M. Abiotic stress and reactive oxygen species: Generation, signaling, and defense mechanisms. Antioxidants 2021, 10, 277. [Google Scholar] [CrossRef] [PubMed]
- Timperio, A.M.; Egidi, M.G.; Zolla, L. Proteomics applied on plant abiotic stresses: Role of heat shock proteins (HSP). J. Proteom. 2008, 71, 391–411. [Google Scholar] [CrossRef]
- Lee, K.W.; Rahman, M.A.; Choi, G.J.; Kim, K.Y.; Ji, H.C.; Hwang, T.Y.; Lee, S.H. Expression of small heat shock protein 23 enhanced heat stress tolerance in transgenic Alfalfa plants. J. Anim. Plant Sci. 2017, 27, 1238. [Google Scholar]
- Wang, M.C.; Peng, Z.Y.; Li, C.L.; Li, F.; Liu, C.; Xia, G.M. Proteomic analysis on a high salt tolerance introgression strain of Triticum aestivum/Thinopyrum ponticum. Proteomics 2008, 8, 1470–1489. [Google Scholar] [CrossRef]
- Jung, K.H.; Gho, H.J.; Nguyen, M.X.; Kim, S.R.; An, G. Genome-wide expression analysis of HSP70 family genes in rice and identification of a cytosolic HSP70 gene highly induced under heat stress. Funct. Integr. Genom. 2013, 13, 391–402. [Google Scholar] [CrossRef]
- Kaya, C.; Ugurlar, F.; Ashraf, M.; Ahmad, P. Salicylic acid interacts with other plant growth regulators and signal molecules in response to stressful environments in plants. Plant Physiol. Biochem. 2023, 196, 431–443. [Google Scholar] [CrossRef]
- Ikram, M.; Ali, N.; Jan, G.; Iqbal, A.; Hamayun, M.; Jan, F.G.; Hussain, A.; Lee, I.J. Trichoderma reesei improved the nutrition status of wheat crop under salt stress. J. Plant Interact. 2019, 14, 590–602. [Google Scholar] [CrossRef]
- Zamin Shaheed, S.; Roomana, Y. Physiological responses of crop plants against Trichoderma harzianum in saline environment. Acta Bot. Croat. 2017, 76, 154–162. [Google Scholar]
- Rodas-Junco, B.A.; Nic-Can, G.I.; Muñoz-Sánchez, A.; Hernández-Sotomayor, S.M.T. Phospholipid signaling is a component of the salicylic acid response in plant cell suspension cultures. Int. J. Mol. Sci. 2020, 21, 5285. [Google Scholar] [CrossRef]
- Dempsey, D.M.A.; Vlot, A.C.; Wildermuth, M.C.; Klessig, D.F. Salicylic acid biosynthesis and metabolism. Arab. Book/Am. Soc. Plant Biol. 2011, 9, e0156. [Google Scholar] [CrossRef]
- Boamah, S.; Zhang, S.W.; Xu, B.L.; Li, T.; Calderón-Urrea, A.; Tiika, R.J. Trichoderma longibrachiatum TG1 increases endogenous salicylic acid content and antioxidants activity in wheat seedlings under salinity stress. PeerJ 2022, 10, e12923. [Google Scholar] [CrossRef] [PubMed]
- Hasan, R.; Lv, B.; Uddin, M.J.; Chen, Y.Y.; Fan, L.; Sun, Z.B.; Sun, M.H.; Li, S.D. Monitoring mycoparasitism of Clonostachys rosea against Botrytis cinerea using GFP. J. Fungi 2022, 8, 567. [Google Scholar] [CrossRef] [PubMed]
- Sunita, G. Phosphate dissolving fungi: Mechanism and application in alleviation of salt stress in wheat. Microbiol. Res. 2016, 193, 94–102. [Google Scholar] [CrossRef] [PubMed]
- Brenda, S.M.; Fernando, D.; Alejandro, M.G.; Francisco, J.G.; Mila, S. Plant growth promotion and biocontrol of Pythium ultimum by saline tolerant Trichoderma isolates under salinity stress. Int. J. Environ. Res. Public Health 2019, 16, 2053. [Google Scholar] [CrossRef]
- Ruano-Rosa, D.; Prieto, P.; Rincón, A.M.; Gómez-Rodríguez, M.V.; Valderrama, R.; Barroso, J.B.; Mercado-Blanco, J. Fate of Trichoderma harzianum in the olive rhizosphere: Time course of the root colonization process and interaction with the fungal pathogen Verticillium dahliae. Bio-Control 2016, 61, 269–282. [Google Scholar] [CrossRef]
- Khare, E.; Kumar, S.; Kim, K. Role of peptaibols and lytic enzymes of Trichoderma cerinum Gur1 in biocontrol of Fusraium oxysporum and chickpea wilt. Environ. Sustain. 2018, 1, 39–47. [Google Scholar] [CrossRef]
- Zhang, F.G.; Zhu, Z.; Yang, X.M.; Ran, W.; Shen, Q.R. Trichoderma harzianum T-E5 significantly affects cucumber root exudates and fungal community in the cucumber rhizosphere. Appl. Soil Ecol. 2013, 72, 41–48. [Google Scholar] [CrossRef]
- Zhao, L.; Zhang, Y.Q. Effects of phosphate solubilization and phytohormone production of Trichoderma asperellum Q1 on promoting cucumber growth under salt stress. J. Integr. Agric. 2015, 8, 1588–1597. [Google Scholar] [CrossRef]
- Khan, N.A.; Ferrante, A.; Khan, M.I.R.; Poor, P. Ethylene: A key regulatory molecule in plants. Front. Plant Sci. 2017, 8, 1782. [Google Scholar] [CrossRef]
- Ali, S.; Ganai, B.A.; Kamili, A.N.; Bhat, A.A.; Mir, Z.A.; Bhat, J.A.; Tyagi, A.; Islam, S.T.; Mushtaq, M.; Yadav, P.; et al. Pathogenesis-related proteins and peptides as promising tools for engineering plants with multiple stress tolerance. Microbiol. Res. 2018, 212, 29–37. [Google Scholar] [CrossRef]
- Kubienova, L.; Sedlářová, M.; Vítečková-Wünschová, A.; Piterkova, J.; Luhova, L.; Mieslerova, B.; Lebeda, A.; Navratil, M.; Petřivalský, M. Effect of extreme temperatures on powdery mildew development and Hsp70 induction in tomato and wild Solanum spp. Plant Prot. Sci. 2013, 49, S41–S54. [Google Scholar] [CrossRef]
- ul Haq, S.; Khan, A.; Ali, M.; Khattak, A.M.; Gai, W.X.; Zhang, H.X.; Wei, A.M.; Gong, Z.H. Heat shock proteins: Dynamic biomolecules to counter plant biotic and abiotic stresses. Int. J. Mol. Sci. 2019, 20, 5321. [Google Scholar] [CrossRef] [PubMed]
- Ngara, R.; Ndimba, B.K. Understanding the complex nature of salinity and drought-stress response in cereals using proteomics technologies. Proteomics 2014, 14, 611–621. [Google Scholar] [CrossRef] [PubMed]
- Sobhanian, H.; Aghaei, K.; Komatsu, S. Changes in the plant proteome resulting from salt stress: Toward the creation of salt-tolerant crops. J. Proteom. 2011, 74, 1323–1337. [Google Scholar] [CrossRef]
- Manaa, A.; Ben Ahmed, H.; Valot, B.; Bouchet, J.P.; Aschi-Smiti, S.; Causse, M.; Faurobert, M. Salt and genotype impact on plant physiology and root proteome variations in tomato. J. Exp. Bot. 2011, 62, 2797–2813. [Google Scholar] [CrossRef]
- Alfano, G.; Lewis Ivey, M.L.; Cakir, C.; Bos, J.I.B.; Miller, S.A.; Madden, L.V.; Kamoun, S.; Hoitink, H.A.J. Systemic modulation of gene expression in tomato by Trichoderma hamatum 382. Phytopathology 2007, 97, 429–437. [Google Scholar] [CrossRef]
- Rubio, M.B.; Quijada, N.M.; Pérez, E.; Domínguez, S.; Monte, E.; Hermosa, R. Identifying beneficial qualities of Trichoderma parareesei for plants. Appl. Environ. Microbiol. 2014, 80, 1864–1873. [Google Scholar] [CrossRef]
- Lei, G.; Shen, M.; Li, Z.G.; Zhang, B.; Duan, K.X.; Wang, N.; Cao, Y.R.; Zhang, W.K.; Ma, B.; Ling, H.Q.; et al. EIN2 regulates salt stress response and interacts with a MA3 domain containing protein ECIP1 in Arabidopsis. Plant Cell Environ. 2011, 34, 1678–1692. [Google Scholar] [CrossRef]
- Cheng, M.C.; Liao, P.M.; Kuo, W.W.; Lin, T.P. The Arabidopsis ethylene response factor 1 regulates abiotic stress-responsive gene expression by binding to different cis-acting elements in response to different stress signals. Plant Physiol. 2013, 162, 1566–1582. [Google Scholar] [CrossRef]
- Peng, J.Y.; Li, Z.H.; Wen, X.; Li, W.Y.; Shi, H.; Yang, L.S.; Zhu, H.Q.; Guo, H.W. Salt-induced stabilization of EIN3/EIL1 confers salinity tolerance by deterring ROS accumulation in Arabidopsis. PLoS Genet. 2014, 10, e1004664. [Google Scholar] [CrossRef]
- Berrocal-Lobo, M.; Molina, A.; Solano, R. Constitutive expression of ethylene-response-factor 1 in Arabidopsis confers resistance to several necrotrophic fungi. Plant J. 2002, 29, 23–32. [Google Scholar] [CrossRef] [PubMed]
- Solano, R.; Stepanova, A.; Chao, Q.M.; Ecker, J.R. Nuclear events in ethylene signaling: A transcriptional cascade mediated by ethylene-insensitive 3 and ethylene-response-factor 1. Genes Develop. 1998, 12, 3703–3714. [Google Scholar] [CrossRef] [PubMed]
- Xu, Z.S.; Xia, L.Q.; Chen, M.; Cheng, X.G.; Zhang, R.Y.; Li, L.C.; Zhao, Y.X.; Lu, Y.; Ni, Z.Y.; Liu, L.; et al. Isolation and molecular characterization of the Triticum aestivum L. ethylene-responsive factor 1 (TaERF1) that increases multiple stress tolerance. Plant Mol. Biol. 2007, 65, 719–732. [Google Scholar] [CrossRef]
- Rubio, M.B.; Hermosa, R.; Vicente, R.; Gómez-Acosta, F.A.; Morcuende, R.; Monte, E.; Bettiol, W. The combination of Trichoderma harzianum and chemical fertilization leads to the deregulation of phytohormone networking, preventing the adaptive responses of tomato plants to salt stress. Front. Plant Sci. 2017, 8, 294. [Google Scholar] [CrossRef]
- Zhao, P.; Zhang, J.; Chen, S.Y.; Zhang, Z.S.; Wan, G.Y.; Mao, J.L.; Wang, Z.; Tan, S.T.; Xiang, C.B. ERF1 inhibits lateral root emergence by promoting local auxin accumulation and repressing ARF7 expression. Cell Rep. 2023, 42, 112565. [Google Scholar] [CrossRef]
- Wang, X.M.; Tian, Z.Y.; Xi, Y.; Guo, Y.Q. Identification of endophytic fungi with ACC deaminase-producing isolated from halophyte Kosteletzkya virginica. Plant Signal. Behav. 2022, 17, 2152224. [Google Scholar] [CrossRef]
- Chen, H.M.; Xue, L.; Chintamanani, S.; Germain, H.; Lin, H.Q.; Cui, H.T.; Cai, R.; Zuo, J.R.; Tang, X.Y.; Li, X.; et al. Ethylene insensitive3 and ethylene insensitive3-like1 repress salicylic acid induction deficient2 expression to negatively regulate plant innate immunity in Arabidopsis. Plant Cell 2009, 21, 2527–2540. [Google Scholar] [CrossRef]
- Rivera-Méndez, W.; Obregón, M.; Moran-Diez, M.E.; Hermosa, R.; Monte, E. Trichoderma asperellum biocontrol activity and induction of systemic defenses against Sclerotium cepivorum in onion plants under tropical climate conditions. Bio-Control 2020, 141, 104145. [Google Scholar] [CrossRef]
- Zhang, S.W.; Gan, Y.T.; Xu, B.L.; Xue, Y.Y. The parasitic and lethal effects of Trichoderma longibrachiatum against Heterodera avenae. Bio-Control 2014, 72, 1–8. [Google Scholar] [CrossRef]
- Yassin, S.M.; Aly, A.Z.; Abdel-Kader, D.A.; Morsy, K.M.; Atallah, O.O. Antagonistic potential of rhizospheric biocontrol agents against soybean root rot-wilt disease complex syndrome. J. Agric. Res. 2019, 46, 1395–1418. [Google Scholar] [CrossRef]
- Zhang, X.X.; Sun, H.Y.; Shen, C.M.; Li, W.; Yu, H.S.; Chen, H.G. Survey of Fusarium spp. causing wheat crown rot in major winter wheat growing regions of China. Plant Dis. 2015, 99, 1610–1615. [Google Scholar] [CrossRef]
- Allasia, V.; Industri, B.; Ponchet, M.; Quentin, M.; Favery, B.; Keller, H. Quantification of salicylic acid (SA) and SA-glucosides in Arabidopsis thaliana. J. Bio-Protoc. 2018, 8, e2844. [Google Scholar] [CrossRef]
- Hou, M.Y.; Hu, W.Z.; Hao, K.X.; Xiu, Z.L.; Zhang, X.F.; Liu, S.S. Enhancing the potential exploitation of Salvia miltiorrhiza Bunge: Extraction, enrichment and hplc-dad analysis of bioactive phenolics from its leaves. Ind. Crops Prod. 2020, 158, 113019. [Google Scholar] [CrossRef]
- Xie, L.H.; Li, L.L.; Xie, J.H.; Wang, J.B.; Anwar, S.; Du, C.L.; Zhou, Y.J. Substituting inorganic fertilizers with organic amendment reduced nitrous oxide emissions by affecting nitrifiers’ microbial community. Land 2022, 11, 1702. [Google Scholar] [CrossRef]
- Yang, Y.S.; Li, S.M.; Zhang, K.P.; Dong, Z.Y.; Li, Y.W.; An, X.L.; Chen, J.; Chen, Q.F.; Jiao, Z.; Liu, X. Efficient isolation of ion beam-induced mutants for homoeologous loci in common wheat and comparison of the contributions of Glu-1 loci to gluten functionality. Theor. Appl. Genet. 2014, 127, 359–372. [Google Scholar] [CrossRef]
- Livak, K.J.; Schmittgen, T.D. Analysis of relative gene expression data using real-time quantitative PCR and the 2− ΔΔCT method. Methods 2001, 25, 402–408. [Google Scholar] [CrossRef]


Disclaimer/Publisher’s Note: The statements, opinions and data contained in all publications are solely those of the individual author(s) and contributor(s) and not of MDPI and/or the editor(s). MDPI and/or the editor(s) disclaim responsibility for any injury to people or property resulting from any ideas, methods, instructions or products referred to in the content. |
© 2025 by the authors. Licensee MDPI, Basel, Switzerland. This article is an open access article distributed under the terms and conditions of the Creative Commons Attribution (CC BY) license (https://creativecommons.org/licenses/by/4.0/).