
Preparation and Characterization of a Glutathione-Responsive Doxorubicin Prodrug Modified by 2-Nitrobenzenesulfonamide Group—Its Selective Cytotoxicity Toward Cells with Enhanced Glutathione Production

Abstract
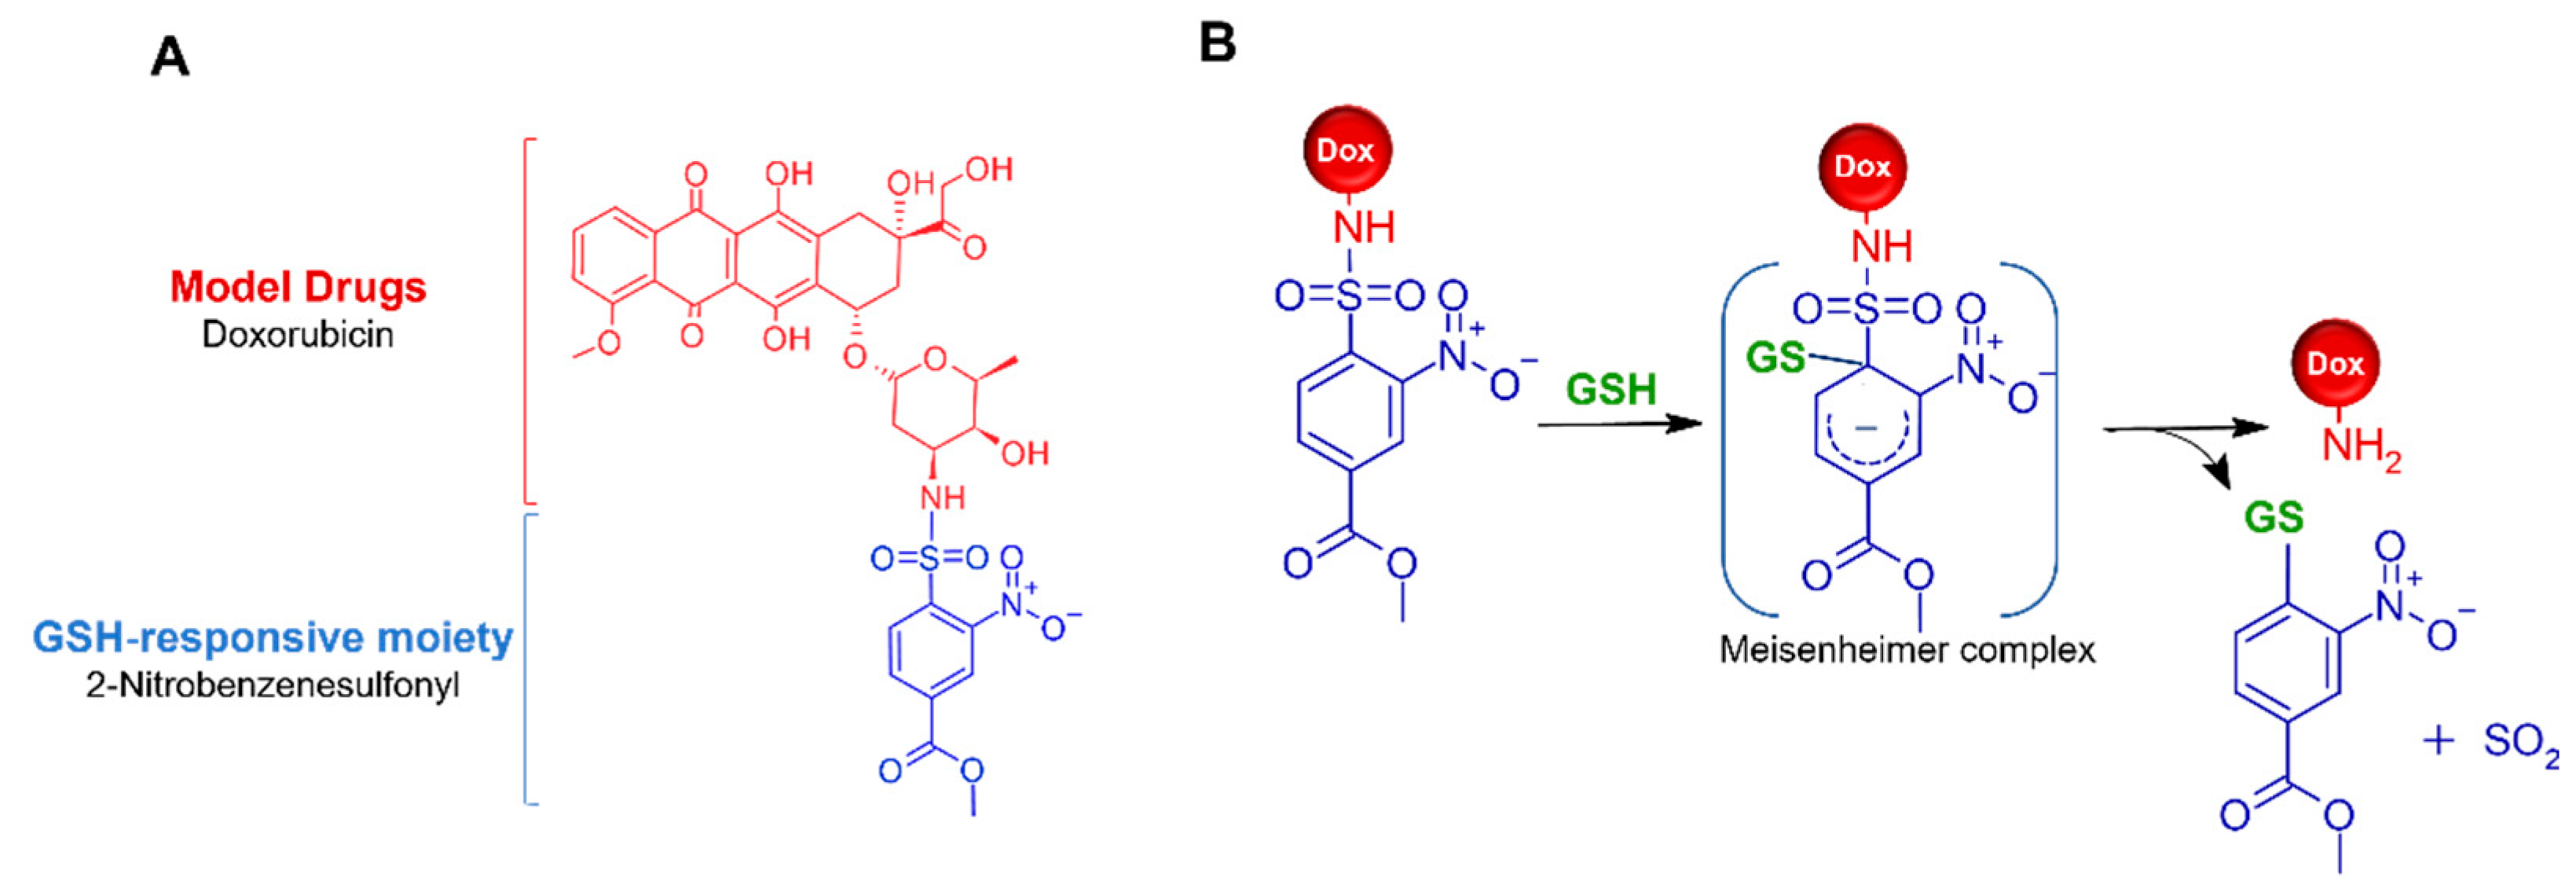
1. Introduction
2. Results and Discussion
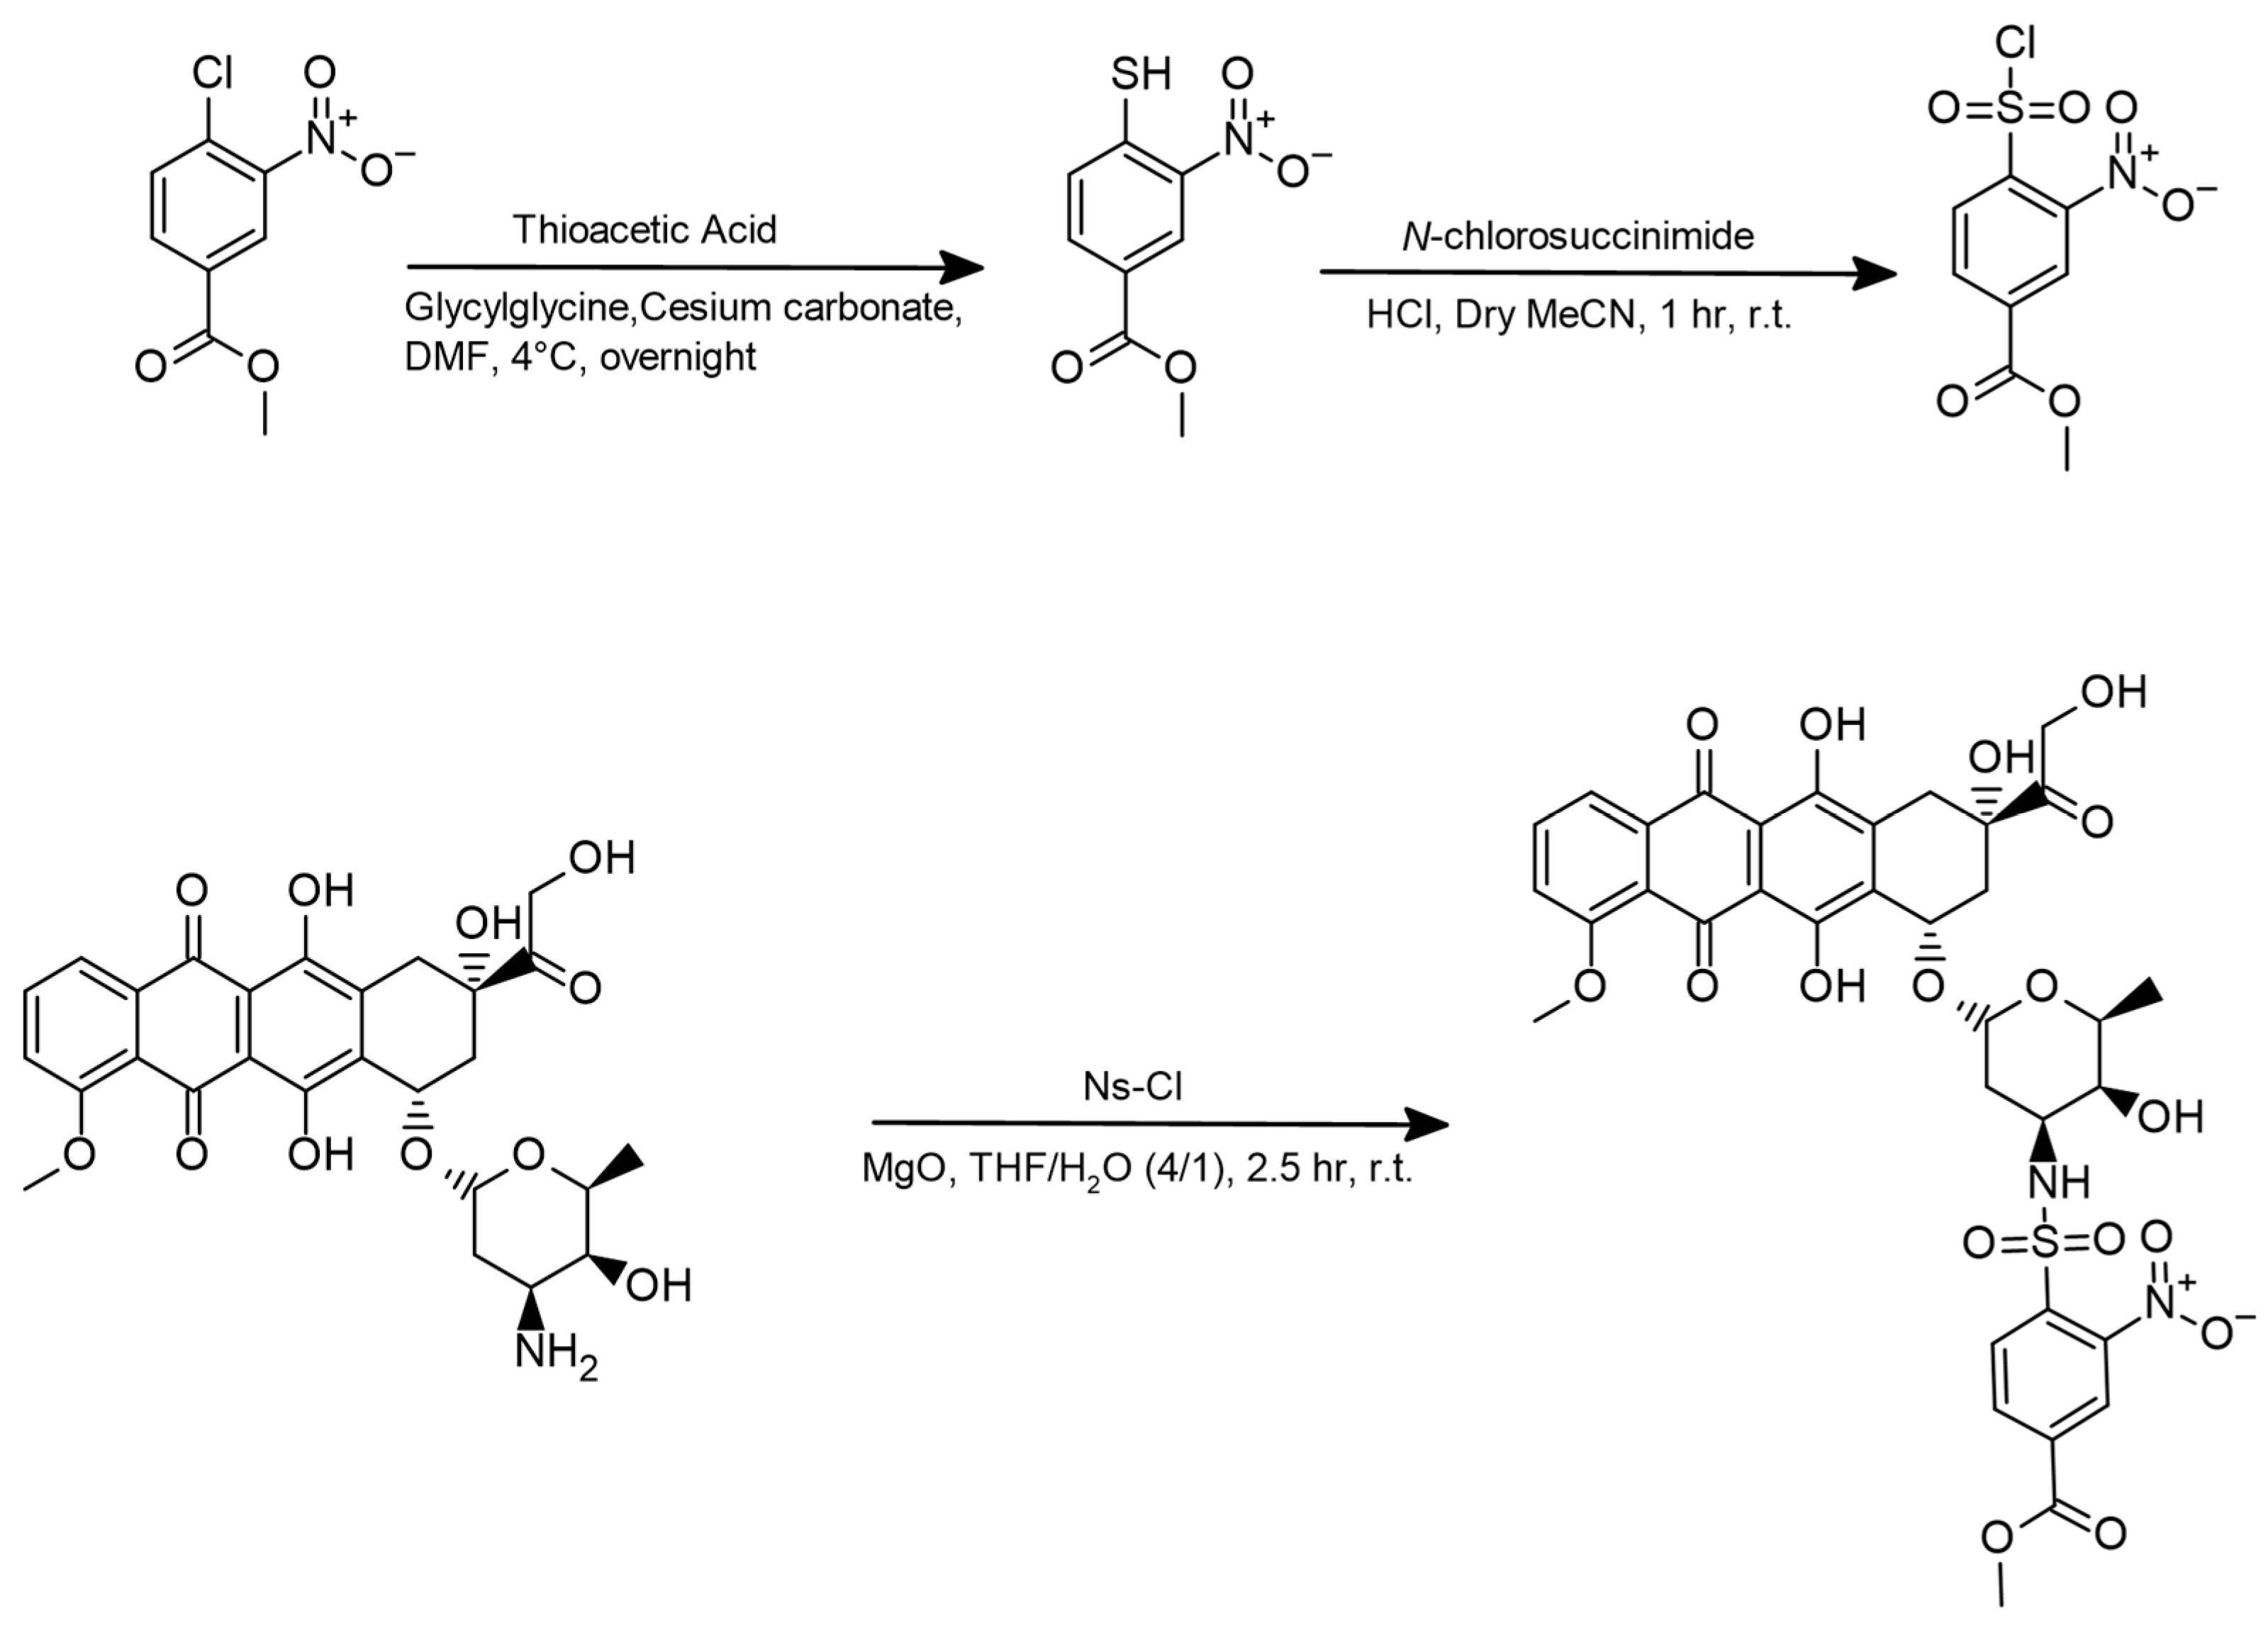
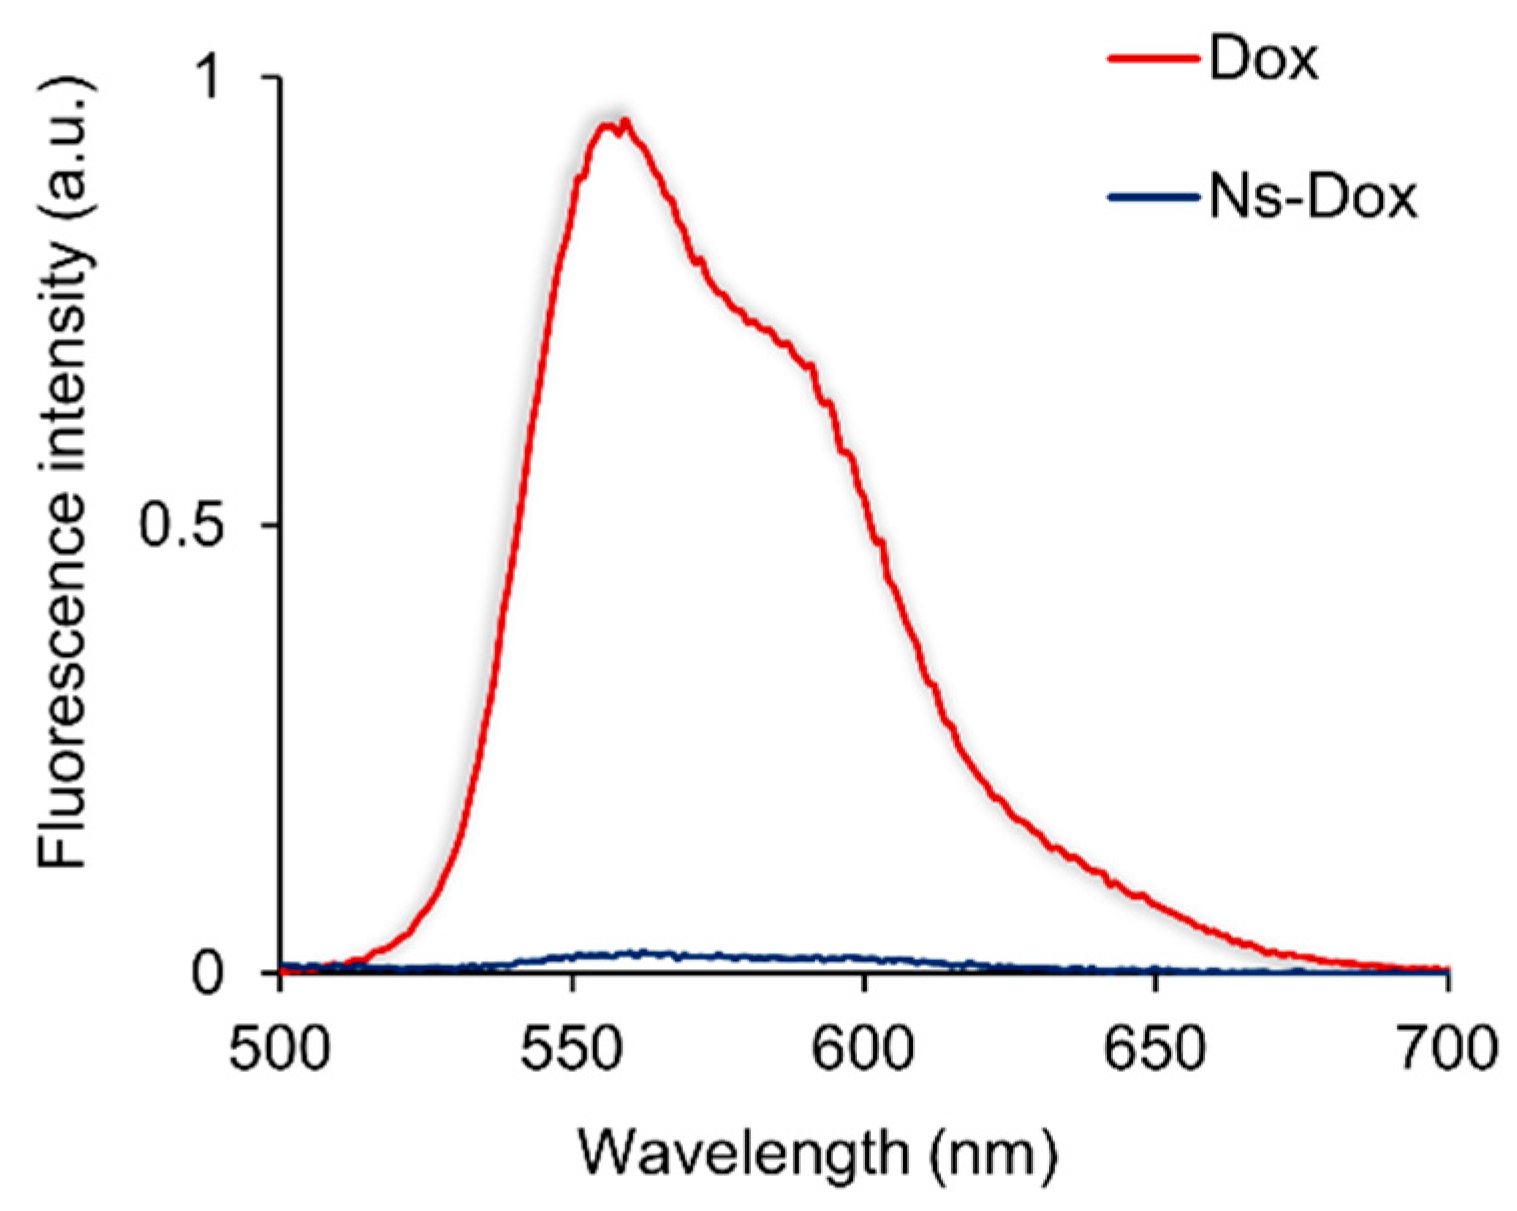
2.1. Synthesis of Ns-Dox
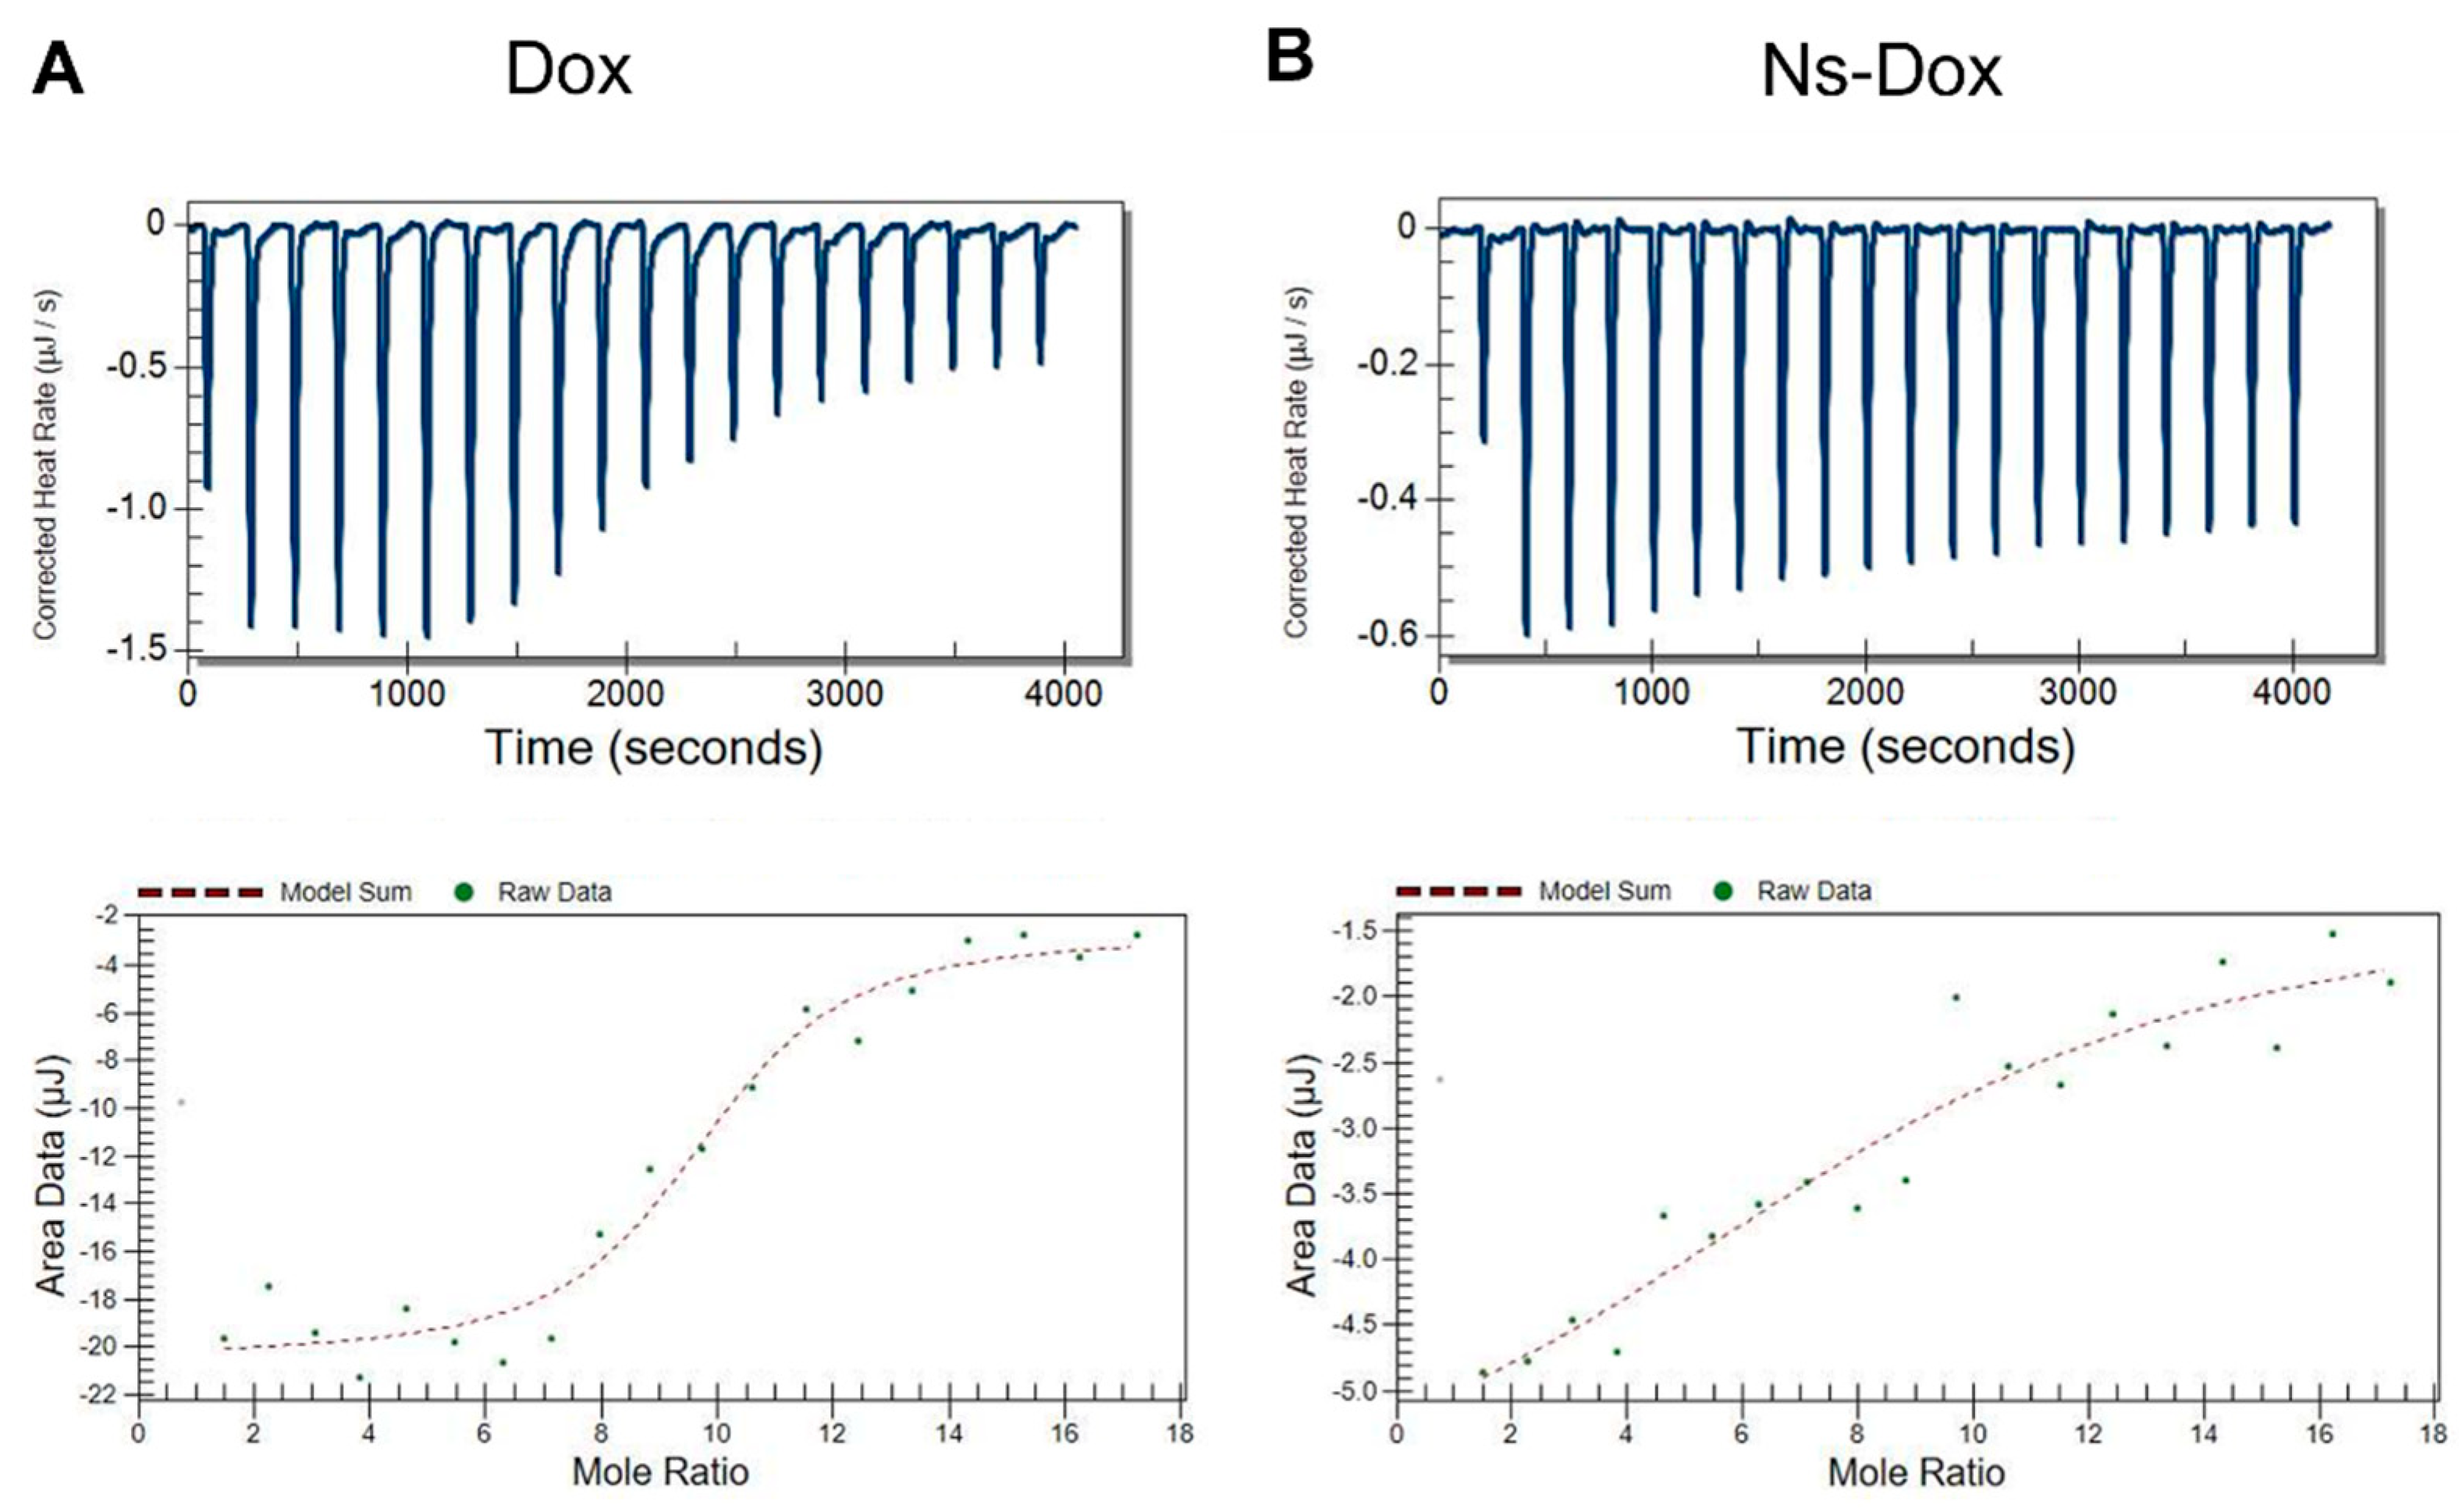
2.2. Molecular Interaction of Ns-Dox and Dox with DNA
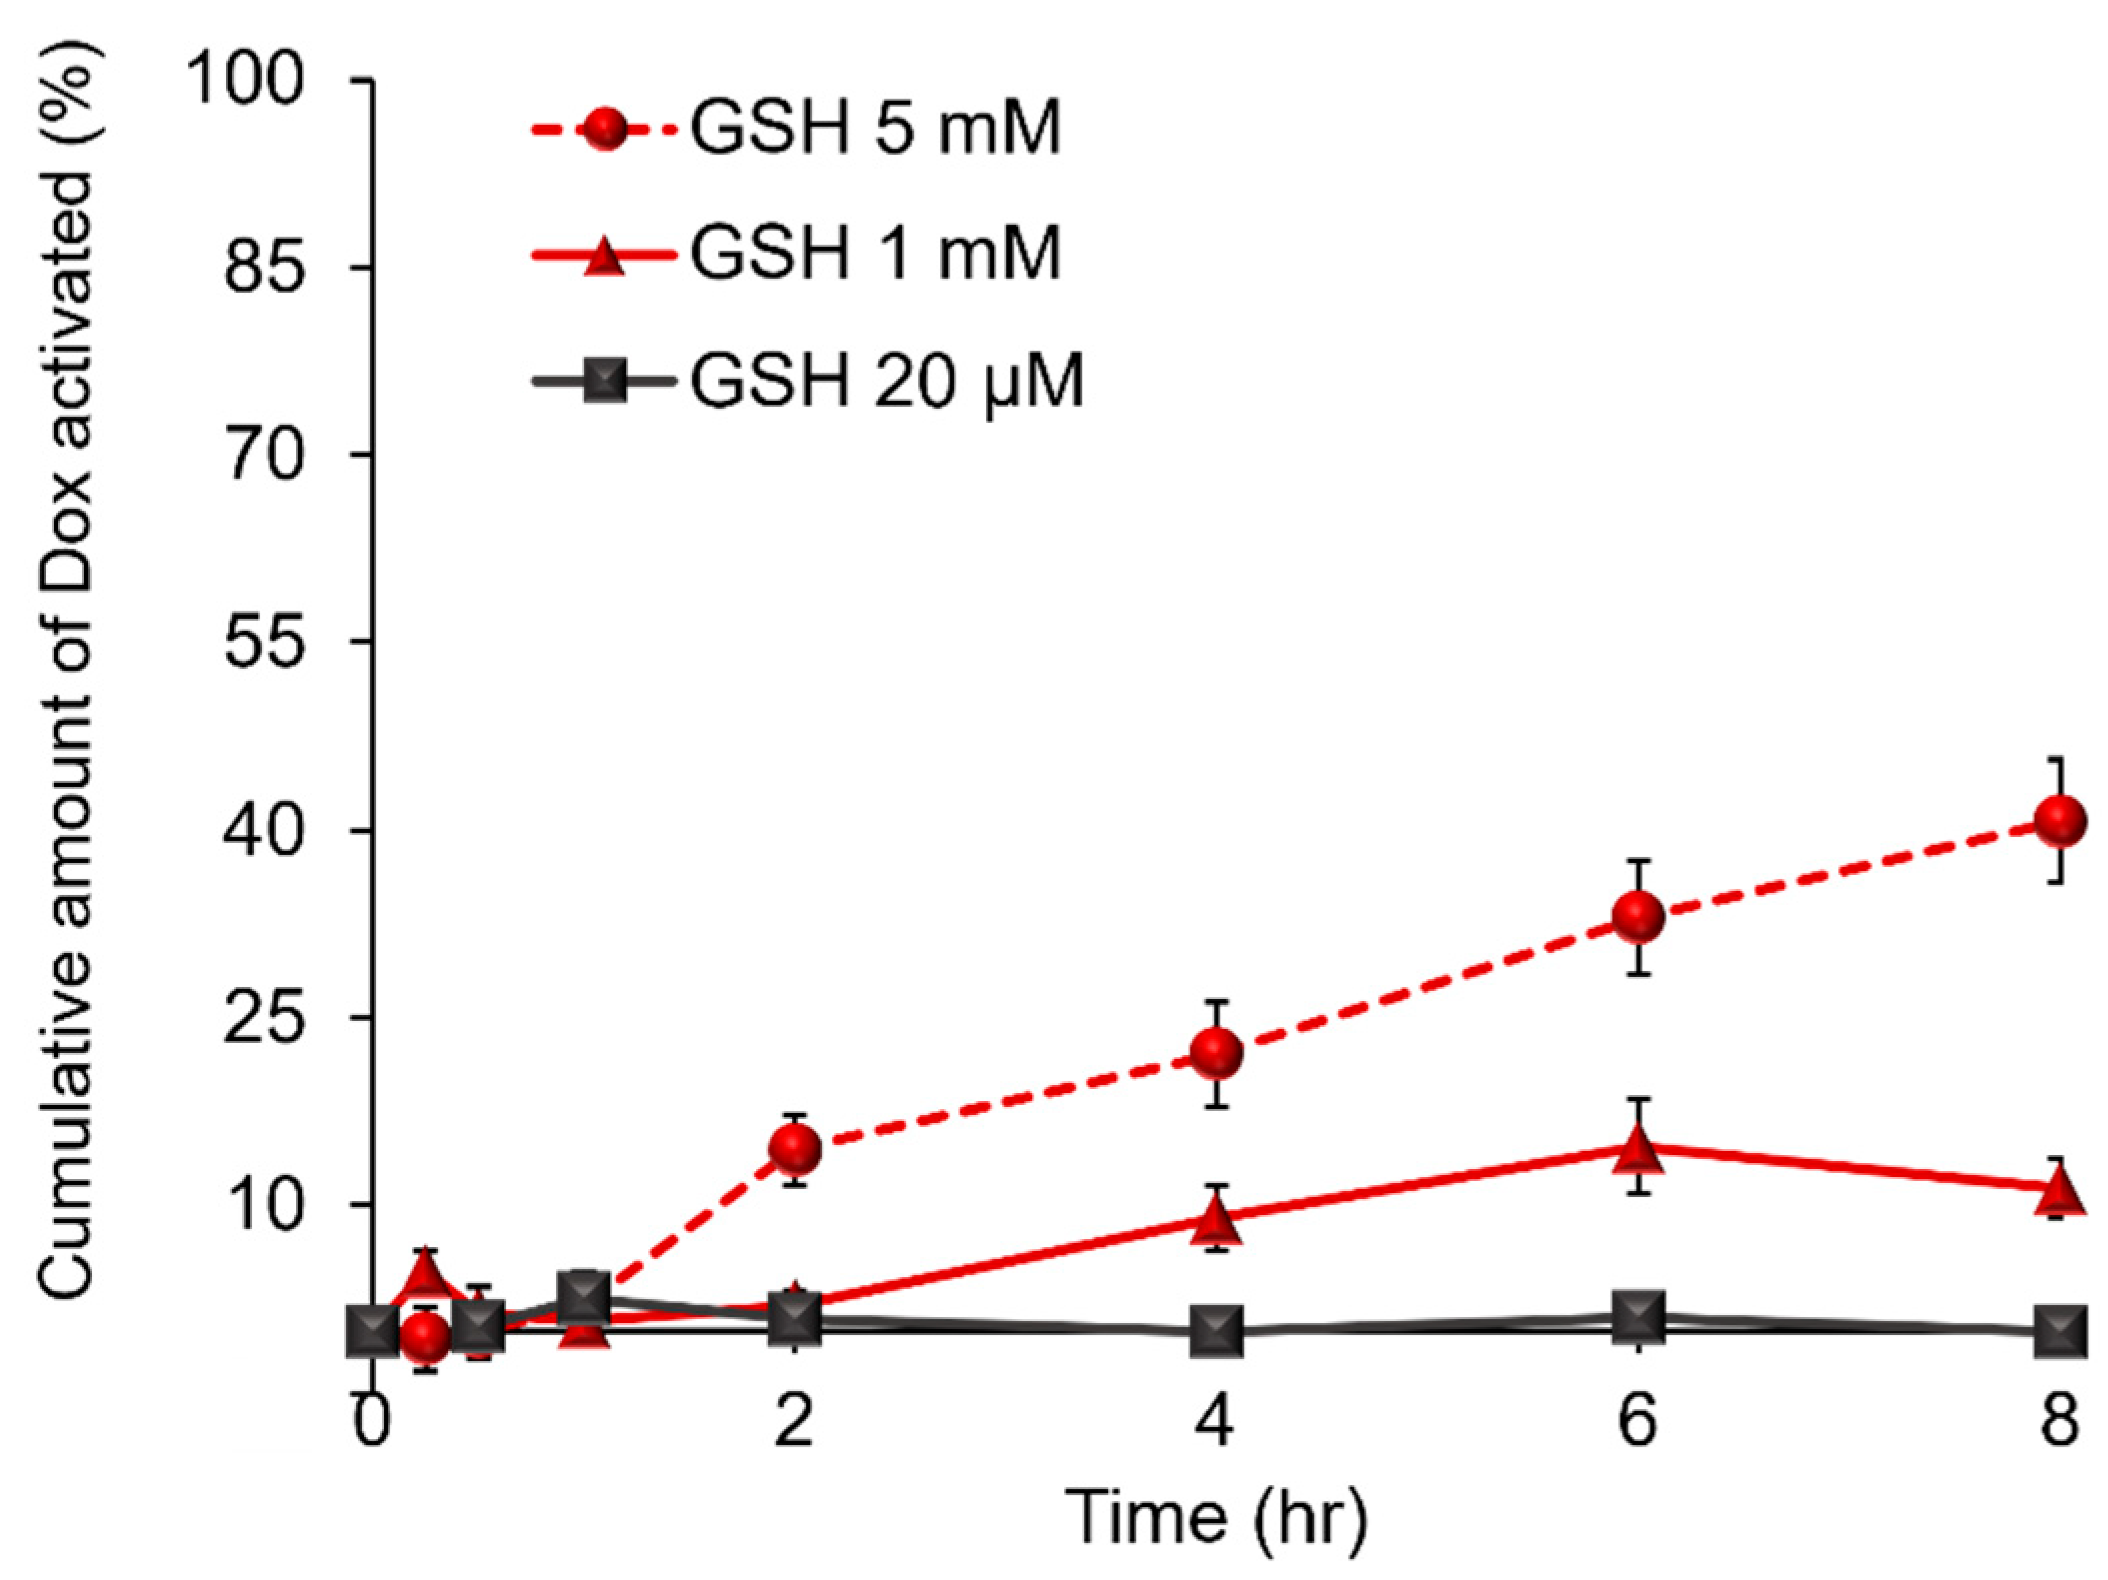
2.3. Evaluation of Ns-Dox Activation of the GSH Response in an In Vitro Non-Cellular System
2.4. Determination of CD44v and xCT Expression Levels and GSH Concentrations in Cells Utilized for the Evaluation of Ns-Dox Activation
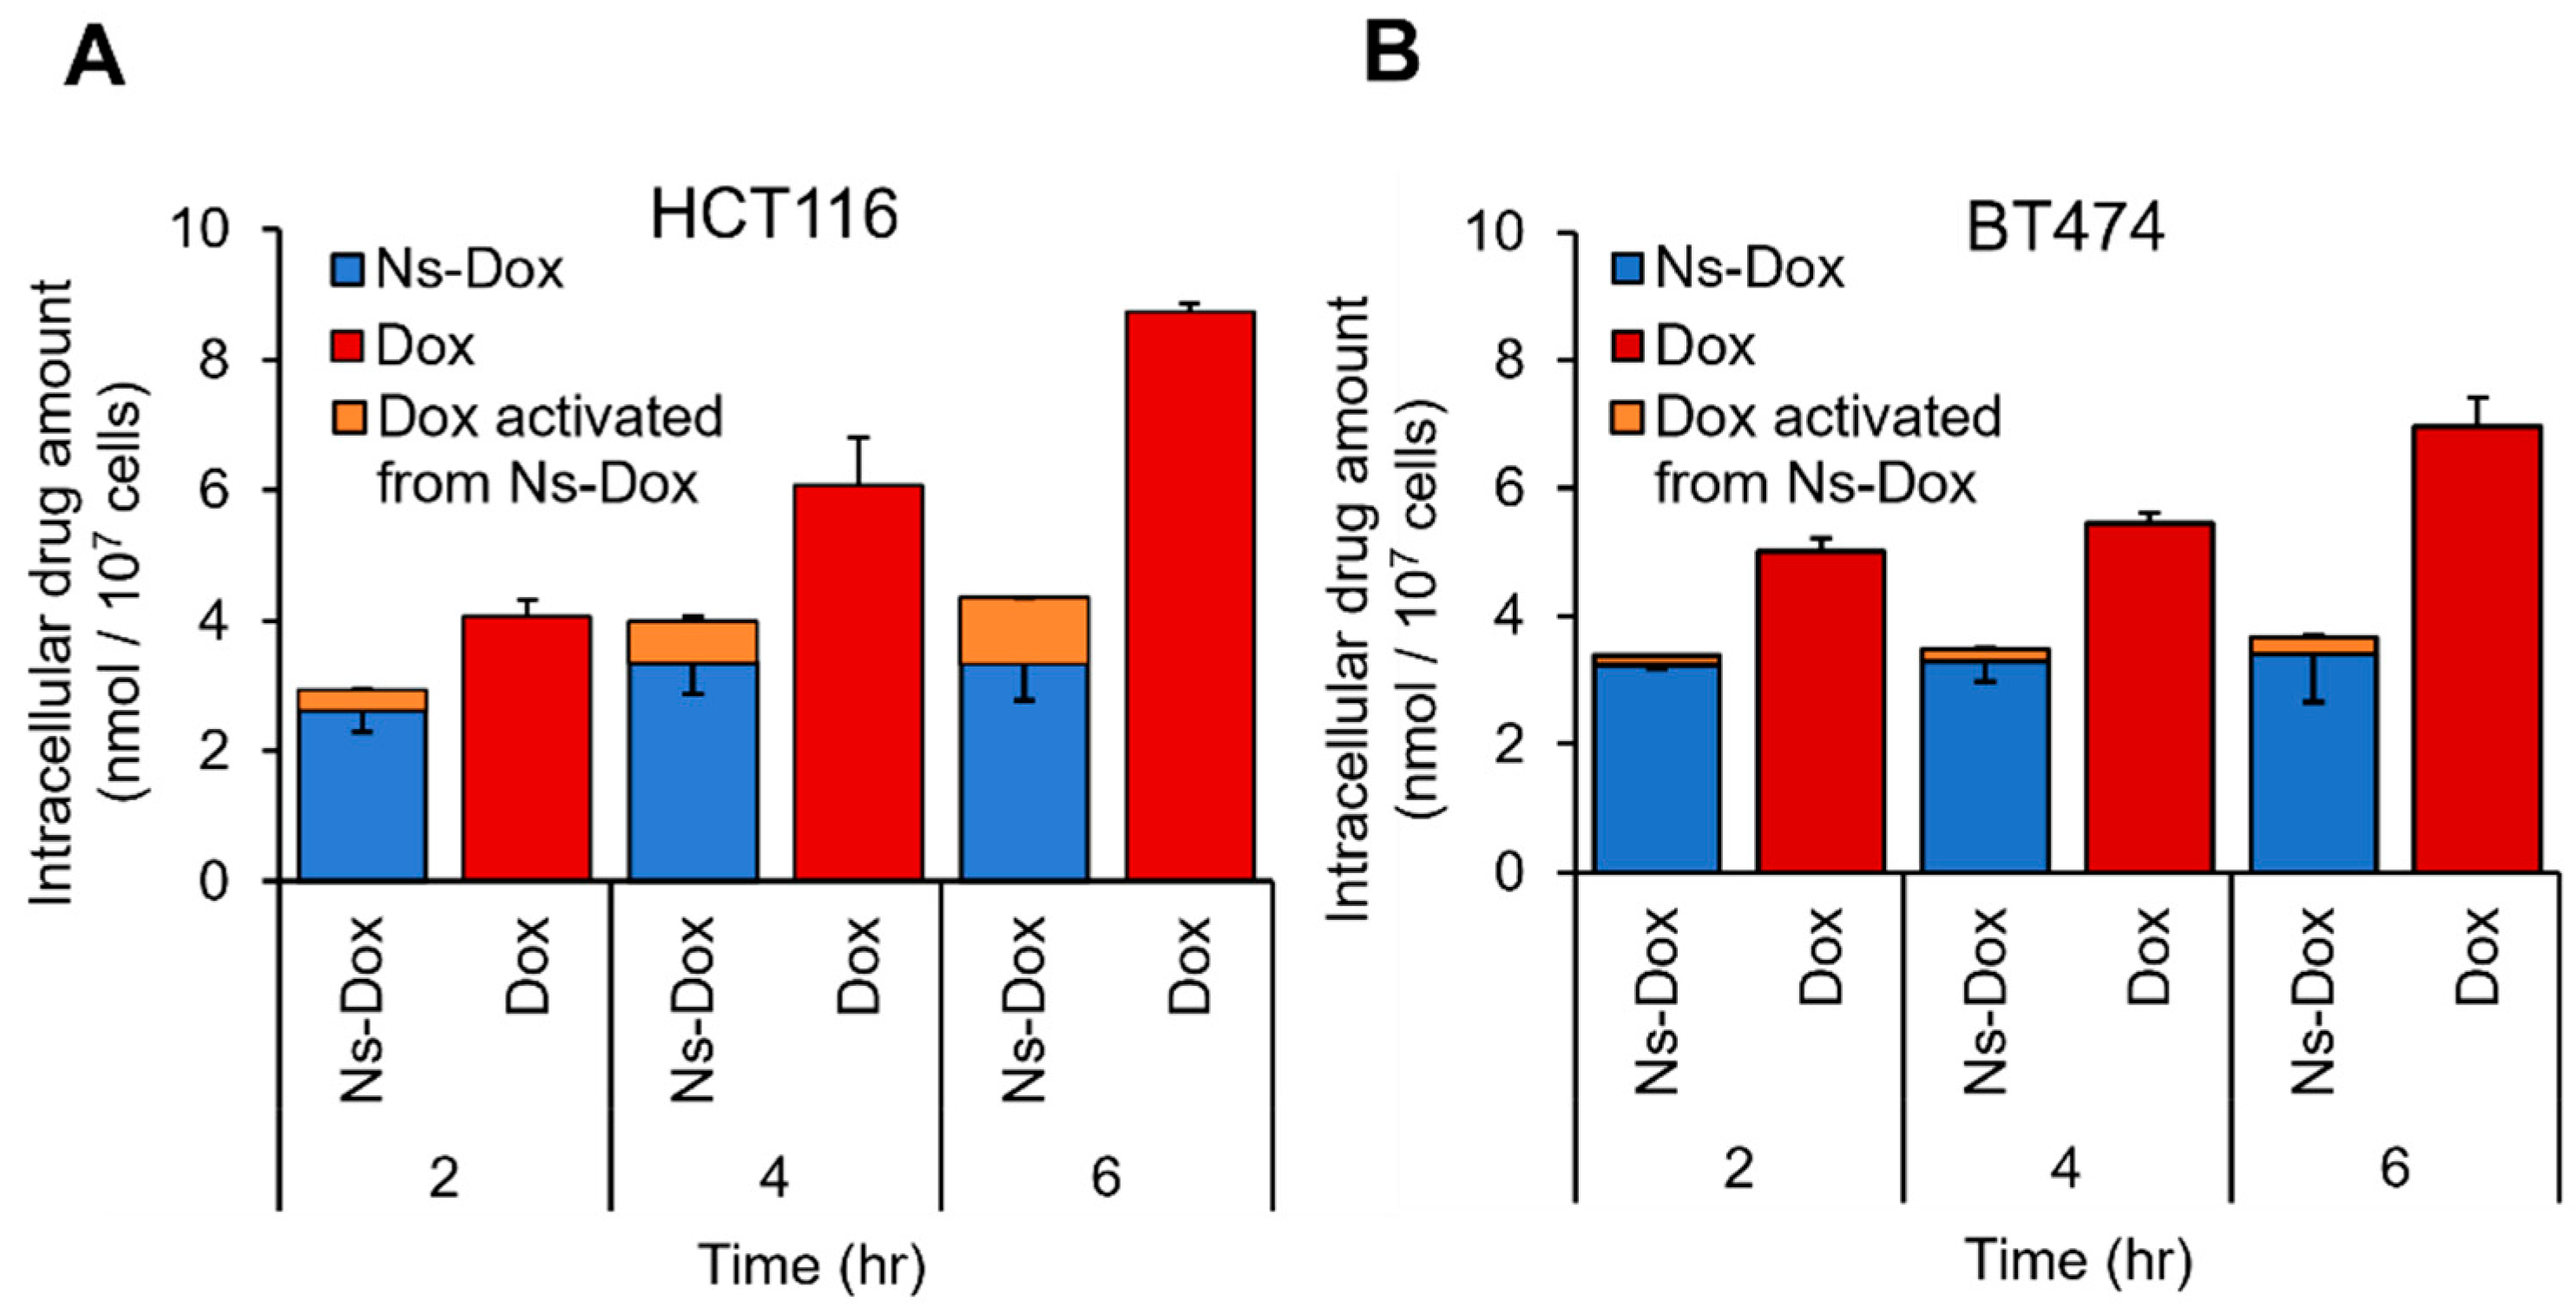
2.5. Quantitative Evaluation of the Cellular Uptake of Ns-Dox and the Activation of GSH Response In Vitro
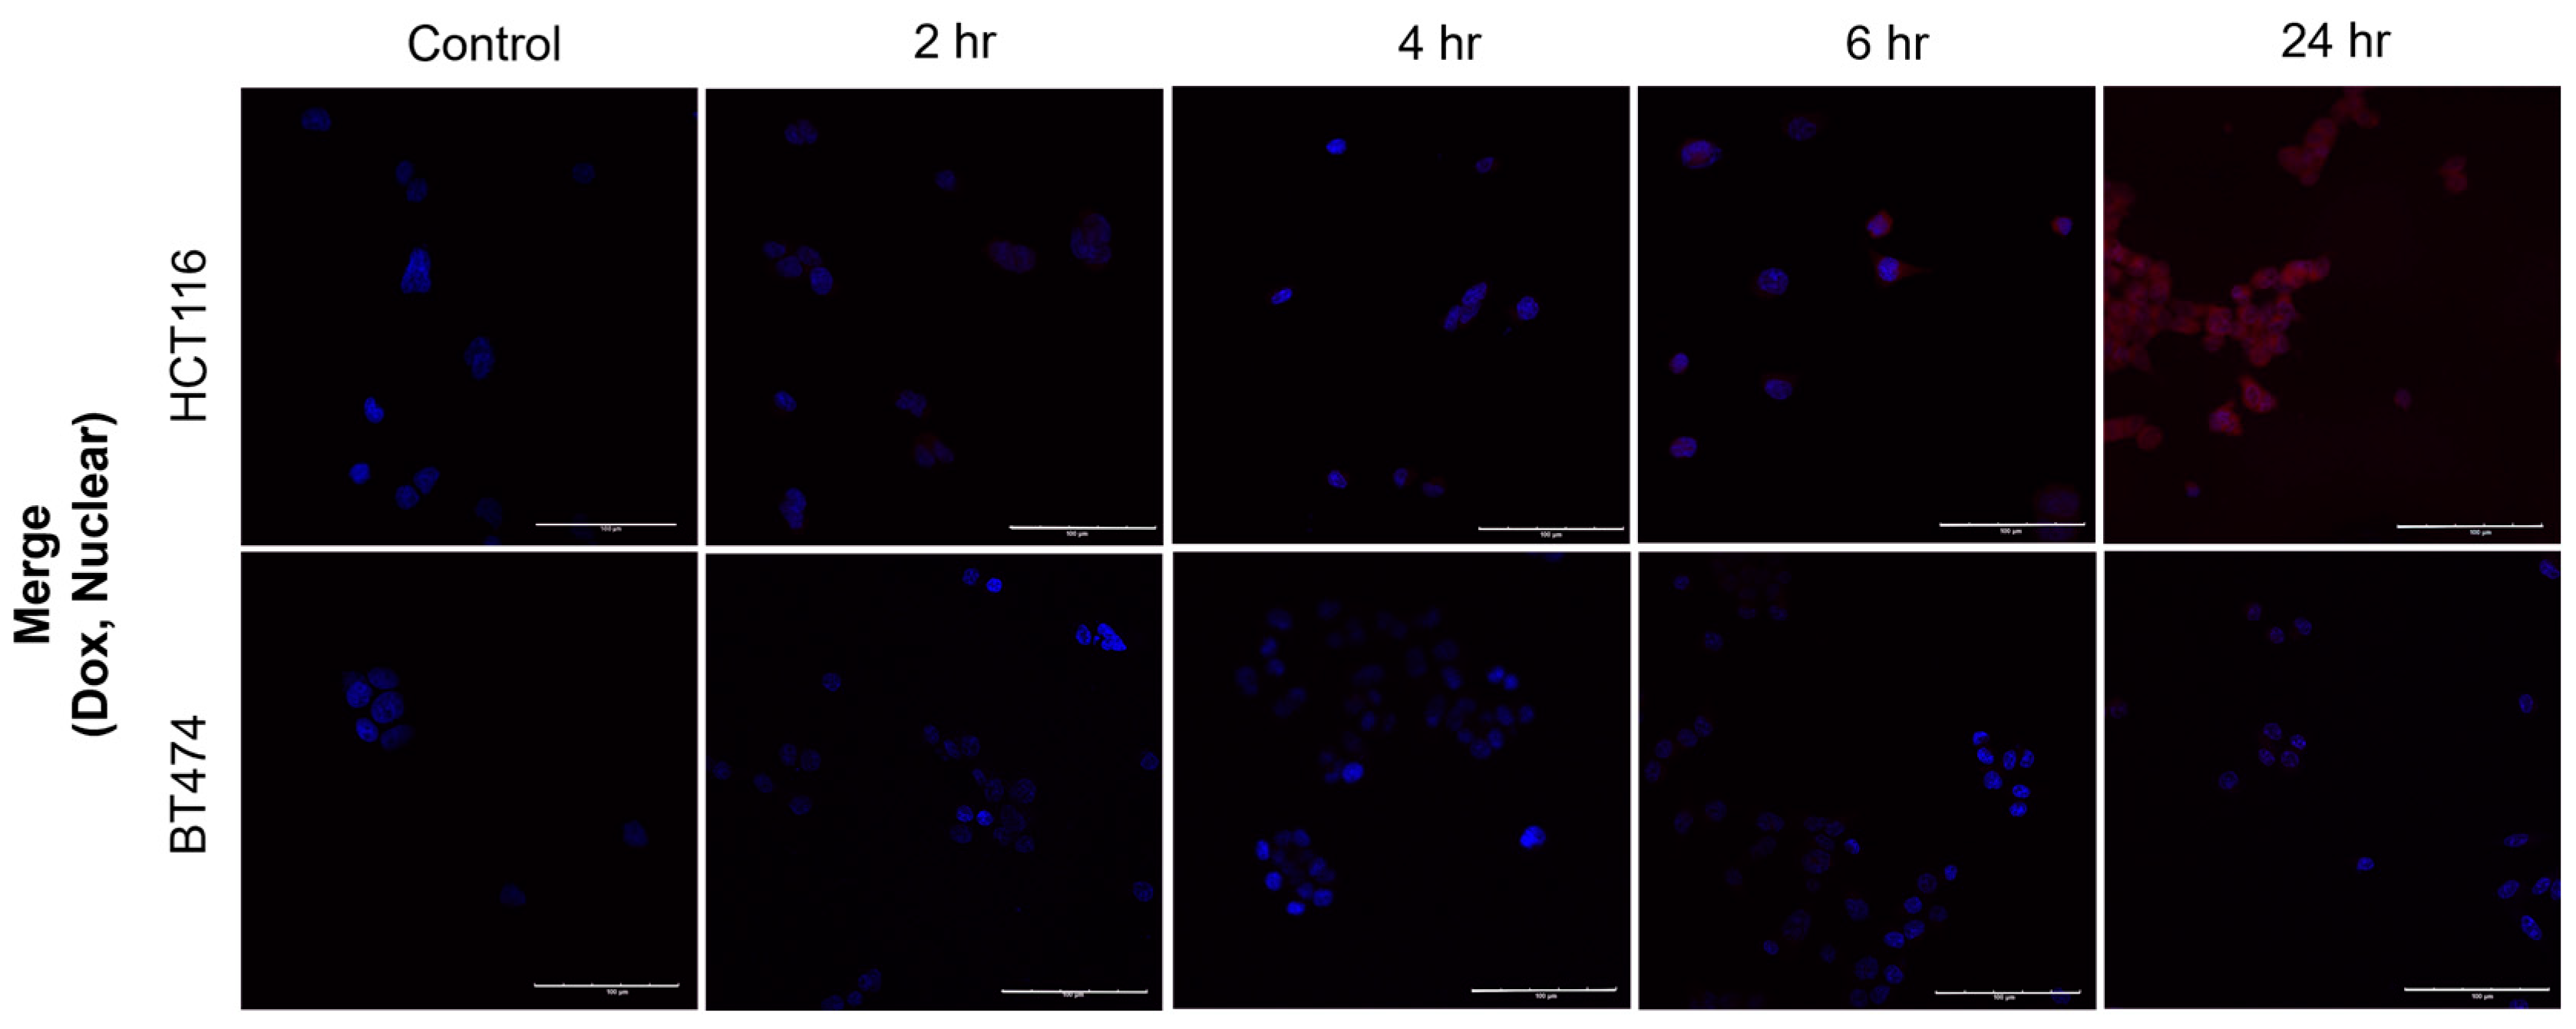
2.6. Evaluation of the Subcellular Distribution of Activated Dox After the Addition of Ns-Dox Using Confocal Laser Scanning Microscopy
2.7. Evaluation of Ns-Dox Cytotoxicity
3. Materials and Methods
3.1. Materials
3.2. Cell Line
3.3. Methods
3.3.1. Synthesis of the Prodrug
3.3.2. Assembly of Model DNA
3.3.3. Interaction with DNA
3.3.4. Evaluation of the GSH Response Activation of Ns-Dox in an In Vitro Non-Cellular System
3.3.5. Immunofluorescence Analysis by Laser Scanning Confocal Microscopy
3.3.6. Immunofluorescence Analysis by the Flow Cytometer
3.3.7. GSH/GSSG Assay
3.3.8. Quantitative Evaluation of Cellular Uptake of Ns-Dox and Activation of the GSH Response In Vitro
3.3.9. Evaluation of Subcellular Distribution of Ns-Dox by Confocal Microscopy
3.3.10. Evaluation of the Subcellular Distribution of Activated Dox After the Addition of Ns-Dox Using Confocal Laser Scanning Microscopy
4. Conclusions
Supplementary Materials
Author Contributions
Funding
Institutional Review Board Statement
Informed Consent Statement
Data Availability Statement
Acknowledgments
Conflicts of Interest
References
- Damiani, R.M.; Moura, D.J.; Viau, C.M.; Caceres, R.A.; Henriques, J.A.P.; Saffi, J. Pathways of Cardiac Toxicity: Comparison Between Chemotherapeutic Drugs Doxorubicin and Mitoxantrone. Arch. Toxicol. 2016, 90, 2063–2076. [Google Scholar] [CrossRef] [PubMed]
- Rixe, O.; Fojo, T. Is Cell Death a Critical End Point for Anticancer Therapies or Is Cytostasis Sufficient? Clin. Cancer Res. 2007, 13, 7280–7287. [Google Scholar] [CrossRef] [PubMed]
- Licata, S.; Saponiero, A.; Mordente, A.; Minotti, G. Doxorubicin Metabolism and Toxicity in Human Myocardium: Role of Cytoplasmic Deglycosidation and Carbonyl Reduction. Chem. Res. Toxicol. 2000, 13, 414–420. [Google Scholar] [CrossRef]
- Senapati, S.; Mahanta, A.K.; Kumar, S.; Maiti, P. Controlled Drug Delivery Vehicles for Cancer Treatment and Their Performance. Signal Transduct. Target. Ther. 2018, 3, 7. [Google Scholar] [CrossRef]
- Shah, K.N.; Ditto, A.J.; Crowder, D.C.; Overmeyer, J.H.; Tavana, H.; Maltese, W.A.; Yun, Y.H. Receptor-Mediated Attachment and Uptake of Hyaluronan Conjugates by Breast Cancer Cells. Mol. Pharm. 2017, 14, 3968–3977. [Google Scholar] [CrossRef] [PubMed]
- Kydd, J.; Jadia, R.; Velpurisiva, P.; Gad, A.; Paliwal, S.; Rai, P. Targeting Strategies for the Combination Treatment of Cancer Using Drug Delivery Systems. Pharmaceutics 2017, 9, 46. [Google Scholar] [CrossRef]
- Sun, J.-J.; Chen, Y.-C.; Huang, Y.-X.; Zhao, W.-C.; Liu, Y.-H.; Venkataramanan, R.; Lu, B.-F.; Li, S. Programmable Co-delivery of the Immune Checkpoint Inhibitor NLG919 and Chemotherapeutic Doxorubicin via a Redox-Responsive Immunostimulatory Polymeric Prodrug Carrier. Acta Pharmacol. Sin. 2017, 38, 823–834. [Google Scholar] [CrossRef]
- Rios De La Rosa, J.M.; Pingrajai, P.; Pelliccia, M.; Spadea, A.; Lallana, E.; Gennari, A.; Stratford, I.J.; Rocchia, W.; Tirella, A.; Tirelli, N. Binding and Internalization in Receptor-Targeted Carriers: The Complex Role of CD44 in the Uptake of Hyaluronic Acid-Based Nanoparticles (siRNA Delivery). Adv. Healthc. Mater. 2019, 8, e1901182. [Google Scholar] [CrossRef]
- Wu, G.; Fang, Y.-Z.; Yang, S.; Lupton, J.R.; Turner, N.D. Glutathione Metabolism and Its Implications for Health. J. Nutr. 2004, 134, 489–492. [Google Scholar] [CrossRef]
- Pastore, A.; Federici, G.; Bertini, E.; Piemonte, F. Analysis of Glutathione: Implication in Redox and Detoxification. Clin. Chim. Acta 2003, 333, 19–39. [Google Scholar] [CrossRef]
- Gamcsik, M.P.; Kasibhatla, M.S.; Teeter, S.D.; Colvin, O.M. Glutathione Levels in Human Tumors. Biomarkers 2012, 17, 671–691. [Google Scholar] [CrossRef]
- Kennedy, L.; Sandhu, J.K.; Harper, M.-E.; Cuperlovic-Culf, M. Role of Glutathione in Cancer: From Mechanisms to Therapies. Biomolecules 2020, 10, 1429. [Google Scholar] [CrossRef]
- Bridges, R.J.; Natale, N.R.; Patel, S.A. System xc− Cystine/Glutamate Antiporter: An Update on Molecular Pharmacology and Roles Within the CNS. Br. J. Pharmacol. 2012, 165, 20–34. [Google Scholar] [CrossRef] [PubMed]
- Liu, M.-R.; Zhu, W.-T.; Pei, D.-S. System Xc−: A Key Regulatory Target of Ferroptosis in Cancer. Investig. New Drugs 2021, 39, 1123–1131. [Google Scholar] [CrossRef]
- Seishima, R.; Okabayashi, K.; Nagano, O.; Hasegawa, H.; Tsuruta, M.; Shimoda, M.; Kameyama, K.; Saya, H.; Kitagawa, Y. Sulfasalazine, a Therapeutic Agent for Ulcerative Colitis, Inhibits the Growth of CD44v9+ Cancer Stem Cells in Ulcerative Colitis-Related Cancer. Clin. Res. Hepatol. Gastroenterol. 2016, 40, 487–493. [Google Scholar] [CrossRef] [PubMed]
- Nagano, O.; Okazaki, S.; Saya, H. Redox Regulation in Stem-Like Cancer Cells by CD44 Variant Isoforms. Oncogene 2013, 32, 5191–5198. [Google Scholar] [CrossRef] [PubMed]
- Kodama, H.; Murata, S.; Ishida, M.; Yamamoto, H.; Yamaguchi, T.; Kaida, S.; Miyake, T.; Takebayashi, K.; Kushima, R.; Tani, M. Prognostic Impact of CD44-Positive Cancer Stem-Like Cells at the Invasive Front of Gastric Cancer. Br. J. Cancer 2017, 116, 186–194. [Google Scholar] [CrossRef]
- Ishimoto, T.; Nagano, O.; Yae, T.; Tamada, M.; Motohara, T.; Oshima, H.; Oshima, M.; Ikeda, T.; Asaba, R.; Yagi, H.; et al. CD44 Variant Regulates Redox Status in Cancer Cells by Stabilizing the xCT Subunit of System Xc- and Thereby Promotes Tumor Growth. Cancer Cell 2011, 19, 387–400. [Google Scholar] [CrossRef]
- Bao, Y.; Guo, Y.; Zhuang, X.; Li, D.; Cheng, B.; Tan, S.; Zhang, Z. D-α-Tocopherol Polyethylene Glycol Succinate-Based Redox-Sensitive Paclitaxel Prodrug for Overcoming Multidrug Resistance in Cancer Cells. Mol. Pharm. 2014, 11, 3196–3209. [Google Scholar] [CrossRef]
- Tian, B.; Xu, H.; Wang, H.; Li, K.; Zheng, S.; Hu, S.; Wang, Y.; Lv, Q. GSH-Responsive Prodrug Nanoassembly as a Carrier-Free Nanoplatform for Tumor-Targeting Delivery and Chemo-photothermal Therapy. Mol. Pharm. 2023, 20, 4210–4218. [Google Scholar] [CrossRef]
- Yin, T.; Wang, Y.; Chu, X.; Fu, Y.; Wang, L.; Zhou, J.; Tang, X.; Liu, J.; Huo, M. Free Adriamycin-Loaded pH/Reduction Dual-Responsive Hyaluronic Acid–Adriamycin Prodrug Micelles for Efficient Cancer Therapy. ACS Appl. Mater. Interfaces 2018, 10, 35693–35704. [Google Scholar] [CrossRef] [PubMed]
- Zhang, H.; Li, L.; Li, W.; Yin, H.; Wang, H.; Ke, X. Endosomal pH, Redox Dual-Sensitive Prodrug Micelles Based on Hyaluronic Acid for Intracellular Camptothecin Delivery and Active Tumor Targeting in Cancer Therapy. Pharmaceutics 2024, 16, 1327. [Google Scholar] [CrossRef] [PubMed]
- Wei, M.; Yin, P.; Shen, Y.; Zhang, L.; Deng, J.; Xue, S.; Li, H.; Guo, B.; Zhang, Y.; Yao, S. A New Turn-On Fluorescent Probe for Selective Detection of Glutathione and Cysteine in Living Cells. Chem. Commun. 2013, 49, 4640–4642. [Google Scholar] [CrossRef]
- Shibata, A.; Furukawa, K.; Abe, H.; Tsuneda, S.; Ito, Y. Rhodamine-Based Fluorogenic Probe for Imaging Biological Thiol. Bioorg. Med. Chem. Lett. 2008, 18, 2246–2249. [Google Scholar] [CrossRef]
- Huang, C.H.; Takemoto, H.; Nomoto, T.; Tomoda, K.; Matsui, M.; Nishiyama, N. Utility of the 2-Nitrobenzenesulfonamide Group as a Chemical Linker for Enhanced Extracellular Stability and Cytosolic Cleavage in siRNA-Conjugated Polymer Systems. ChemMedChem 2017, 12, 19–22. [Google Scholar] [CrossRef]
- Fukuyama, T.; Cheung, M.; Jow, C.-K.; Hidai, Y.; Kan, T. 2,4-Dinitrobenzenesulfonamides: A Simple and Practical Method for the Preparation of a Variety of Secondary Amines and Diamines. Tetrahedron Lett. 1997, 38, 5831–5834. [Google Scholar] [CrossRef]
- Bowman, A.L.; Ridder, L.; Rietjens, I.M.C.M.; Vervoort, J.; Mulholland, A.J. Molecular Determinants of Xenobiotic Metabolism: QM/MM Simulation of the Conversion of 1-Chloro-2,4-Dinitrobenzene Catalyzed by M1-1 Glutathione S-Transferase. Biochemistry 2007, 46, 6353–6363. [Google Scholar] [CrossRef]
- Morgenstern, R.; Svensson, R.; Bernat, B.A.; Armstrong, R.N. Kinetic Analysis of the Slow Ionization of Glutathione by Microsomal Glutathione Transferase MGST1. Biochemistry 2001, 40, 3378–3384. [Google Scholar] [CrossRef]
- Sinha, B.K.; Mimnaugh, E.G. Free Radicals and Anticancer Drug Resistance: Oxygen Free Radicals in the Mechanisms of Drug Cytotoxicity and Resistance by Certain Tumors. Free Radic. Biol. Med. 1990, 8, 567–581. [Google Scholar] [CrossRef]
- Agudelo, D.; Bourassa, P.; Bérubé, G.; Tajmir-Riahi, H.-A. Intercalation of Antitumor Drug Doxorubicin and Its Analogue by DNA Duplex: Structural Features and Biological Implications. Int. J. Biol. Macromol. 2014, 66, 144–150. [Google Scholar] [CrossRef]
- Řeha, D.; Kabeláč, M.; Ryjáček, F.; Šponer, J.; Šponer, J.E.; Elstner, M.; Suhai, S.; Hobza, P. Intercalators. 1. Nature of Stacking Interactions Between Intercalators (Ethidium, Daunomycin, Ellipticine, and 4′,6-Diaminide-2-Phenylindole) and DNA Base Pairs. J. Am. Chem. Soc. 2002, 124, 3366–3376. [Google Scholar] [CrossRef] [PubMed]
- Lee, H.M.; Kim, D.H.; Lee, H.L.; Cha, B.; Kang, D.H.; Jeong, Y.-I. Synergistic Effect of Buthionine Sulfoximine on the Chlorin E6-Based Photodynamic Treatment of Cancer Cells. Arch. Pharm. Res. 2019, 42, 990–999. [Google Scholar] [CrossRef] [PubMed]
- Sheikh, B.Y.; Sarker, M.M.R.; Kamarudin, M.N.A.; Mohan, G. Antiproliferative and Apoptosis Inducing Effects of Citral via P53 and ROS-Induced Mitochondrial-Mediated Apoptosis in Human Colorectal HCT116 and HT29 Cell Lines. Biomed. Pharmacother. 2017, 96, 834–846. [Google Scholar] [CrossRef]
- Ciesielska, S.; Bil, P.; Gajda, K.; Poterala-Hejmo, A.; Hudy, D.; Rzeszowska-Wolny, J. Cell Type-Specific Differences in Redox Regulation and Proliferation After Low UVA Doses. PLoS ONE 2019, 14, e0205215. [Google Scholar] [CrossRef]
- Noh, G.J.; Oh, K.T.; Youn, Y.S.; Lee, E.S. Cyclic RGD-Conjugated Hyaluronate Dot Bearing Cleavable Doxorubicin for Multivalent Tumor Targeting. Biomacromolecules 2020, 21, 2525–2535. [Google Scholar] [CrossRef]
- Sun, H.; Cui, J.; Ju, Y.; Chen, X.; Wong, E.H.H.; Tran, J.; Qiao, G.G.; Caruso, F. Tuning the Properties of Polymer Capsules for Cellular Interactions. Bioconjug. Chem. 2017, 28, 1859–1866. [Google Scholar] [CrossRef] [PubMed]
- Jin, J.; Krishnamachary, B.; Mironchik, Y.; Kobayashi, H.; Bhujwalla, Z.M. Phototheranostics of CD44-Positive Cell Populations in Triple Negative Breast Cancer. Sci. Rep. 2016, 6, 27871. [Google Scholar] [CrossRef]
- Frederick, C.A.; Williams, L.D.; Ughetto, G.; van der Marel, G.A.; van Boom, J.H.; Rich, A.; Wang, A.H. Structural Comparison of Anticancer Drug-DNA Complexes: Adriamycin and Daunomycin. Biochemistry 1990, 29, 2538–2549. [Google Scholar] [CrossRef]
- Nagano, O.; Saya, H. Mechanism and Biological Significance of CD44 Cleavage. Cancer Sci. 2004, 95, 930–935. [Google Scholar] [CrossRef]
- Ren, J.; Jenkins, T.C.; Chaires, J.B. Energetics of DNA Intercalation Reactions. Biochemistry 2000, 39, 8439–8447. [Google Scholar] [CrossRef]
- Durmus, S.; Naik, J.; Buil, L.; Wagenaar, E.; Van Tellingen, O.; Schinkel, A.H. In Vivo Disposition of Doxorubicin Is Affected by Mouse Oatp1a/1b and Human OATP1A/1B Transporters. Int. J. Cancer 2014, 135, 1700–1710. [Google Scholar] [CrossRef] [PubMed]
- Lee, H.H.; Leake, B.F.; Kim, R.B.; Ho, R.H. Contribution of Organic Anion-Transporting Polypeptides 1A/1B to Doxorubicin Uptake and Clearance. Mol. Pharmacol. 2017, 91, 14–24. [Google Scholar] [CrossRef] [PubMed]
- Okazaki, S.; Umene, K.; Yamasaki, J.; Suina, K.; Otsuki, Y.; Yoshikawa, M.; Minami, Y.; Masuko, T.; Kawaguchi, S.; Nakayama, H.; et al. Glutaminolysis-Related Genes Determine Sensitivity to xCT-Targeted Therapy in Head and Neck Squamous Cell Carcinoma. Cancer Sci. 2019, 110, 3453–3463. [Google Scholar] [CrossRef] [PubMed]
- Kang, H.H.; Rho, H.S.; Kim, D.H.; Oh, S.-G. Metal Oxide in Aqueous Organic Solution Promoted Chemoselective N-Sulfonylation of Hydrophilic Amino Alcohols. Tetrahedron Lett. 2003, 44, 7225–7227. [Google Scholar] [CrossRef]


| Ns-Dox…DNA | Dox…DNA | |
|---|---|---|
| 1.0 × 10⁵ | 1.6 × 10⁶ | Ka (M−1) |
| −10.0 | −35.5 | ΔH (kJ/mol) |
| 15.5 | −0.211 | TΔS (kJ/mol) |
| −28.5 | −35.4 | ΔG (kJ/mol) |
Disclaimer/Publisher’s Note: The statements, opinions and data contained in all publications are solely those of the individual author(s) and contributor(s) and not of MDPI and/or the editor(s). MDPI and/or the editor(s) disclaim responsibility for any injury to people or property resulting from any ideas, methods, instructions or products referred to in the content. |
© 2025 by the authors. Licensee MDPI, Basel, Switzerland. This article is an open access article distributed under the terms and conditions of the Creative Commons Attribution (CC BY) license (https://creativecommons.org/licenses/by/4.0/).
Share and Cite
Yukimura, T.; Seki, T.; Seki, T. Preparation and Characterization of a Glutathione-Responsive Doxorubicin Prodrug Modified by 2-Nitrobenzenesulfonamide Group—Its Selective Cytotoxicity Toward Cells with Enhanced Glutathione Production. Int. J. Mol. Sci. 2025, 26, 4128. https://doi.org/10.3390/ijms26094128
Yukimura T, Seki T, Seki T. Preparation and Characterization of a Glutathione-Responsive Doxorubicin Prodrug Modified by 2-Nitrobenzenesulfonamide Group—Its Selective Cytotoxicity Toward Cells with Enhanced Glutathione Production. International Journal of Molecular Sciences. 2025; 26(9):4128. https://doi.org/10.3390/ijms26094128
Chicago/Turabian StyleYukimura, Tomona, Tomohiro Seki, and Toshinobu Seki. 2025. "Preparation and Characterization of a Glutathione-Responsive Doxorubicin Prodrug Modified by 2-Nitrobenzenesulfonamide Group—Its Selective Cytotoxicity Toward Cells with Enhanced Glutathione Production" International Journal of Molecular Sciences 26, no. 9: 4128. https://doi.org/10.3390/ijms26094128
APA StyleYukimura, T., Seki, T., & Seki, T. (2025). Preparation and Characterization of a Glutathione-Responsive Doxorubicin Prodrug Modified by 2-Nitrobenzenesulfonamide Group—Its Selective Cytotoxicity Toward Cells with Enhanced Glutathione Production. International Journal of Molecular Sciences, 26(9), 4128. https://doi.org/10.3390/ijms26094128